1. Introduction
The cell is the smallest functional unit of the mammalian body. They directly affect all of the body’s activities, including movement, transmitting information, metabolism, storing nutrients, etc. Eukaryotic cells are comprised of subcellular organelles, encompass the nucleus and different polymeric filaments, and are surrounded by membrane [
1]. From the perspective of mechanical behavior, the membrane, cytoskeleton, and nucleus are the most important subcellular organelles in mammalian cells. The cytoskeleton is a complex structure consisting of actin filaments, intermediate filaments, and microtubules. This structure is responsible for the cell shape, structural stability, and function [
2].
Cells and their organelles are continuously exposed to a mechanical environment. Due to the mechanotransduction effects, the changes in applied mechanical loads affect biochemical signals. These signal changes can cause disorder in tissue functions. A better understanding of the behavior of subcellular organelles can help us to find the potential sources of disease and develop methods to deal with them. Cell mechanics can be studied by experimental, theoretical, and numerical methods, and can be divided into two major branches: mechanotransduction and cellular structure. Thus, it is necessary to select a suitable cellular structure as the first step in a numerical study of living cells’ mechanical behavior.
A number of mechanical structures for cell modeling have been introduced in recent years. Some of these use a continuum-based approach and others are based on microstructural models [
3]. However, to consider the mechanical behavior of subcellular organelles, one should utilize models consisting of both continuum and structural elements. McGarry and Prendergast [
4] have suggested a combined model including 6-strut tensegrity (as the cytoskeleton), the membrane, nucleus, and cytoplasm. This model has been used by other researchers to investigate cellular functions. Prendergast [
5] used this model to show the connection between tissue mechanosensation and cellular stimuli. De Santis et al. [
6] studied how the cell senses the substrate’s stiffness using the same model. Chen et al. [
7] only considered the tensegrity structure and tried to show the effect of the complexity of structure on force distribution and energy dynamics while the cell is spreading. They demonstrated that 12-strut tensegrity provides superior results by comparing the force distribution, stored energy, and spreading area. Kardas et al. [
8] proposed a more complicated model than the McGarry model [
4]. They used a tensegrity structure for the nucleus and changed the cytoskeleton structure by adding centrosome and intermediate filaments to their model. They used this model to simulate a single osteocyte in the lacuna. Barreto et al. [
9] adapted Kardas’s model to obtain a mechanical model for a single endothelial cell, which simulated actins in cortex and used a star pattern for modeling microtubules. In this model, subcellular elements were able to move independently, however, the number of focal adhesions were chosen arbitrarily.
One cannot expect to simulate the mechanical behavior of all types of cells with a unique model, and no model can accommodate all experiment data. Nevertheless, it is expected that developing a model for as many subcellular organelles as possible could help in the consideration of other types of living cells.
The aim of this study was to use a combined mechanical model consisting of more subcellular elements than previous models and investigate how these components affect cell’s mechanical behavior. The main limitations and assumptions of the study were: only the linear elastic behavior of the cell was modeled and small indentations were applied during the course of the simulation to guarantee linear elastic behavior. A mechanical model including the cytoskeleton (CSK), nucleoskeleton (NSK), membrane, nuclear envelope (NE), and cytosol has been presented. Two tensegrity models of different sizes were used to simulate the CSK and NSK. An external load on a cell was simulated by atomic force microscopy (AFM), which applied the load on top of the cell. AFM is mostly used to measure the mechanical properties of living matters like cells, including their elastic and viscoelastic properties and it can also be used to map the cell’s shape. In this method, a conical tip moves along the cell’s surface, and the cell’s shape is obtained by measuring the cantilever deflection. Several theoretical and numerical models have been applied to this method to determine a variety of physical characteristics. [
10]. AFM is able to obtain excellent eukaryotic cell images as it is able to generate images with a resolution in the 100 nm range. This technique is entirely compatible with the models used for the measurement of linear and nonlinear materials properties [
11].
In this model, the cell was attached to a substrate to mimic an adherent cell and the mechanical behavior of subcellular organelles was evaluated. The contribution of each subcellular organelle to the cell’s mechanical response to external stimuli was analyzed.
2. Method
2.1. Geometry and Materials Properties
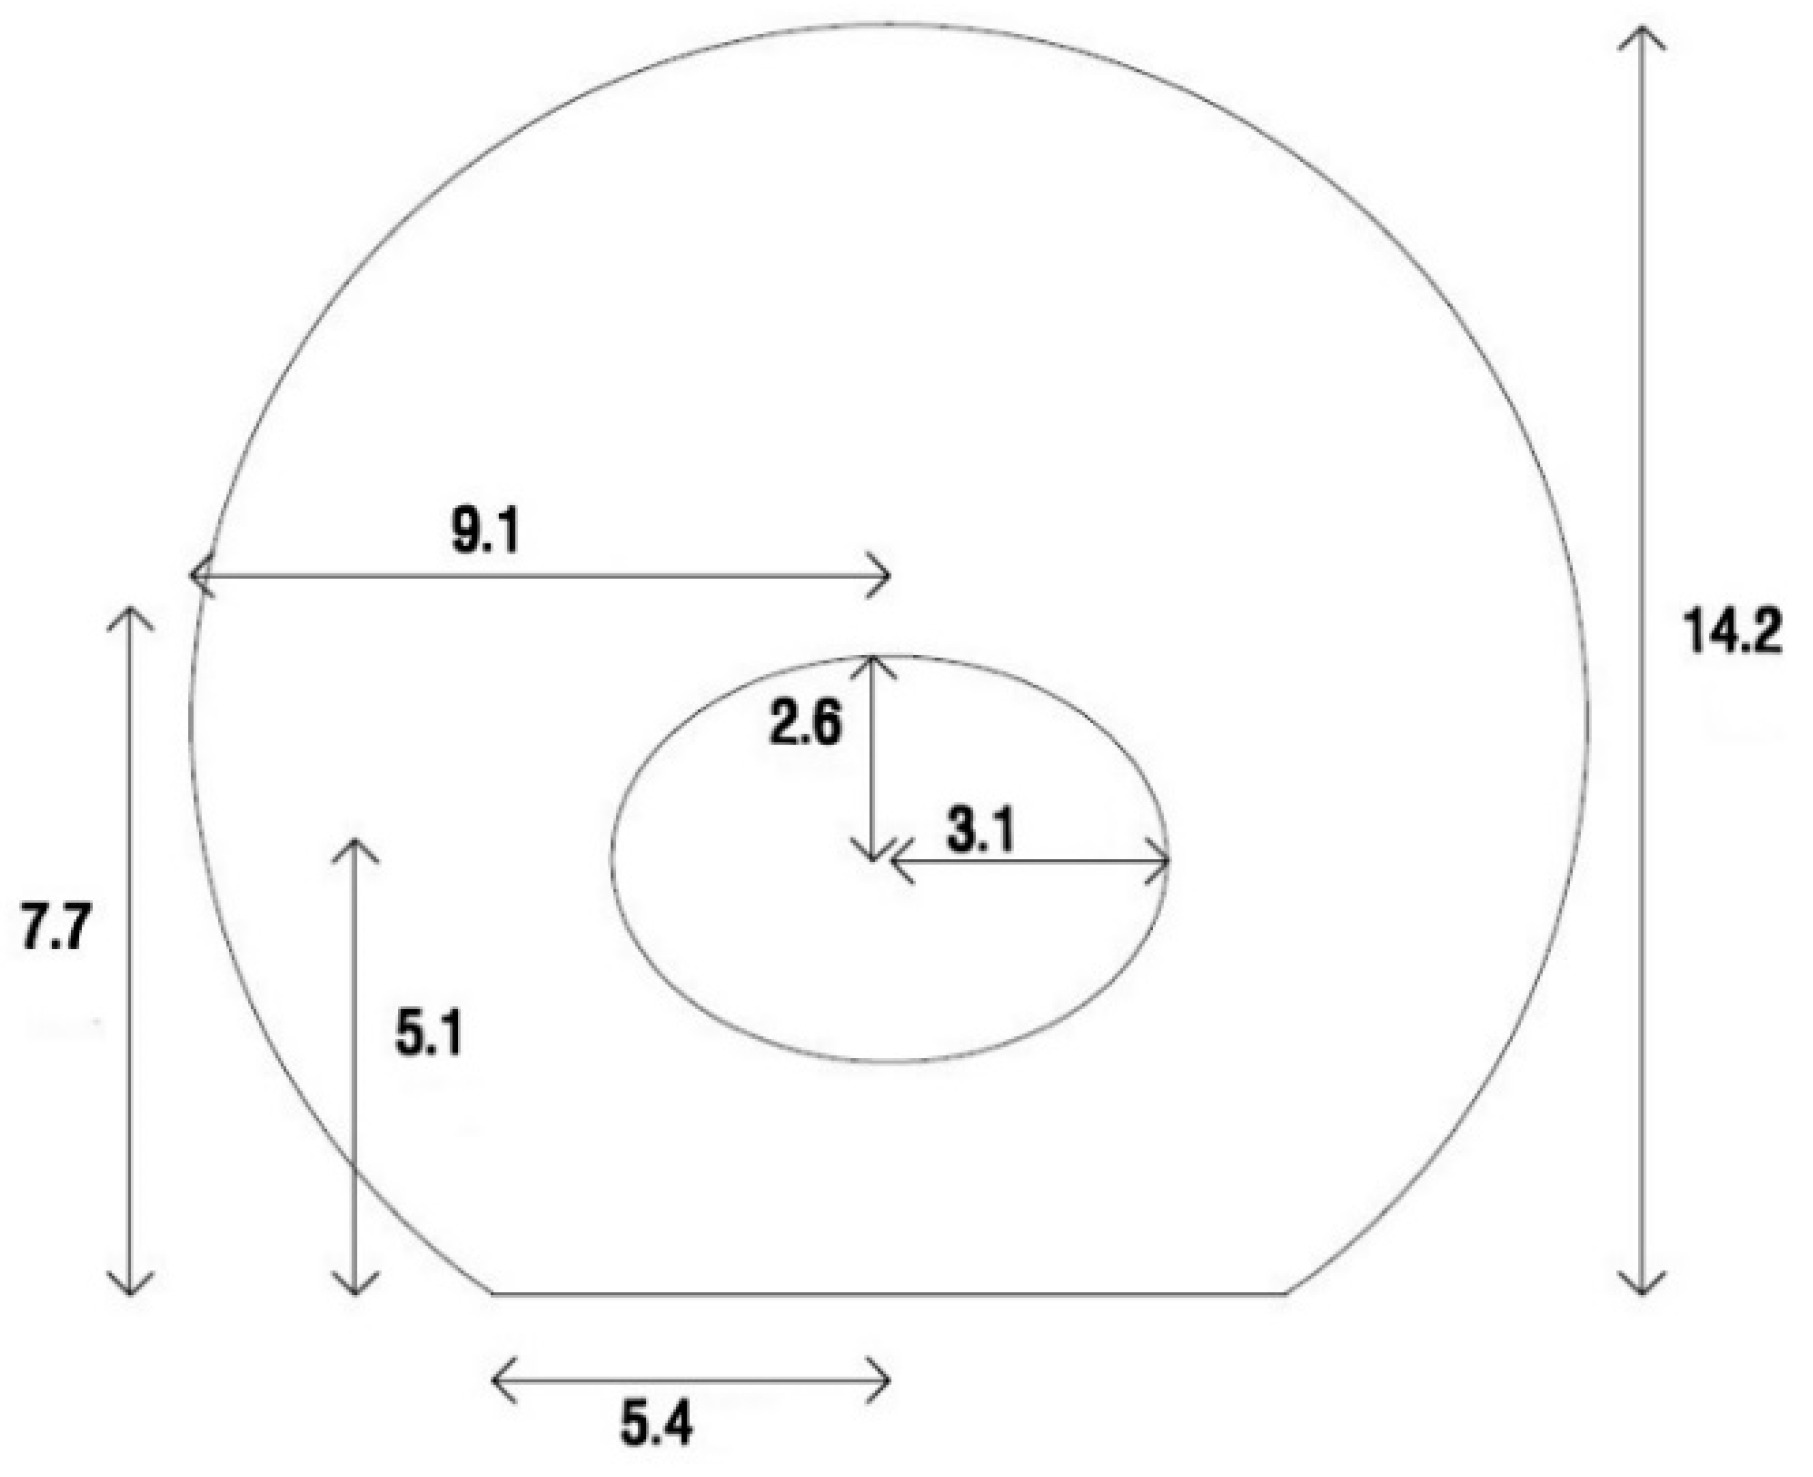
In this study, a cell attached to the elastic substrate was modeled. For this purpose, the geometry of the adherent cell is needed. As reported by Thoumine and Frich [
12], the dimensions of the fibroblast cell were recorded 5 min after the cell was attached to the substrate. The dimensions and geometry of the cell are shown in
Figure 1.
The cytoplasm was modeled as a sphere cut by a plane at its bottom to simulate the adherent cell geometry. An elliptical hole was created inside the cytoplasm to define the nucleus position. As shown in
Figure 1, the ellipsoid center was located 5.1 μm above the bottom of the cell. A 3D axisymmetric shell was utilized to model the membrane. Two different layers cover animal cells. The thinner plasma membrane is known as a phospholipid bilayer, and the thicker actin-gel layer is called the actin cortex. In this study, a single shell as the membrane was tangential to the cytoplasm’s outer surface with a thickness of 0.2 μm to represent the two abovementioned layers [
13]. Similar to the membrane, the NE was modeled by the shell elements. The NE was tangential to the surface of the elliptical hole. The length of the large and small diameters of the NE were chosen to be 6.2 μm and 5.2 μm, respectively. The thickness of the NE was set to 40 nm [
14].
The tensegrity structure was used here to model the CSK and NSK. Tensegrity is a structure that is capable of providing structural stability on any scale; thus, it is well suited to model the structure of the CSK. Studies indicate [
15] that this structure can model the experimental data for measuring the Young modulus. A nonlinear increase in cell stiffness under AFM load was also modeled by tensegrity [
16,
17,
18].
Spherical tensegrity is a type of tensegrity structure where all vertexes are located on a sphere. It has been shown [
19] that all vertexes of any spherical tensegrity are coincident with the vertexes of a polyhedron. For example, the vertexes of a 6-strut spherical tensegrity are the vertexes of a regular icosahedron. Tensegrity has been successful in modeling cell’s mechanical behavior with regard to a few compressive and tensile elements. The tension cables were included as the elements that provide stability. In the case of the CSK, the cables simulate the behavior of actin. On the other hand, compressive struts, which reach equilibrium with tensile forces generated on the cables were used to mimic microtubules [
20].
Ingber [
21] suggested the tensegrity structure for investigating the NSK in 1993. Even though the nucleus has its own actin and myosin, it is not clear whether nuclear activity causes tension in these fibers or not. The alteration in the shape of the nucleus has been investigated in cell spreading studies [
22,
23]. Usually, the deformed nucleus retracts rapidly after the external load is removed. [
24]. In NSK, chromatin is constructed by tightly wound coils of DNA that have sufficient stiffness to resist compression [
25]. The geodesic nuclear lamina has been described as a prestress lattice [
26]. Thus, one may use tensegrity to simulate nuclear stability.
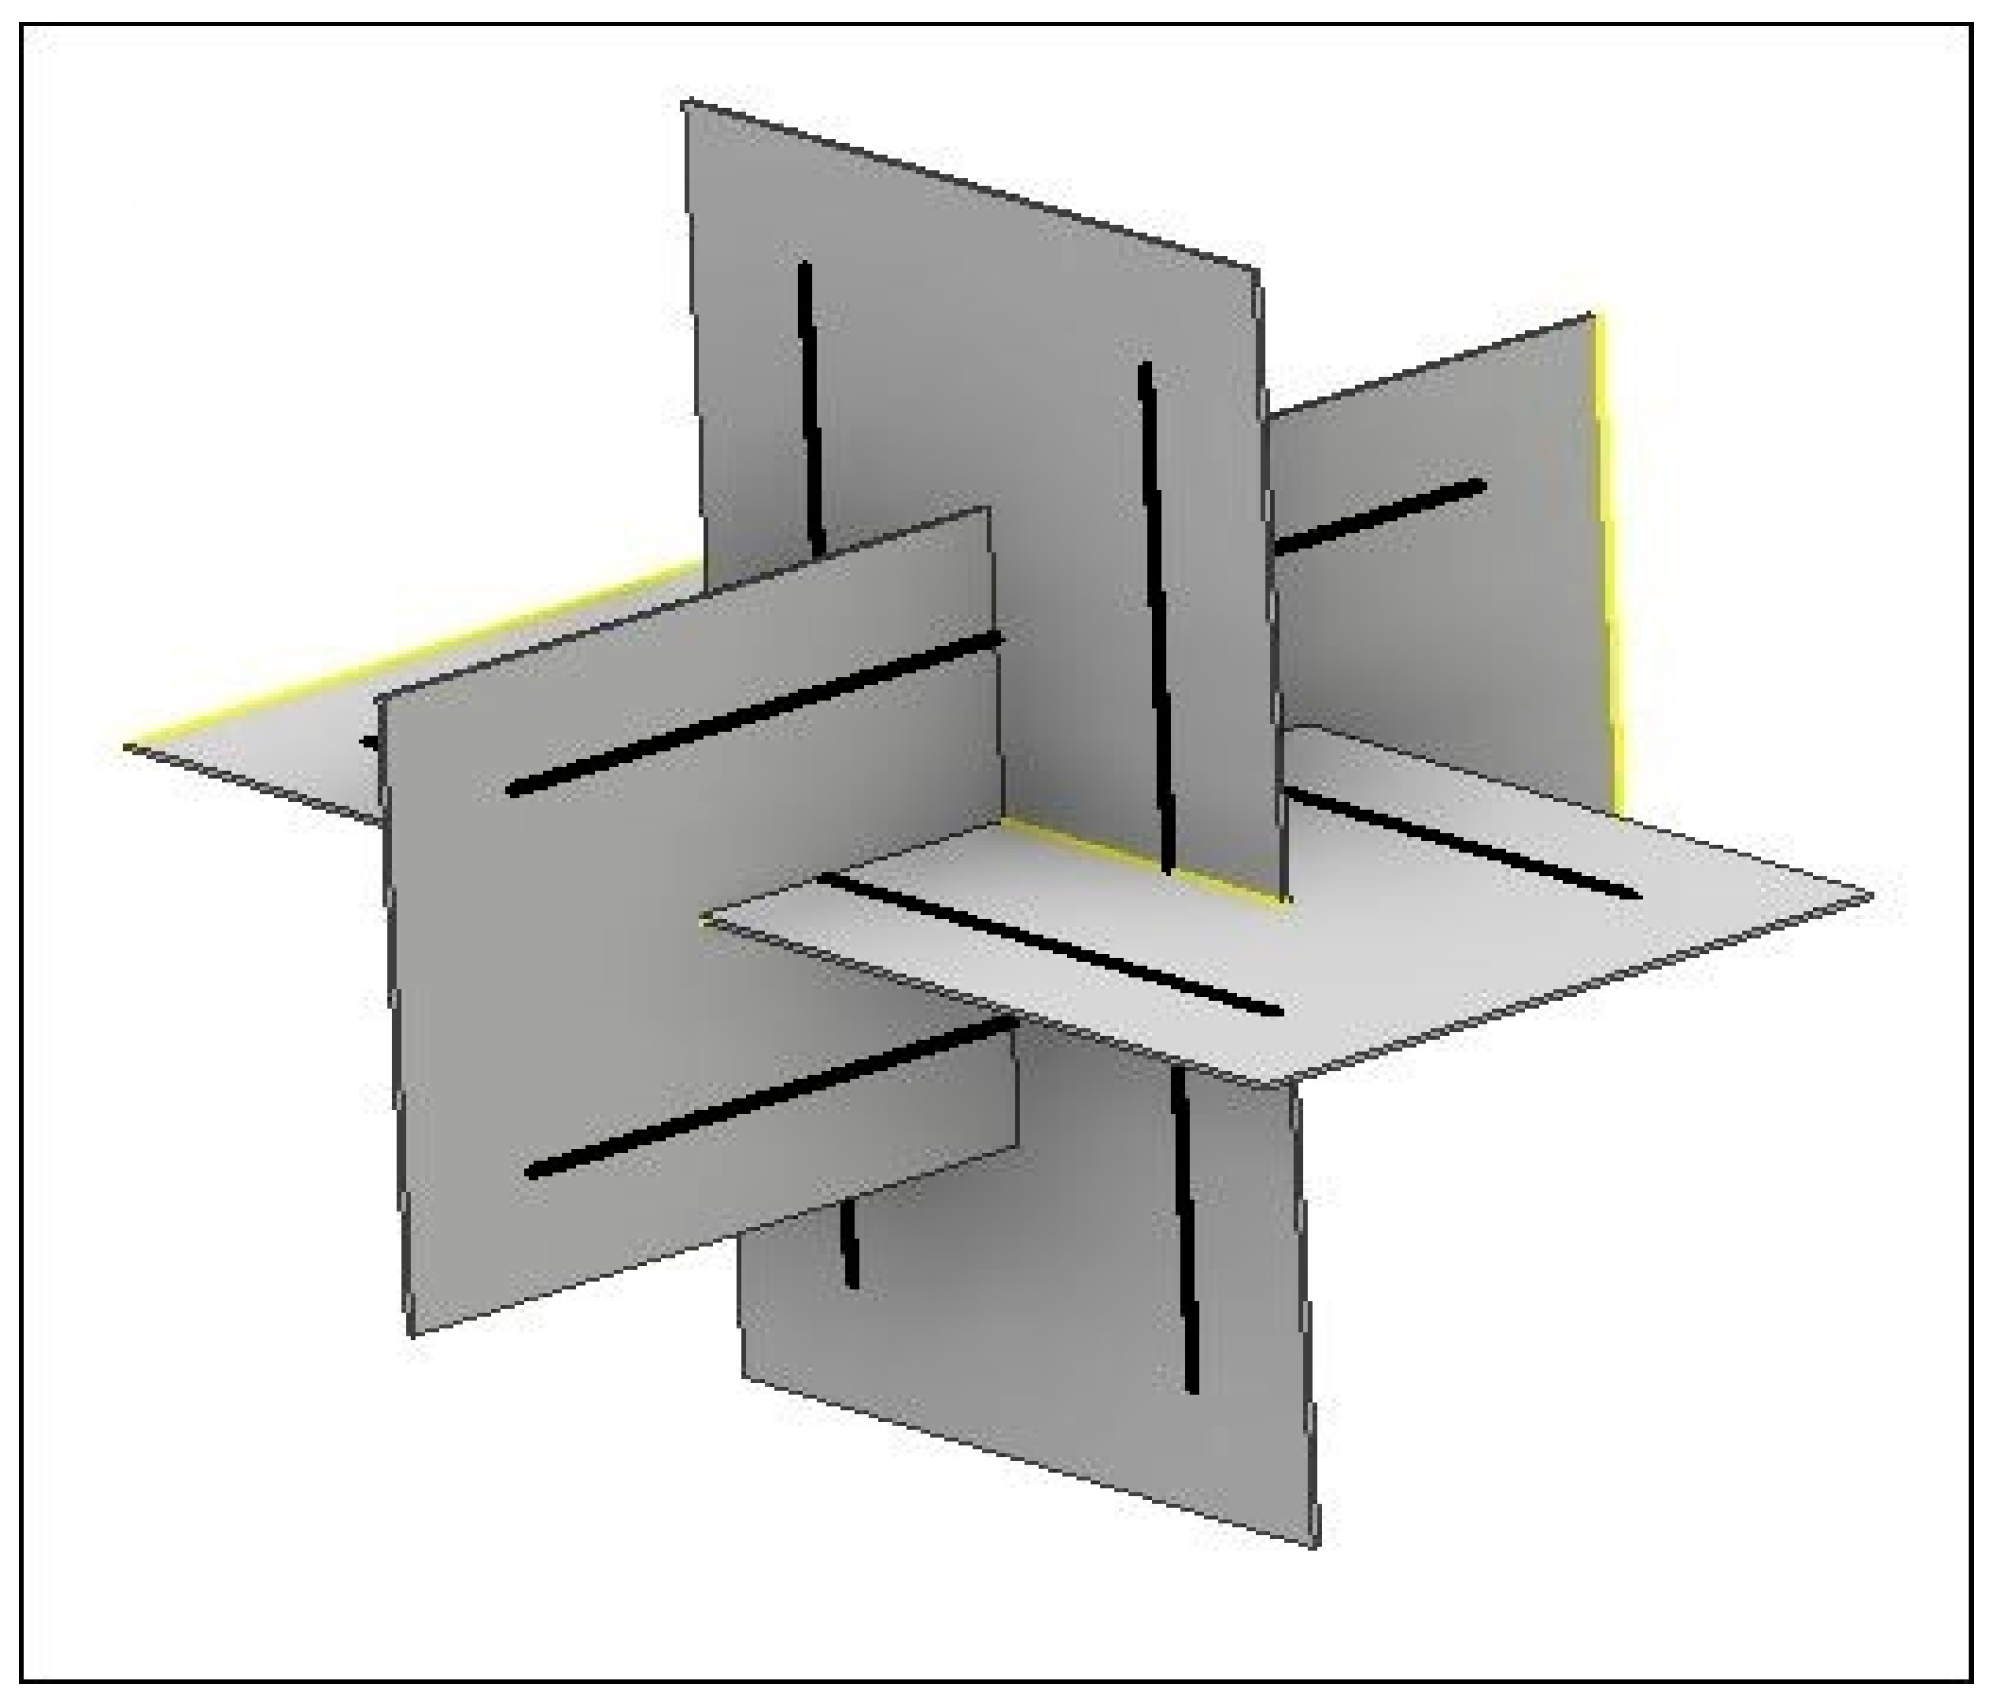
In this study, CSK and NSK were modeled by using a 12-strut tensegrity. Since these two structures are different sizes, CSK was surrounded by a sphere with the same radius as the cytoplasm, but the NSK was surrounded by a smaller sphere with a radius equal to the diameter of the nucleus. Any tensegrity structure may be constructed using several hypothetical planes passing through the center of the sphere [
19]. The struts are located in these planes. For example, for the 6-strut tensegrity model, each pair of struts are located in a plane, and three planes are needed to create a structure (
Figure 2).
Both ends of the strut are located on the surface of the sphere. Chen et al. [
7] modeled struts with a length of 12 μm for simulating 12-strut tensegrity. In this research, we utilized bars with a length of 11.7 μm in order to provide a better connection between the membrane and CSK.
The substrate was modeled as an elastic solid disc. The diameter of this disc was 30 μm and the thickness was 5 μm.
All cell components were defined as homogenous and isotropic elastic. Their material properties and dimensions are shown in
Table 1.
The crucial factor in providing tensegrity stability is the pre-stress generated in the structure’s elements. This pre-stress is generated by applying a 24% strain to the cable elements of tensegrity. Barreto proposed an 82 KPa initial tension value in order to define the pre-stress in the cables. It is evident that applying pre-tension on the cables results in compression in the struts, and 12.4 KPa pre-compression was defined on the struts, according to previous research [
9].
Cells can be classified into three categories according to their environment and condition.
Suspended cells like erythrocytes. In this case, there is no tight link between the cell and environment, thus tensegrity is not an appropriate model to describe their mechanical behavior.
Cells in a biological position, e.g., osteocytes in the lacuna. Kardas [
8] developed a mechanical model of the osteocyte in lacuna using tensegrity.
Adherent cells. Most models presented use simulated adherent conditions. In this study, tensegrity was used to simulate an adherent cell.
Atomic force microscopy (AFM) is a high-precision technique that is used to probe the mechanical properties of living matter like cells [
27]. A microscopic probe indents the cell and the force and associated deflection are measured. The mechanical properties and adhesion force of cells on the surface of biomaterials are the two most computable characteristics of the cells that can be extracted by the AFM technique [
28,
29].
Dimitriadis et al. [
30] concluded that AFM test results were more accurate when a microsphere with a diameter between 2 and 5 μm was used. Based on these results, a rigid semi-sphere with a 4.5 μm diameter shell was used to simulate the AFM bead.
2.2. Meshing
Abaqus CAE 6.14 was used to create and solve the model. The membrane and NE were modeled as shells and meshed by 4-node shell elements (S4R), and for the cytoplasm, the C3D8R element type was chosen. Since every cable and strut is meshed by a single truss element, mesh convergence was only necessary for the cytoplasm. After meshing the cytoplasm, the membrane and NE could be merged to the cytoplasm to determine the size of the element. After doing the convergence processing, 69,999 solid elements were chosen for the cytoplasm. After merging the membrane and NE to the cytoplasm, 4870 and 636 elements were assigned to these two parts, respectively.
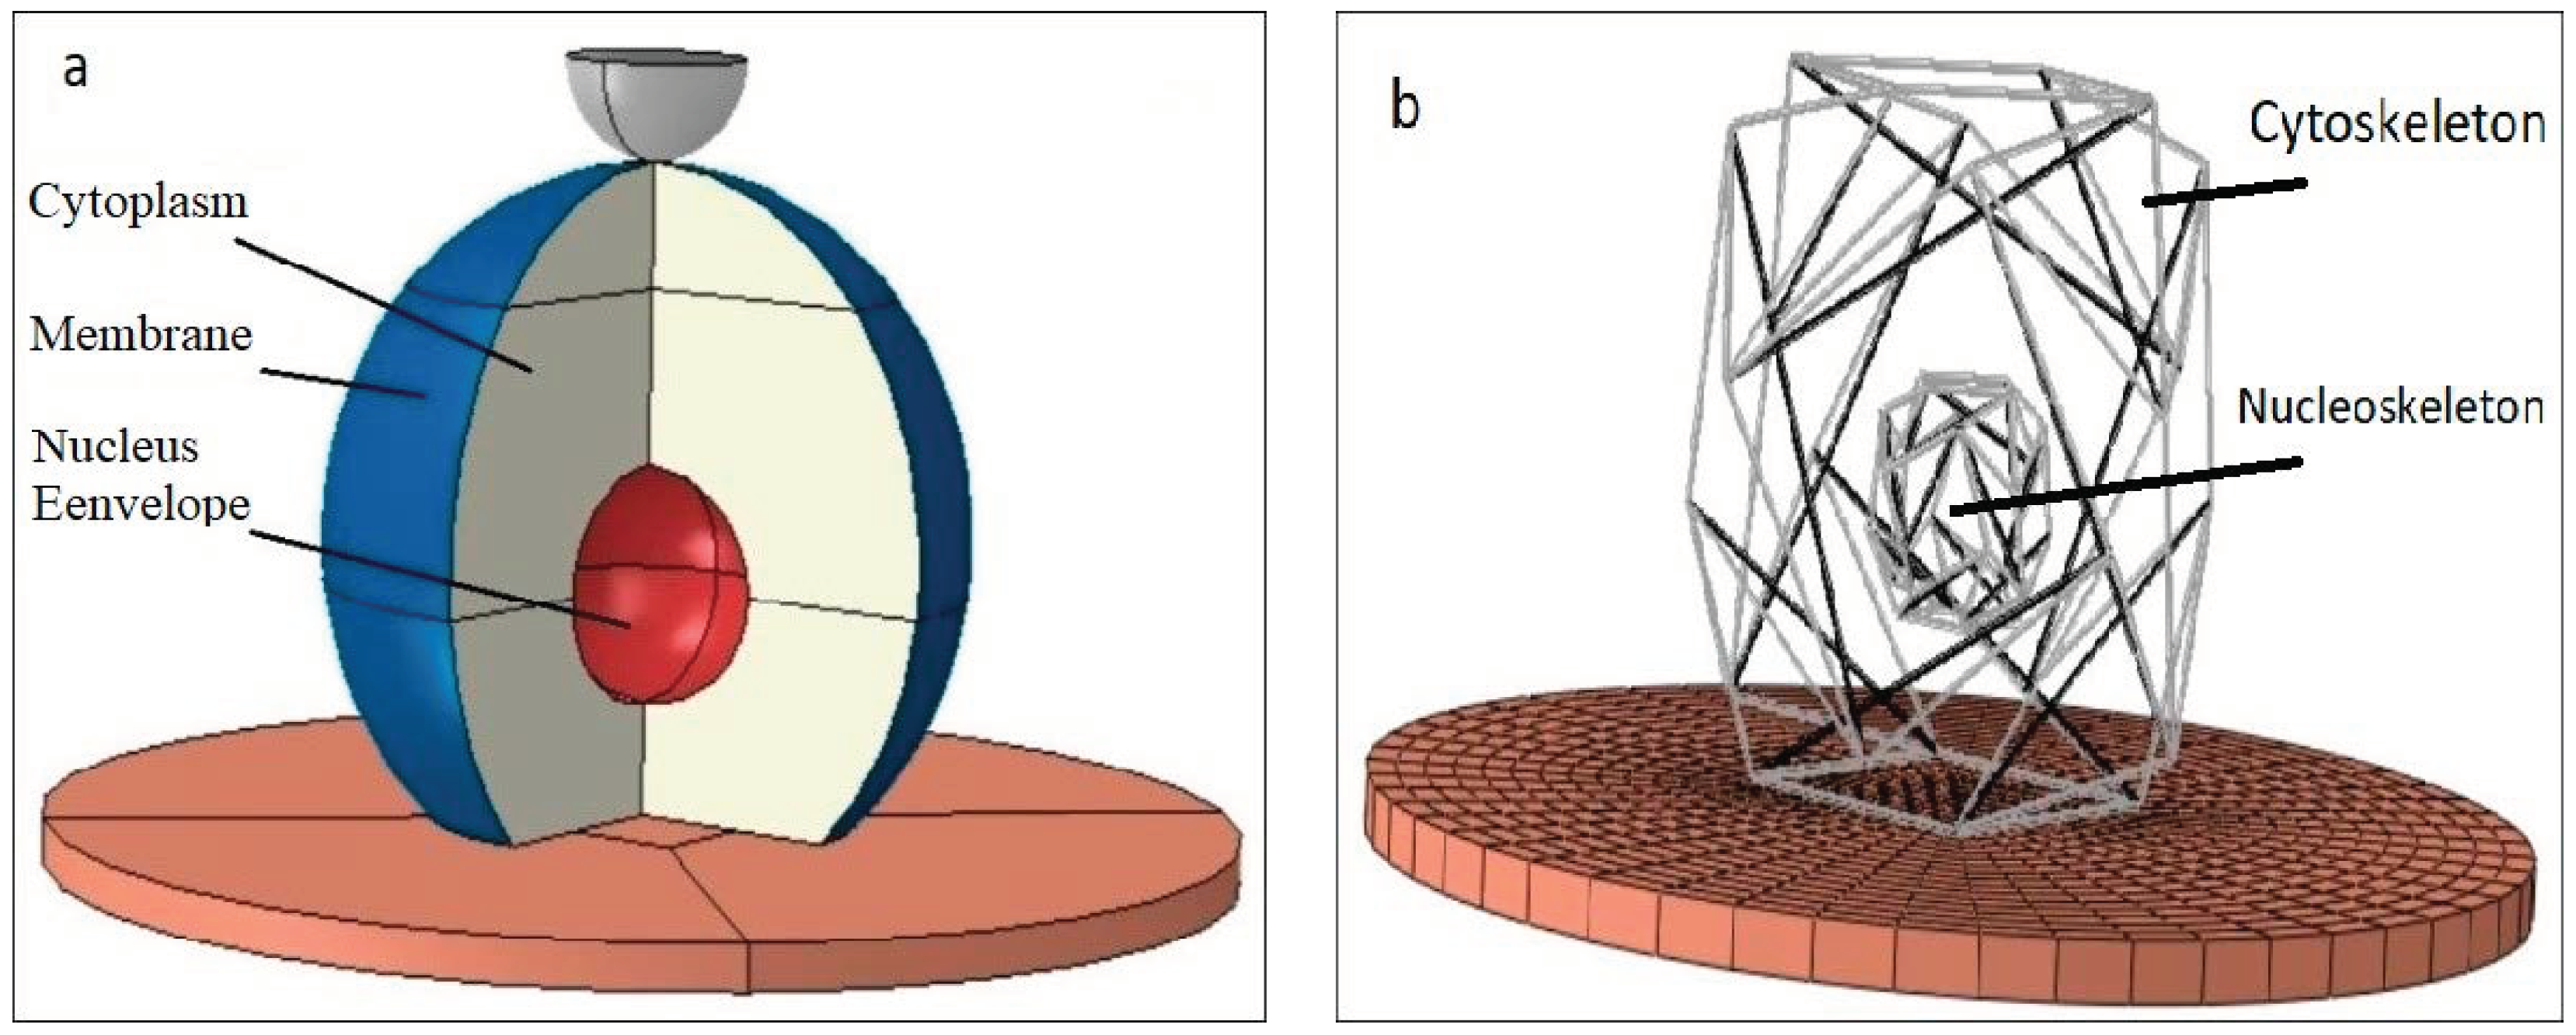
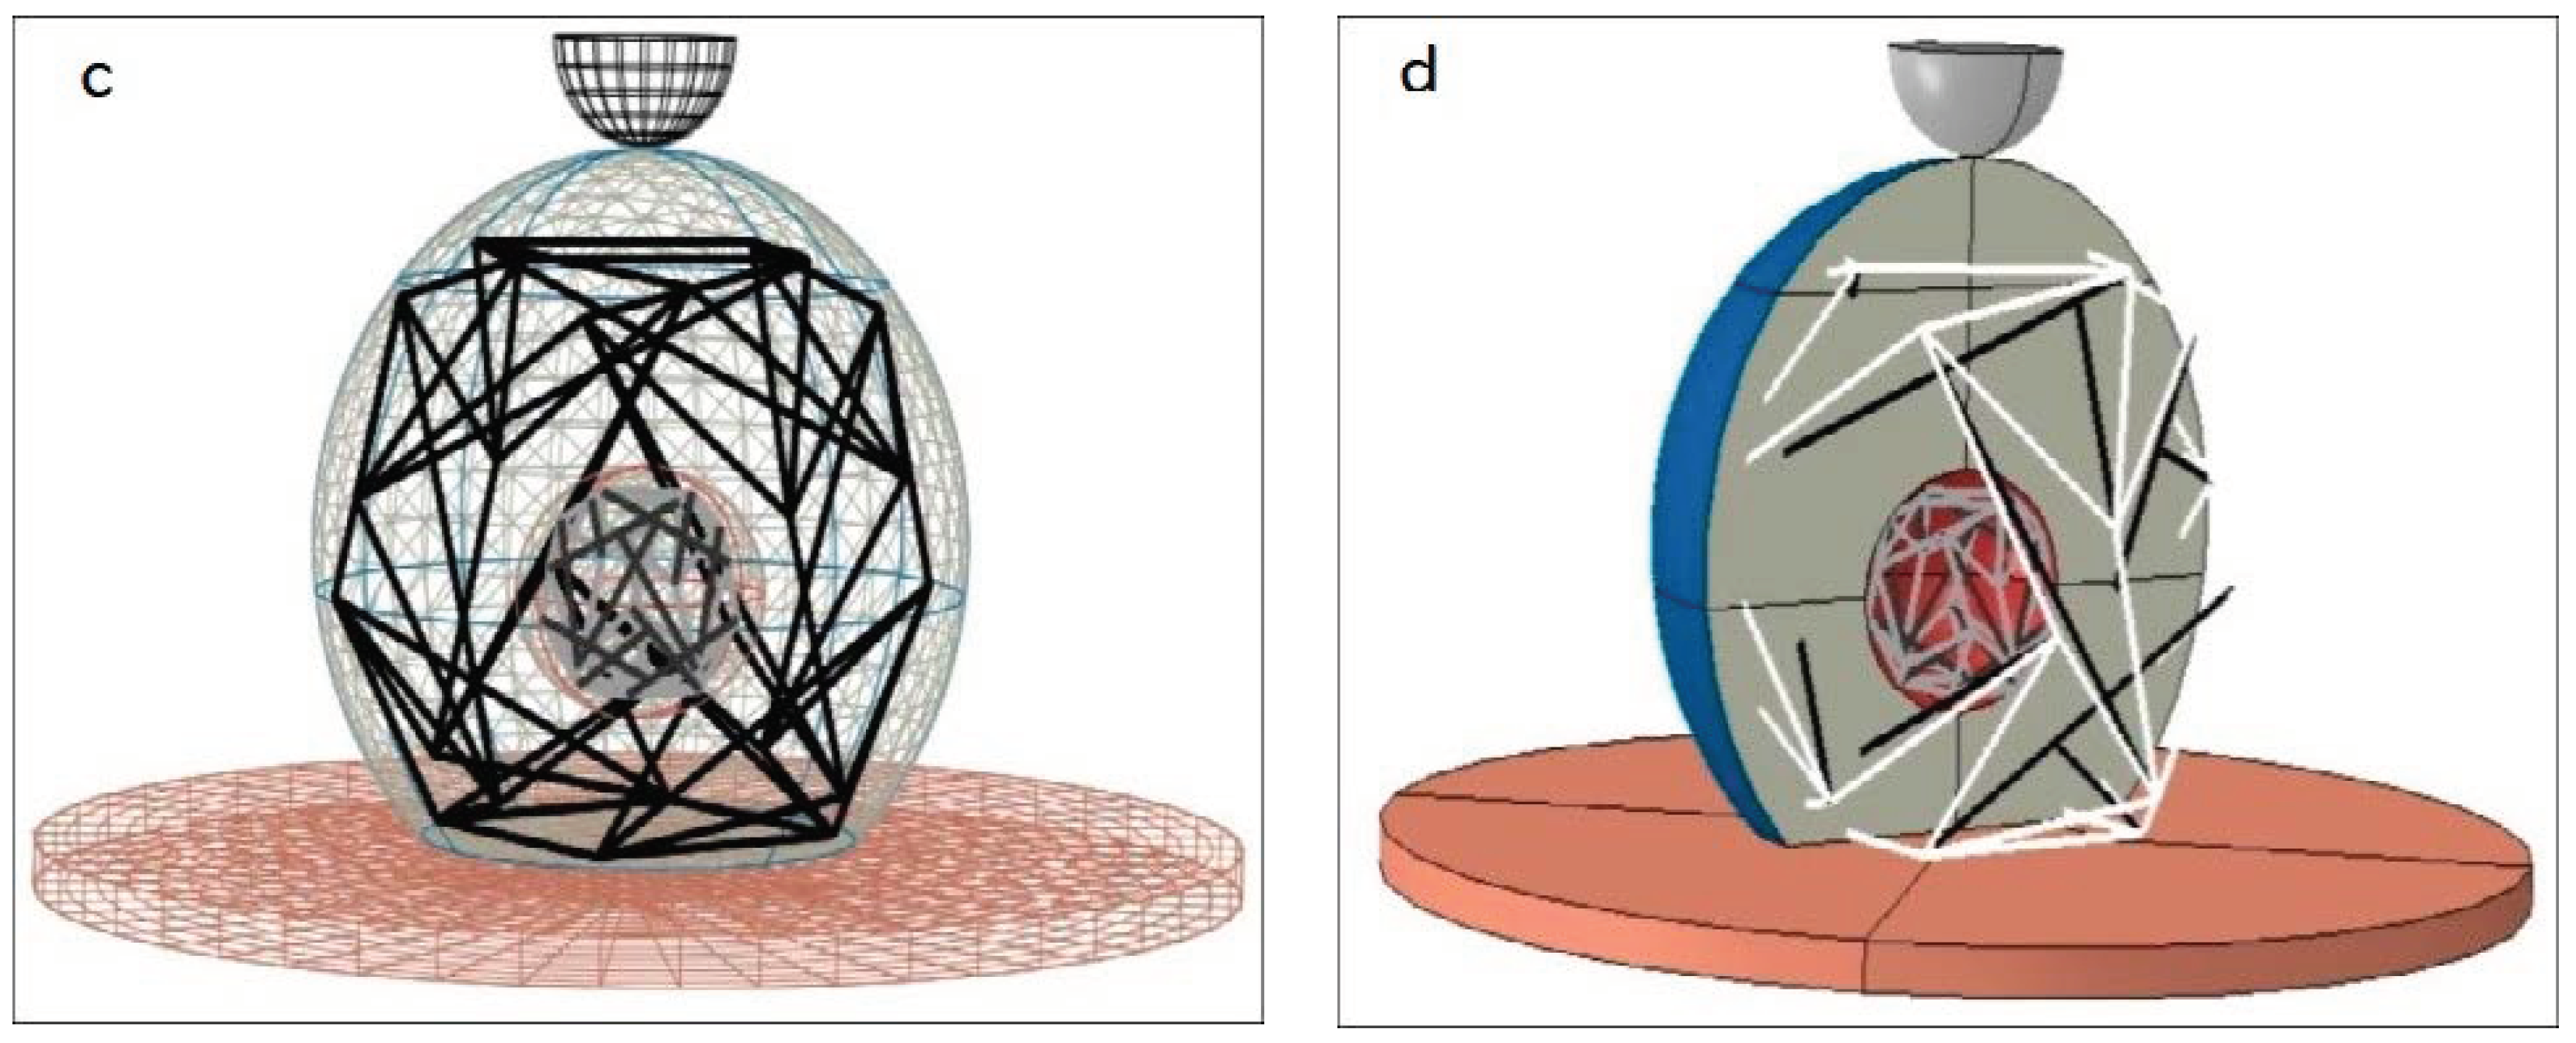
Before meshing the substrate, it was partitioned so that the nodal points of the cytoskeleton tensegrity corresponded to the arrangement of the substrate elements (
Figure 3b). Finally, the substrate was meshed by the solid deformable elements.
Figure 3 shows the cell structure, location of cell components, and how the cell is attached to the substrate.
2.3. Assembly and Contact
After merging the model’s continuous parts, it was necessary to add the structural (tensegrity) parts to the model. In this step, the determination of the contact between these two types of components was very important. For this purpose, each of the CSK vertexes was connected to the nearest node on the membrane by a multipoint constraint-pin (MPC-pin). The same method was used to define the connection between the NSK and NE. Four lower vertexes of the CSK were also connected to the substrate by a MPC-pin. The cell was located on the frictionless substrate surface as shown in
Figure 1, while a 0.01 friction coefficient was defined between the AFM bead and the cell. All 6 degrees of freedom were set to zero for the lower surface of the substrate. The bead’s reference point was constrained so that the indentor can only move in the vertical direction. All defined elements for the cell were able to tolerate translational and rotational displacement in all directions.
2.4. Solution
Conservation equations are the principal equations used to solve this problem. In the absence of the thermal field, the mass and momentum conservation equations are used. The mass conservation is defined by differential Equation (1):
where
ρ and
v represent density and displacement velocity,
t represents the time and
is the definition of the gradient operator.
The differential form of the linear momentum conservation is shown below:
where
is a Cauchi stress tensor,
b is the body force term, and
a represents linear acceleration. However, in the present case, there are no body forces, and due to the static situation, all accelerations are equal to zero. Thus, Equation (2) can be reduced to
This system of equations was solved by the general-static tools of the Abaqus package. The stresses, strains, and reaction forces can be determined in the post-processing step.
Finally, the model was run for several cases. The analysis started with the cytoplasm only, and step by step, every component was added. The reaction force for any of these solutions was recorded and compared with the complete cell. The CSK was assessed separately.
3. Results
In this study, we planned to show that the simulated structure can estimate the behavior of a living cell, to consider the role of different subcellular organelles in the mechanical behavior of the cell and to study the mechanical behavior of the subcellular organelles.
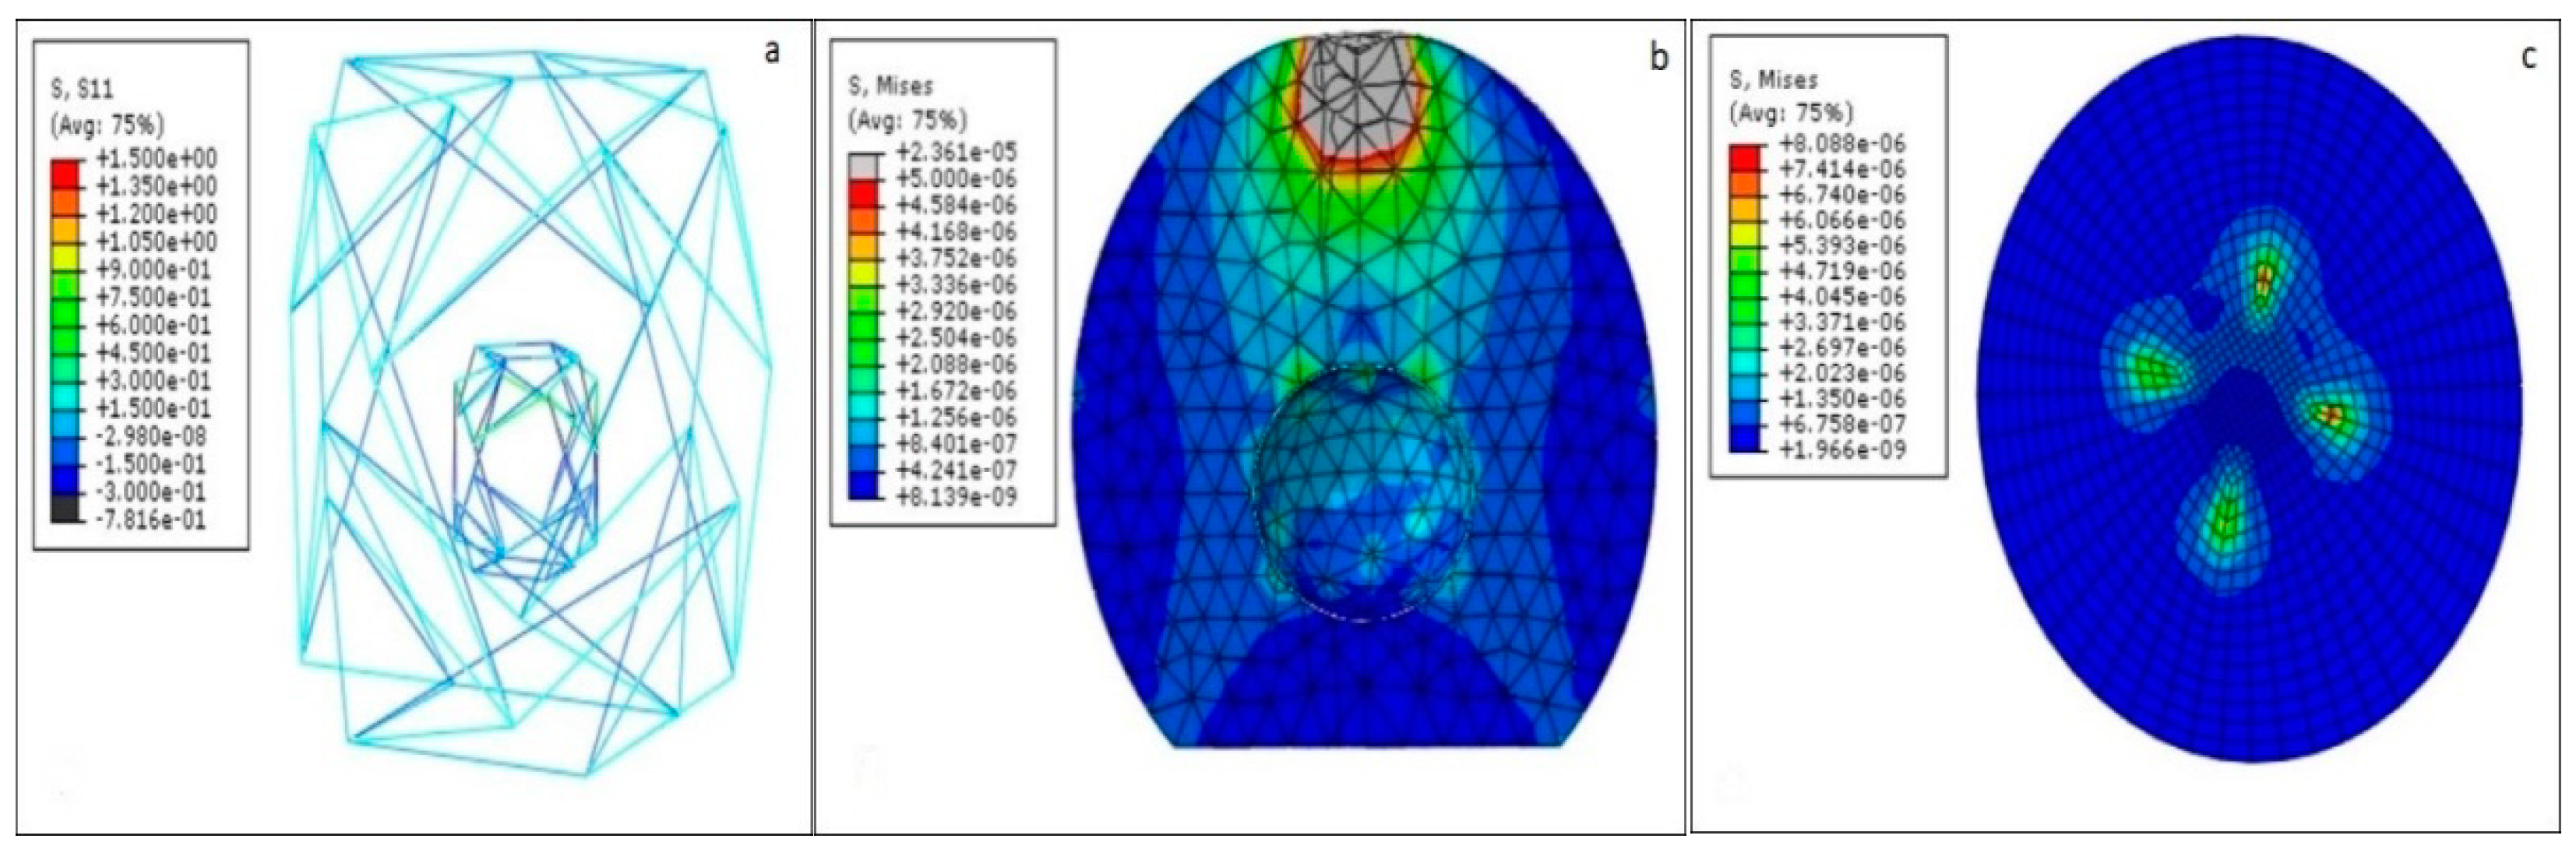
Figure 4 shows the principal stresses in each of the cell components. The tensegrity elements have higher mechanical properties than the continuous parts. This causes the stresses in each part to be significantly different. Thus, to better demonstrate the variation in stresses, tensegrities were separated from the continuous parts.
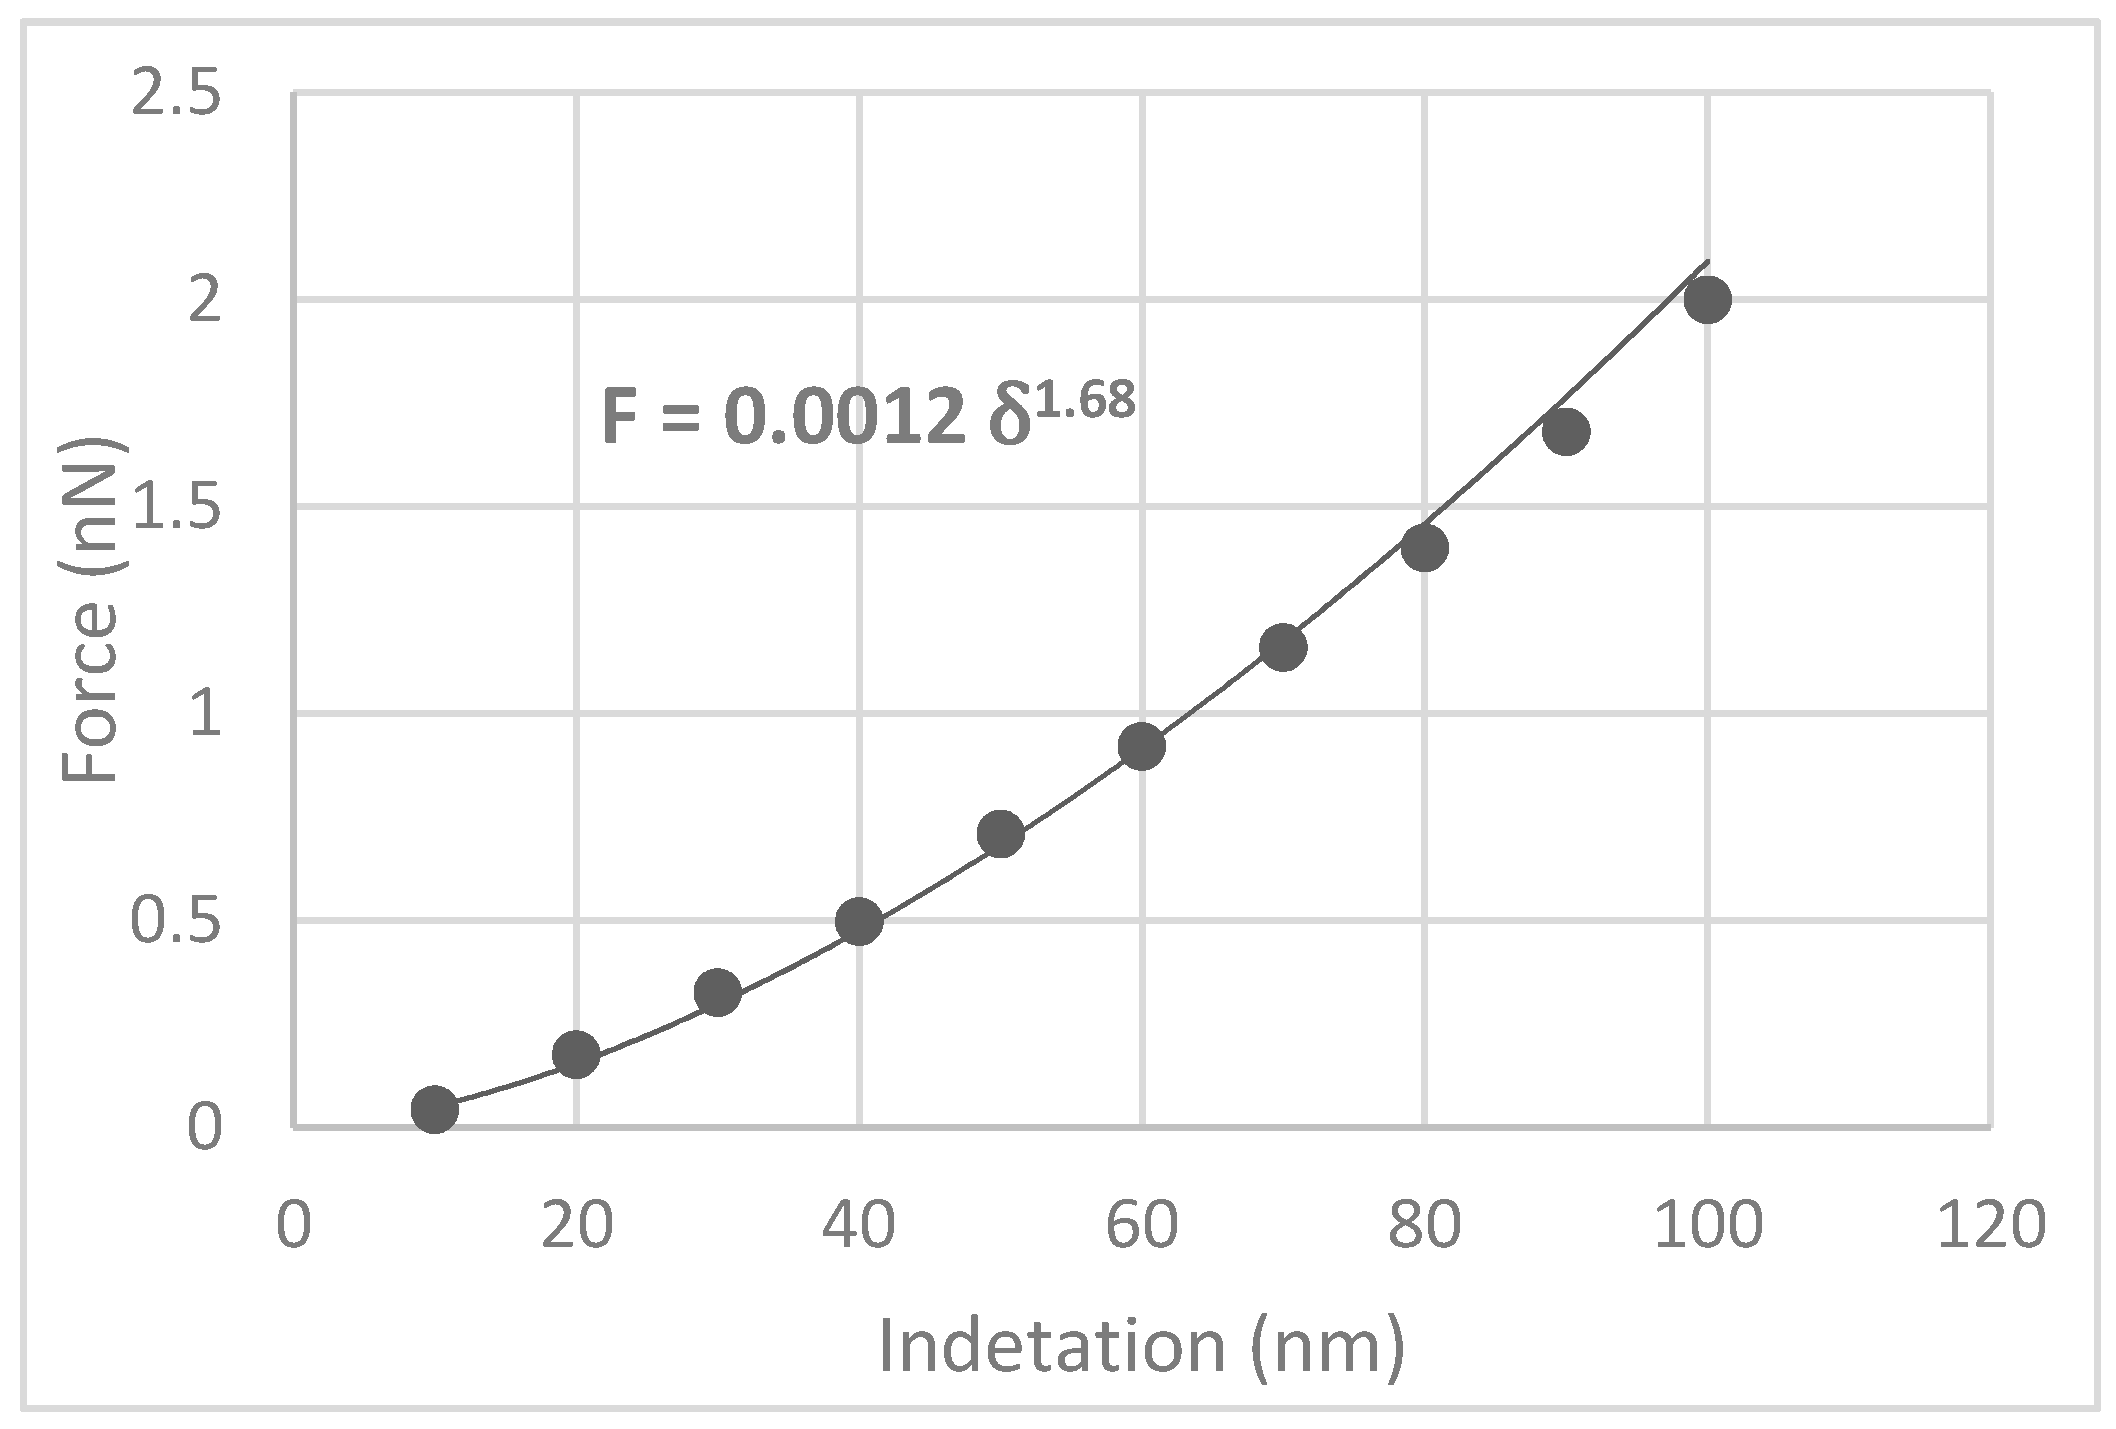
A specific indentation can be applied to the subject in the AFM test, and the reaction force to this indentation can be measured. Here, to simulate AFM indentation, a displacement was applied on a specific point of the modeled cell. This initial displacement was selected as 10 nm, and then the model was run. After obtaining the reaction force for this step, an additional 10 nm displacement was added to the previous step’s displacement. A total of 100 nm was exerted on the model as the largest deflection. For each of these loading steps, the reaction force was recorded at the bead reference point. Eventually, the force-displacement curve was created from the calculated data.
Figure 5 shows the F-δ data calculated for the simulated structure and the fitted power-law curve. Validation of the developed model with experimental data is always necessary.
3.1. Validation of the Simulated Model
Nguyen [
31] used the AFM technique to consider the effect of strain rate on the mechanical properties of three different cell types. He studied a single osteocyte, osteoblast, and chondrocyte separately under AFM with varying rates of strain. He used the obtained data to validate a finite element model for seeking the cells’ hyper-elastic and viscoelastic properties. The chondrocyte data was chosen to compare these three cells because the diameter size (15
3 μm) was similar to the cell height (11.7 μm) of the simulated cell. As noted above, these results were achieved with distinct strain rates. However, the current research only utilized the elastic properties of all the modeled subcellular elements. It is obvious that linear materials behavior is time-independent, so the data from the largest strain rate was chosen in order to validate the model.
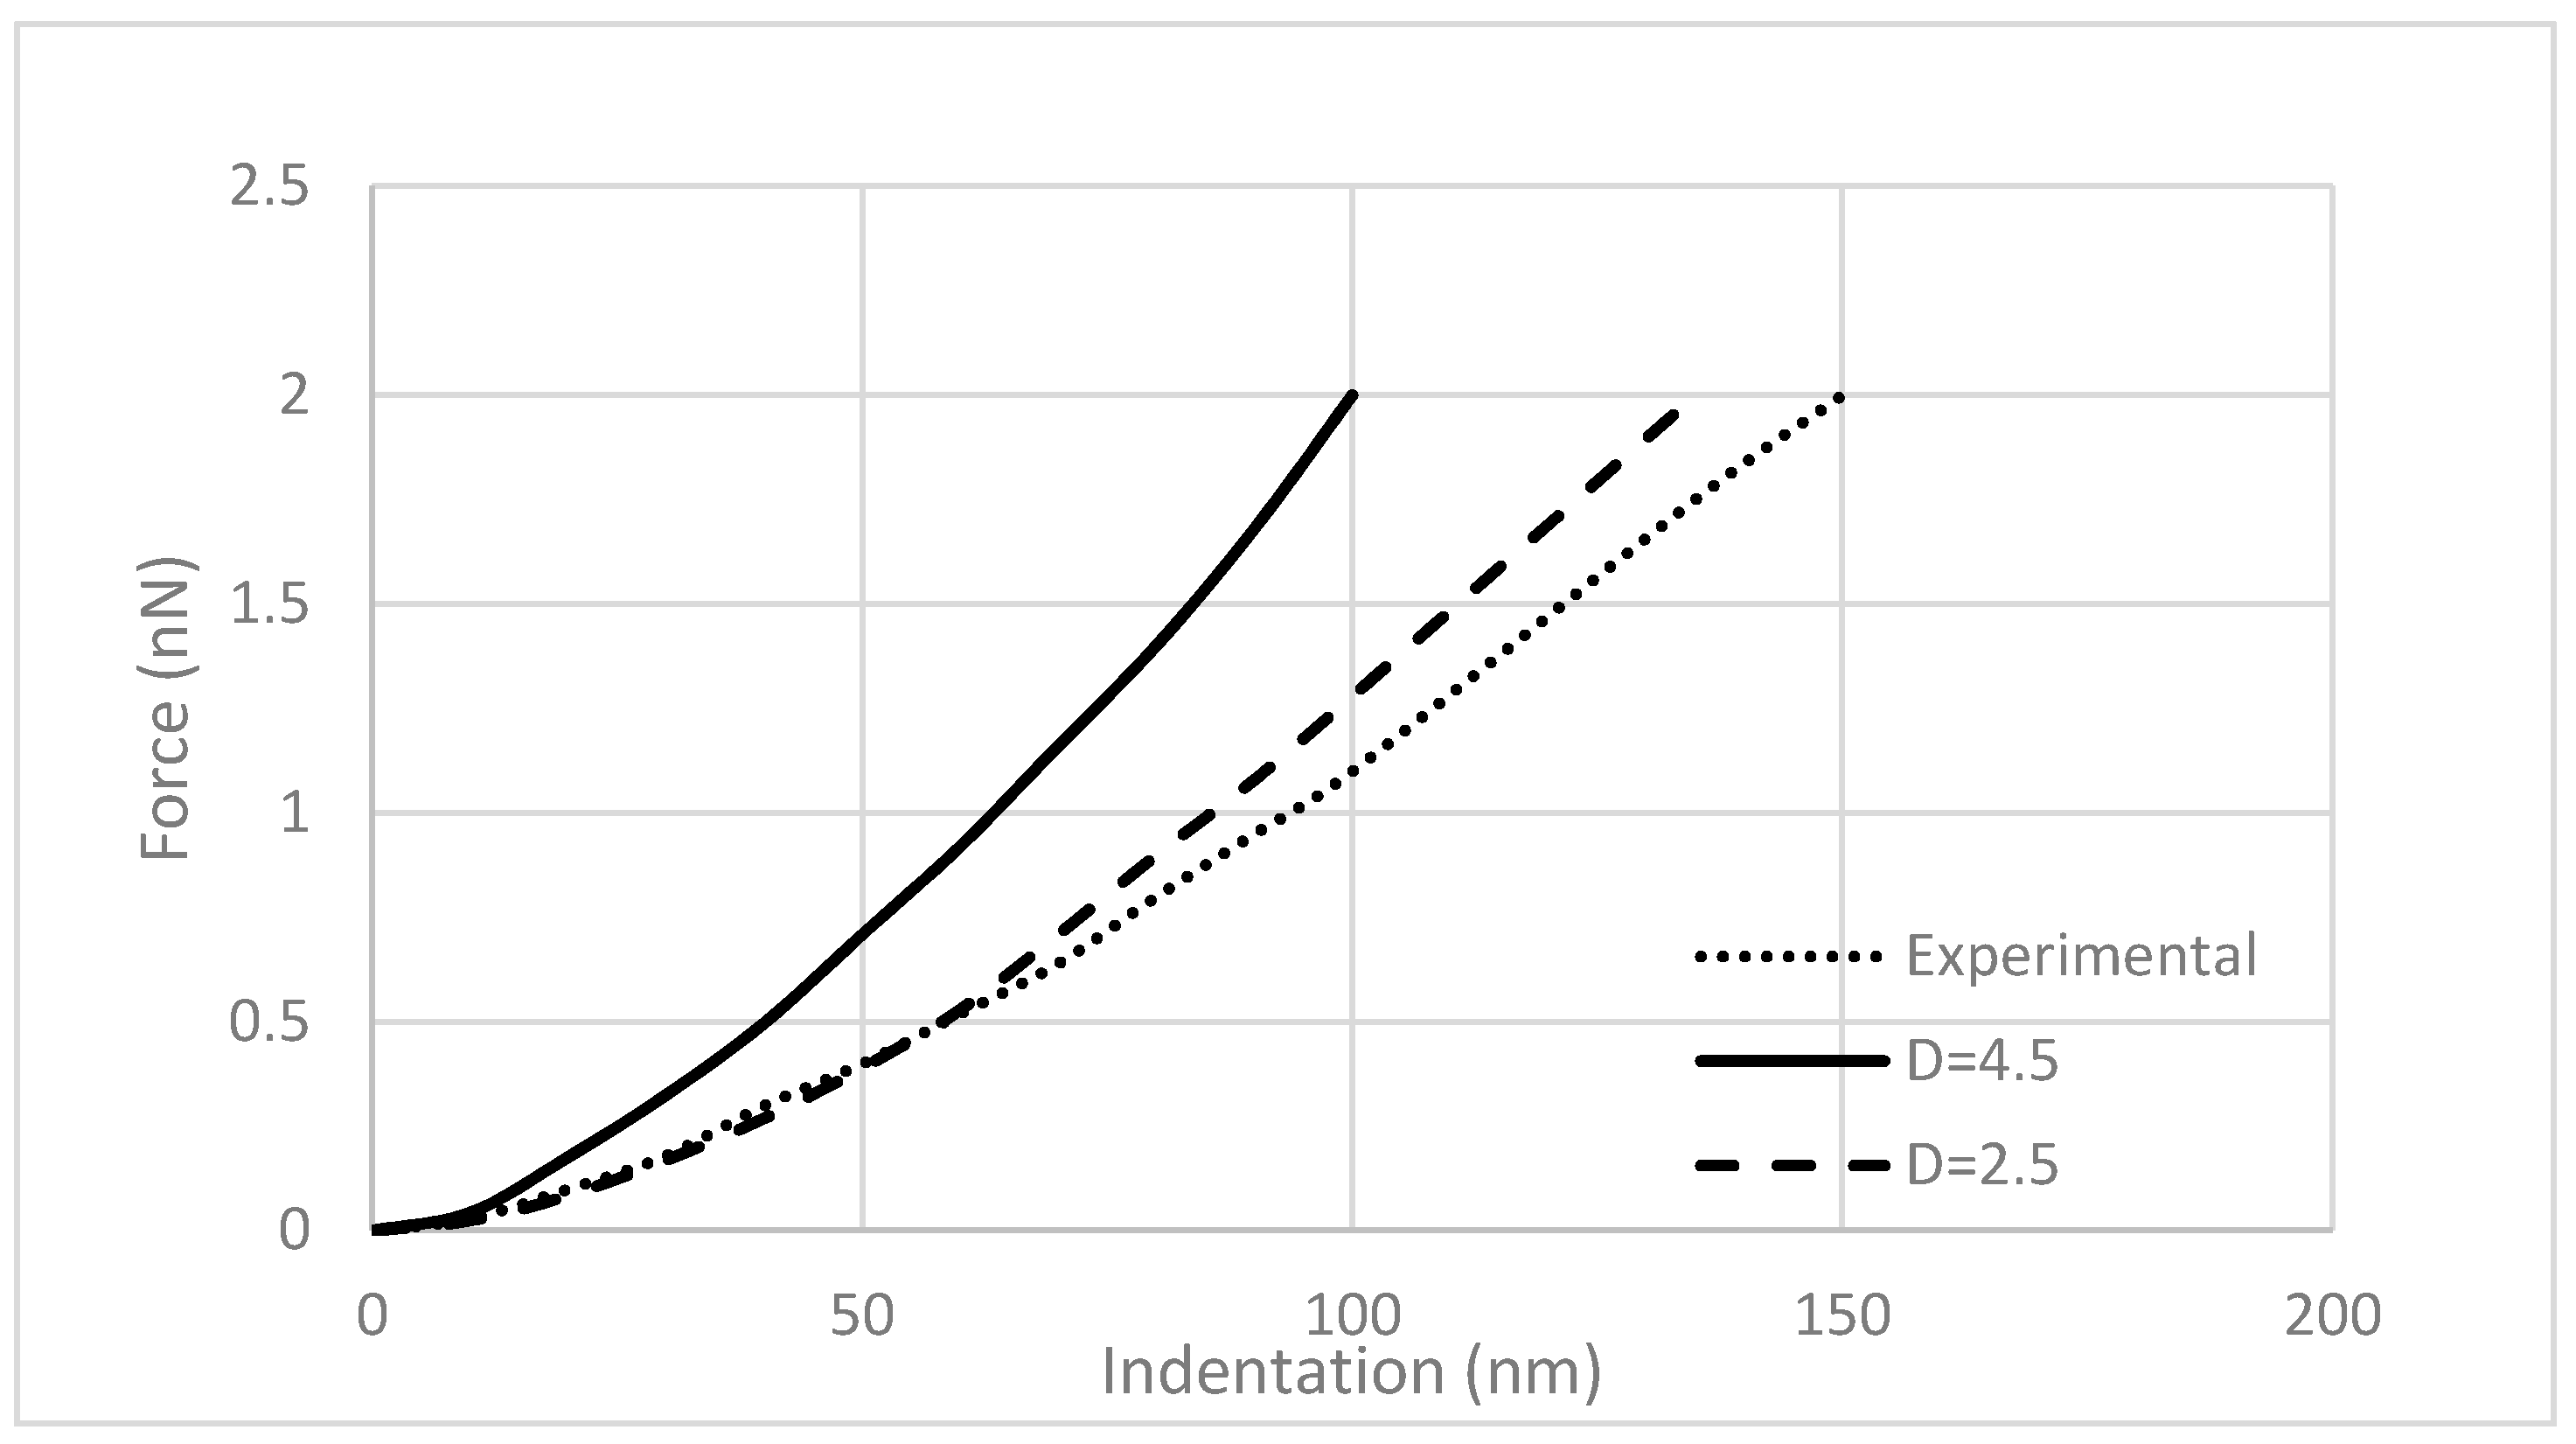
Figure 6 shows the F-δ curve for the experimental and simulated data. The dotted curve is fitted to the experimental data from the literature, and the solid curve was obtained from the finite element analysis (
Figure 5). Both curves show an exponential relation between the AFM indentation and the measured force. The difference between the plots is due to the differences in the radius of the micro spherical tip (Equation (4)). Dimitriadis et al. [
30] have shown that for a sample with a height
h, the smallest radius of the bead must be equal to
in order to prevent the strains exceed the material linear behavior. They also concluded that using microspheres with a 2 to 5 μm radius provides more accurate results. For validating the model, a tip with a 2.5 µm diameter, as in the reported experimental test, was modeled. The dashed line represents the results obtained with a 2.5 µm tip. The calculated data is very similar to the experimental report. However, the current model is based on a linear elastic analysis of the cell. Thus, to ensure linearity and better accuracy, the model was developed using a rigid sphere with a radius of 4.5 μm for further observation. It is evident that a bigger tip produces a higher reaction force.
According to the Hertz equation [
32], the reaction force for the spherical tip on the elastic matter is a power-law relationship:
where
F is the reaction force,
R is the radius of the spherical indenter,
δ is the applied indentation,
E and
ν are the Young’s modulus and Poisson’s ratio of the elastic material, respectively. The power-law fit for the F-δ relationship (
Figure 5) obtained in this study was 1.68. This value is very close to the 1.5 that is provided by the theory.
3.2. Mechanical Behavior of Cell Components
After validation of the model, further research on the cell can be done. It was of interest to investigate the contribution of every subcellular organelle to the mechanical response of the cell. For this purpose, the cell’s components that were expected to have a noticeable effect on the cell’s mechanical behavior were individually loaded. The indentation-force graph was calculated for each of them from the FEA.
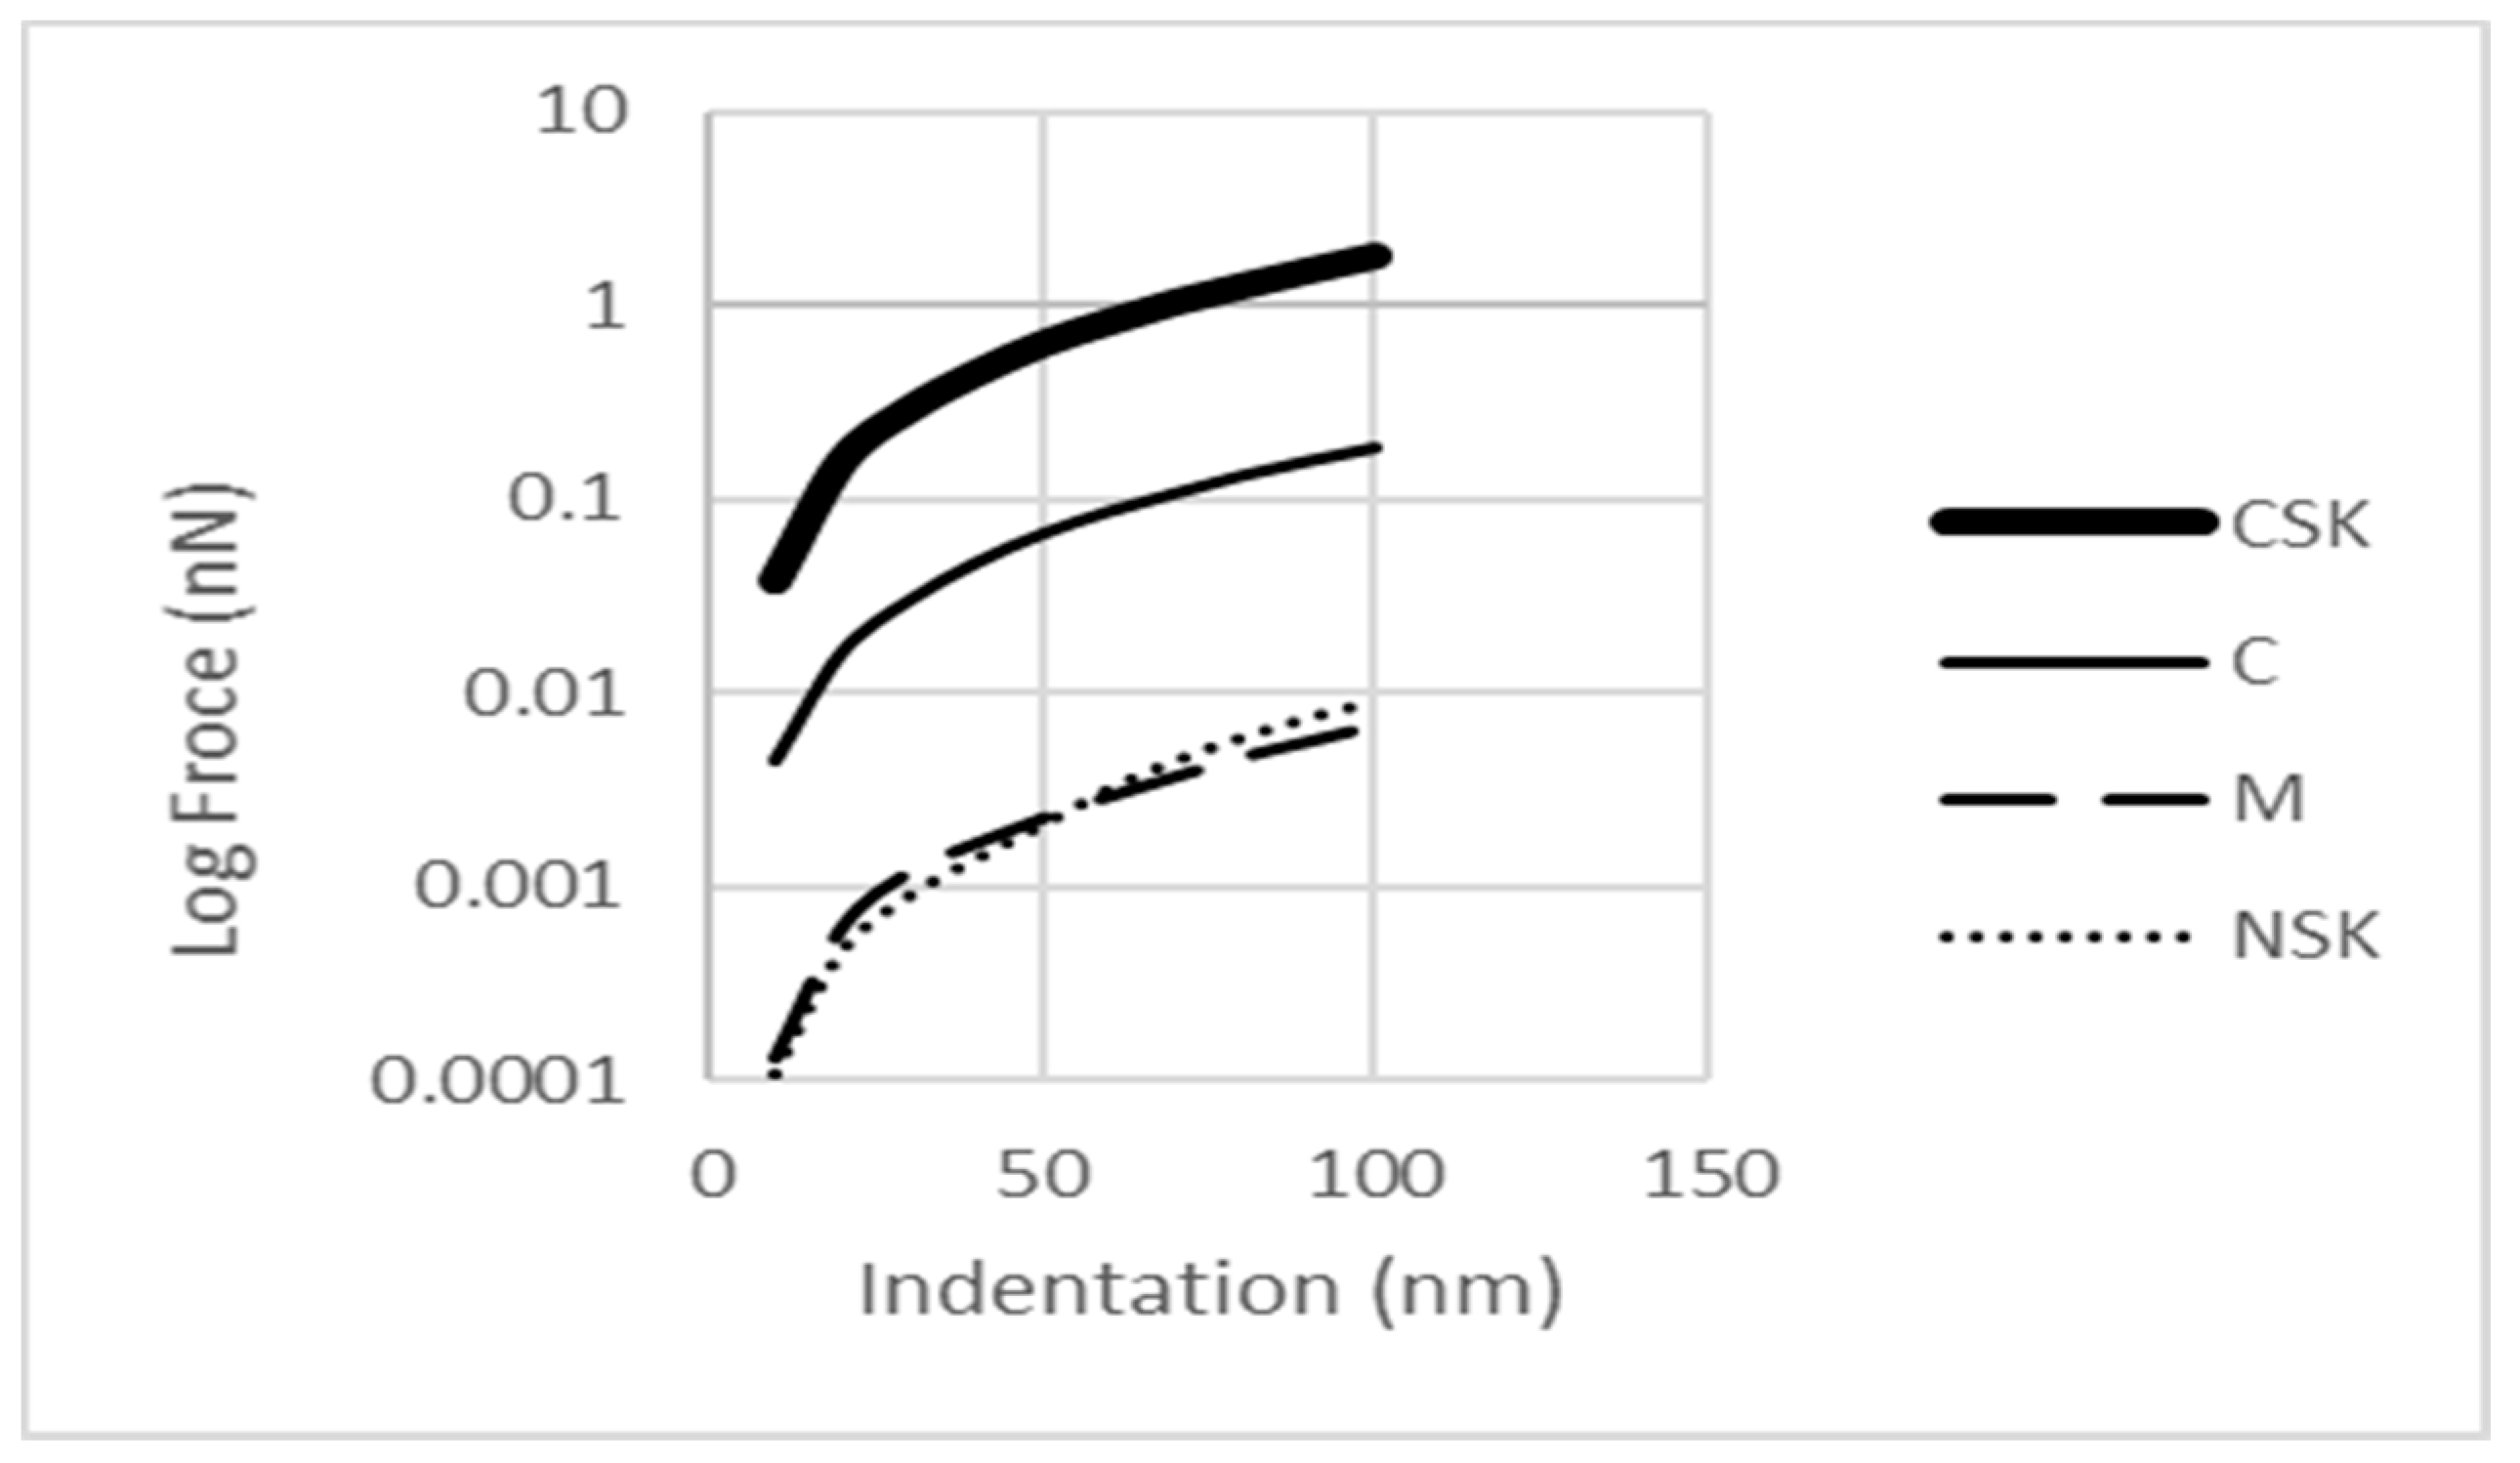
Figure 7 indicates the variation in the reaction force for 4 subcellular components that are mechanically more important. To better discriminate between the curves, the force axis has been taken on a logarithmic scale. The thick solid line refers to CSK that gets higher reaction forces against other organelles. The reaction forces were measured in one of the upper vertexes of the structure. The thin solid line represents the reaction of the single cytoplasm to AFM. The dashed line can obtain if the membrane model separately. And finally, the dotted curve presents the F-δ relation for the NSK.
A review of the literature suggests that the CSK is mostly responsible for supporting loads in the living cell [
7], so, it was expected that this component would present a higher reaction force than others. In addition, as it is seen clearly in
Figure 7, the cytoplasm has a lower reaction force than the CSK. This is the expected response because of its lower stiffness. On the other hand, the cytoplasm also has a bigger effect on the cell mechanical response than the NSK and membrane. The cytoplasm behaves as a much stiffer element than the membrane. This can be seen by comparing the curves in
Figure 8 and
Figure 9. The reaction force for the membrane at the indentation of 100 nm was calculated to be about 5 pN. This value is in the range found in other experimental studies [
33].
The NSK is a relatively small structure compared with the cytoplasm. Thus, the cytoplasm undergoes larger deformation than the NSK. The stress distribution in the cytoplasm is shown in
Figure 4b. There are two areas where high stress is concentrated; one is just under the AFM bead and the other is around the nucleus. The nucleus is treated like a defect in a solid body (cytoplasm) so it causes diversion in the force flow field inside the cytoplasm as well as around the nucleus. Thus, due to their geometry, a smaller portion of the external stimuli is sensed by the nucleus because of the force flow deviation.
There is a difference in the slope of the force-deflection curve between the membrane and NSK, as seen in
Figure 7, where the dashed and dotted curves cross each other. The curve’s slope is 1.92 for the CSK, 1.78 for cytoplasm, and 1.72 for membrane, and 2.13 for NSK. The larger slope of the NSK is related to its incremental load bearing during the indentation. At the smaller indentation, the membrane supports a larger force, but as the indentation depth grows, the NSK’s support increases. As the membrane is the first component to face an external load, at the small indentation, the membrane deformation is larger than that of the NSK, but as the stimuli increase, the NSK shows a higher reaction force due to its stiffer structure.
The NSK also has a higher slope in its F-δ curve compared to the cytoplasm, i.e., the NSK has higher stiffness than the cytoplasm. The larger slope of NSK relative to CSK can be explained by the smaller size of NSK. The moment
M acting on a bar in tensegrity can be calculated using (Equation (5)) [
34].
where
F is the external load,
L is the length of the bar, and
θ is the angle with the horizontal direction. Since the two tensegrities were set to be parallel one to another,
θ is the same for both of them. The external force is also the same for both. Thus, the element with a larger length carries a larger moment, and therefore, it will deform more than a smaller one.
3.3. Effect of Subcellular Organelles on Cell Mechanical Response
In addition to assessing the mechanical behavior of each subcellular component separately, it is of interest to evaluate the contribution of these components in the cell’s total mechanical reaction. What is the percentage of the cell response arising from each of the subcellular organelles?
For this purpose, the analysis has been started with a single cytoplasm representing the cell, and for the next step, each of the cell components has been added to the previous solution. The CSK, due to its large structure, has been considered as a single 12-strut tensegrity and analyzed separately.
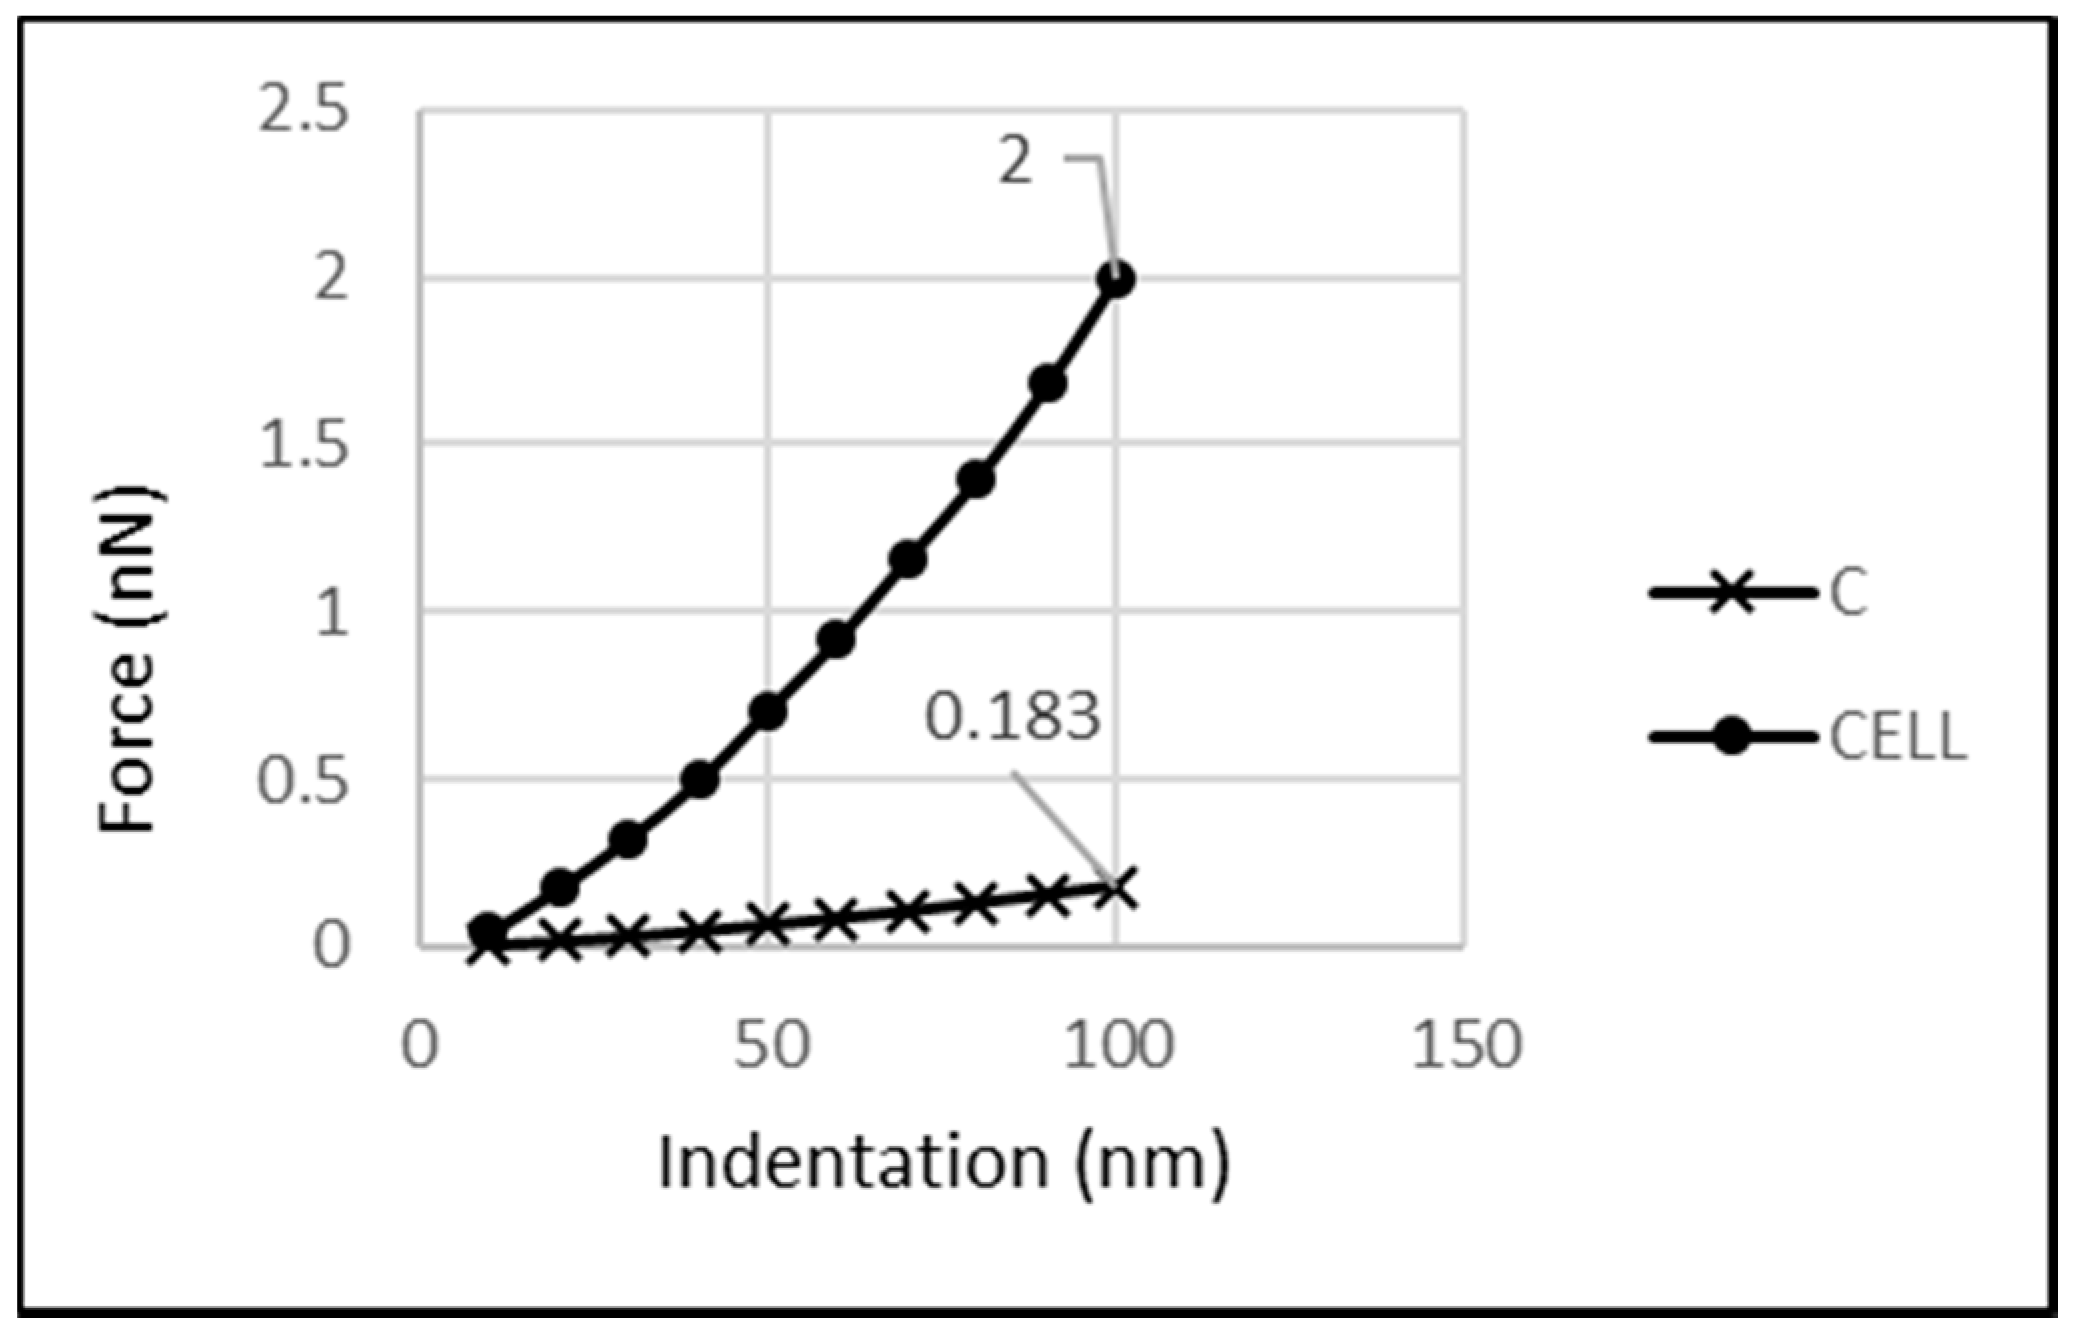
3.4. Cytoplasm
As shown in the previous section, the cytoplasm makes a noticeable contribution to a cell’s mechanical behavior.
Figure 8 presents the amount of the reaction force related to the cytoplasm with the whole-cell reaction. As shown in
Figure 8, a force of 183 pN was carried at a 100 nm indentation, whereas the whole cell supported 2 nN at the same indentation, thus, the cytoplasm carried about 9.15% of the cell’s reaction.
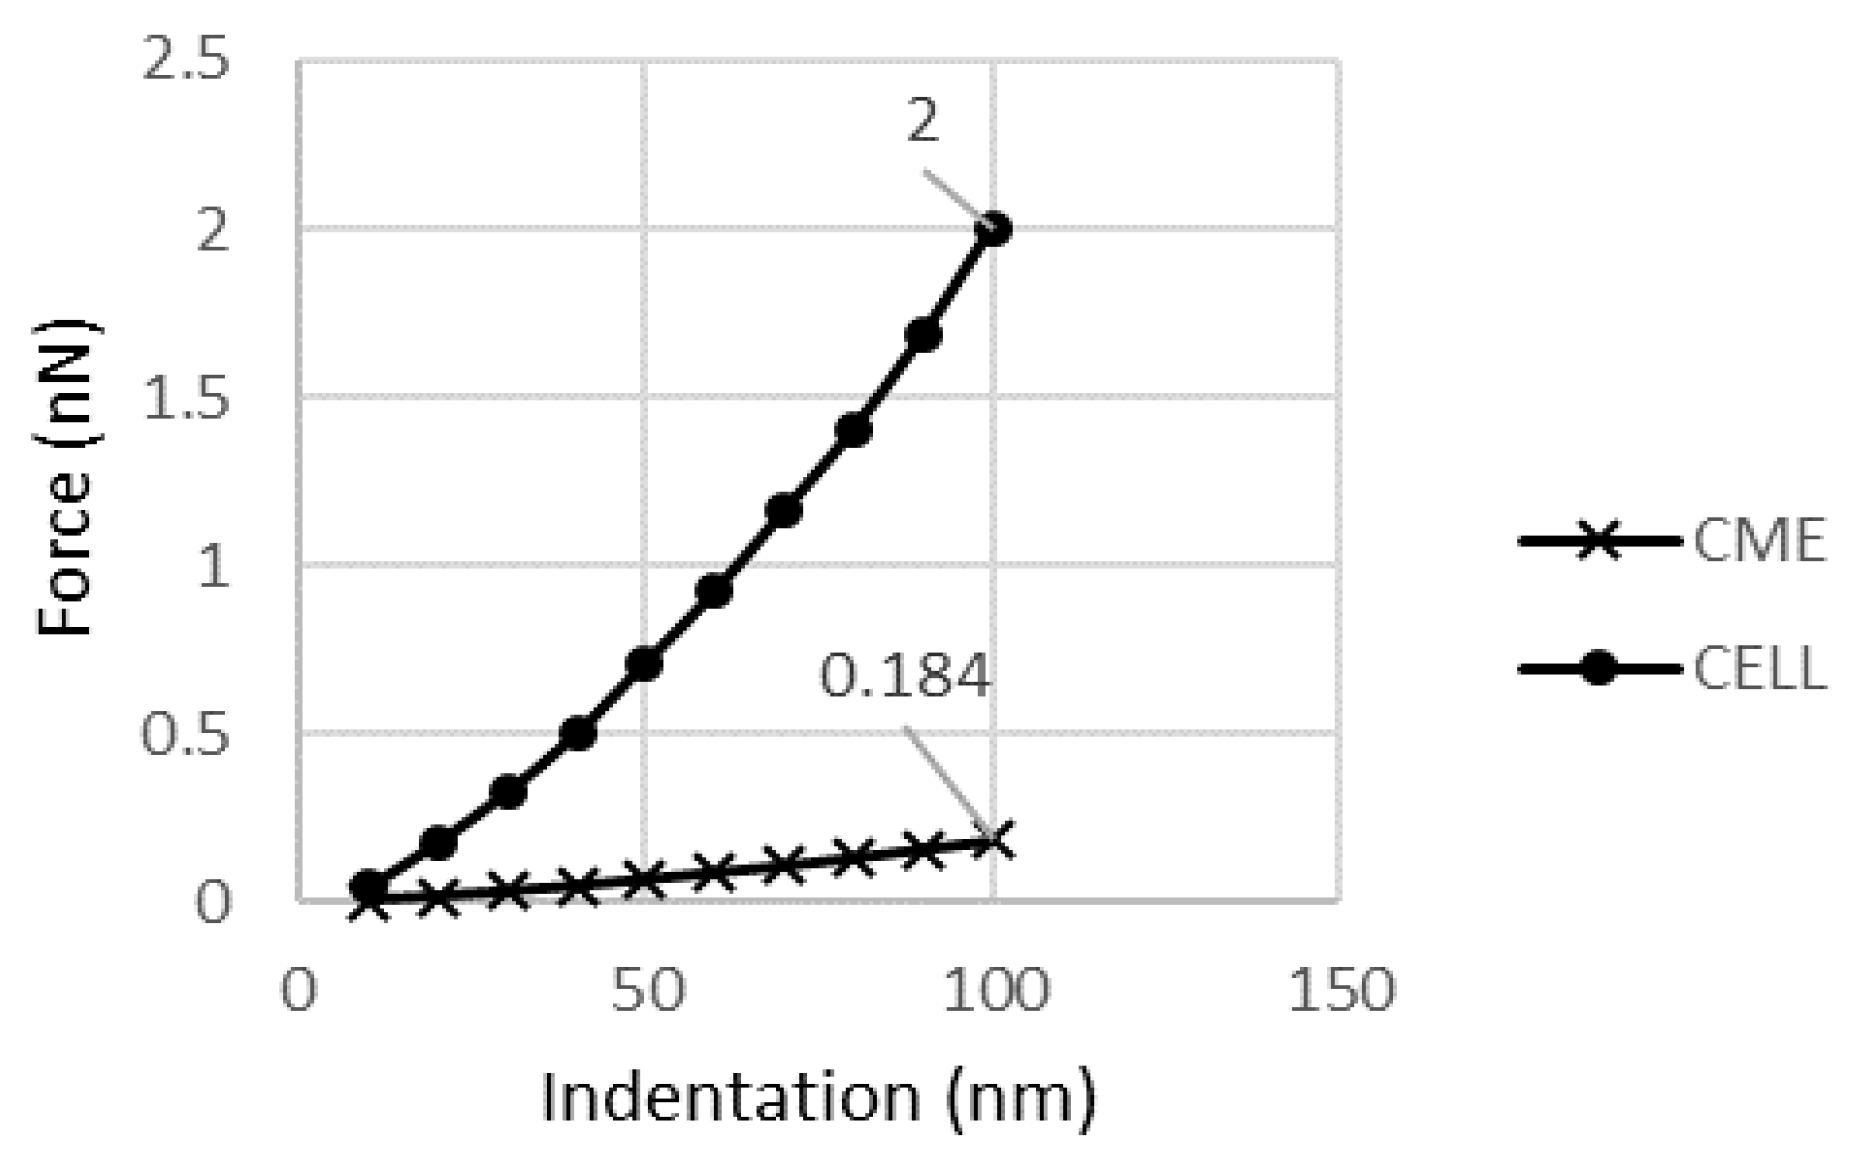
3.5. Cytoplasm, Membrane, and NE
A model with continuous parts including the cytoplasm, membrane, and NE (CME) was used to study the membrane and NE contribution to the cell response. The difference in the reaction forces generated in a CME model and just a cytoplasm model is negligible. It was 183 pN for cytoplasm and 184 pN for the CME model. This 1 pN difference accounts for 0.05% of the cell’s mechanical response.
Figure 9 shows the reaction of the continuous parts.
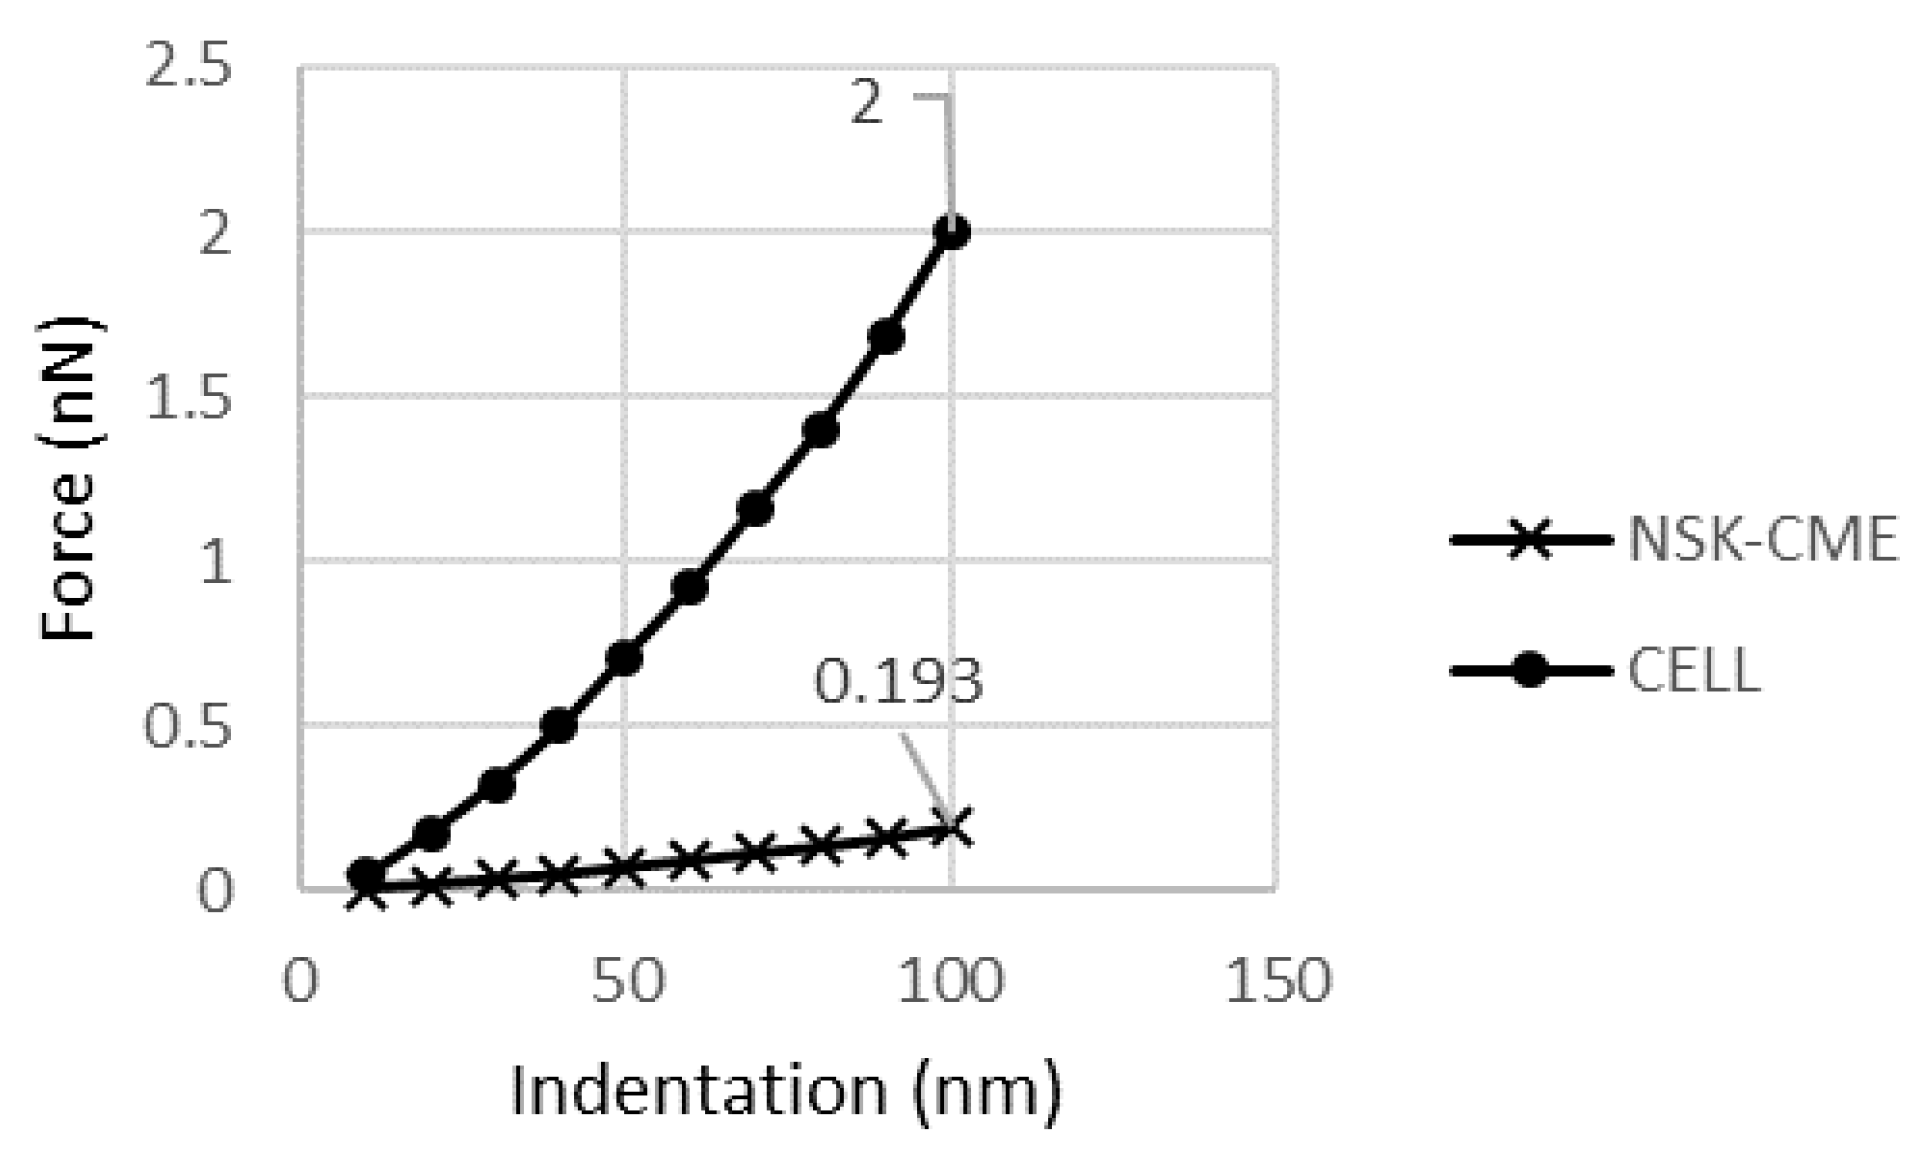
3.6. Effect of the NSK Addition to Continuous Parts
Because of the small effect of the NSK on the cell behavior and in order to distinguish this portion, the NSK was added to all the continuous parts, and then the change in reaction force was recalculated. As shown in
Figure 10, 193 pN was carried by this model, which means that the addition of the NSK was responsible for just 9 pN.
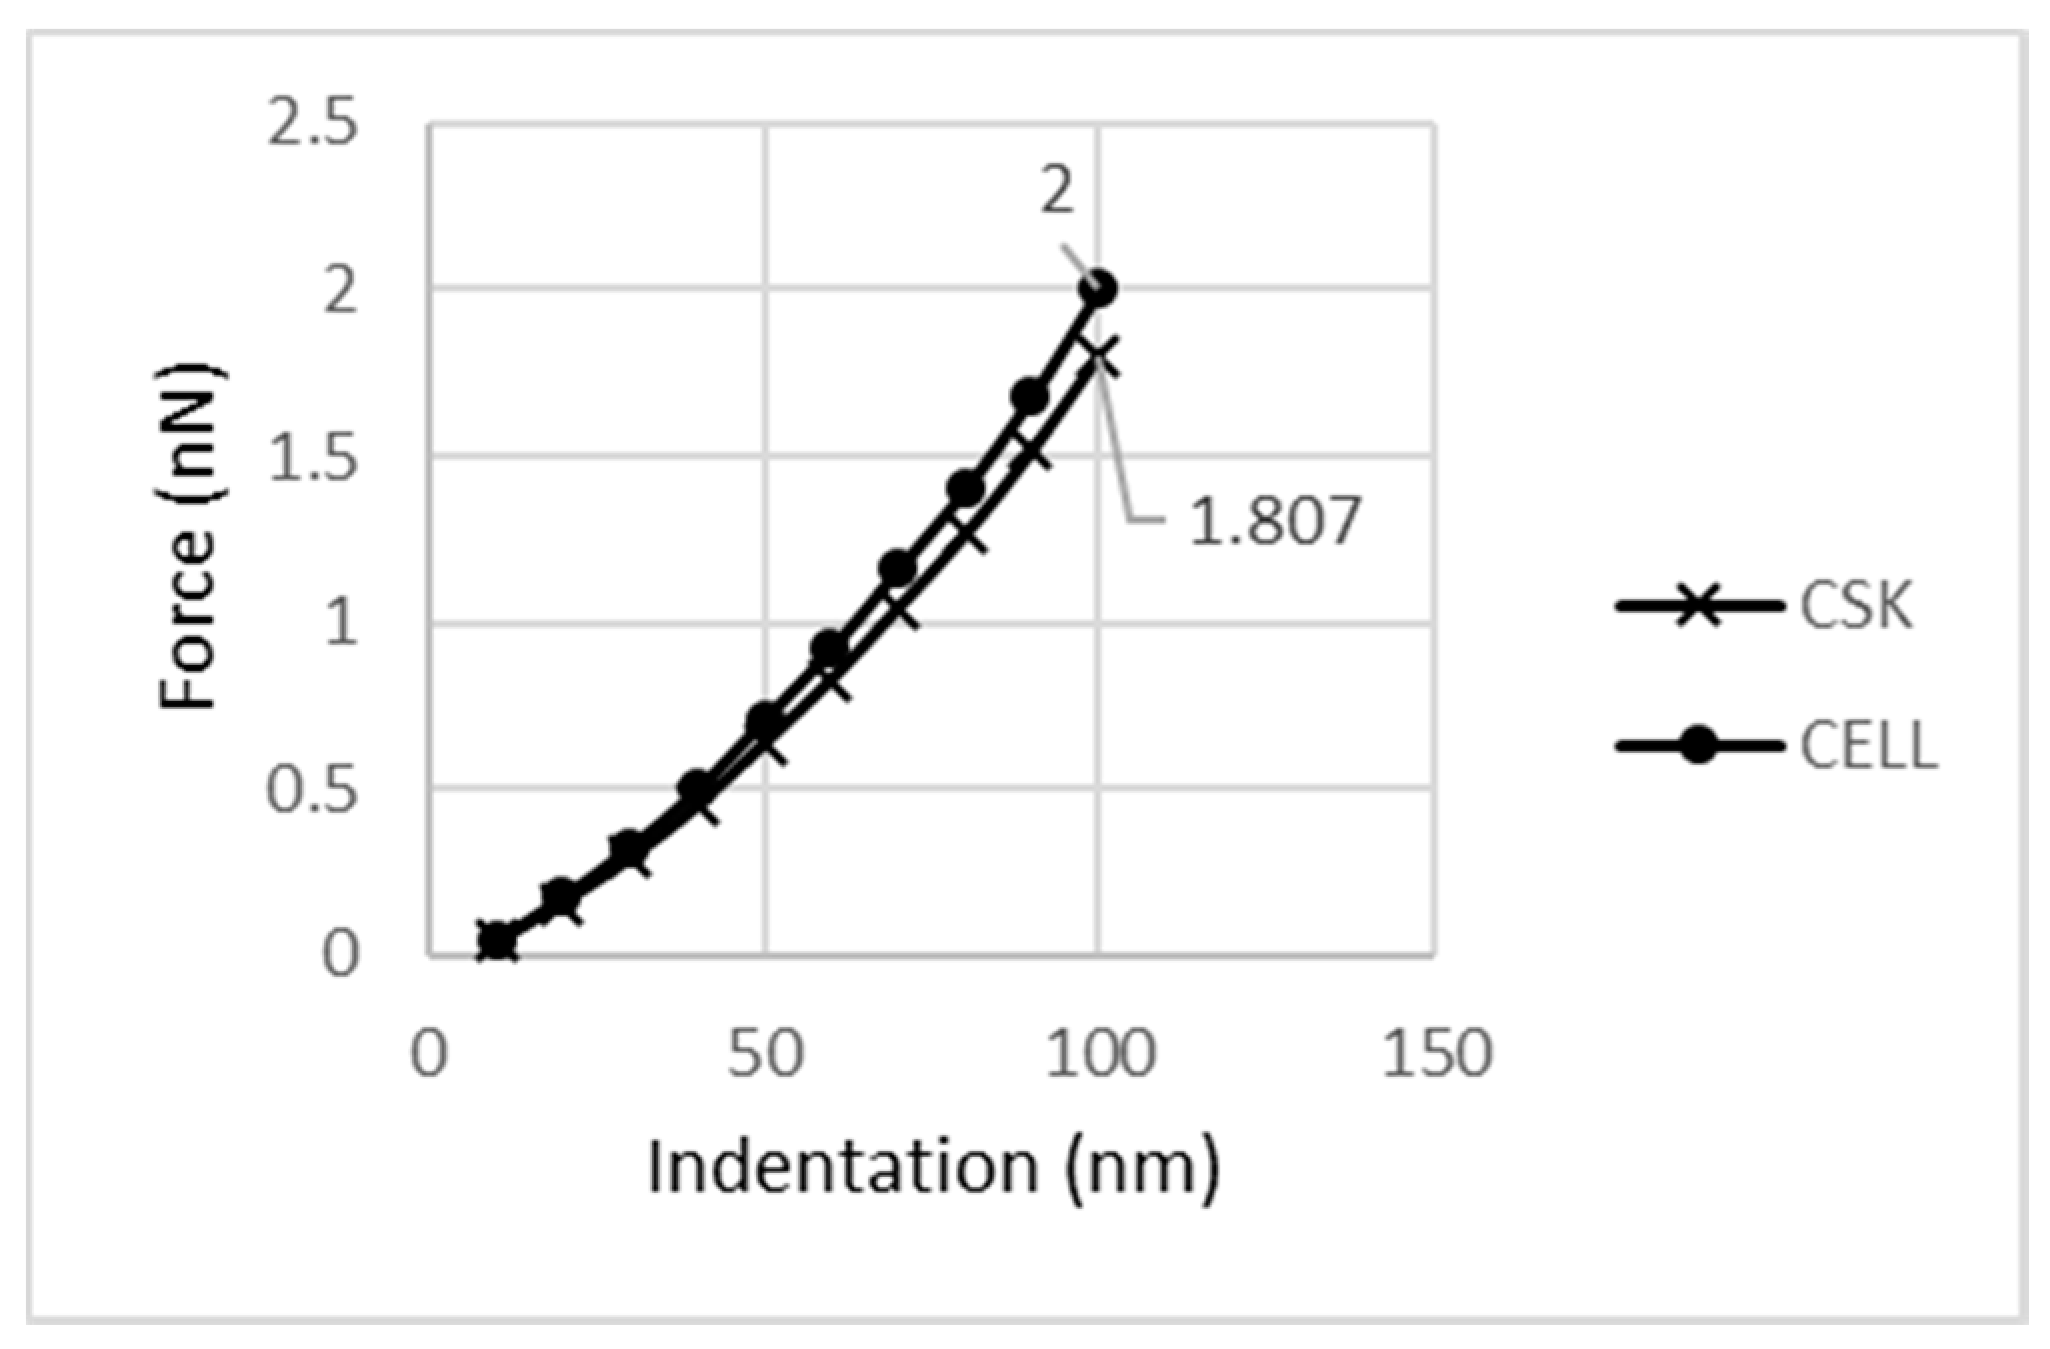
3.7. Effect of the CSK Addition to the Model
As described above, CSK is the most important cell component due to its contribution to the cell’s mechanical behavior. As can be seen in
Figure 11, CSK carries a 1.807 nN reaction force at 100 nm indentation. Thus, relative to the cell response, it carries 90.4% of the cell’s reaction force.
4. Discussion
In this study, the mechanical behavior of subcellular organelles such as the CSK, NSK, membrane, and cytoplasm was assessed. A FE model, which included all these organelles was created to study the cell behavior under AFM indentation. The membrane, cytoplasm, and NE were modeled as the continuum parts, while CSK and NSK were modeled as the structural parts. Intermediate filaments were ignored since their contribution to the cell rigidity became significant at high cell deformation (over 20%) [
4]. When there was a small deformation of the cell, there was only a slight increase in the reaction force when the intermediate filaments were added [
35].
After validating the model, the mechanical behavior of the cell components was considered separately. As expected, the cytoskeleton supports the largest portion of the reaction force compared to the others. The cytoplasm supports the second-largest part of the reaction force. The NSK and membrane created reaction forces in the same range but with a different slope. The F-δ curve slope of the NSK was larger than that of the membrane, while the cytoplasm and membrane had approximately the same slope. Therefore, one may conclude that the NSK has a higher curve slope than the cytoplasm and, as a result, it is stiffer than the membrane and cytoplasm.
Finally, the contribution of each one of the subcellular organelles was evaluated. Analysis of each component of the model resulted in the percentage of their participation in response to the external load applied to the whole model. The results showed that 90.4% of the cell’s mechanical response is due to the CSK. A cytoplasm was responsible for 9.15%, and the membrane and NE, as two shell parts carry only 0.05% of the external load. The other 0.45% can be attributed to the NSK.
In this research, several regular geometrical shapes were chosen to model the organelles because the exact shapes of these components are quite complex and they are often connected with irregular patterns in living cells. The approach and procedure described here was utilized for a round cell attached to the substrate. However, it can be used for other cell shapes, different mechanical stimuli, other cells in the suspension situation (like erythrocyte) and different physiological conditions (like osteocyte in the lacuna). This study will be continued in the future to investigate nonlinear material properties and with models that include more cellular components.


