Article

Improving Soil Nitrogen Availability and Rice Growth Performance on a Tropical Acid Soil via Mixture of Rice Husk and Rice Straw Biochars

by
Gunavathy Selvarajh
,
Huck Ywih Ch’ng
*,
Norhafizah Md Zain
,
Palsan Sannasi
and
Siti Nuurul Huda Mohammad Azmin
Faculty of Agro-Based Industry, Campus Jeli, University Malaysia Kelantan, Kelantan 17600, Malaysia
*
Author to whom correspondence should be addressed.
Appl. Sci. 2021, 11(1), 108; https://doi.org/10.3390/app11010108
Submission received: 1 December 2020 / Revised: 21 December 2020 / Accepted: 22 December 2020 / Published: 24 December 2020

Abstract

:

Featured Application

This research focuses on using an environmentally friendly technology (mixture of rice straw and rice husk biochars) to sustainably minimize ammonia volatilization, increase soil nutrient retention, and improve rice plant nutrient uptake and use efficiency. The mixture of rice straw and rice husk biochars has a larger surface area and numerous pores to chelate ammonium and nitrate ions. This process will fundamentally reduce the loss of ammonia via volatilization from urea fertilizer being applied, thus reducing the excessive use of urea fertilizer in agricultural sector. The biochar at 5 and 10 t ha−1 significantly minimized ammonia volatilization by 33.5–40.7%. It resulted in an increase of nutrient uptake, use efficiency, and dry matter production of rice plant. This work may not only contribute to the reduction of urea fertilizer import bill of Malaysia, but also pave the way for better means of adding value to the agricultural waste to avoid environmental pollution. It also contributes to increasing rice production by solving the problem of ammonia loss from urea fertilizer in tropical acid soil.

Abstract

Nitrogen deficiency frequently occurs at agricultural soil because of NH3 volatilization to the environment which results in low urea-N use efficiency by rice plants. A pot experiment was conducted to assess the synergistic effects of a mixture of rice straw and rice husk biochars (RSRH) on (1) total N, soil exchangeable NH4+, and available NO3, and (2) uptake of N, P, and K in rice plant. RSRH biochar at 5 and 10 t ha−1 had significantly minimized ammonia volatilization by 33.5% and 40.7%. Further, RSRH biochars also had significantly increased available NH4+, NO3, available P, and available K in the soil over T1. In line to increase in soil nutrient availability, the rice plant height, tiller number, greenness, and panicle number were increased. This resulted in an increase of nutrient uptake, use efficiency, and dry matter production of the rice plant. RSRH biochar altered the soil environment by minimizing NH3 loss and increasing soil nutrients for efficient plant uptake.

1. Introduction

Asian countries grow rice (Oryza sativa L.) in a huge acreage, where the production and consumption is the highest. Rice is cultivated in different diverse ecosystems, and irrigated lowland rice is the most important rice ecosystem in Malaysia [1]. Rice production in Malaysia is the highest at the irrigated lowland rice system because it is more economical and reliable. Although rice growers prefer irrigated lowland system for rice production, there are many arising problems in rice fields, such as increased fertilizer application rate due to volatilization or leaching of nitrogen (N), which leads to poor rice crop growth [2,3]. Plants need N the most during the vegetative stage for proper growth and cell division, but the volatilization of N from applied urea fertilizer reduces the availability of N in the soil. To overcome the deficiency of N in the soil, rice growers tend to add excessive and unreasonable amounts of inorganic fertilizer, which adversely affect the quality of the environment [4]. These practices do not only waste the fertilizer and degrade nature, but are also costly. Major N loss from applied urea in irrigated lowland rice systems is due to the adoption of the surface applied method [5]. Due to surface application, immediately upon contact with water, urea hydrolyses and is lost through ammonia (NH3) volatilization [6]. It also agreed that a main pathway of applied N loss in cropping systems is through NH3 volatilization [7]. The urea-N volatilization process needs to be minimized in the agricultural field in order to increase the rice plant N uptake and yield.
Agricultural waste can be used since it is cost effective, renewable, and abundant [8]. Rice residues such as rice straw and rice husk are one of the agricultural wastes that can be found in abundance and are being burnt to avoid excessive accumulation. One promising management approach is to convert the agricultural wastes into biochar. Recently, there has been much renewed interest in using biochar in the agricultural field as a soil ameliorant [9]. Turning rice residues to biochar can reduce the wastage problem and environmental pollution.
Biochar as an organic amendment offers a wide variety of benefits to the soil environment. It is a carbon-rich product obtained from wood, paper, manure, or wheat straw burned in a pyrolyzed condition [10]. Yeboah et al. [11] stated that biochar enhances soil nutrient retention, which overall reduces the total fertilizer requirements in agricultural soil. Further, a study by Yang et al. [12] concluded that biochar has a large surface area and numerous pores which aids in ions’ adsorption capacity. These properties of biochar might increase the retention of ammonium (NH4+) and nitrate (NO3) in soil [13]. Retention of NH4+ and nitrate NO3 in soil is crucial for plant uptake and utilization. Further, biochar has a higher cation exchange capacity (CEC) value which further aids in more nutrient retention and increases its potential to be an adsorptive agent [14]. Biochar application reduces NH3 volatilization successfully and retains more nutrients in soil.
Previously, rice husk biochar had been used for C sequestration and to minimize greenhouse gas emission in rice fields [15]. Rice fields are known as a major source of atmospheric greenhouse emission. Mohammadi et al. [16] stated that rice straw and rice husk conversion into biochar and its application reduced methane gas emission in the rice cultivation area. Much research has been conducted in rice fields by using biochar for C sequestration and climate mitigation, but there is little research on soil amendments. Hence, there is a need to know the efficacy of rice straw and rice husk biochar on soil quality improvements. There is also a scarcity of information and research in amending rice straw and rice husk biochars with the soil to minimize NH3 loss in the agricultural field. The interaction between rice straw, rice husk biochar, and urea fertilizer applied in a soil cultivated with rice plant needs detailed research in order to integrate biochar in soil properly to achieve a sustainable management of rice fields. Thus, the objectives of this study were to: (i) Improve soil total N, soil exchangeable NH4+, and soil available nitrate (NO3) by using biochars produced from rice straw and rice husk, respectively, and (ii) determine whether the use of biochars improves N, P, K, Ca, and Mg uptake, nutrient use efficiency, and dry matter production of rice plant.

2. Materials and Methods

2.1. Soil Sampling and Characterization

The soil used in this study was sampled at 0–30 cm from an uncultivated land in Agro Techno Park of University Malaysia Kelantan Jeli Campus, Malaysia (5.6955 latitude and 101.8389 longitude) which has not been cultivated since 2007. The soils were collected randomly from a sampling area of 60 × 60 m. The collected soil samples were air-dried, crushed, and sieved to pass through a 2-mm sieve for initial soil characterization. Soil pH was measured in a ratio of 1:10 (soil:water) by using a digital pH meter [17]. Soil organic matter, ash content, and soil total carbon were determined by using the loss-on ignition method [18]. The total N was determined by using the Kjeldahl method [19]. The double acid method described by Mehlich [20] was used to extract soil available P and exchangeable cations (Ca, Mg, K, and Na), after which the cations were determined by using an atomic absorption spectrophotometer (AAS) (Analyst 800, Perkin Elmer, Norwalk, CT, USA), while soil available P was determined by using the molybdenum blue method of Murphy and Riley [21]. The developed blue color was analyzed by a UV-VIS spectrometer (Thermo Fisher Scientific Genesys 20, Waltham, MA, USA) at 882 nm wavelengths. Soil CEC was determined with the ammonium acetate leaching method [22]. The exchangeable acidity and exchangeable Al3+ were determined by the acid–base titration method described by Rowell [23]. The method described by Keeney and Nelson [24] was used to extract exchangeable NH4+ and available NO3, after which the ions were determined via steam distillation [18].

2.2. Characterization of Rice Husk and Rice Straw

Rice straw collected from the Kemubu granary area, Kota Bharu, Malaysia, and rice husk collected from Pasir Puteh Rice Mill, Malaysia were subjected to analysis of pH [17] and total N [19]. The single dry ashing method [18] was used to extract nutrients from rice husk and rice straw for analysis of Ca, Mg, Na, P, and K. The contents of Ca, Mg, Na, and K were determined by using an AAS (Analyst 800, Perkin Elmer, Norwalk, CT, USA). Meanwhile, total P content was determined by using the molybdenum blue method after which the blue color developed was analyzed using a UV-VIS spectrophotometer (Thermo Scientific Genesys 20, Waltham, MA, USA) [21]. Organic matter, ash content, exchangeable NH4+, available NO3, and CEC were determined by using the aforementioned methods in the soil characterization section.

2.3. Rice Husk and Rice Straw Biochar’s Production and Activation

Two cylindrical kilns, 200 L, with removable chimney caps and an air-tight 110-L drum, were constructed for biochar production. Rice straw and rice husk were bulked separately inside the 110-L drum and closed before being placed in the middle of the 200-L drum, where the fire was kindled starting from the bottom of the drum. The burning time was 4–6 h, with temperature ranging from 300–400 °C and left for cooling for 12 h. After that, the pile of biochar samples was spread out for cooling. Next, activation of biochar was carried out by soaking the biochar with 5% chicken slurry for 7 days, which later was dried and stored in a big container for further use. Activation of biochar with chicken slurry is crucial to further increase the nutrient content, alter the surface area, and increase the pore size [25]. The analysis conducted for biochar characterization is similar to those of aforementioned characterizations of soil and rice straw. Additionally, microanalysis through scanning electron microscopy attached with energy dispersive X-ray spectroscopy analysis (SEM-EDX JEOL JSM 6400) was carried out to analyze the surface morphology of rice husk and rice straw biochars.

2.4. Ammonia Loss Incubation Study

The NH3 loss incubation study was conducted by using a close-dynamic air flow system [26,27,28]. The system came with an exchange chamber of a 250-mL conical flask containing the soil mixture and a 250-mL conical flask containing 75 mL of boric acid, which were both stoppered and fit with inlet/outlet pipes. The inlet of the chamber containing water was connected to an air pump and the outlet was connected by pipe tubing to the trap containing boric acid solution. This setup was done to create soil aeration and trap NH3 loss via the volatilization process.
Soil and the rice straw + rice husk biochar mixture (RSRH) at rates of 5, 10, 15, and 20 t ha−1 were mixed well before being deposited into the 250-mL conical flask followed by the addition of 175 kg ha−1 of urea. The produced biochars were compared with a commercial biochar potting media to compare the efficacy in reducing NH3 loss. For commercial biochar potting media mixture, 50% soil was mixed well with 50% commercial biochar potting media, and in another treatment 100% commercial biochar potting media was used. Later, urea was added into the commercial biochar potting media mixture. Next, water was added to create a waterlogged condition. The water level was marked in a conical flask and maintained 3 cm above the soil throughout the incubation study period. The boric acid solution was replaced every 24 h and back-titrated with 0.01 M HCl to determine NH3 loss from the applied urea. The measurement was continued until the NH3 decreased to 1% of the added N to the system [29]. After the ammonia volatilization study period, the soil samples were taken and the pH, exchangeable NH4+, and available NO3 were determined. Treatments were arranged in a completely randomized design (CRD) with three replications, as shown in Table 1.

2.5. Pot Experiment

After the completion of the laboratory NH3 loss incubation study, a pot experiment was conducted in a netted house located at the University Malaysia Kelantan Jeli Campus, Malaysia. Only 5 treatments were selected and carried forward to the pot experiment from the ammonia volatilization study. Treatments with 15 and 20 t ha−1 RSRH biochar were excluded. Application of 15 and 20 t ha−1 did not minimize NH3 loss significantly compared to 5 and 10 t ha−1 RSRH biochars. Hence, low rates of RSRH biochar application (5 and 10 t ha−1) were chosen since they were more economical. Treatments with soil only, soil + urea, and 50% and 100% commercial potting media were carried forward to the pot experiment to serve as a comparison to RSRH biochar effectiveness in minimizing NH3 loss and nutrient retention in soil, and improving plant nutrient uptake.
Rice plant (cultivar MR297) was used as a test crop in the pot experiment and the seedlings were planted in pots (23 height, 23 wide, and 23 cm diameter) which were filled with 5 kg of 5-mm sieved soil. Before planting, MR297 rice seeds were germinated in plastic trays filled with germination medium. The biochar rates of 5 and 10 t ha−1 were mixed thoroughly with the soil 24 h before transplantation of rice seedlings into the pot on the seventh day. Three rice seedlings were planted in each pot, equivalent to three seedlings per hill [30]. The water level in each pot was maintained at 3 cm from the soil surface. After seven days of transplantation, N, P, and K fertilizers in the form of urea (46% N), Christmas Island Rock phosphate (32% P2O5), and Muriate of Potash (60% K2O) were applied at rates of 175, 97.8, and 130 kg ha−1, respectively. These rates were scaled down based on the recommendation of Muda Agricultural Development Authority, Malaysia [31] with some modifications where the urea was increased to 175 from 151 kg ha−1 for 5 kg soil per pot. The fertilizers were applied in a three-equal split at 7, 30, and 55 days after transplantation (DAT) by surface application. The lists of treatments evaluated in the pot experiment are listed in Table 2.
The pot experiment was carried out in a completely randomized design with three replications in a net house. Plants were checked regularly and monitored up to the heading stage (70 days). The plants were harvested at 70 DAT. This is because the amount of soil used in the pot was not sufficient to support rice plants up to the flowering and ripening stage; thus, it was not economically practical to estimate the yield of rice based on pot experiments. This was in agreement with Palanivell et al. [32].
At the heading stage (70 DAT), the plant height was measured by using a measuring tape. Plant greenness was measured by using the SPAD Meter 502-nm. The number of tillers and number of panicles were counted and recorded. The aboveground parts of the plants were harvested and dried in an oven at 60 °C until a constant weight was attained [33]. The oven-dried plant samples were then grounded by using a grinding machine, after which they were analyzed for total N, P, and K. Total N was determined by using the Kjeldahl method. Meanwhile, the single dry ashing method was used to extract the total P and K in the plant tissues. The filtrates were analyzed by using AAS to determine the total K, and total P was determined by using the molybdenum blue colorimetric method. The concentrations of N, P, and K in the leaf were multiplied by the dry weight of leaves to obtain the amount of N, P, and K uptake by the rice plants. Rice plant nutrient use efficiency was calculated using the method of Dobermann [34].
Nutrient uptake   =   Nutrient concentration   ( % )   ×   plant dry weight   ( g ) Nutrient   use   efficiency   =   A B R × 100
where A = plant nutrient uptake from fertilized soil, B = plant nutrient uptake from unfertilized soil, and R = rate of fertilizer nutrients applied.
The soil samples from pots were collected immediately upon plant harvesting. The soil was air-dried, crushed, and sieved to pass through a 2-mm sieve. Afterwards, the soil samples were analyzed for pH, Electrical conductivity (EC), total N, available P, total organic matter, total C, exchangeable acidity and Al, and exchangeable cations (K, Ca, Mg, Zn, and Fe) by using the aforementioned procedures in Section 2.1 (Soil Sampling and Characterization).

2.6. Statistical Analysis

Statistical analysis for all the data was performed by using SPSS software version 24.0 (SPSS Inc, Chicago, IL, USA). The effect of different rates of RSRH biochar addition on all the treatments was subjected to one-way analysis of variance (ANOVA). Significant differences among treatments were separated by Tukey’s test and considered significant at p ≤ 0.05.

3. Results

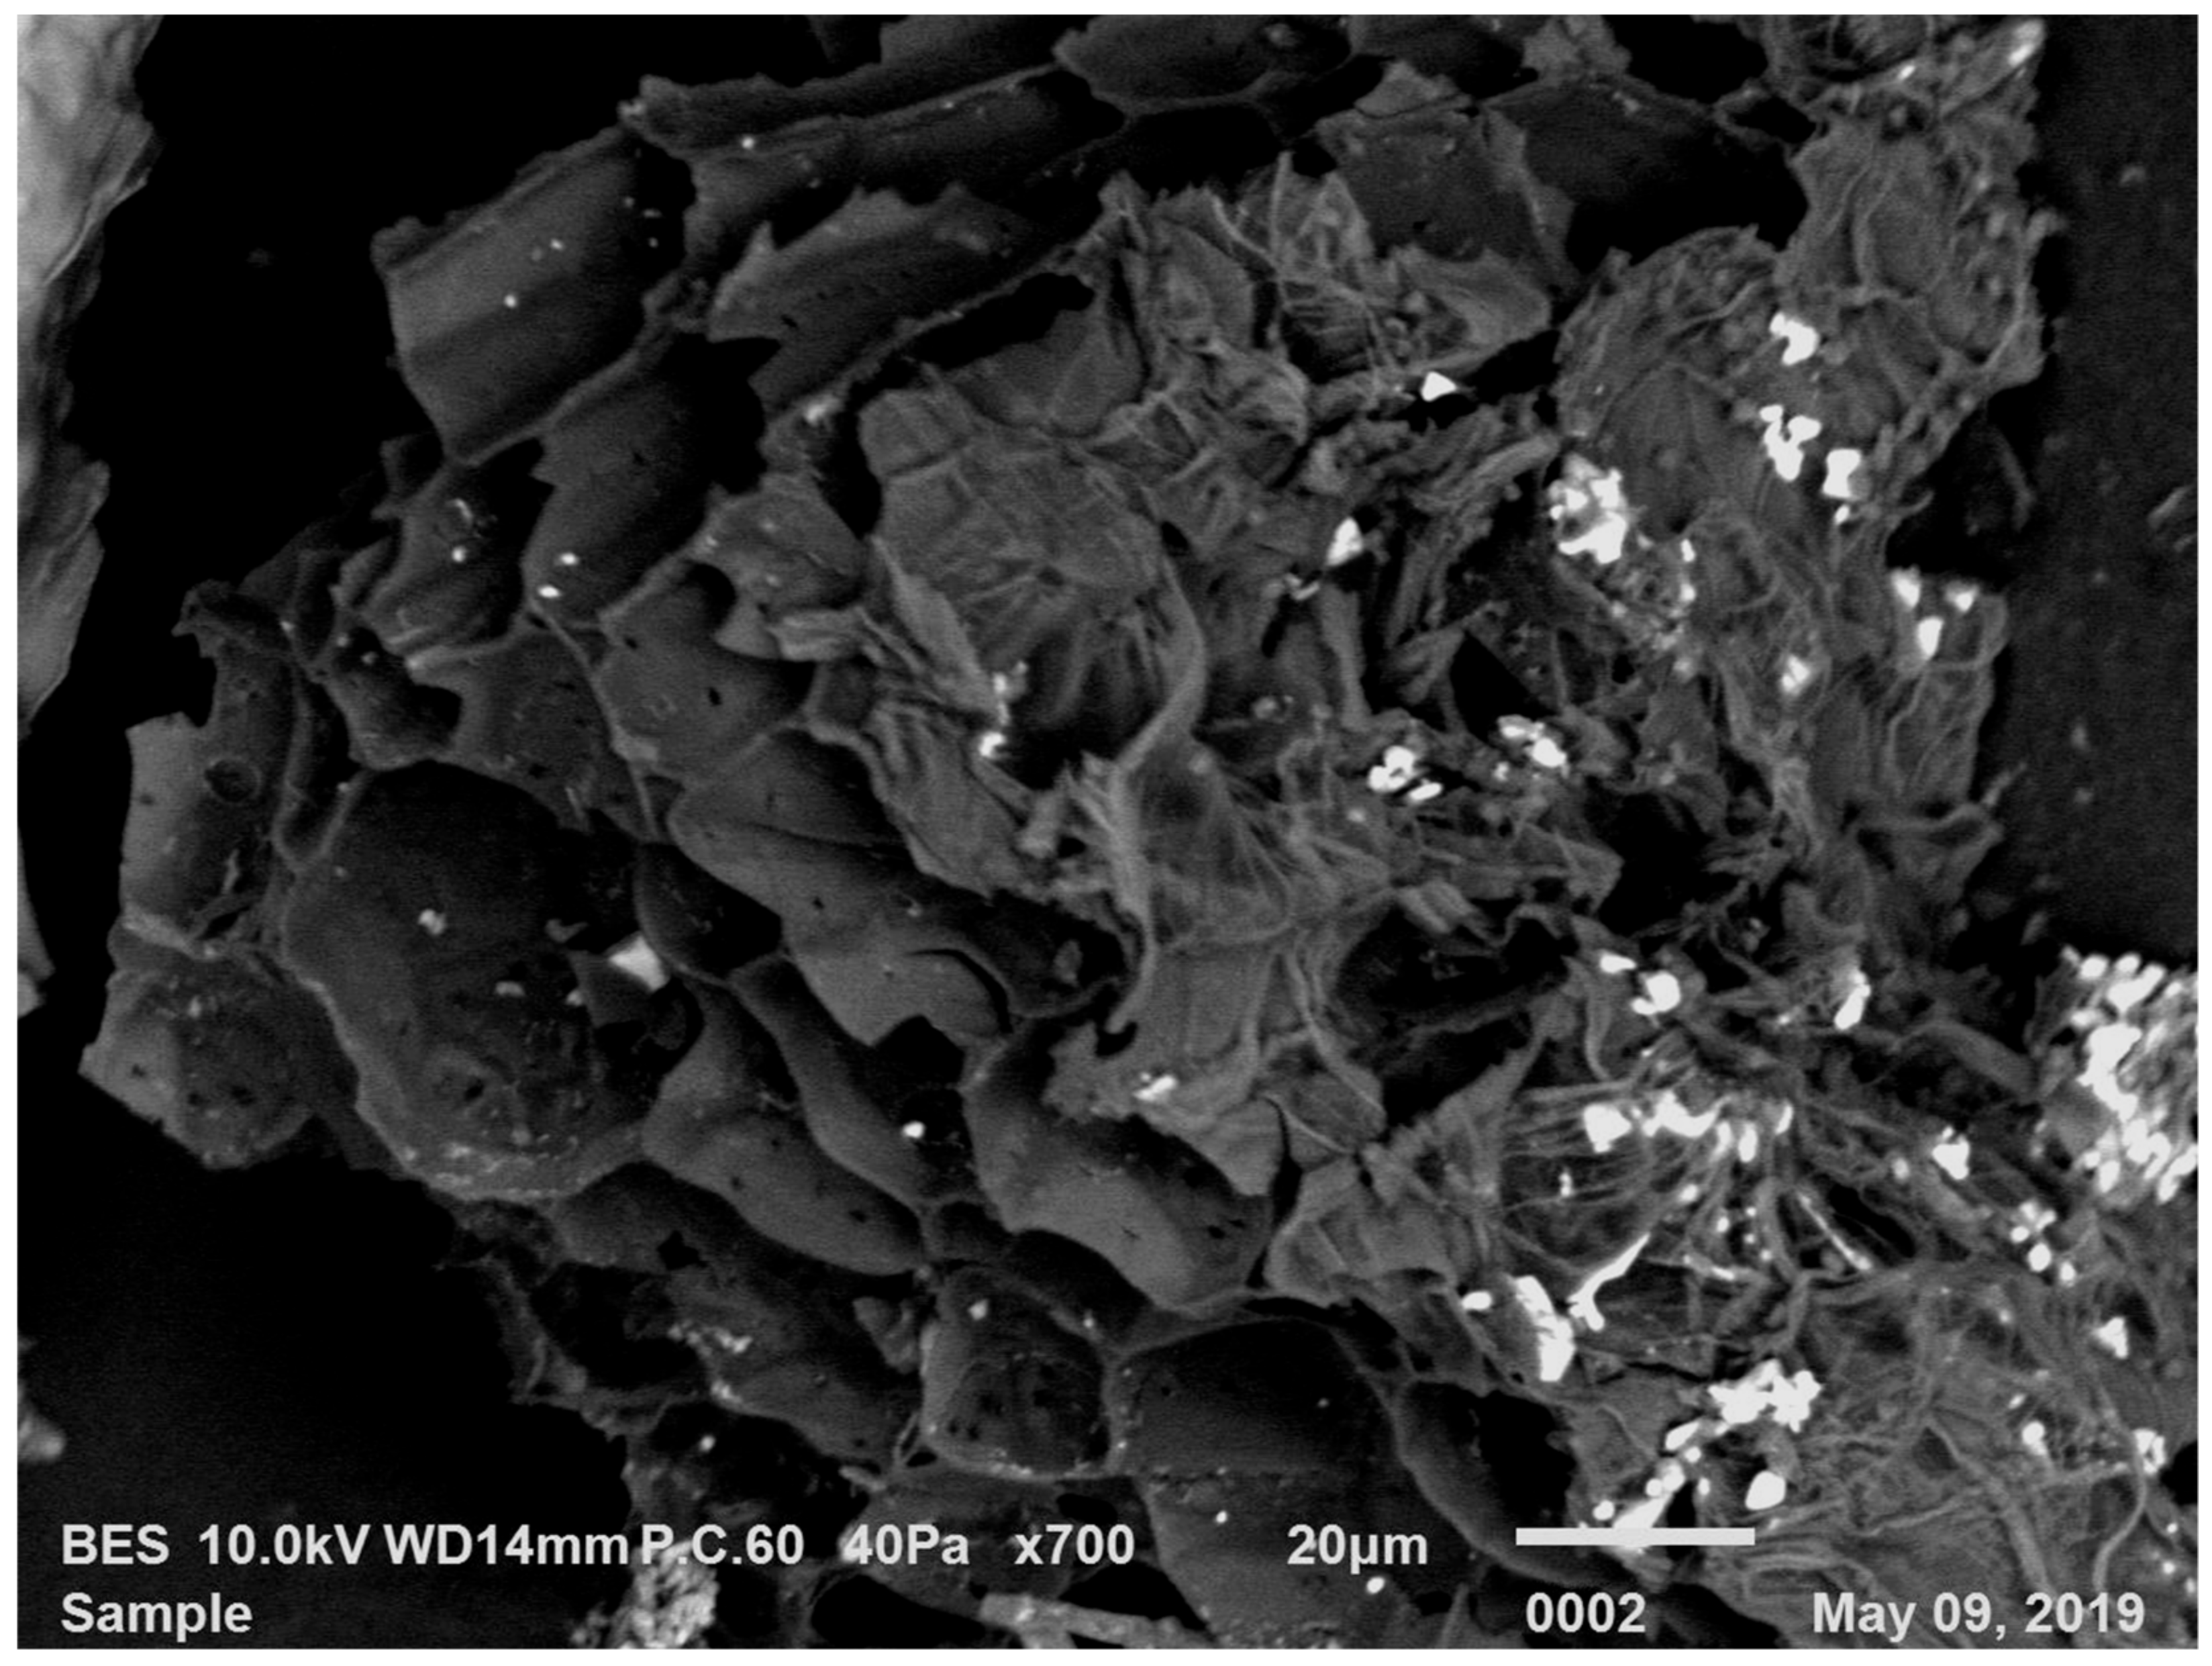
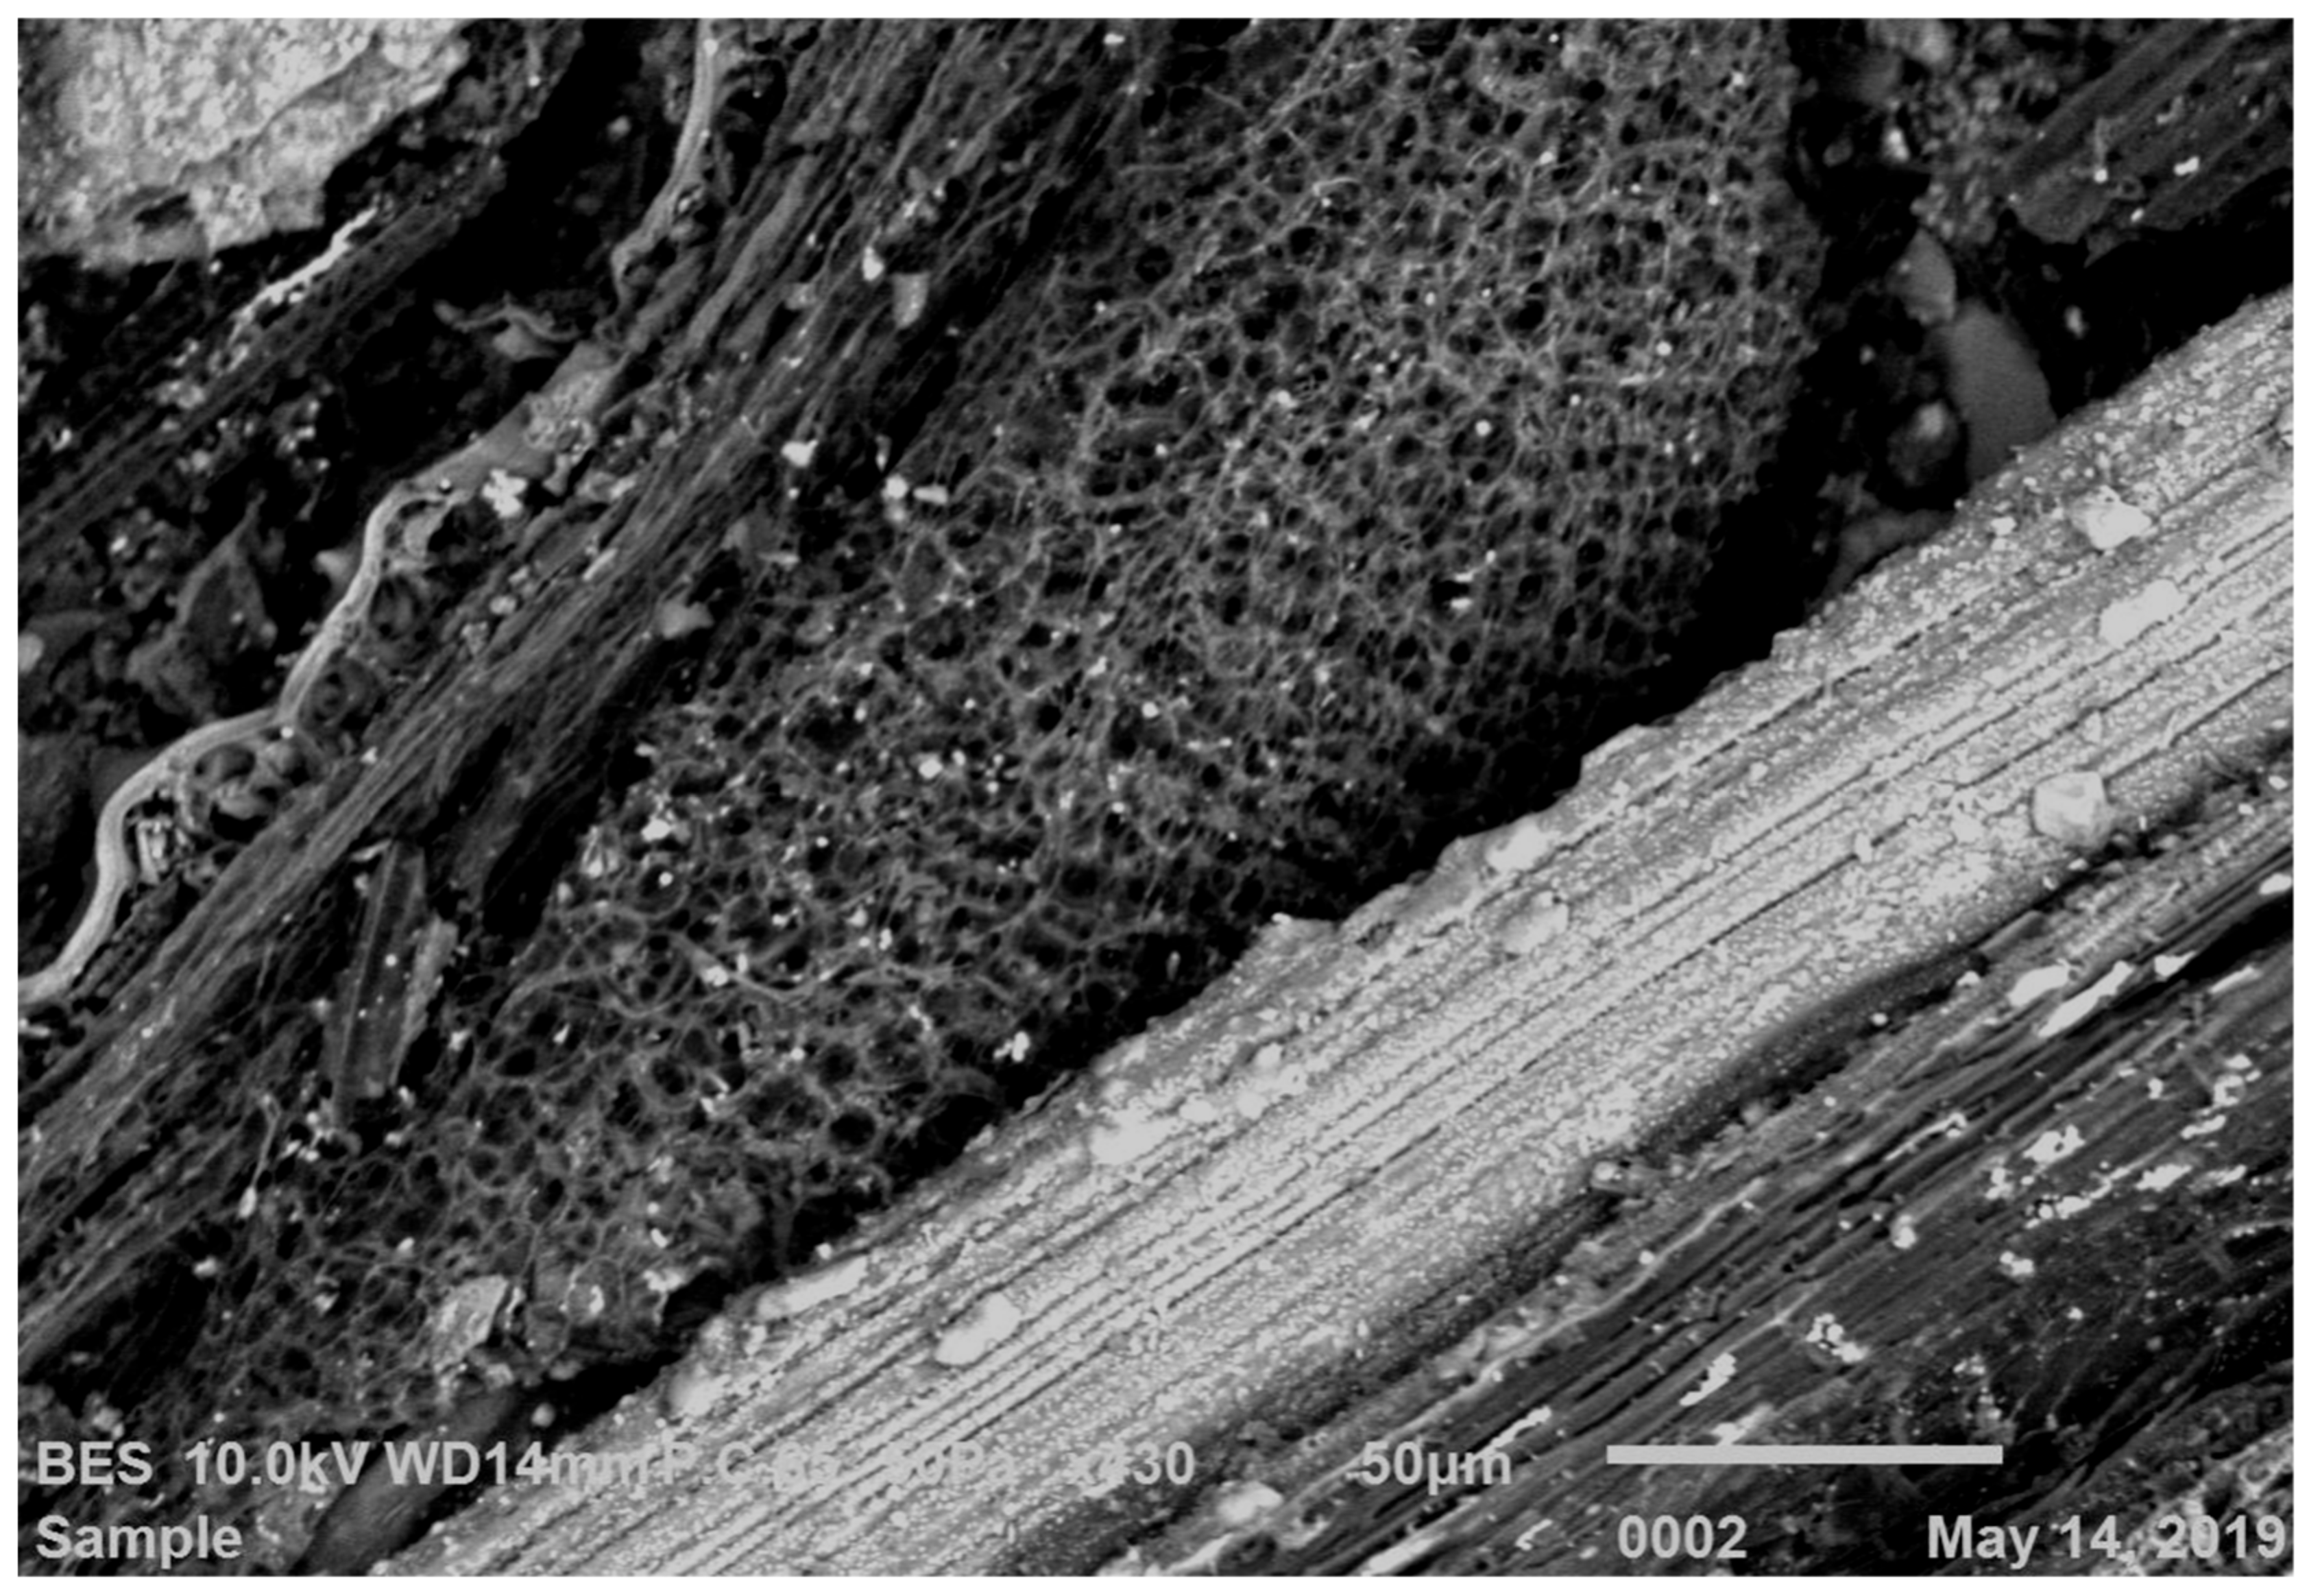
3.1. Characteristics of Soil, Rice Straw, and Rice Husk Biochar

Selected soil physico-chemical properties are profiled in Table 3. The soil was a sandy clay loam and acidic, with a pH of 5.5. The exchangeable acidity, Al, and Fe were higher in the soil. The readily available soil total N, NH4+, and N03 were found to be generally low. Similarly, the available P, K, Ca, Mg, and Na were also low in the soil.
RSRH biochars which were observed under a scanning electron microscope showed that biochar has a larger surface area and comes with numerous pores (Figure 1 and Figure 2). Both biochars had a (pH > 9) with a higher CEC value (Table 4). The available P (14.3%) was very high in the RSRH biochar. The available cations K of RSRH biochar were considerably higher, at 12,030 and 4925 mg kg−1, respectively.

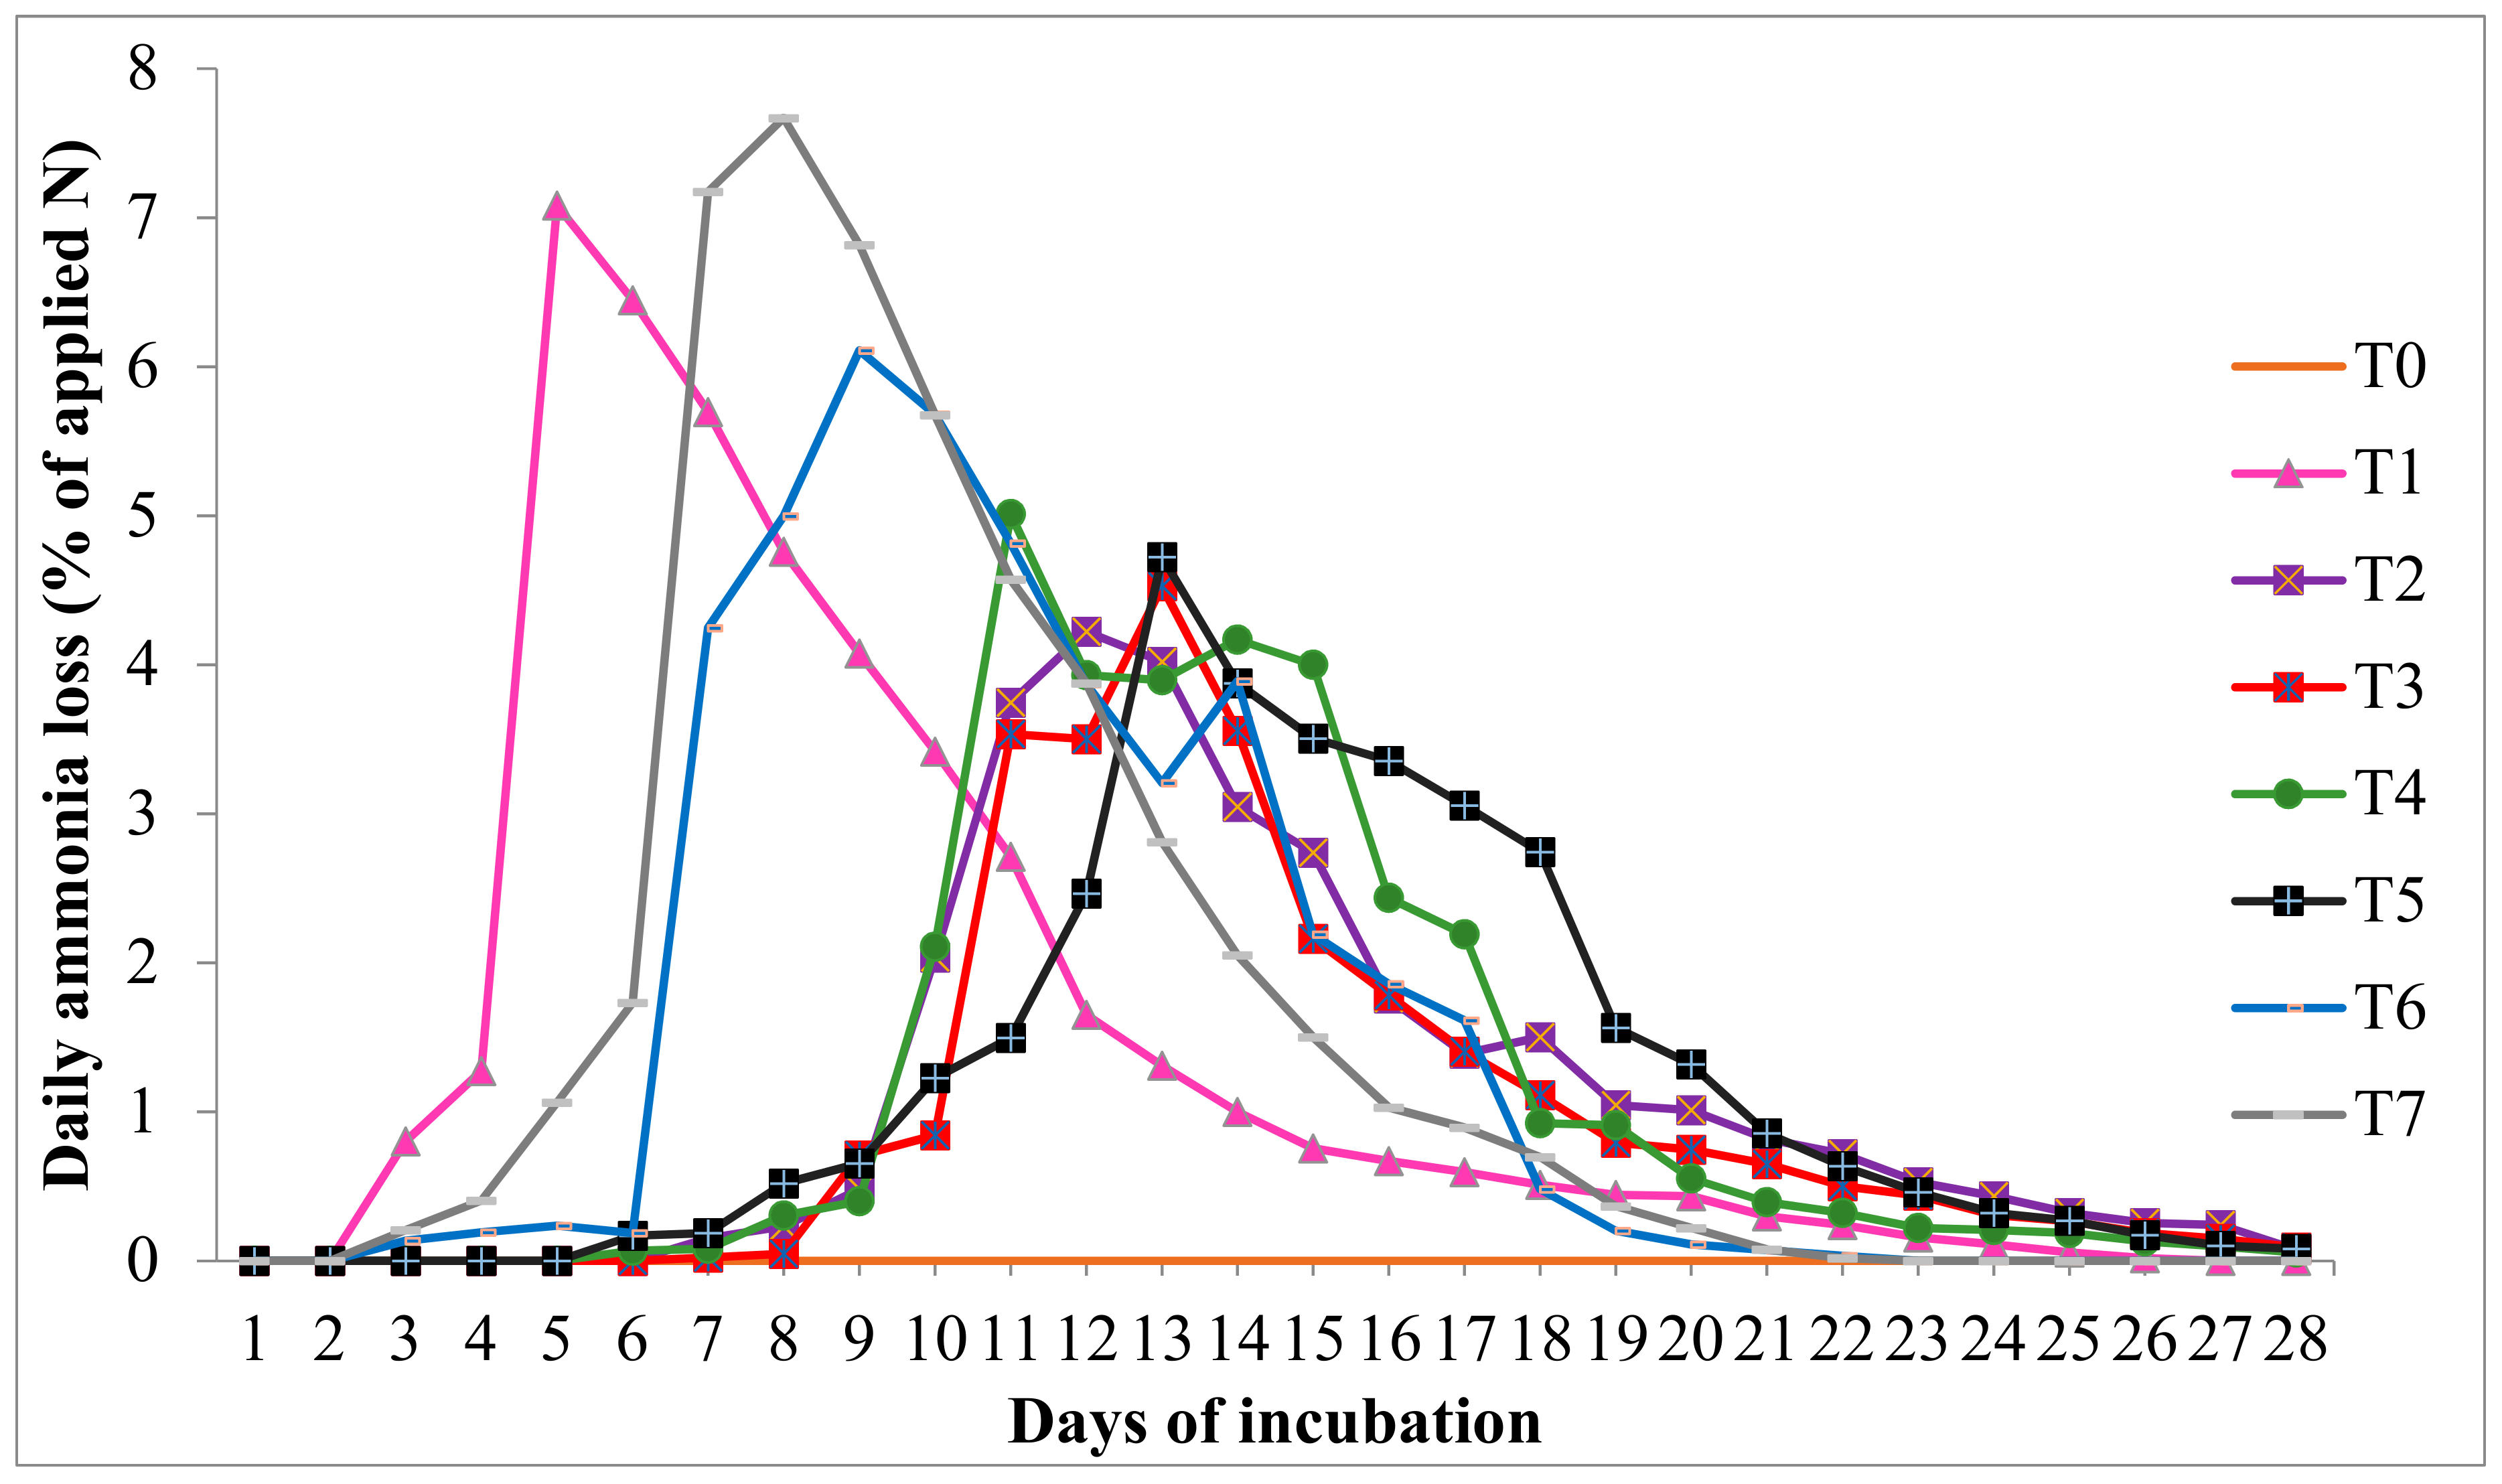
3.2. Ammonia Loss Incubation Study

The daily loss of NH3 from urea fertilizer during the period of the incubation study over 28 days is shown in Figure 3. There was no activity of NH3 volatilization in T0. Meanwhile, in (soil with urea only) T1, NH3 loss started on the second day after the application of urea. The NH3 volatilization started on third day in T6 and T7 (commercial biochar potting media). The loss sped up and peaked on fifth, eighth, and ninth days in T1, T6, and T7, respectively. The NH3 loss in T1, T6, and T7 started early, and similarly it ceased to 1% of added N early in the soil compared to the treatments amended with RSRH biochars (T2, T3, T4, and T5). In T2 and T3, the NH3 loss was delayed by up to 7 days while the loss of NH3 in T4 and T5 was delayed by up to 6 days. In T2 and T3, the loss peaked up on the fourteenth and fifteenth days, respectively; meanwhile, in T4 and T5, the loss peaked up on the twelfth day. The trend of the graph shows that the loss of NH3 peaked up and reduced gradually up to twenty-ninth day, until added urea ceased up to 1%. The treatments with biochar as an additive (T2, T3, T4, and T5) significantly minimized NH3 loss compared to urea without additives (T1) and commercial biochar potting media (T6 and T7) (Table 5). Treatment T3 was more distinct in minimizing NH3 loss, which was about 41% followed by T2, T4, and T5 at 33%, 30%, and 27%, respectively, over T1. Further, the pH of soil amended with RSRH biochars was significantly higher than that of T0, T1, T6, and T7.
Additionally, biochar successfully adsorbed nutrients from the soil. T2, T3, and T4 showed a significant NH4+ retention in soil (Table 5) by retaining the highest amount of NH4+ by 95% and 79%, respectively, over T1, followed by T4 and T5, which were 54% and 12%, respectively. Further, the NO3 ions in the soil were found to be higher in T2 and T3. Commercial biochar potting media T6 and T7 did not show any significant increment in retention of NH4+ and NO3 in comparison to treatments amended with RSRH biochars.

3.3. Soil Analysis in Pot Experiment

Data for soil physical and chemical properties under different biochar treatments sampled after harvesting of rice plant at the heading stage (70 DAT) are presented in Table 6, Table 7, Table 8 and Table 9. The total N in the soil was significantly higher in T2 and T3 compared with that in T0, T1, T4, and T5 (Table 6). However, there was no significant difference in soil total N among treatments amended with RSRH biochar (T2 and T3). Similarly, the results showed that there was no significant difference in the retention of NH4+ and N03 in between T2 and T3. Both treatments amended with RSRH biochar significantly increased the soil exchangeable NH4+ and N03 over the rest of the treatments.
The pH (H2O) of the soil with organic amendments (RSRH biochar) (T2, T3, T4, and T5) increased significantly compared with those without organic amendments (T0 and T1) (Table 7). The increase in the soil pH was consistent with that of the incubation study (Section 3.2). Soil EC was found to be significantly higher in treatments amended with RSRH biochar (T2 and T3) over T0 and T1. Further, T2 and T3 also showed a significant (p < 0.05) increment in total organic matter and total C compared to other treatments (Table 7). In addition, treatments with RSRH biochar (T2 and T3) also significantly increased the soil CEC compared to other treatments (Table 8).
The treatments with RSRH biochar (T2 and T3) significantly reduced the soil exchangeable acidity over T0, T1, T4, and T5 (Table 8). However, T2 and T3 did not reduced the soil exchangeable Al and Fe significantly in comparison to the soil alone (T0) and soil + urea (T1), but the RSRH-amended treatments reduced the soil exchangeable Al and Fe significantly compared to commercial biochar potting media (T4 and T5). Even though there was no significant reduction in Al and Fe in T2 and T3, nevertheless T2 and T3 had increased the soil available P significantly over the rest of the treatments (Table 8). Similar observations were observed in T2 and T3 for available K and Ca (Table 9). However, there was no significant difference in retention of available Mg and Zn in between all the treatments.

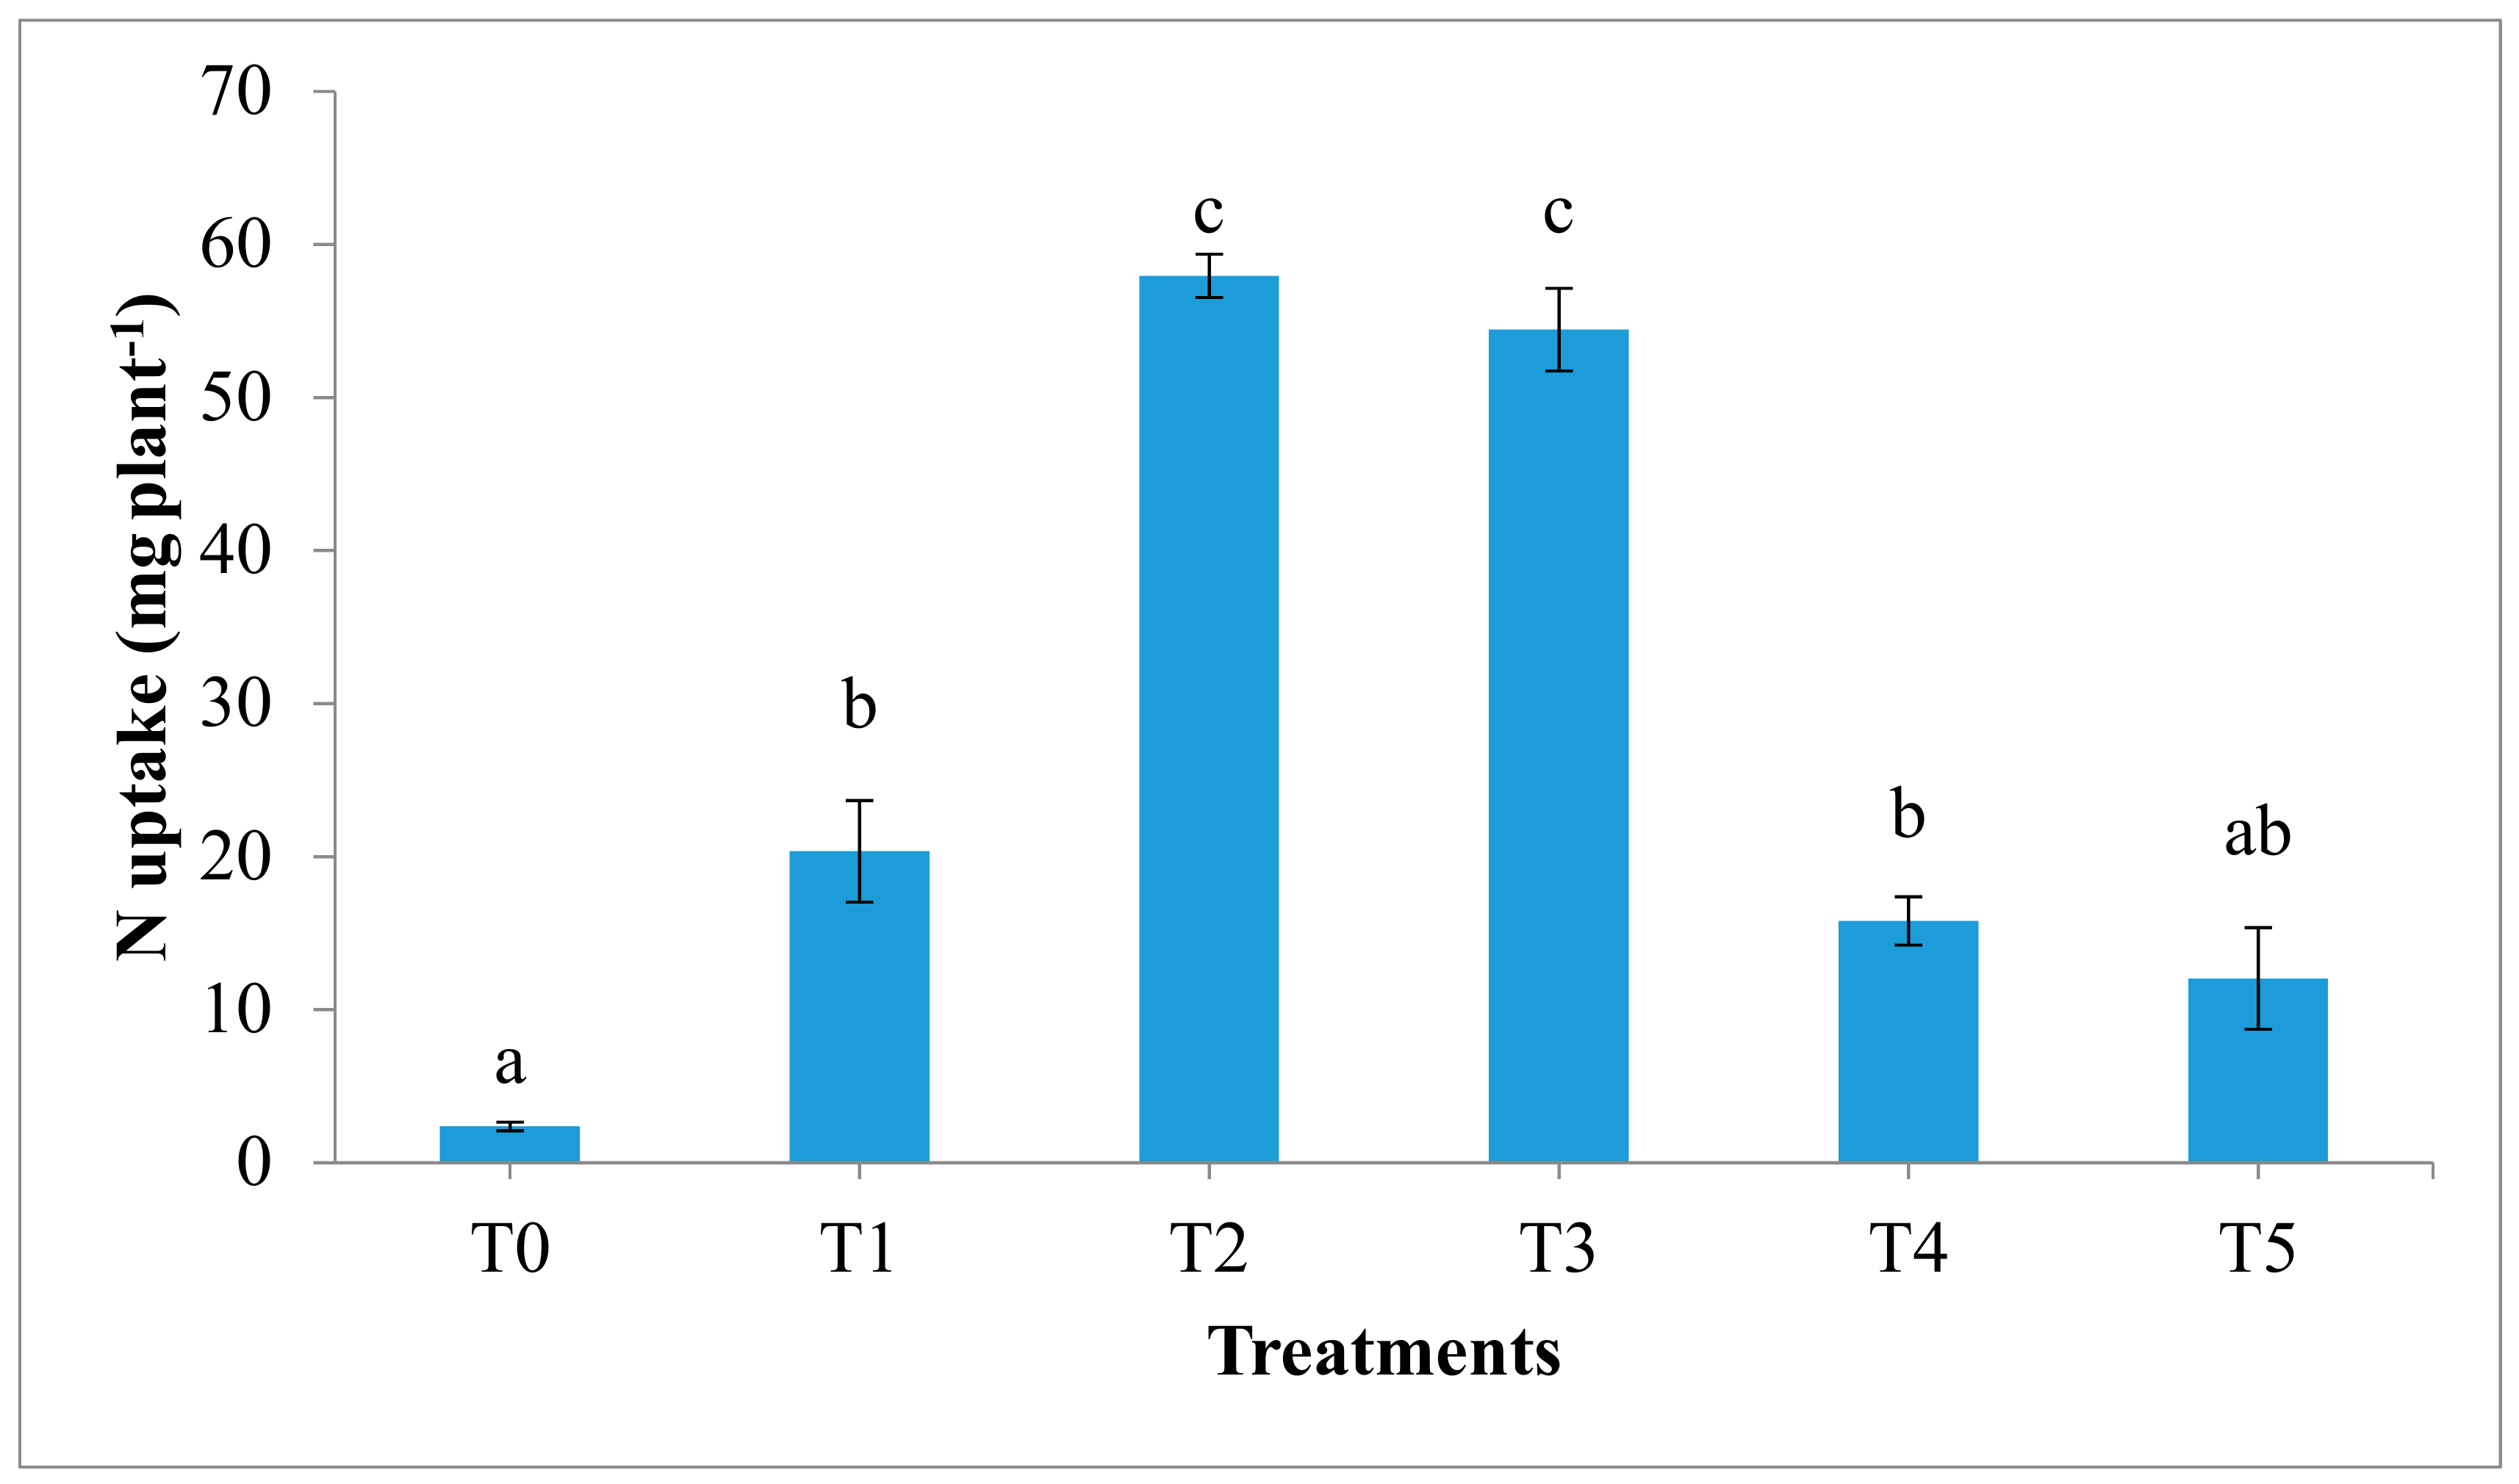
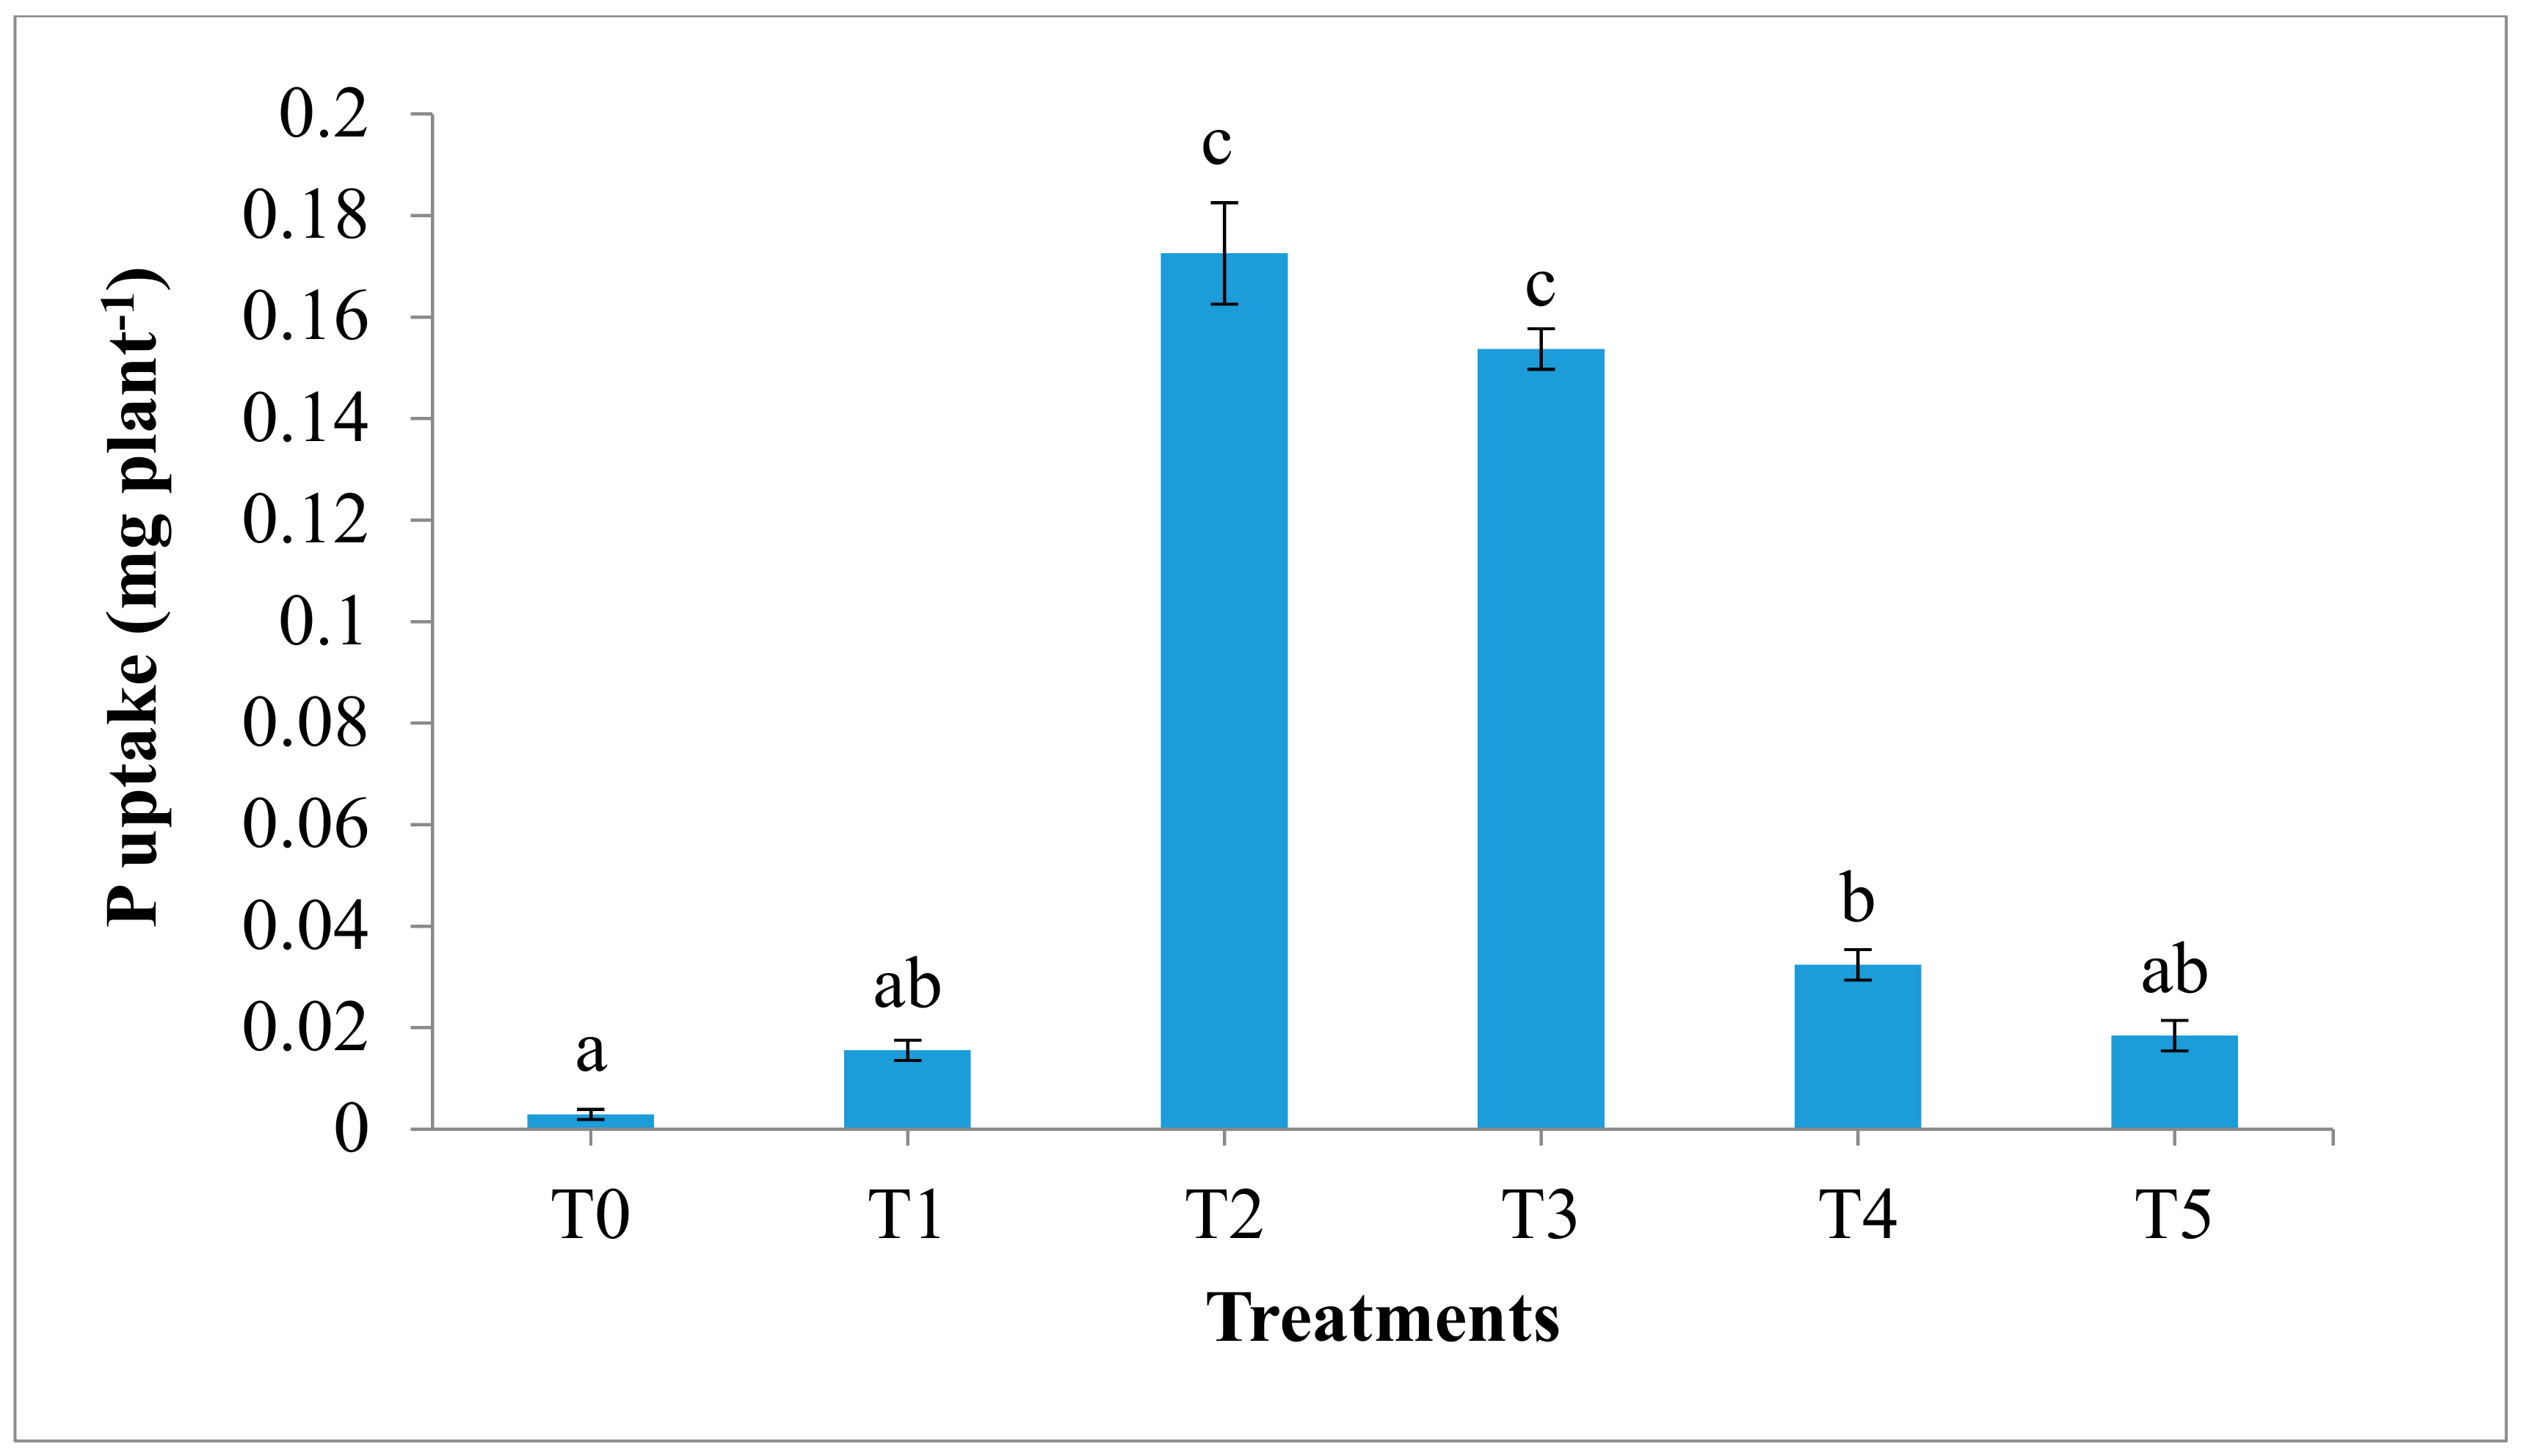
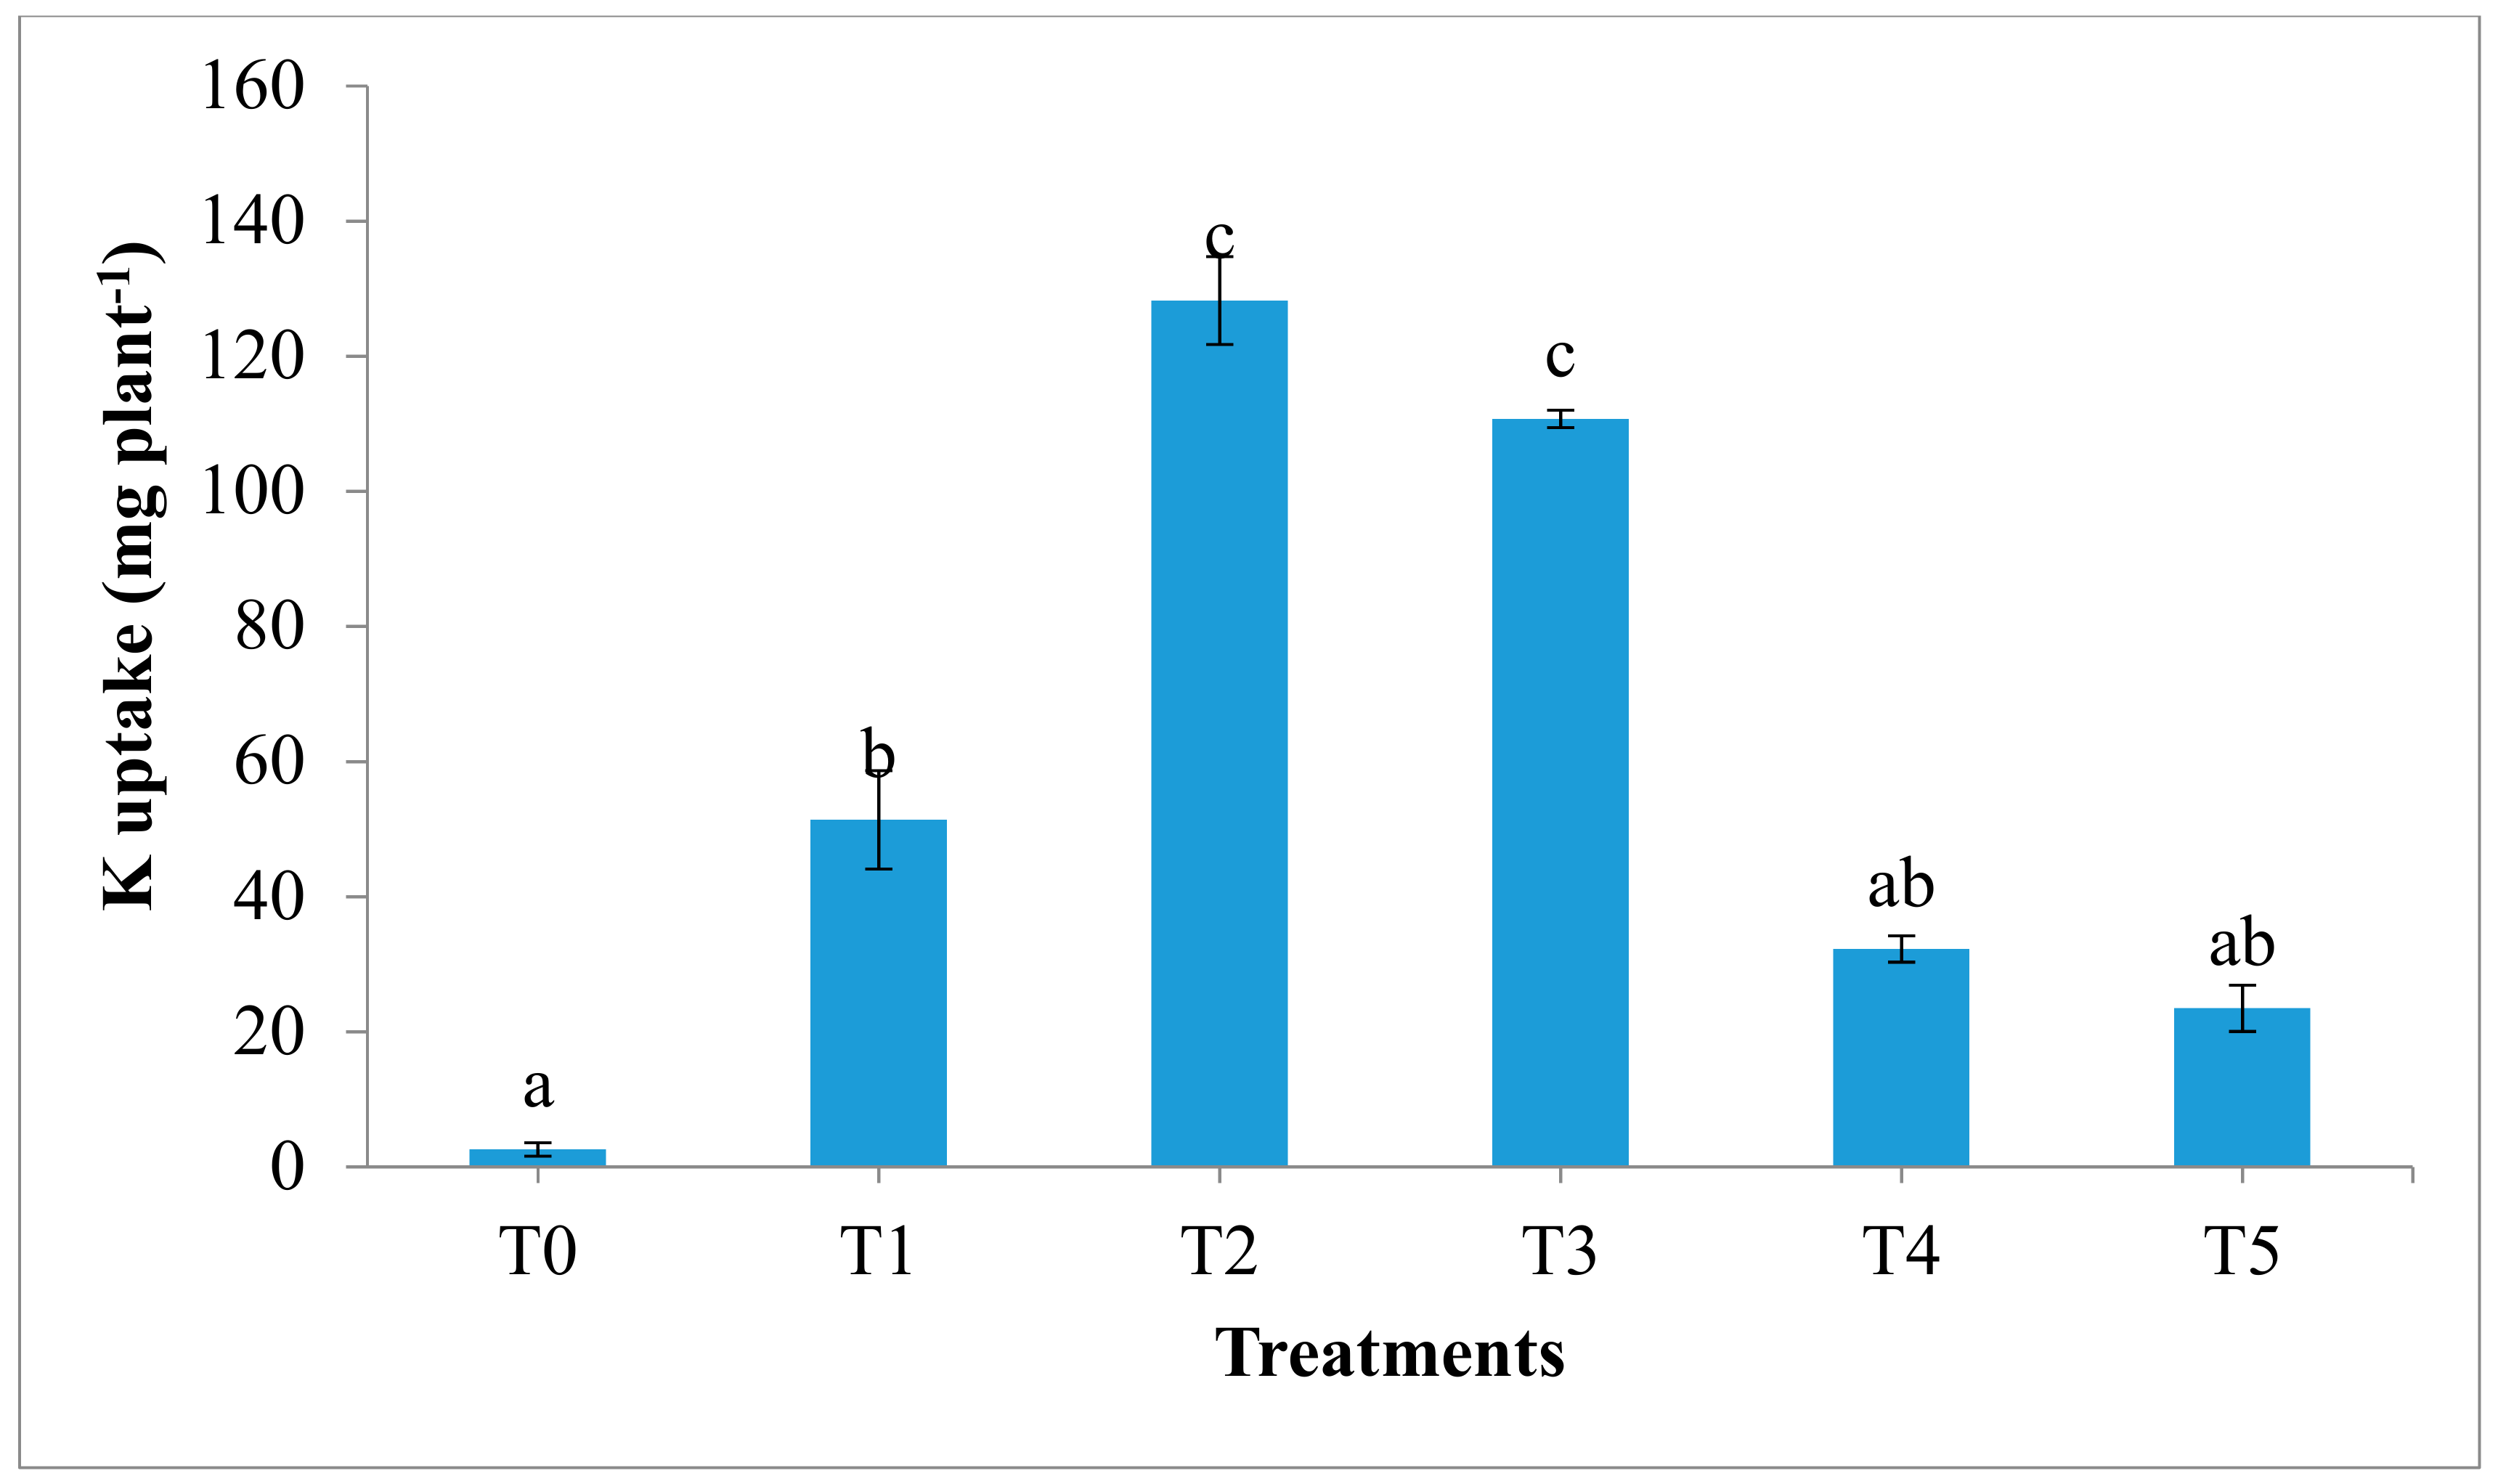
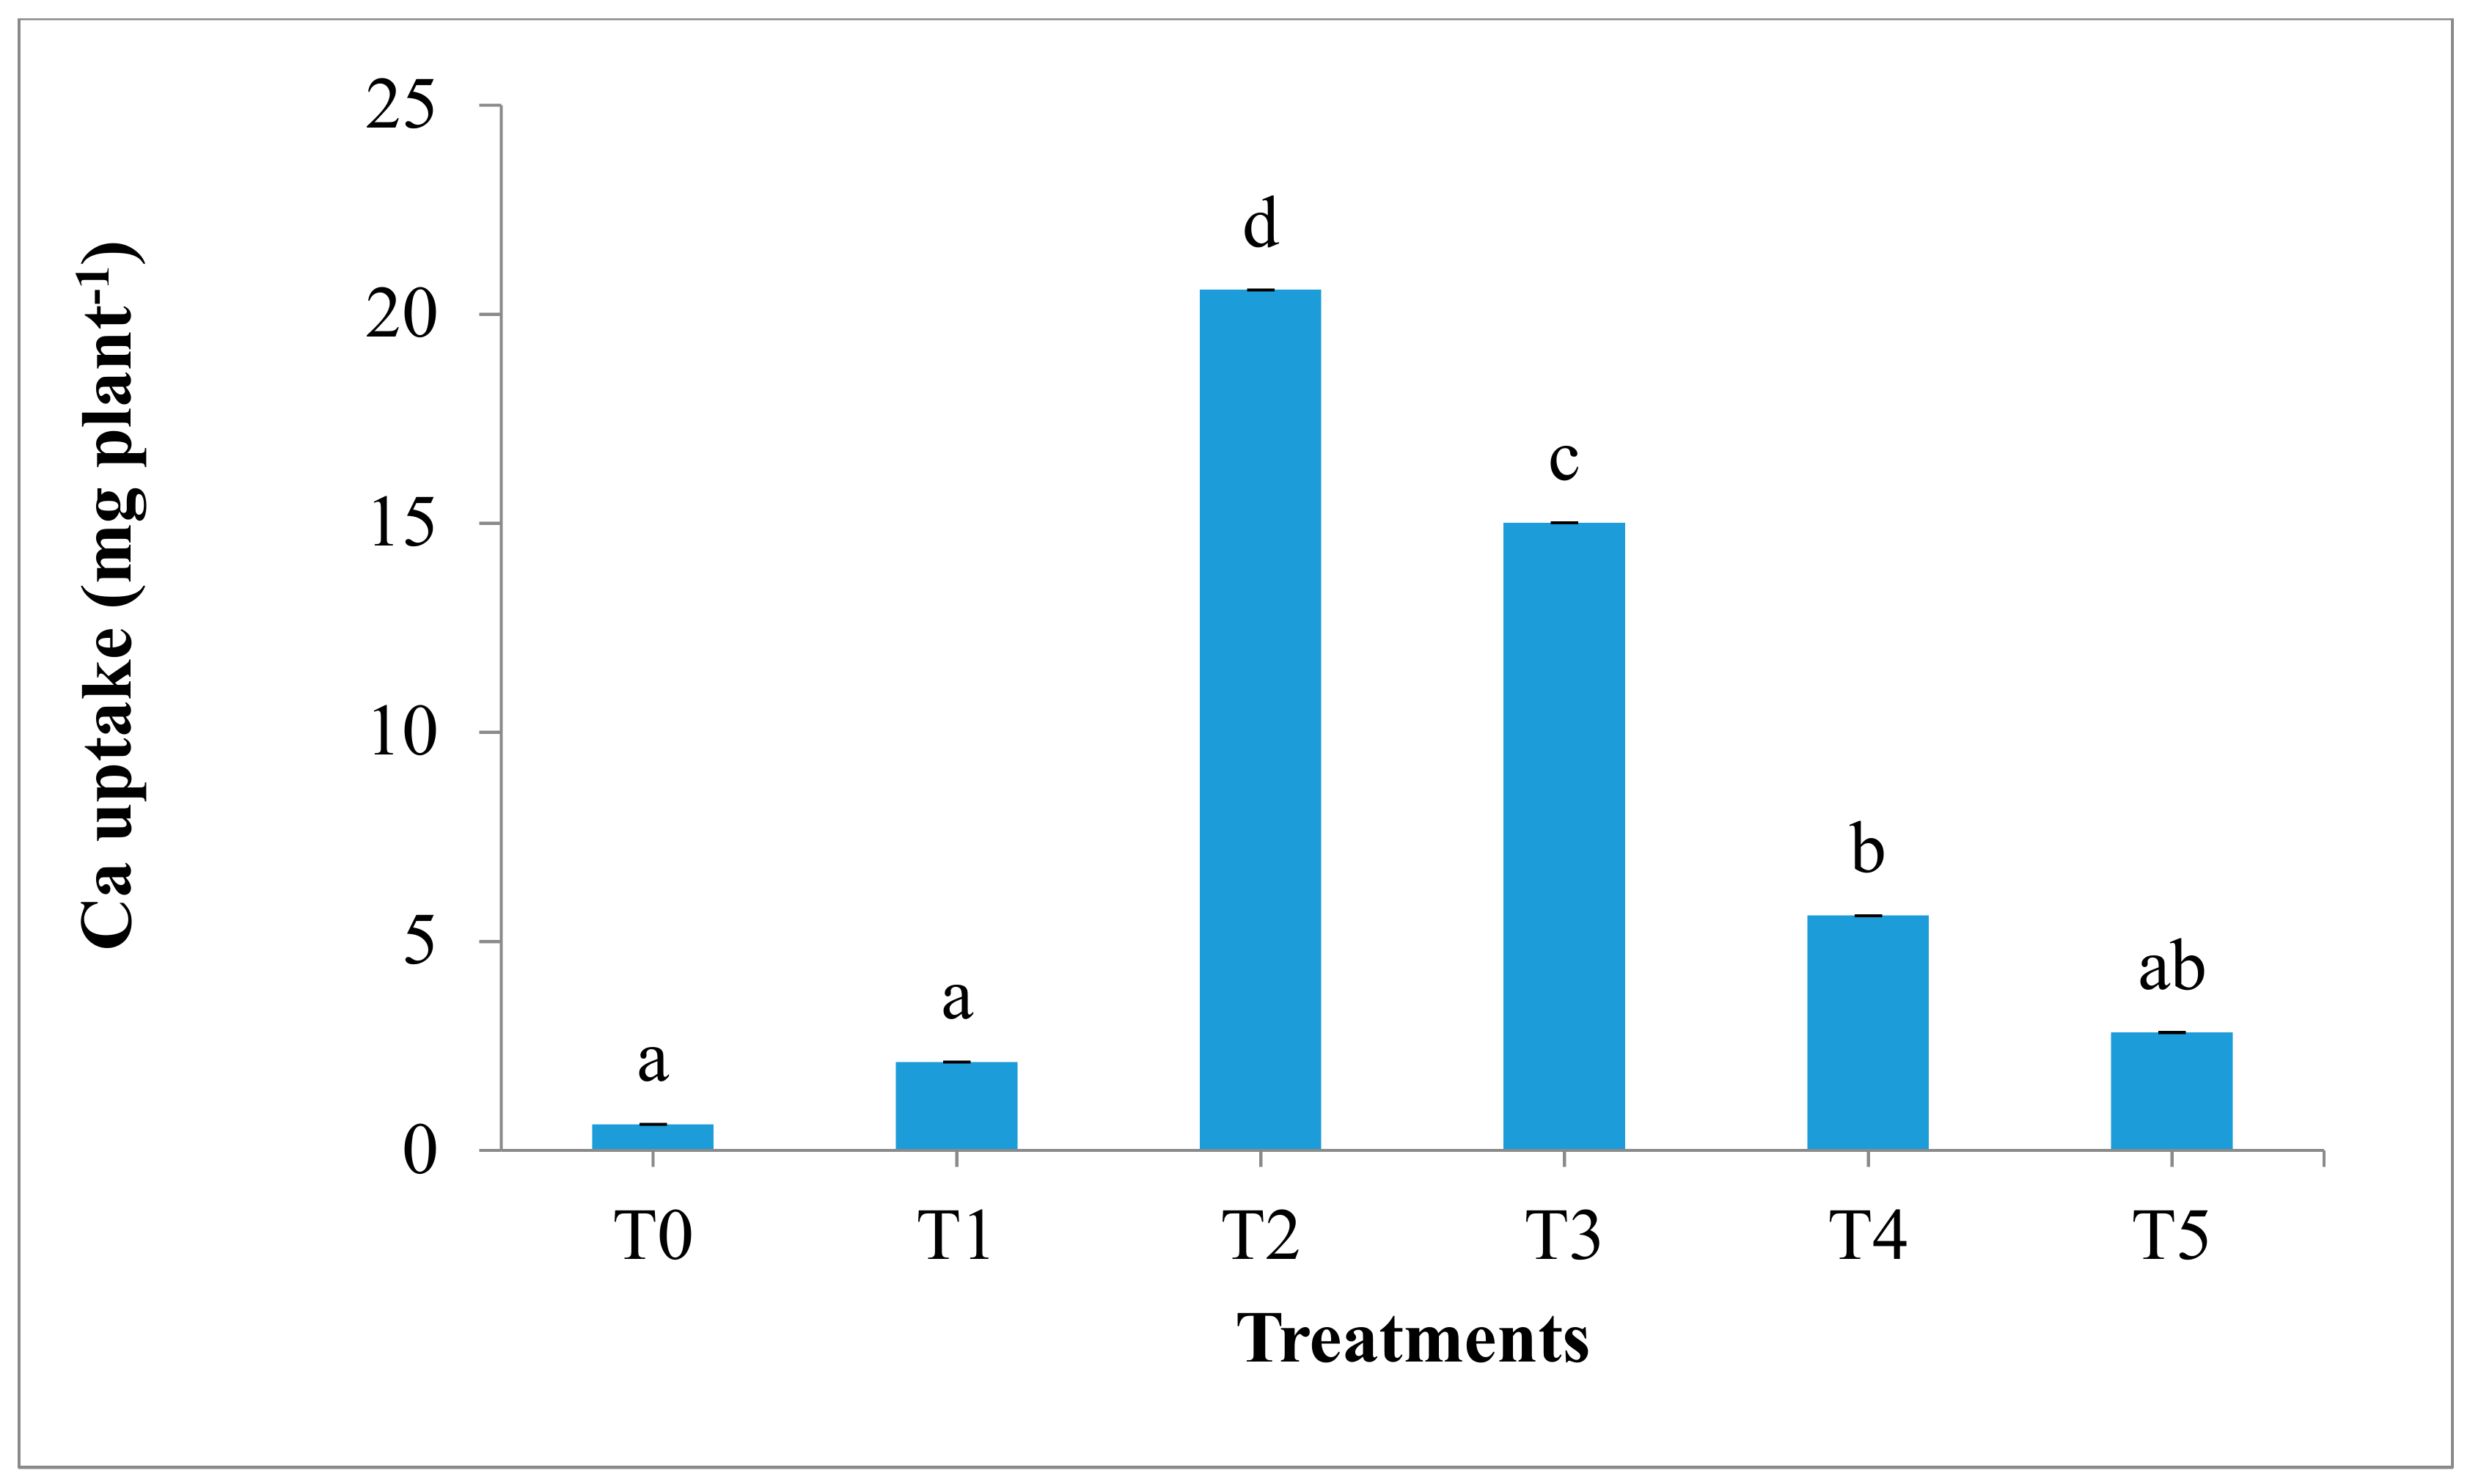
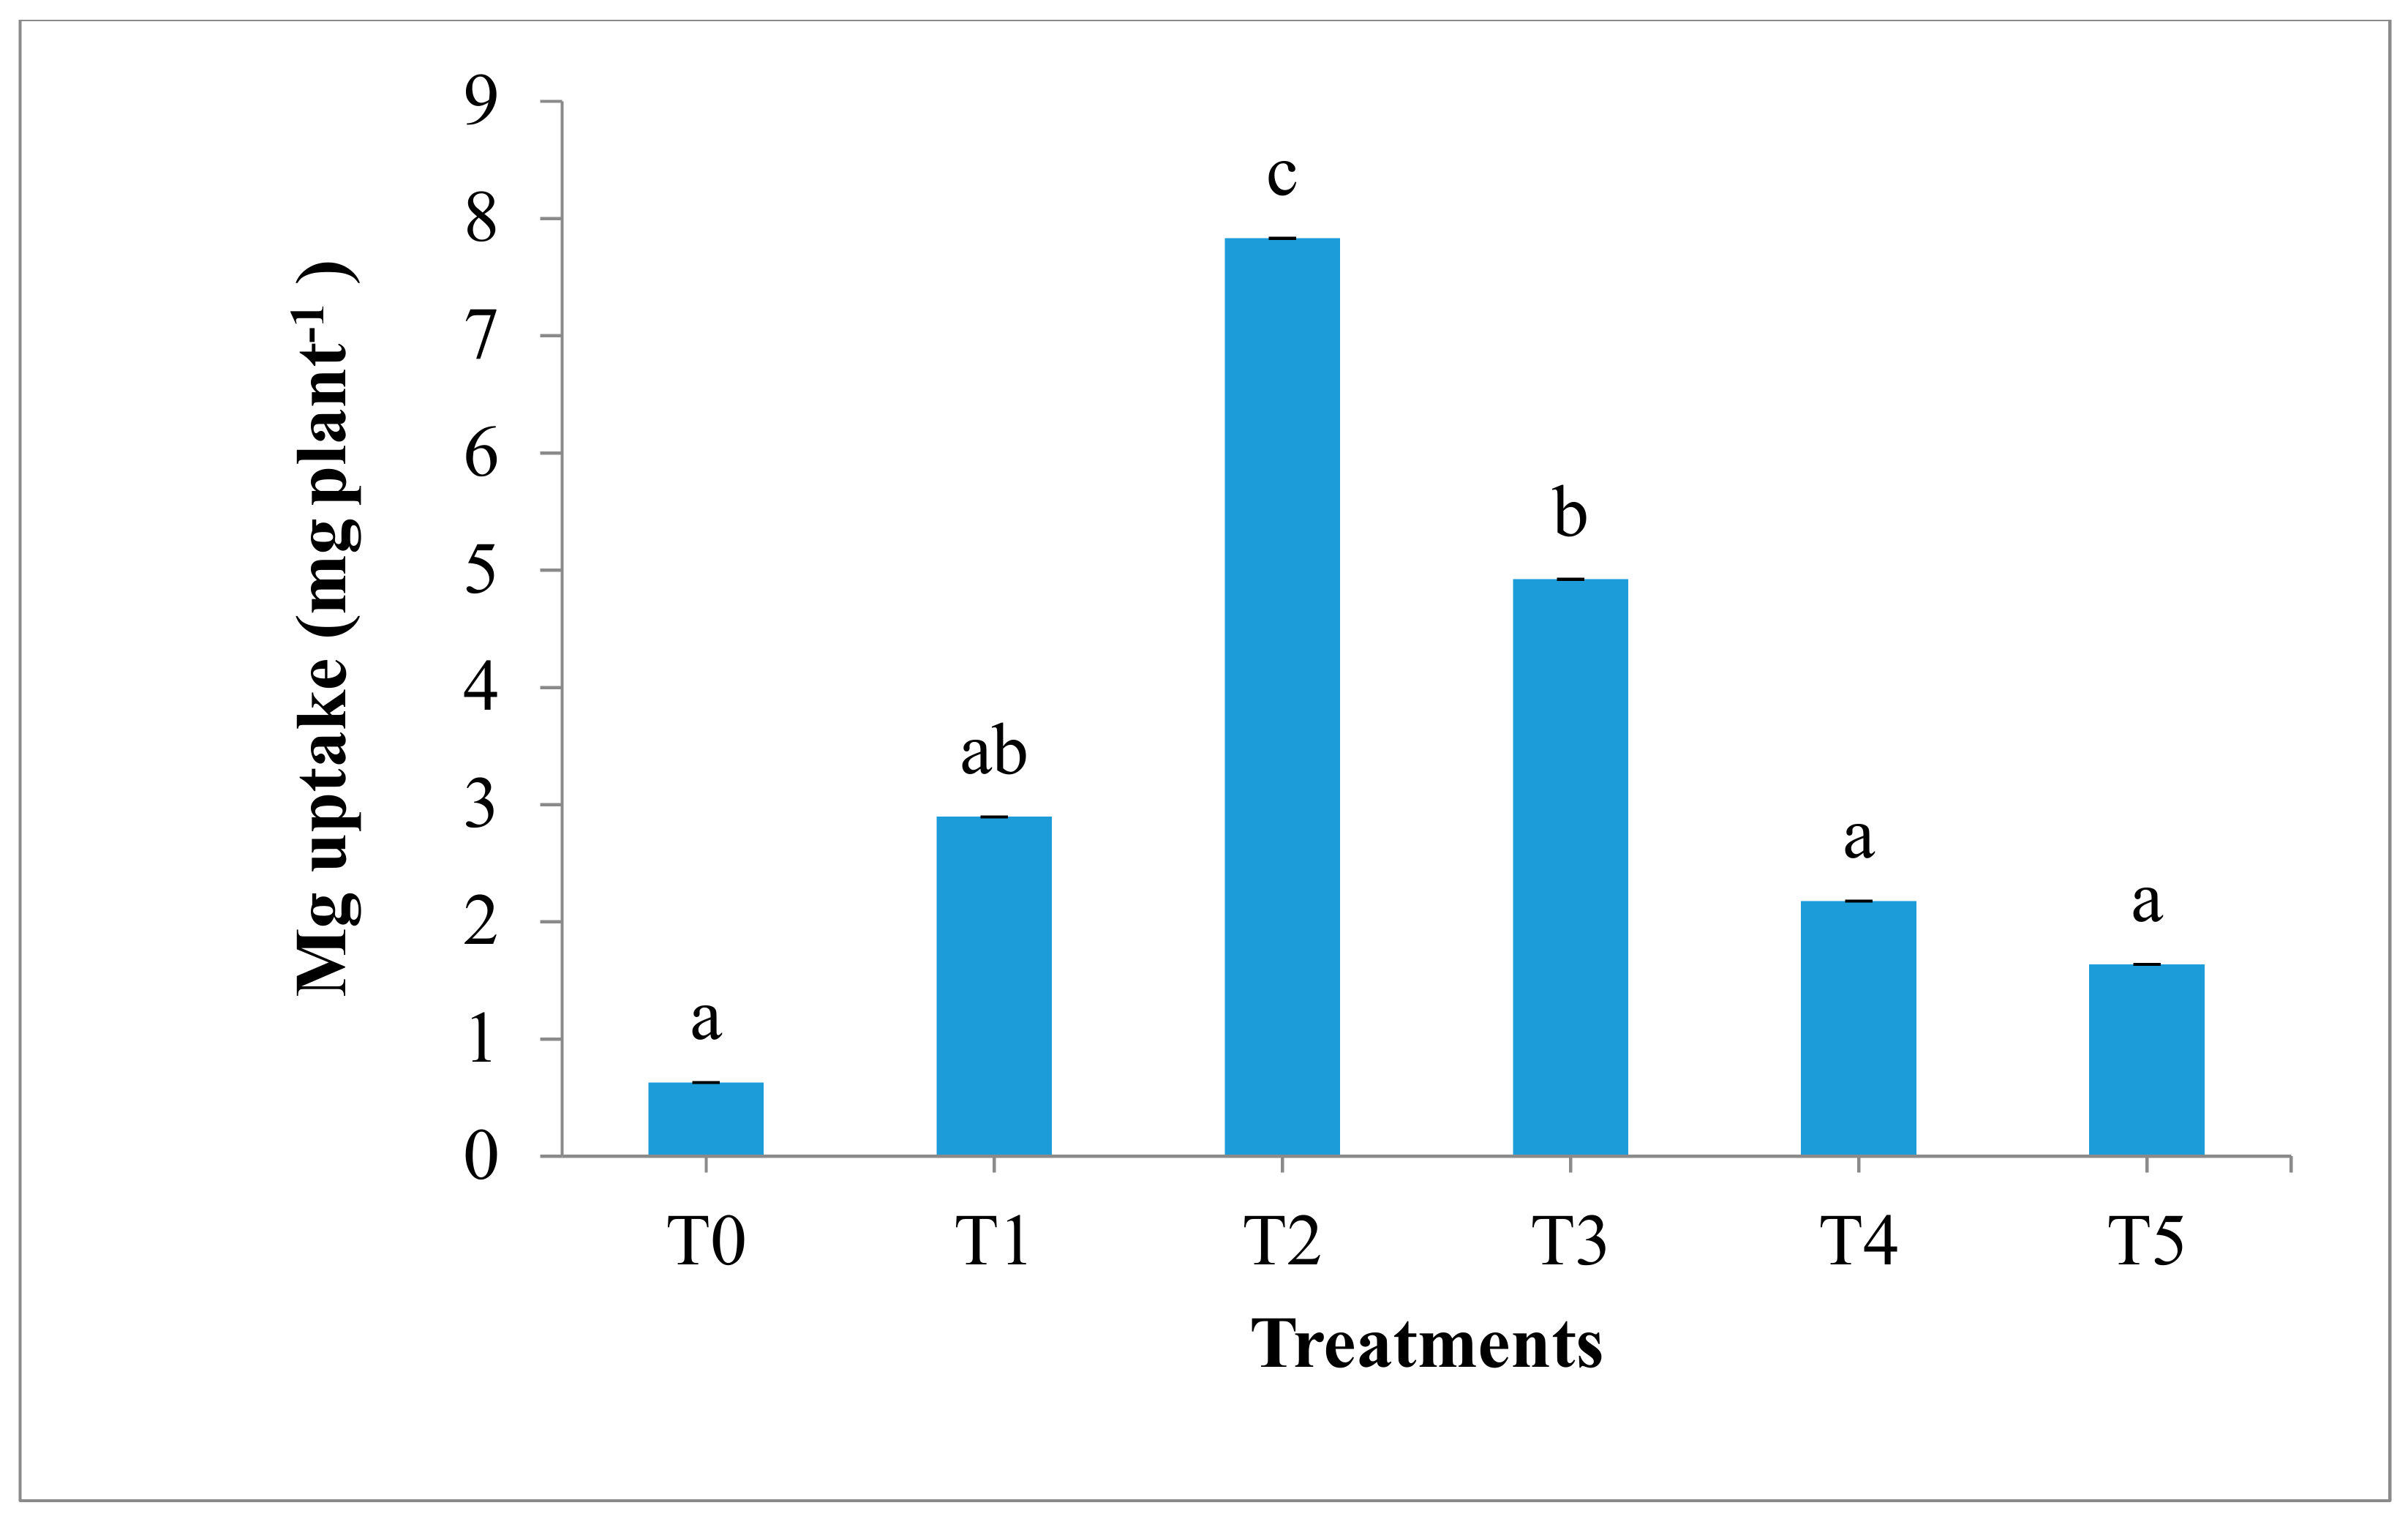
3.4. Rice Plant Growth and Nutrient Uptake Influenced by Rice Straw and Rice Husk Biochar

The rice plant dry weight, height, tiller number, panicle number, and greenness are summarized in Table 10. Treatments T2 and T3 showed a significant increase in plant dry weight, height, tiller number, panicle number, and greenness compared to other treatments. Similarly, the total N and available P contents in T2 and T3 were significantly higher than other treatments without biochar and treatments with potting media biochar (Table 11). Available K in T2 was recorded to be the highest among all the treatments. The concentrations of available Ca and Mg in treatments amended with RSRH biochar (T2 and T3) did not show any significant increase over T1.
The rice plant N uptake in treatment amended with RSRH biochar at 5–10 t ha−1 (T2 and T3) was significantly higher than other treatments (Figure 4). Further, in T2 and T3, the plant P and K uptake showed a significant increase in comparison to T0, T1, T4, and T5 (Figure 5 and Figure 6). Treatment T2 and T3 significantly increased total Ca uptake of rice plant compared to other treatments (Figure 7). The total Mg uptake was significantly higher in T2 compared to other treatments (Figure 8). Further, the treatments with RSRH biochars (T2 and T3) significantly improved nutrient use efficiency in rice plant compared with T1 (Table 12).

4. Discussion

4.1. Ammonia Volatilization Study

The RSRH-amended biochars successfully minimized NH3 volatilization by delaying by up to 6–7 days. The total loss of NH3 in RSRH amended treatments was significantly low compared to the treatments without biochar and treatments with biochar potting media. The ability to minimize NH3 lies in the nature of biochar. Biochars’ porosity and larger surface area increase the adsorption rate of NH4+ and NO3 ions and reduce the volatilization of NH3 [35]. The dual characteristics of biochar enhanced the adsorption of both negatively and positively charged ions onto its exchange sites [36]. This was further supported by the findings in this study where the treatments amended with RSRH biochar, specifically 5 and 10 t ha−1, retained more NH4+ and NO3 ions in the soil (Table 5). The increased NH4+ and NO3 ions in the soil might be related to the CEC of RSRH biochar which is >66.6 cmolc kg−1 (Table 4). The higher retention of nutrients might also be due to biochar that degrade very late and, as a result, the adsorbed nutrients being released slowly. Sinclair et al. [37] reported that biochar in soil is very resilient and breaks down only sparingly over the long term; thus, captured nutrients are released slowly. In addition, biochar has significant carbonaceous components due to incomplete combustion of various organic components; hence, biochar remains in the soil long term [38,39]. The presence of biochar for a long period of time in the soil, and the slow release process of the adsorbed nutrients increases the nutrients in the soil for plant uptake. The characteristic of RSRH biochar acting as a slow release fertilizer means it is able to minimize NH3 loss and benefit the plant.
Moreover, biochar-amended treatments increased the soil pH. The pH of the soil amended with RSRH biochar (T2–T5) was significantly higher than the rest of the treatments. The soil pH increased during the period of the NH3 volatilization study may have been due to the inherent properties of biochar, which is alkaline in nature (>9) (Table 4). Previously, it was reported that NH3 volatilization is rapid in alkaline soils [40]. However, the results in this study showed lesser NH3 volatilization even though the soil was near neutral. This may have been due to the increased adsorption and conversion to NH4+ and NO3 over NH3. Additionally, Kelly [41] stated that the pH increase in soil amended with biochar was not high enough to enhance NH3 volatilization. Since there were no organic amendments in the T0 and T1, the soil remained acidic.

4.2. Soil Nutrients Improvement

The higher retention of soil total N, exchangeable NH4+, and NO3 were possible because of the high CEC of RS (75.6) and RH (66.6 cmol kg−1) biochar (Table 4). Further, the use of biochar as an organic amendment increased the retention of N due to the deceleration of N mineralization. This was possible due to the high organic matter of biochar. This was in agreement with Latifah et al. [42] and He et al. [43]. Moreover, the higher soil total N, exchangeable NH4+ and NO3 in T2 and T3 suggests that the use of RSRH biochar was effective in reducing N, NH4+, and N03 loss in soils, which is consistent with the findings by Wang et al. [44]. Nitrogen ion retention by RSRH biochar is due to its nature of having numerous pores and a larger surface area which adsorbs NH4+ and NO3 onto its surface (Figure 1 and Figure 2). Zhang et al. [45] stated that biochar has a special porous structure and surface functional group that adsorbs nutrient ions effectively. In addition, the ions’ adsorption capacity of biochar has been proven in a study conducted by Chen et al. [35]. The amorphous crystalline structure with numerous cracks on the surface area of biochar creates a large volume of empty pores that can be filled with nutrients [46]. The cracks lead to the formation of micro and macro pores during the heating time and the cracks formed are too numerous to be sealed off. This increases the porosity of biochar, where the porosity aids the adsorption capacity of the biochar. Additionally, the biochar has dual adsorption capacity where it adheres both negative and positive charged ions on its surface [47]. This strengthens the reasoning underlying the capacity of biochar to retain more N, NH4+, and NO3 in soil.
The presence of biochar regardless of RSRH biochar or commercial biochar increases the pH of the soil. The increase in soil pH was because of the rapid proton (H+) exchange between soil and organic amendments (biochar) [48,49]. Further, the increase in soil pH was also correlated with the further decomposition of biochar, where it enhanced the formation of organic anions, which consumed the protons available in the soil and solubilized the inherent K, Ca, Mg, and Na contents of biochar. Eventually, this increased the soil pH which was amended with biochars. This was in agreements to Ch’ng et al. [50] who stated that soil pH increases with the addition of organic amendments. Increase in the soil pH under T1 could be due to the dissolution of Ca and Mg contained in CIRP.
Further, reduction of soil exchangeable acidity in treatments amended with RSRH biochar was partly related to the increase in soil pH. It has been reported by previous researchers that soil pH increases as the exchangeable Al decreases [51,52]. This is due to the precipitation of exchangeable and soluble Fe as insoluble Al and Fe hydroxides [53]. However, this is in contrast with the findings of this study, whereby the increase in soil pH was not affected by the presence of exchangeable Al and Fe. Despite the highest level of the exchangeable Al and Fe in T4 and T5, the soil pH was increased significantly. This might be due to the alkaline nature of the biochars. Biochars are alkaline due to their ash content which releases base cations; hence, biochar addition neutralizes soil acidity [54]. Biochars have abundant soluble and exchangeable basic cations (Ca2+, Mg2+, K+, and Na+) which can be released into the acid soil easily. This suggests that the presence of biochar increases soil pH and reduces exchangeable acidity, although biochar does not significantly reduce the exchangeable Al and Fe.
The application of biochar increases the availability of soil organic matter. This finding is consistent with that of Lehman et al. [55]. The RSRH biochar increased the soil organic matter significantly, which might be due to slow mineralization and degradation by microbes. This was supported by studies of Bruun et al. [56] and Lehmann et al. [57] who stated that low mineralization rates of biochar underlines the biochar stability and its inherent ability to resist microbial degradation. Bruun and El-Tehery [58] further concluded that decreasing rates of soil organic matter mineralization may be caused by different factors including aeration and N availability. Application of RSRH biochar increased the soil organic C. The biochar role as a C storage in the soil was further confirmed by Lehmann et al. [55] and Demisie et al. [59]. Biochar is a C rich substrate and resistant to decomposition due to its aromatic structure [60]. The RSRH biochar interacts synergistically with soil to enhance the soil organic matter and soil C. Treatments amended with RSRH biochar also increased the soil EC. Higher soluble salt presence in the biochars might have resulted in the higher EC values. Chintala et al. [61] stated that biochar increases soil EC because cations on biochar surface may not bind strongly by electrostatic force, causing it to dissolve as a soluble salt. Gundale and Deluca [62] and Chan et al. [63] further agree that incorporation of biochar to acidic soil increases soil EC due to the release of weakly bound cations and anions into soil solution which are available for plant uptake.
Soil amended with RSRH biochar increased the soil CEC (Table 8). This could be due to the inherent characteristic of biochar which has a high surface area and porous nature [64]. The increase of soil CEC amended with RSRH biochar may also be due to the slow oxidation of biochar material as a result of biotic and abiotic factors which oxygenate the biochar surface functional group and boost the development of organo-mineral complexes [65,66,67]. Liang et al. [68] also stated that the charge density of per unit biochar surface was high, so its incorporation could increase the cations’ sorption of soils.
In the presence of biochar, soil available P increased significantly, and this could be attributed to the addition of biochar, which binds PO43− ions. The presence of polar and non-polar surface sites on biochar enabled it to adsorb more nutrients [36]. It was further agreed by Nelson et al. [69] and Sarkhot et al. [70] that biochar adsorbed both NH4+, NO3, and PO43− onto its exchange sites. The adsorbed PO43− onto the biochar surface reduced the P fixation to Al and Fe. Fixation of P with Al and Fe formed insoluble oxides and hydroxides, causing it to become unavailable for plant uptake. However, application of RSRH biochar into the soil successfully adsorbed P. Ch’ng et al. [71] stated that organic amendments (compost and biochar) successfully reduced soil P fixation by Al and Fe.
Incorporation of RSRH biochar increased available K and available Ca significantly (Table 9). The increase might be due to the inherent contents of these cations in the treatments amended with RSRH biochar. The increase of available K and available Ca can be associated with higher CEC of RSRH biochar (Table 4). Lehmann et al. [72] reported that the addition of biochar improved CEC of the soil, thus directly increasing the retention of basic cations in soil. Further, the highest retention of available cations (K and Ca) might be attributed to the presence of ash in biochar which helps in the immediate release of Ca and K [64,73,74].

4.3. Rice Plant Growth, Nutrient Uptake, and Nutrient Efficiency

The rice plant height, tiller number, panicle number, and greenness in the treatments amended with RSRH biochar were significantly higher than in the rest of the treatments. This finding suggests a positive effect of biochar addition on the growth of rice plants. The plant growth increased with the application of RSRH biochar. This was due to the improvement of soil chemical properties such as increased availability of plant nutrients (N, P, and K) and a decrease of soil acidity. The availability of N, P, and K was readily available in soil for efficient plant uptake. Improved rice plant physical growth directly increased the dry weight of the plants under RSRH biochar treatments.
In terms of rice plant N uptake, T3 (10 t ha−1 RSRH biochar) significantly improved the N concentration and uptake, and this indicated the reason for less N loss from the soil-plant system. Similarly, the N use efficiency was the highest in T3 compared to other treatments (Table 12). This was because the soil–biochar mixture might have encouraged the formation of NH4+ and NO3 over NH3. Ahmed et al. [29] reported similar observations. Omar et al. [75] also stated that the plant N uptake and use efficiency could be related with the ability of organic amendments to reduce NH3 volatilization. Further, the adsorbed N, NH4+, and NO3 in biochar exchange sites were being released slowly into the soil such that it met the demand of rice plant growth stages. It was proven that biochar can be an excellent alternative source for a slow release agent of nutrients [76]. However, there was no significant difference in N uptake between T1, T2, T4, and T5. This might be due to the lesser biochar application rate in T2, where the capability to adsorb nutrients was lesser and almost equal to non-biochar-amended treatments (T1). Further, lesser adsorption capability may have led to minor urea volatilization and denitrification. This may have been the cause of lesser N uptake and use efficiency in T1, T2, T4, and T5.
The P, K, and Ca concentrations, uptake, and use efficiency of rice plant in T2 and T3 were significantly higher compared to other treatments. Addition of RSRH biochar increased the soil pH and adsorption of PO43− onto its exchange sites by reducing fixation by Al and Fe. The PO43− ions ere not released immediately and this favored absorption by the plant root system. This could have improved better root growth in the rice plants which received biochar amendments (T2 and T3), thus increasing P, K, Ca, and Mg uptake in rice plants. Similarly, the plant nutrient use efficiency increased in line with plant nutrient uptake.

5. Conclusions

Incorporation of RSRH biochar effectively minimized NH3 loss from being volatilized. Biochar at an application rate of 5 and 10 t ha−1 successfully adsorbed NH4+ and NO3, and released them slowly for efficient rice plant uptake. It also improved soil organic matter, C, CEC, soil available P, and available K, and reduced soil exchangeable acidity. RSRH biochar also improved plant nutrient uptake and dry matter production of rice plants. The increase in rice plant nutrient uptake and use efficiency increased in line with the increase of readily available soil nutrients. Hence, RSRH biochar has a big potential to minimize N loss and retain more nutrients for efficient plant uptake.

Author Contributions

Conceptualization, G.S.; methodology, G.S.; investigation, G.S.; writing—original draft preparation, G.S.; editing, H.Y.C., N.M.Z., P.S., S.N.H.M.A.; supervision, H.Y.C.; project administration, H.Y.C.; funding acquisition, H.Y.C., P.S. All authors have read and agreed to the published version of the manuscript.

Funding

This research was funded by Malaysia Fundamental Research Grant Scheme (Grant No.: R/FRGS/A0700/01459A/002/2018/00563), UMK-MOF Social Enterprise Program (Grant No.: R/MOF/A07.00/01397A/007/2020/00721), and TUMKEI-MPC Student Entrepreneur. The APC will be funded by Malaysia Fundamental Research Grant Scheme (Grant No.: R/FRGS/A0700/01459A/002/2018/00563), UMK-MOF Social Enterprise Program (Grant No.: R/MOF/A07.00/01397A/007/2020/00721), TUMKEI-MPC Student Entrepreneur, and the University Malaysia Kelantan Deputy Vice Chancellor’s (Research and Innovation) Office.

Acknowledgments

The authors would like to thank the Malaysia Ministry of Education, Malaysia Ministry of Finance, and University Malaysai Kelantan Entrepreneurship Institute for financial assistance and University Malaysia Kelantan Jeli Campus for providing research facilities.

Conflicts of Interest

The authors declare no conflict of interests.

References

  1. Sariam. Aerob Rice, a Key to Malaysia’s Food Security. 2014. Available online: https://blogmardi.files.wordpress.com/2014/.../scientia-mardi-vol-001-march-2014.pdf (accessed on 19 February 2018).
  2. Xu, M.; Li, D.; Li, J.; Qin, D.; Hosen, Y.; Shen, H.; Cong, R.; He, X. Polyolefin-coated urea decreases ammonia volatilization in a double rice system of southern China. Agron. J. 2013, 105, 277–284. [Google Scholar] [CrossRef]
  3. Liu, T.; Huang, J.; Chai, K.; Cao, C.; Li, C. Effects of N fertilizer sources and tillage practices on NH3 volatilization, grain yield, and N use efficiency of rice fields in Central China. Front. Plant Sci. 2018, 9, 385. [Google Scholar] [CrossRef]
  4. Zhang, W.F.; Zhang, F.S. Research Report of Chinese Fertilizer Development; China Agricultural University Press: Beijing, China, 2013; pp. 90–93. [Google Scholar]
  5. Mariano, E.; de Sant Ana Filho, C.R.; Bortoletto-Santos, R.; Bendassolli, J.A.; Trivelin, P.C. Ammonia losses following surface application of enhanced-efficiency nitrogen fertilizers and urea. Atmos. Environ. 2019, 203, 242–251. [Google Scholar] [CrossRef]
  6. Jadon, P.; Selladurai, R.; Yadav, S.S.; Coumar, M.V.; Dotaniya, M.L.; Singh, A.K.; Bhadouriya, J.; Kundu, S. Volatilization and leaching losses of nitrogen from different coated urea fertilizers. J. Soil Sci. Plant Nutr. 2018, 18, 1036–1047. [Google Scholar] [CrossRef] [Green Version]
  7. Zheng, J.; Mmari, W.N.; Funakawa, S. Ammonia volatilization following urea application at maize fields in the East African highlands with different soil properties. Biol. Fertil. Soils 2018, 54, 411–422. [Google Scholar] [CrossRef]
  8. Sarkar, N.; Ghosh, S.K.; Bannerjee, S.; Aikat, K. Bioethanol production from agricultural wastes: An overview. Renew. Energy 2012, 37, 19–27. [Google Scholar] [CrossRef]
  9. Rehman, H.A.; Razzaq, R. Benefits of biochar on the agriculture and environment-a review. Int. J. Environ. Anal. Chem. 2017, 4, 1–3. [Google Scholar] [CrossRef]
  10. Lehmann, J.; Joseph, S. Biochar for environmental management: An introduction. In Biochar for Environmental Management 2015; Routledge: London, UK, 2009; pp. 33–46. [Google Scholar]
  11. Yeboah, E.; Ofori, P.; Quansah, G.W.; Dugan, E.; Sohi, S.P. Improving soil productivity through biochar amendments to soils. Afr. J. Environ. Sci. Technol. 2009, 3, 34–41. [Google Scholar]
  12. Yang, K.; Zhu, L.; Yang, J.; Lin, D. Adsorption and correlations of selected aromatic compounds on a KOH-activated carbon with large surface area. Sci. Total Environ. 2018, 618, 1677–1684. [Google Scholar] [CrossRef]
  13. Aghoghovwia, M.P.; Hardie, A.G.; Rozanov, A.B. Characterisation, adsorption and desorption of ammonium and nitrate of biochar derived from different feedstocks. Environ. Technol. 2020, 1–14. [Google Scholar] [CrossRef]
  14. Abdel-Fattah, T.M.; Mahmoud, M.E.; Ahmed, S.B.; Huff, M.D.; Lee, J.W.; Kumar, S. Biochar from woody biomass for removing metal contaminants and carbon sequestration. J. Ind. Eng. Chem. 2015, 22, 103–109. [Google Scholar] [CrossRef]
  15. Koyama, S.; Katagiri, T.; Minamikawa, K.; Kato, M.; Hayashi, H. Effects of rice husk charcoal application on rice yield, methane emission, and soil carbon sequestration in andosol paddy soil. Jpn. Agric. Res. Qual. 2016, 50, 319–327. [Google Scholar] [CrossRef] [Green Version]
  16. Mohammadi, A.; Cowie, A.; Mai, T.L.A.; de la Rosa, R.A.; Kristiansen, P.; Brandao, M.; Joseph, S. Biochar use for climate-change mitigation in rice cropping systems. J. Clean. Prod. 2016, 116, 61–70. [Google Scholar] [CrossRef]
  17. Peech, H.M. Hydrogen-ion activity. In Methods of Soil Analysis, Part 2; Black, C.A., Evans, D.D., Ensminger, L.E., White, J.L., Clark, F.E., Dinauer, R.C., Eds.; American Society of Agronomy: Madison, WI, USA, 1965; p. 64. [Google Scholar]
  18. Tan, K.H. Soil Sampling, Preparation, and Analysis, 2nd ed.; CRC Press: Boca Raton, FL, USA, 2005; p. 672. [Google Scholar]
  19. Bremner, J.M. Total nitrogen. In Methods of Soil Analysis, Part 2; Black, C.A., Evans, D.D., Ensminger, L.E., White, J.L., Clark, F.F., Dinauer, R.C., Eds.; American Society of Agronomy: Madison, WI, USA, 1965; pp. 1149–1178. [Google Scholar]
  20. Mehlich, A. Determination of P, Ca, Mg, K, Na and NH4; North Carolina State University Soil Test Division: Raleigh, NC, USA, 1953; p. 145. [Google Scholar]
  21. Murphy, J.; Riley, J.P. A modified single solution method for the determination of phosphate in natural waters. Anal. Chim. Acta 1962, 27, 31–36. [Google Scholar] [CrossRef]
  22. Cottenie, A. Soil testing and plant testing as a basis of fertilizer recommendation. FAO Soils Bull. 1980, 38, 70–73. [Google Scholar]
  23. Rowell, D.L. Soil Science, Methods and Applications; Longman Group UK Limited: London, UK, 1994; pp. 86–87. [Google Scholar]
  24. Keeney, D.R.; Nelson, D.W. Nitrogen-inorganic forms. In Methods of Soil Analysis, Part 2, 2nd ed.; Page, A.G., Keeney, D.R., Baker, D.E., Miller, R.H., Rhoades, J.D., Eds.; American Society of Agronomy: Madison, WI, USA, 1982; pp. 643–698. [Google Scholar]
  25. Sakhiya, A.K.; Anand, A.; Kaushal, P. Production, activation, and applications of biochar in recent times. Biochar 2020, 2, 253–285. [Google Scholar] [CrossRef]
  26. Siva, K.B.; Aminuddin, H.; Husni, M.H.A.; Manas, A.R. Ammonia volatilization from urea as affected by tropical-based palm oil mill effluent (Pome) and peat. Commun. Soil Sci. Plan. Anal. 1999, 30, 785–804. [Google Scholar] [CrossRef]
  27. Ahmed, O.H.; Aminuddin, H.; Husni, M.H.A. Effects of urea, humic acid and phosphate interactions in fertilizer microsites on ammonia volatilization and soil ammonium and nitrate contents. Int. J. Agric. Res. 2006, 1, 25–31. [Google Scholar] [CrossRef]
  28. Ahmed, O.H.; Aminuddin, H.; Husni, M.H.A. Reducing ammonia loss from urea and improving soil-exchangeable ammonium retention through mixing triple superphosphate, humic acid and zeolite. Soil Use Manag. 2006, 22, 315–319. [Google Scholar] [CrossRef]
  29. Ahmed, O.H.; Husin, A.; Hanif, A.H.M. Ammonia volatilization and ammonium accumulation from urea mixed with zeolite and triple superphosphate. Acta Agric. Scand. Sect. B Soil Plant Sci. 2008, 58, 182–186. [Google Scholar]
  30. Bozorgi, H.R.; Faraji, A.; Danesh, R.K. Effect of plant density on yield and yield components of rice. Appl. Sci. 2011, 12, 2053–2057. [Google Scholar]
  31. Muda Agricultural Development Authority. Rice Check; Muda Agricultural Development Authority: Kedah, Malaysia, 2014.
  32. Palanivell, P.; Ahmed, O.H.; Majid, A.N.M. Minimizing ammonia volatilization from urea, improving lowland rice (cv. MR219) seed germination, plant growth variables, nutrient uptake, and nutrient recovery using clinoptilolite zeolite. Arch. Agron. Soil Sci. 2016, 62, 708–724. [Google Scholar] [CrossRef]
  33. Lija, M.; Ahmed, O.H.; Susilawati, K. Maize (Zea mays L.) nutrient use efficiency as affected by formulated fertilizer with Clinoptilolite Zeolite. Emir. J. Food Agric. 2014, 26, 284–292. [Google Scholar] [CrossRef]
  34. Dobermann, A.R. Nitrogen Use Efficiency—State of the Art. Agron. Hortic. Fac. Publ. 2005, 316. [Google Scholar]
  35. Chen, C.R.; Phillips, I.R.; Condron, L.M.; Goloran, J.; Xu, Z.H.; Chan, K.Y. Impacts of greenwaste biochar on ammonia volatilisation from bauxite processing residue sand. Plant Soil. 2013, 367, 301–312. [Google Scholar] [CrossRef]
  36. Laird, D.A.; Fleming, P.; Davis, D.D.; Horto, R.; Wang, B.; Karlen, D.L. Impact of biochar amendments on the quality of a typical Midwestern agricultural soil. Geoderma 2010, 158, 443–449. [Google Scholar] [CrossRef] [Green Version]
  37. Sinclair, K.; Slavich, P.; Van Zwieten, L.; Downie, A. Productivity and nutrient availability on a Ferrosol: Biochar, lime and fertiliser. In Proceedings of the Australian Society of Agronomy Conference, Adelaide, Australia, 21–25 September 2008; pp. 21–25. [Google Scholar]
  38. Sohi, S.P.; Krull, E.; Lopez-Capel, E.; Bol, R. A review of biochar and its use and function in soil. In Advances in Agronomy; Academic Press: Cambridge, UK, 2010; pp. 47–82. [Google Scholar]
  39. Novak, J.M.; Busscher, W.J.; Laird, D.L.; Ahmedna, M.; Watts, D.W.; Niandou, M.A. Impact of biochar amendment on fertility of a southeastern coastal plain soil. Soil Sci. 2009, 174, 105–112. [Google Scholar] [CrossRef] [Green Version]
  40. Schomberg, H.H.; Gaskin, J.W.; Harris, K.; Das, K.C.; Novak, J.M.; Busscher, W.J.; Watts, D.W.; Woodroof, R.H.; Lima, I.M.; Ahmedna, M.; et al. Influence of biochar on nitrogen fractions in a coastal plain soil. J. Environ. Qual. 2012, 41, 1087–1095. [Google Scholar] [CrossRef] [Green Version]
  41. Kelly, C.N.; Calderón, F.C.; Acosta-Martínez, V.; Mikha, M.M.; Benjamin, J.; Rutherford, D.W.; Rostad, C.E. Switchgrass biochar effects on plant biomass and microbial dynamics in two soils from different regions. Pedosphere 2015, 25, 329–342. [Google Scholar] [CrossRef]
  42. Latifah, O.; Ahmed, O.H.; Majid, N.M.A. Improving ammonium and nitrate release from urea using clinoptilolite zeolite and compost. Sci. World J. 2015, 2015, 574201. [Google Scholar]
  43. He, Z.L.; Alva, A.K.; Calvert, D.V.; Banks, D.J. Ammonia volatilization from different nitrogen fertilizers and effects of temperature and soil pH. Soil Sci. 1999, 164, 750–758. [Google Scholar] [CrossRef]
  44. Wang, Z.; Guo, H.; Shen, F.; Yang, G.; Zhang, Y.; Zeng, Y.; Deng, S. Biochar produced from oak sawdust by Lanthanum (La)-involved pyrolysis for adsorption of ammonium (NH4+), nitrate (NO3), and phosphate (PO43−). Chemosphere 2015, 119, 646–653. [Google Scholar] [CrossRef] [PubMed]
  45. Zhang, J.; Zhang, Z.; Shen, G.; Wang, R.; Gao, L.; Kong, F.; Zhang, J. Growth performance, nutrient absorption of tobacco and soil fertility after straw biochar application. Int. J. Agric. Biol. 2016, 18. [Google Scholar] [CrossRef]
  46. Brown, R.A.; Kercher, A.K.; Nguyen, T.H.; Nagle, D.C.; Ball, W.P. Production and characterization of synthetic wood chars for use as surrogates for natural sorbents. Org. Geochem. 2006, 37, 321–333. [Google Scholar] [CrossRef]
  47. Waters, D.; Condon, J.; Van Zwieten, L.; Moroni, S. Biochar-ion interactions: An investigation of biochar charge and its effect on ion retention. In Proceedings of the 19th World Congress of Soil Science, Brisbane, Australia, 1–6 August 2010. [Google Scholar]
  48. Tang, C.; Sparling, G.P.; McLay, C.D.A.; Raphael, C. Effect of short-term legume residue decomposition on soil acidity. Soil Res. 1999, 237, 561–573. [Google Scholar]
  49. Wong, M.T.F.; Nortcliff, S.; Swift, R.S. Method for determining the acid ameliorating capacity of plant residue compost, urban waste compost, farmyard manure, and peat applied to tropical soils. Commun. Soil Sci. Plant 1998, 29, 2927–2937. [Google Scholar] [CrossRef]
  50. Ch’ng, H.Y.; Ahmed, O.H.; Ab Majid, N.M. Improving phosphorus availability, nutrient uptake and dry matter production of Zea mays L. on a tropical acid soil using poultry manure biochar and pineapple leaves compost. Exp. Agric. 2016, 52, 447. [Google Scholar] [CrossRef]
  51. Narambuye, F.X.; Haynes, R.J. Effect of organic amendments on soil pH and Al solubility and use of laboratory indices to predict their liming effect. Soil Sci. 2006, 171, 754–763. [Google Scholar] [CrossRef]
  52. Opala, P.A.; Okalebo, J.R.; Othieno, C.O. Effects of organic and inorganic materials on soil acidity and phosphorus availability in a soil incubation study. ISRN Agron. 2012, 2012, 597216. [Google Scholar] [CrossRef] [Green Version]
  53. Zeng, Q.; Liao, B.; Jiang, Z.; Zhou, X.; Tang, C.; Zhong, N. Short-term changes of pH value and Al activity in acid soils after urea fertilization. Chin. J. Appl. Ecol. 2005, 16, 249–252. [Google Scholar]
  54. Obia, A.; Cornelissen, G.; Mulder, J.; Dörsch, P. Effect of soil pH increase by biochar on NO, N2O and N2 production during denitrification in acid soils. PLoS ONE 2015, 10, e0138781. [Google Scholar] [CrossRef] [PubMed] [Green Version]
  55. Lehmann, J.; Gaunt, J.; Rondon, M. Bio-char sequestration in terrestrial ecosystems—A review. Mitig. Adapt. Strateg. Glob. Chang. 2006, 11, 395–419. [Google Scholar] [CrossRef]
  56. Bruun, S.; Jensen, E.S.; Jensen, L.S. Microbial mineralization and assimilation of black carbon: Dependency on degree of thermal alteration. Org. Geochem. 2008, 39, 839–845. [Google Scholar] [CrossRef]
  57. Lehmann, J.; Joseph, S. (Eds.) Biochar for environmental management: An introduction. In Biochar for Environmental Management–Science and Technology; Earthscan Publisher: London, UK, 2009; pp. 1–9. [Google Scholar]
  58. Bruun, S.; EL-Zehery, T. Biochar effect on the mineralization of soil organic matter. Pesqui. Agropecu Bras. 2012, 47, 665–671. [Google Scholar] [CrossRef] [Green Version]
  59. Demisie, W.; Liu, Z.; Zhang, M. Effect of biochar on carbon fractions and enzyme activity of red soil. Catena 2014, 121, 214–221. [Google Scholar] [CrossRef]
  60. Kuzyakov, Y.; Bogomolova, I.; Glaser, B. Biochar stability in soil: Decomposition during eight years and transformation as assessed by compound-specific 14C analysis. Soil Biol. Biochem. 2014, 70, 229–236. [Google Scholar] [CrossRef]
  61. Chintala, R.; Mollinedo, J.; Schumacher, T.E.; Malo, D.D.; Julson, J.L. Effect of biochar on chemical properties of acidic soil. Arch. Agron. Soil Sci. 2014, 60, 393–404. [Google Scholar] [CrossRef]
  62. Gundale, M.J.; DeLuca, T.H. Charcoal effects on soil solution chemistry and growth of Koeleria macrantha in the Ponderosa Pine/Douglas-fir ecosystem. Biol. Fertil. Soils 2007, 43, 303–311. [Google Scholar] [CrossRef]
  63. Chan, K.Y.; Van Zwieten, L.; Meszaros, I.; Downie, A.; Joseph, S. Using poultry litter biochars as soil amendments. Soil Res. 2008, 46, 437–444. [Google Scholar] [CrossRef]
  64. Nigussie, A.; Kissi, E.; Misganaw, M.; Ambaw, G. Effect of biochar application on soil properties and nutrient uptake of lettuces (Lactuca sativa) grown in chromium polluted soils. Am. Eurasian J. Agric. Environ. Sci. 2012, 12, 369–376. [Google Scholar]
  65. Ma, Y.J.; Li, S.G.; Wang, Z.Q. Effect of weathered coal on the colloidal property of soils. Tu Jang Hsueh Pao 1979, 16, 22–28. (In Japanese) [Google Scholar]
  66. Glaser, B. Eigenschaften und Stabilität des Humuskörpers der Indianerschwarzerden Amazoniens. In Bayreuther Bodenkundliche Berichte; Institute of Soil Science and Soil Geography, University of Bayreuth: Bayreuth, Germany, 1999; Volume 68. [Google Scholar]
  67. Glaser, B.; Haumaier, L.; Guggenberger, G.; Zech, W. The Terra Preta phenomenon—A model for sustainable agriculture in the humid tropics. Naturwissenschaften 2001, 88, 37–41. [Google Scholar] [CrossRef] [PubMed]
  68. Liang, B.L.; Solomon, J.; Kinyangi, D.; Grossman, J.; O’Neill, J.; Skjemstad, B.; Thies, J.O.; Petersen, F.J.; Neves, J. Black carbon increases cation exchange capacity in soils. Soil Sci. Soc. Am. J. 2006, 70, 1719–1730. [Google Scholar] [CrossRef] [Green Version]
  69. Nelson, N.O.; Agudelo, S.C.; Yuan, W.Q.; Gan, J. Nitrogen and phosphorus availability in biochar-amended soils. Soil Sci. 2011, 176, 218–226. [Google Scholar] [CrossRef]
  70. Sarkhot, D.V.; Berhe, A.A.; Ghezzehei, T.A. Impact of biochar enriched with dairy manure effluent on carbon and nitrogen dynamics. J. Environ. Qual. 2012, 41, 1107–1114. [Google Scholar] [CrossRef] [Green Version]
  71. Ch’ng, H.Y.; Ahmed, O.H.; Majid, N.M.A.; Jalloh, M.B. Reducing soil phosphorus fixation to improve yield of maize on a tropical acid soil using compost and biochar derived from agro-industrial wastes. Compost Sci. Util. 2017, 25, 82–94. [Google Scholar] [CrossRef]
  72. Lehmann, J.; Rilig, M.C.; Thies, J.; Masiello, C.A.; Hockaday, W.C.; Crowley, D. Biochar affects on soil biota—A review. Soil Biol. Biochem. 2011, 43, 1812–1836. [Google Scholar] [CrossRef]
  73. Scheuner, E.T.; Makeschin, F.; Wells, E.D.; Carter, P.Q. Short-term impacts of harvesting and burning disturbances on physical and chemical characteristics of forest soils in western Newfoundland, Canada. Eur. J. Forest Res. 2004, 123, 321–330. [Google Scholar] [CrossRef]
  74. Niemeyer, T.; Niemeyer, M.; Mohamed, A.; Fottner, S.; Härdtle, W. Impact of prescribed burning on the nutrient balance of Heath Lands with particular reference to nitrogen and phosphorus. Appl. Veg. Sci. 2005, 8, 183–192. [Google Scholar] [CrossRef]
  75. Omar, L.; Ahmed, O.H.; Majid, N.M.A. Enhancing nutrient use efficiency of maize (Zea mays L.) from mixing urea with zeolite and peat soil water. Int. J. Phys. Sci. 2011, 6, 3330–3335. [Google Scholar]
  76. Liu, X.; Liao, J.; Song, H.; Yang, Y.; Guan, C.; Zhang, Z. A biochar-based route for environmentally friendly controlled release of nitrogen: Urea-loaded biochar and bentonite composite. Sci. Rep. 2019, 9, 1–12. [Google Scholar] [CrossRef] [PubMed]
Figure 1. Rice husk biochar surface at 700× magnification under SEM.
Applsci 11 00108 g001
Figure 2. Rice straw biochar surface at 1000× magnification under SEM.
Applsci 11 00108 g002
Figure 3. Ammonia volatilization over 28 days of incubation under waterlogged condition.
Applsci 11 00108 g003
Figure 4. Effects of treatments on total N uptake at harvest (70 DAT). Mean values with different letter(s) indicate significant difference between treatments by Tukey’s test at p ≤ 0.05. Bars represent the mean values ± SE.
Applsci 11 00108 g004
Figure 5. Effects of treatments on available P uptake at harvest (70 DAT). Mean values with different letter(s) indicate significant difference between treatments by Tukey’s test at p ≤ 0.05. Bars represent the mean values ± SE.
Applsci 11 00108 g005
Figure 6. Effects of treatments on total K uptake at harvest (70 DAT). Mean values with different letter(s) indicate significant difference between treatments by Tukey’s test at p ≤ 0.05. Bars represent the mean values ± SE.
Applsci 11 00108 g006
Figure 7. Effects of treatments on total Ca uptake at harvest (70 DAT). Mean values with different letter(s) indicate significant difference between treatments by Tukey’s test at p ≤ 0.05. Bars represent the mean values ± SE.
Applsci 11 00108 g007
Figure 8. Effects of treatments on total Mg uptake at harvest (70 DAT). Mean values with different letter(s) indicate significant difference between treatments by Tukey’s test at p ≤ 0.05. Bars represent the mean values ± SE.
Applsci 11 00108 g008
Table 1. Treatments evaluated in ammonia volatilization study.
Treatment Description
T0100 g soil only (negative control)
T1100 g soil + 0.97 g urea (positive control)
T2100 g soil + 0.97 g urea + 0.14 g rice straw biochar + 0.14 g rice husk biochar
T3100 g soil + 0.97 g urea + 0.28 g rice straw biochar + 0.28 g rice husk biochar
T4100 g soil + 0.97 g urea + 0.42 g rice straw biochar + 0.42 g rice husk biochar
T5100 g soil + 0.97 g urea + 0.56 g rice straw biochar + 0.56 g rice husk biochar
T650 g soil + 50 g commercial biochar potting media + 0.97 g urea
T7100 g of commercial biochar potting media + 0.97 g urea
Table 2. Treatments evaluated in pot study.
TreatmentDescription
T05 kg soil (negative control)
T15 kg soil + 3.96 kg urea, 2.21 kg ha−1 CIRP, and 2.94 kg ha−1 MOP (positive control)
T25 kg soil + 3.96 kg urea, 2.21 kg ha−1 CIRP, and 2.94 kg ha−1 MOP + 0.06 kg rice straw biochar + 0.06 kg rice husk
T35 kg soil + 3.96 kg urea, 2.21 kg ha−1 CIRP, and 2.94 kg ha−1 MOP + 0.12 kg rice straw biochar + 0.12 kg rice husk
T42.5 kg soil + 2.5 kg commercial biochar potting media + 3.96 kg urea, 2.21 kg ha−1 CIRP, and 2.94 kg ha−1 MOP (50% soil + 50% commercial biochar potting media)
T55 kg commercial biochar potting media + 3.96 kg urea, 2.21 kg ha−1 CIRP, and 2.94 kg ha−1 MOP (100% commercial biochar potting media)
Table 3. Selected soil physico-chemical properties.
PropertyValue Obtained
pH5.5
EC (dS m−1)0.022
TextureSandy Clay Loam
Soil organic matter (%)6.24
Total organic matter (%)3.62
Ash content (%)6.4
Cation exchange capacity (cmolc kg−1)5.4
Ammonium (ppm)89
Nitrate (ppm)30
Total N (%)0.07
Available P (ppm)0.385
Total C (%)4.5
Available K (cmolc kg−1)0.084
Available Ca (cmolc kg−1)0.10
Available Mg (cmolc kg−1)0.082
Available Na (cmolc kg−1)0.024
Available Fe (cmolc kg−1)0.091
Exchangeable acidity (cmolc kg−1)0.7
Exchangeable Al (cmolc kg−1)1.14
Table 4. Selected physico-chemical properties of rice straw, rice husk, rice straw biochar, and rice husk biochar.
PropertyRice StrawRice HuskRice Straw BiocharRice Husk Biochar
pH (water)7.06.59.29.1
CEC (cmol kg−1)38.034.575.666.6
Total nitrogen (%)0.380.250.450.33
Available P (mg kg−1)10.79.814.314.3
Exchangeable Ca (mg kg−1)320532035991048
Exchangeable Mg (mg kg−1)12882186809508
Exchangeable K (mg kg−1)25,450194512,0304925
Exchangeable Na (mg kg−1)52.159.3246.3256
Table 5. Effect of treatments during ammonia volatilization study on soil pH, exchangeable NH4+, exchangeable NO3, and ammonia loss.
TreatmentspH
(Water)
NH4+
(ppm)
NO3
(ppm)
Ammonia Loss
(%)
T05.53 ± 0.06 a106.67 ± 12.01 a32.67 ± 2.33 ab0.00 ± 0.00 a
T16.23 ± 0.12 b256.67 ± 29.63 b37.67 ± 1.86 ab46.29 ± 1.79 de
T28.06 ± 0.06 e500.1 ± 2.06 d56.30 ± 4.33 c30.79 ± 0.11 bc
T37.95 ± 0.02 de458.5 ± 17.96 cd56.00 ± 4.04 c27.43 ± 0.71 b
T47.88 ± 0.02 de394.67 ± 6.12 c46.33 ± 2.19 bc32.62 ± 1.20 c
T57.75 ± 0.03 d289.33 ± 6.17 b41.0 ± 0.58 abc33.66 ± 0.50 c
T67.38 ± 0.03 c276.67 ± 8.82 b30.33 ± 4.98 a44.13 ± 0.16 d
T77.36 ± 0.07 c223.33 ± 21.86 b30.34 ± 2.33 a48.86 ± 0.23 e
Mean values within column with different letter(s) indicate significant difference between treatments by Tukey’s test at p ≤ 0.05. Columns represent the mean values ± SE.
Table 6. Effects of rice straw and rice husk (RSRH) biochar on soil N, NH4+, and NO3 at harvest (70 days after transplantation (DAT)).
TreatmentsN (%)NH4+ (ppm)NO3 (ppm)
T00.07 ± 0.02 a23.35 ± 2.34 a25.69 ± 6.18 a
T10.15 ± 0.01 b31.35 ± 5.24 a38.52 ± 2.02 ab
T20.21 ± 0.07 c122.59 ± 2.02 b97.07 ± 3.21 c
T30.18 ± 0.08 bc111.91 ± 4.88 b87.57± 2.02 c
T40.07 ± 0.01 a35.03 ± 4.04 a46.70 ± 2.34 b
T50.05 ± 0.02 a31.52 ± 2.02 a42.03 ± 4.04 ab
Mean values within column with different letter(s) indicate significant difference between treatments by Tukey’s test at p ≤ 0.05. Columns represent the mean values ± SE.
Table 7. Effects of RSRH biochar on soil pH, EC, total organic matter, and total C at harvest (70 DAT).
TreatmentspH
(Water)
EC
(ds m−1)
Total Organic Matter (%)Total C
T05.81 ± 0.13 a0.006 ± 0.001 a0.70 ± 0.06 a0.41 ± 0.03 a
T16.17 ± 0.03 a0.007 ± 0.001 a1.02 ± 0.19 a0.59 ± 0.11 a
T27.50 ± 1.27 c0.03 ± 0.002 bc6.63 ± 0.13 c2.10 ± 0.08 c
T37.41 ± 0.31 c0.04 ± 0.006 c6.57 ± 0.24 c3.36 ± 0.14 c
T46.83 ± 0.06 bc0.02 ± 0.001 abc2.91 ± 0.59 b1.69 ± 0.34 b
T56.67 ± 0.07 b0.01 ± 0.001 ab3.35 ± 0.27 b1.94 ± 0.16 b
Mean values within column with different letter(s) indicate significant difference between treatments by Tukey’s test at p ≤ 0.05. Columns represent the mean values ± SE.
Table 8. Effects of RSRH biochar on soil CEC, exchangeable acidity, exchangeable Al, and available P at harvest (70 DAT).
TreatmentsCECExchangeable Acidity
(cmol kg−1)
Exchangeable AlAvailable P
(ppm)
T02.95 ± 0.26 a0.33 ± 0.04 b0.26 ± 0.02 a2.57 ± 0.68 a
T14.17 ± 0.27 ab0.32 ± 0.03 b0.31 ± 0.03 ab29.38 ± 3.99 b
T29.83 ± 0.20 c0.17 ± 0.03 a0.19 ± 0.02 ab115.35 ± 3.03 d
T39.60 ± 0.32 c0.18 ± 0.01 a0.14 ± 0.01 a110.90 ± 5.60 d
T44.47 ± 0.26 b0.32 ± 0.01 b0.35 ± 0.02 b51.37 ± 0.97 c
T53.80 ± 0.21 ab0.52 ± 0.04 c0.58 ± 0.09 c37.50 ± 3.18 bc
Mean values within column with different letter(s) indicate significant difference between treatments by Tukey’s test at p ≤ 0.05. Columns represent the mean values ± SE.
Table 9. Effects of RSRH biochar on available K, Ca, Mg, Zn, and Fe at harvest (70 DAT).
TreatmentsAvailable K
(mg kg−1)
Available Ca
(mg kg−1)
Available Mg
(mg kg−1)
Available Zn
(mg kg−1)
Available Fe
(mg kg−1)
T00.36 ± 0.29 a0.43 ± 0.02 ab0.08 ± 0.002 a0.0020 ± 0.0006a0.11 ± 0.003ab
T10.64 ± 0.14 a0.75 ± 0.17 b0.07 ± 0.001 a0.0023 ± 0.0003a0.09 ± 0.006a
T20.89 ± 0.12 b2.47 ± 0.20 c0.04 ± 0.003a0.0053 ± 0.0003c0.07 ± 0.006a
T31.25 ± 0.07 b2.30 ± 0.15 c0.05 ± 0.002a0.0120 ± 0.0017bc0.04 ± 0.003a
T40.25 ± 0.05 a0.10 ± 0.01 a0.04 ±0.001a0.0050 ± 0.0001abc0.20 ± 0.026b
T50.29 ± 0.03 a0.61 ± 0.06 ab0.05 ±0.001a0.0047 ± 0.0003ab0.35 ± 0.043c
Mean values within column with different letter(s) indicate significant difference between treatments by Tukey’s test at p ≤ 0.05. Columns represent the mean values ± SE.
Table 10. Effects of RSRH biochar on dry weight, height, tiller number, panicle number, and greenness at harvest (70 DAT).
TreatmentsDry Weight (g)Height (cm)Tiller NumberPanicle Number (%)Greenness (%)
T07.64 ± 0.84 a41.94 ± 0.19 a2.00 ± 0.33 a1.00 ± 0.02 a100.00 ± 0.97 a
T122.97 ± 2.99 c76.18 ± 2.92 b3.00 ± 0.33 a2.00 ± 0.33 a106.31 ± 3.47 ab
T239.17 ± 1.58 d101.57 ± 1.95 c8.00 ± 0.88 b8.00 ± 0.88 b158.11 ± 3.88 d
T338.57 ± 0.97 d96.83 ± 1.84 c9.00 ± 0.89 b7.00 ± 0.89 b154.39 ± 6.20 d
T417.54 ± 1.14 bc73.20 ± 3.07 b3.00 ± 0.33 a3.00 ± 0.34 a125.23 ± 2.84 c
T514.62 ± 1.37 ab67.67 ± 0.98 b2.00 ± 0.34 a1.00 ± 0.33 a123.31 ± 3.58 bc
Mean values within column with different letter(s) indicate significant difference between treatments by Tukey’s test at p ≤ 0.05. Columns represent the mean values ± SE.
Table 11. Effects of RSRH biochar on N, P, K, Ca, and Mg concentrations at harvest (70 DAT).
TreatmentsN
(%)
P
(mg kg−1)
K
(mg kg−1)
Ca
(mg kg−1)
Mg
(mg kg−1)
T00.31 ± 0.02 a3.87 ± 0.35 a3380 ± 3.47 a1616.7 ± 4.44 a780 ± 2.04 a
T10.89 ± 0.07 b6.77 ± 0.49 a2239.2 ± 1.27 bc3100 ± 1.73 bcd1260 ± 1.29 ab
T21.48 ± 0.02 c44.00 ± 1.55 e3276 ± 3.38 d4675 ± 4.33 d2000 ± 2.85 b
T31.41 ± 0.04 c39.85 ± 0.03 d2860 ± 2.83 cd3768 ± 2.40 cd1275 ± 2.98 ab
T40.90 ± 0.03 b18.43 ± 0.55 c1849 ± 1.26 b3050 ± 2.02 bc1220 ± 1.64 ab
T50.80 ± 0.15 b12.53 ± 0.72 b1593 ± 1.38 b2200 ± 4.53 ab1090 ± 1.93 a
Mean values within column with different letter(s) indicate significant difference between treatments by Tukey’s test at p ≤ 0.05. Columns represent the mean values ± SE.
Table 12. Effects of RSRH biochar on N, P, and K use efficiency at harvest (70 DAT).
TreatmentsN Use EfficiencyP Use EfficiencyK Use Efficiency
T115.17 ± 1.36 a0.013 ± 0.002 a8.52 ± 3.89 a
T256.59 ± 1.26 b0.17 ± 0.013 b97.07 ± 3.43 b
T353.08 ± 2.82 b0.15 ± 0.004 b87.57± 1.32 b
T414.45 ± 1.65 a0.03 ± 0.003 a46.70 ± 1.61 a
T510.68 ± 3.19 a0.02 ± 0.002 a42.03 ± 3.60 a
Mean values within column with different letter(s) indicate significant difference between treatments by Tukey’s test at p ≤ 0.05. Columns represent the mean values ± SE.
Publisher’s Note: MDPI stays neutral with regard to jurisdictional claims in published maps and institutional affiliations.

