Article

Effect of the Surface Morphology of TiO2 Nanotubes on Photocatalytic Efficacy Using Electron-Transfer-Based Assays and Antimicrobial Tests

1
Applied Research & Innovation Centre, Malta College of Arts, Science & Technology MCAST, 9032 Paola, Malta
2
Faculty of Engineering, University of Malta, 2080 Msida, Malta
3
Department of Biological, Geological and Environmental Sciences, University of Catania, 95124 Catania, Italy
*
Author to whom correspondence should be addressed.
Appl. Sci. 2020, 10(15), 5243; https://doi.org/10.3390/app10155243
Submission received: 6 July 2020 / Revised: 23 July 2020 / Accepted: 28 July 2020 / Published: 29 July 2020

Abstract

:

Featured Application

Water availability is imperative to the Maltese islands. The lack of natural freshwater bodies and a climate characterized by low annual rainfall and high temperatures increase the pressure on the available freshwater resources to the ever-increasing population. The treatment of greywater to be used as second-class water for WC flushing and agricultural purposes could alleviate the demand put on the desalination plants and groundwater resources of the islands. In recent years, the application of titanium-dioxide-based photocatalytic systems has sparked a great deal of interest within the scientific community, due to its potential in removing pollutants and bacteria from air and water systems. The study at hand aims to provide an insight on the efficacy of TiO2 nanostructures having different morphologies to be used for this purpose and thus identify the ideal TiO2 surface morphology for implementation in a microscale photocatalytic greywater treatment system.

Abstract

The application of titanium oxide nanotubes for the removal of contaminants from freshwater is a rapidly growing scientific interest, especially when it comes to water conservation strategies. In this study we employed four different titanium oxide nanotube surfaces, prepared by a two-electrode anodic oxidation. Two of the surfaces were synthesised in aqueous media, while the other two surfaces were synthesised in ethylene glycol. One of the arrays synthesised in the organic medium was impregnated with silver nanoparticles, while the remaining surfaces were not. The chemical reactivity of the various surfaces was assessed using 2,2-Diphenyl-1-picrylhydrazyl (DPPH) and 2,2’-azino-bis (3-ethylbenzothiazoline-6-sulfonic acid) (ABTS) as free electron sensitive probe molecules, in parallel with tannic acid degradation and copper ion reducing capacity. The potential antimicrobial activity of the surfaces was assessed against a panel of microorganisms composed of yeast, fungi, Gram-positive and Gram-negative bacteria. Field emission scanning electron microscopy revealed that surfaces produced in the aqueous medium had a smaller tube length and a smaller tube diameter. It was noted that one of the materials using sodium sulfate as the supporting electrolyte had the most irregular nanostructure morphology with tubes growing to the side rather than vertically. The structural variation of the surfaces directly reflected both the chemical and biological activity, with the nanotubes formed in ethylene glycol showing the fastest rates in the stabilization of DPPH and ABTS radicals, the fastest tannic acid decomposition under various pH conditions and the fastest metal reducing activity. Furthermore, the surface containing silver and its bare counterpart showed the most effective antimicrobial activity, removing approximately 82% of Gram-negative bacteria, 50% of Gram-positive bacteria, 70% of yeast and 40% of fungi, with Gram-negative bacteria being the most susceptible to these surfaces.

1. Introduction

In recent years, the application of titanium dioxide based photocatalytic systems has gained interest within the scientific community due to its promising implementation in the removal of pollutants and microorganisms from air and water systems [1,2]. This is attributed to several reasons, including the high photocatalytic activity, excellent long-term physical and chemical stability, cost effectiveness, nontoxicity, and abundance of starting material. The strong redox activity of photoexcited titanium dioxide was first discovered by Fujishima et al. [3] in 1972, who reported the photoinduced decomposition of water on titanium dioxide electrodes. This finding led to the term ‘Honda–Fujishima effect’ being coined.
Titanium dioxide exists in three crystalline forms, anatase, rutile and brookite, which differ in chemical stability and photocatalytic activity [4]. Of the three crystal structures, anatase and rutile are the most common. In view of this, most of the photocatalytic research is conducted on anatase and rutile rather than on brookite [5]. The anatase phase is the most photochemically active of the three; however, it is metastable as it transforms back to rutile when heated [5,6,7]. Rutile alone has a very low photocatalytic activity; however, mixtures of anatase and rutile have in some cases been shown to have a higher activity when compared to the single phases [5,6,7,8]. In the presence of enough light energy, titanium dioxide nanotubes (TiO2-NT) can promote an electron from the valence band into the conduction band. The promotion of electrons leaves an electron void inside the valence band (photohole) and an excess of negative charge (electron) in the conduction band. The hole and electron couple are referred to as charge carriers. The point of excess charge in the conduction band causes the surface to become prone to oxidation, while the positive charge left behind inside the valence band causes the surface to become prone to reduction. This redox duality of the TiO2-NT surface enables the surface to act both as an oxidizing and reducing agent. The use of titanium dioxide as photocatalytic surfaces is not without its limitations. The most significant being the charge carrier recombination rate. On a photocatalyst surface, the excited electron and the photohole coexist at the same time, introducing the possibility of the recombination of the charge carriers. The recombination of electrons and photoholes decreases the rate of the photocatalytic reaction with respect to the light energy absorbed [9,10]. The promotion of electrons to the conduction band is also limited by the amount of energy required to promote an electron from the valence band to the conduction band.
To activate anatase, UVA irradiation (λ ≤ 387 nm) is required as this exceeds the band gap of this TiO2 polymorph (Ebg = 3.2 eV). Visible light, having a longer wavelength, is unable to activate anatase. Given that only 5% of the solar spectrum is composed of UV light, the possible application of such surfaces for photocatalysis using solar radiation is questionable [11,12]. Furthermore, titanium dioxide surfaces tend to be non-porous polar surfaces, thus exhibiting very low absorption of organic compounds [11,13,14], which is partially overcome by using TiO2-NT. Electrochemically prepared TiO2-NT generally forms vertically oriented tube-like structures with circular nanotubular openings that offer a large specific surface area and increased porosity [15]. Whilst the application of a nano structural framework increases the surface area and the porosity, the effect of the specific surface morphology cannot be discounted. In general, thicker nanostructured photocatalyst layers are more active, and wider nanotubes provide better access for pollutant to diffuse through the nanostructure. The thin walls of the nanotubes ensure that the charges generated can easily reach the surface and partake in the electrochemical reactions before these can recombine [16]. A suitable nano structure allows for the production of a template that can be modified further to expand its activity into the visible range.

2. Materials and Methods

In this study, we investigate the effectiveness of three nanotubular morphologies, synthesised in electrolytes having different chemistries. One of these three materials is tested both in the as produced form and after having added silver nanoparticles, de facto generating a further different material. Different chemical and biological methods are used to determine the potential application of these in biological contaminate removal. Two stable free radical molecules are also employed to assess the potential application. These probe molecules are used to measure the surface activity in the donation of electrons to the nanotextured surfaces. The results obtained are compared to the potential reducing activity of the surface towards metal ions and the chemical degradation of complex molecules under different pH conditions. The overall chemical activity is complemented with surface antimicrobial activity towards a panel of microorganisms including Gram-positive and Gram-negative bacteria, fungi, and yeast.
The efficacies of the various TiO2NT surfaces were determined using electron-transfer-based methods and antimicrobial assay. The excitation of electrons to the conduction band during UV exposure can be detected by the 2,2-Diphenyl-1-picrylhydrazyl (DPPH) and 2,2’-azino-bis (3-ethylbenzothiazoline-6-sulfonic acid) (ABTS) radicals, which in turn brings about a measurable change in absorbance. The change in absorbance was compared to titanium blanks having only the naturally produced oxide film, exposed to the same conditions as the nanotubular surfaces. The use of pure titanium blanks allows for any changes in the molecular probes resulting from the photolysis of water under UV light. In the case of the antimicrobial activity, the titanium blanks were used as the reference for 100% survivability of the microorganisms. The counts obtained with the various TiO2NT surfaces were expressed with respect to the titanium blanks.

2.1. Synthesis of Titanium Nanotubes

TiO2-NT were synthesised at the University of Malta using a two-electrode anodic oxidation process. Titanium sheets (99.6% pure, Grandis) were used as both the positive and negative electrodes. An inter-electrode distance of 30 mm was maintained for all oxidation processes. Three different baths were used for the growth of TiO2 nanotubes. In the first, an electrolyte solution of 3 vol% H2O, 0.5 wt % NH4F and ethylene glycol as the balance was used. A potential of 70 V was applied for 1 h. The samples produced in this way are called TiO2NT. The second bath was composed of 0.5 wt % solution of sodium fluoride (NaF) in 1 M sodium sulfate (Na2SO4). The samples were labelled TiO2NT-S. The third bath contained an electrolyte consisting of 0.5 wt % NaF in 1M phosphoric acid (H3PO4). In this case the samples were labelled TiO2NT-P. Both processes in the aqueous media were carried out at 20 V. The process duration for TiO2NT-S and TiO2NT-P was 6 and 3 h respectively. The as produced nanotubes were rinsed with ethanol, left to dry for 2 h at 80 °C and then annealed at 450 °C for 2 h. The annealed samples were sonicated for 10 min in acetone.
Silver addition to TiO2NT surface was carried out by dipping the surfaces in a solution of silver nanoparticles. In brief, 200 mL of 5 mM trisodium citrate was heated under reflux in a three-neck flask until the solution was boiling. A total of 1 mL of 0.25 mM silver nitrate solution was added and the solution was left boiling for a further 20 min. The solution was left to cool to room temperature and diluted by half with Milli-Q water [17]. The nanotube samples were dipped in the solution and left for 24 h. The samples were then rinsed gently with deionised water.

2.2. Characterisation of Titanium Dioxide Surfaces

Imaging and chemical analyses of the produced nanomaterials were conducted using a Zeiss Merlin Field Emission Scanning Electron Microscope equipped with an Apollo EDAX Energy Dispersive Spectroscopy (EDS) detector. The samples were sonicated in acetone for 3 min to ensure that the materials were fully degreased and dried using nitrogen. The samples were mounted on aluminium stubs using carbon tape. No further measures to increase conductivity were required. A series of magnifications (20 k, 50 k and 100 k) were used, with the 20 k magnifications being presented in this article. A voltage of 8 kV and a probe current of 225 pA were used together with a working distance of 8 mm. EDS measurements were conducted for an exposure time of 500 live seconds over a 1 µm by 1 µm area.

2.3. 2,2-Diphenyl-1-picrylhydrazyl (DPPH) Radical Stabilisation of TiO2-NT Surfaces

DPPH is one of the few stable and commercially available organic nitrogen radicals. It is a well-known radical trap (“scavenger”) for other radicals and other electron radical species. The basis of this method was to assess the surface activity through its potential to donate free electrons to DPPH radicals under UV light exposure. DPPH radicals have a deep violet colour with a strong absorption band centred at about 520 nm, becoming colourless or pale yellow when neutralized. Therefore, the rate of reduction of DPPH radicals is used as an indicator of the reaction progress. This property allows for visual monitoring of the reaction, and changes in the initial number of radicals can be accounted by measuring the change in optical absorption at 520 nm.
Figure 1 shows the experimental setup used for the determination of the radical stabilisation activity of the surfaces. In brief, 10 mL of 60 µM DPPH in methanol was placed over the TiO2NT surface in a 5.5 cm Ø petri dish covered with a 5 mm flat quartz glass and placed under a full-spectrum (320–400 nm) UV light at 10 mWcm−2. The absorbance was monitored at specific time intervals. The rate at which DPPH radicals were stabilized was determined using first-order rate kinetics.

2.4. Cupric ion Reduction Capacity of TiO2-NT Surfaces Using a Modified CUPRAC Assay

The reducing capacity of the coupons was determined using cupric ion reducing antioxidant capacity (CUPRAC) and an Apak et al. method with minor modifications [18]. This assay is based on the chromogenic reduction of bis(neocuproine) copper (II) (Cu(II)-Nc) cation, which acts as an outer sphere electron transfer agent capable of receiving valence electrons from the TiO2NT surface. The result of the reaction is a bright yellow product of Cu(I)-Nc chelate formed by the redox reaction with a maximal light absorption wavelength of 450 nm. In this assay, the TiO2NT surfaces were submersed in a solution of 1mM ammonium acetate (NH4Ac) buffer adjusted at pH 7.0, an equal amount of ethanolic 7.5 mM neocuproine and equal amount of 10 mM CuCl2 solution. The reaction mixture was mixed thoroughly, placed under a full-spectrum UV light at 10 mWcm−2 in a 5.5 cm Ø petri dish covered with a 5 mm flat quartz glass. The absorbance at 450 nm was monitored at specific time intervals against a reagent blank.

2.5. Determination of ABTS Radical Cation Stabilisation Activity of TiO2-NT Surfaces

ABTS assay measures the relative ability of the of TiO2-NT surfaces to stabilise ABTS radical cations that are generated in an aqueous phase. The ABTS radical cations are generated from the reaction between strong water-soluble oxidizing agent potassium persulfate and the ABTS chloride salt. The oxidation of the ABTS salts results in the formation of a blue green ABTS radical cation. The TiO2-NT surfaces can reduce back the radical cation through the donation of surface excited electrons, causing the suppression of its characteristic longwave 734 nm absorption maxima, thus enabling the visual monitoring of the reaction. The ABTS•+ was produced by the reaction of 7 mM stock solution of 2,2’-azino-bis (3-ethylbenzothiazoline-6-sulfonic acid) with 2.45 mM potassium persulfate. Before use, the mixture was allowed to stand overnight in the dark and at room temperature. The concentration of the blue green ABTS radical solution was adjusted with methanol to an absorbance of 0.700 (0.020 ± mean ± 1 SD) at 734 nm. A total of 10 mL of previously adjusted ABTS radical solution was placed over the TiO2NT surface in a 5.5 cm Ø petri dish covered with a 5 mm flat quartz glass and placed under a full-spectrum UV light at 10 mWcm−2. The absorbance was monitored at specific time intervals. The rate at which the ABTS radical cations were stabilized, was determined using first-order rate kinetics.

2.6. Determination of Chemical Degradation Activity of the of TiO2-NT Surfaces under Different pH Conditions

The potential application of TiO2-NT surfaces as solid-state wastewater decontamination surfaces was tested against the removal of tannic acid. Tannic acid is a high-molecular-weight, water-soluble hydrolysable tannin found in several different plants. Its presence in industrial wastewaters is a rising challenge because of its toxic influence on natural ecosystems [19,20]. Furthermore, tannic acid has been found to be very resistant to conventional biological treatments and other methods [21,22,23,24,25,26]. In this experiment, a stock solution containing 2 mg/L of tannic acid was prepared and adjusted to pH 2, 3, 6, 7 and 9 using 1M hydrochloric acid and sodium hydroxide. A total of 10 mL of the resultant solutions was placed over the TiO2NT surface in a 5.5 cm Ø petri dish covered with a 5 mm flat quartz glass and placed under a full-spectrum UV light at 10 mWcm−2. The absorbance was monitored at specific time intervals using a UV-Vis spectrophotometer (Shimadzu 1800), a full spectrum was recorded between 190–390 nm in order to check if secondary peaks appear during the oxidation and the absorbance at 276 nm was used as the λmax as a direct measure for the amount of tannic acid.

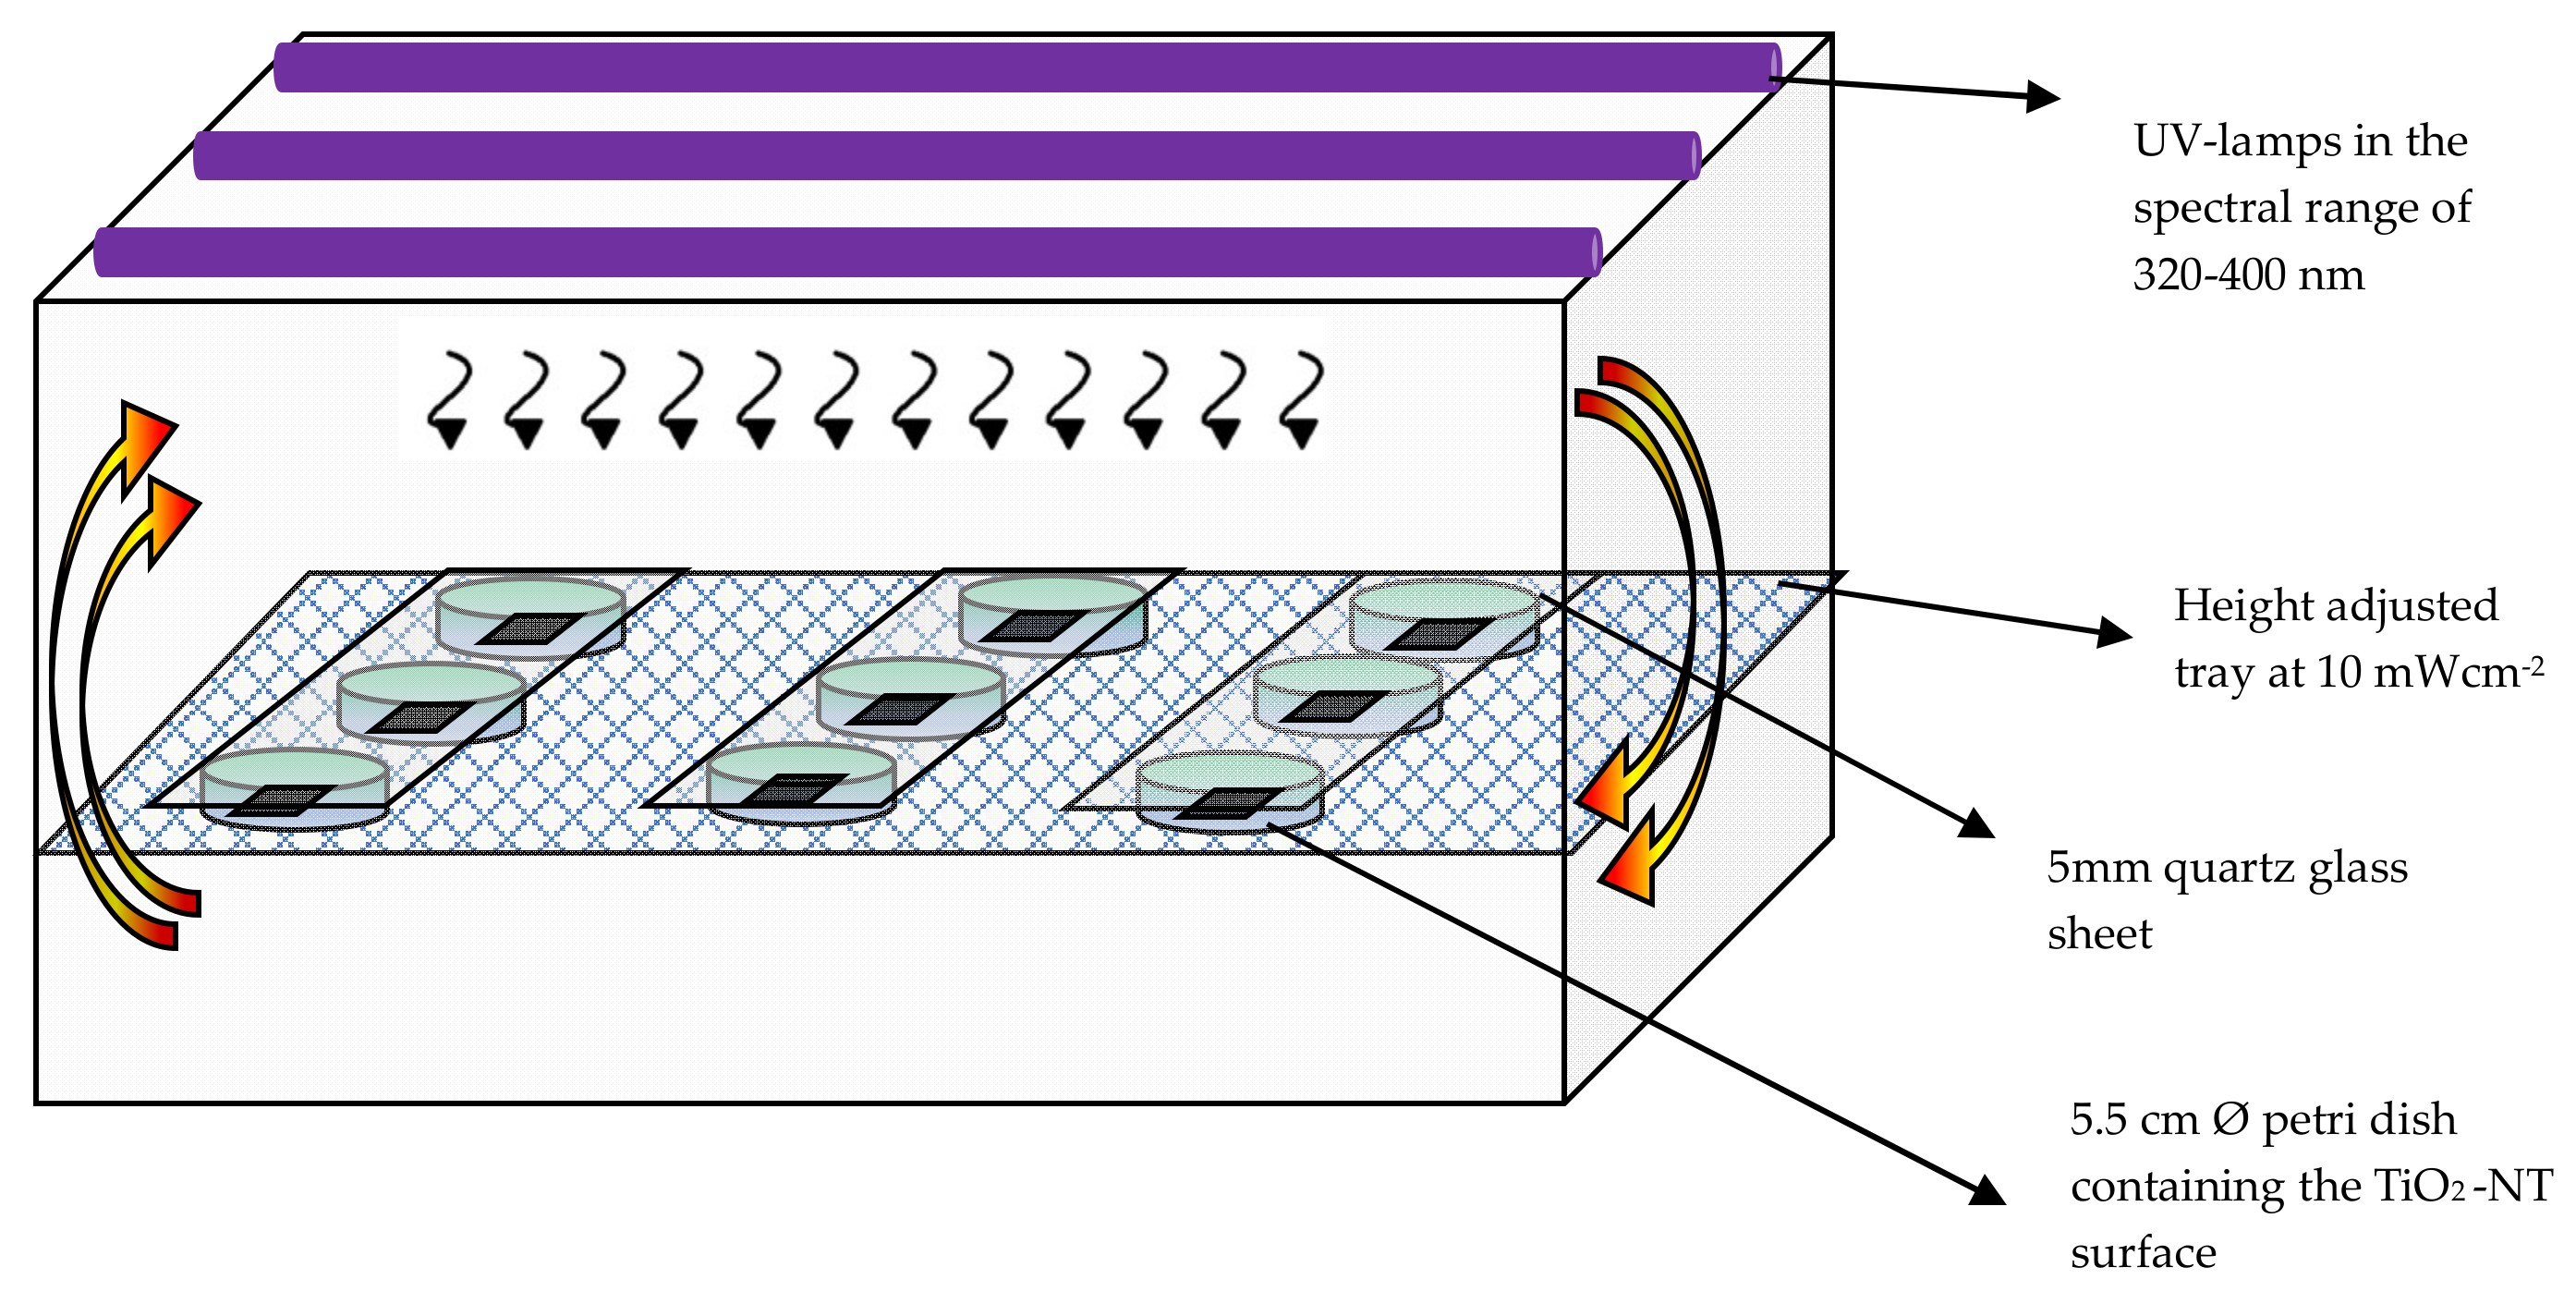
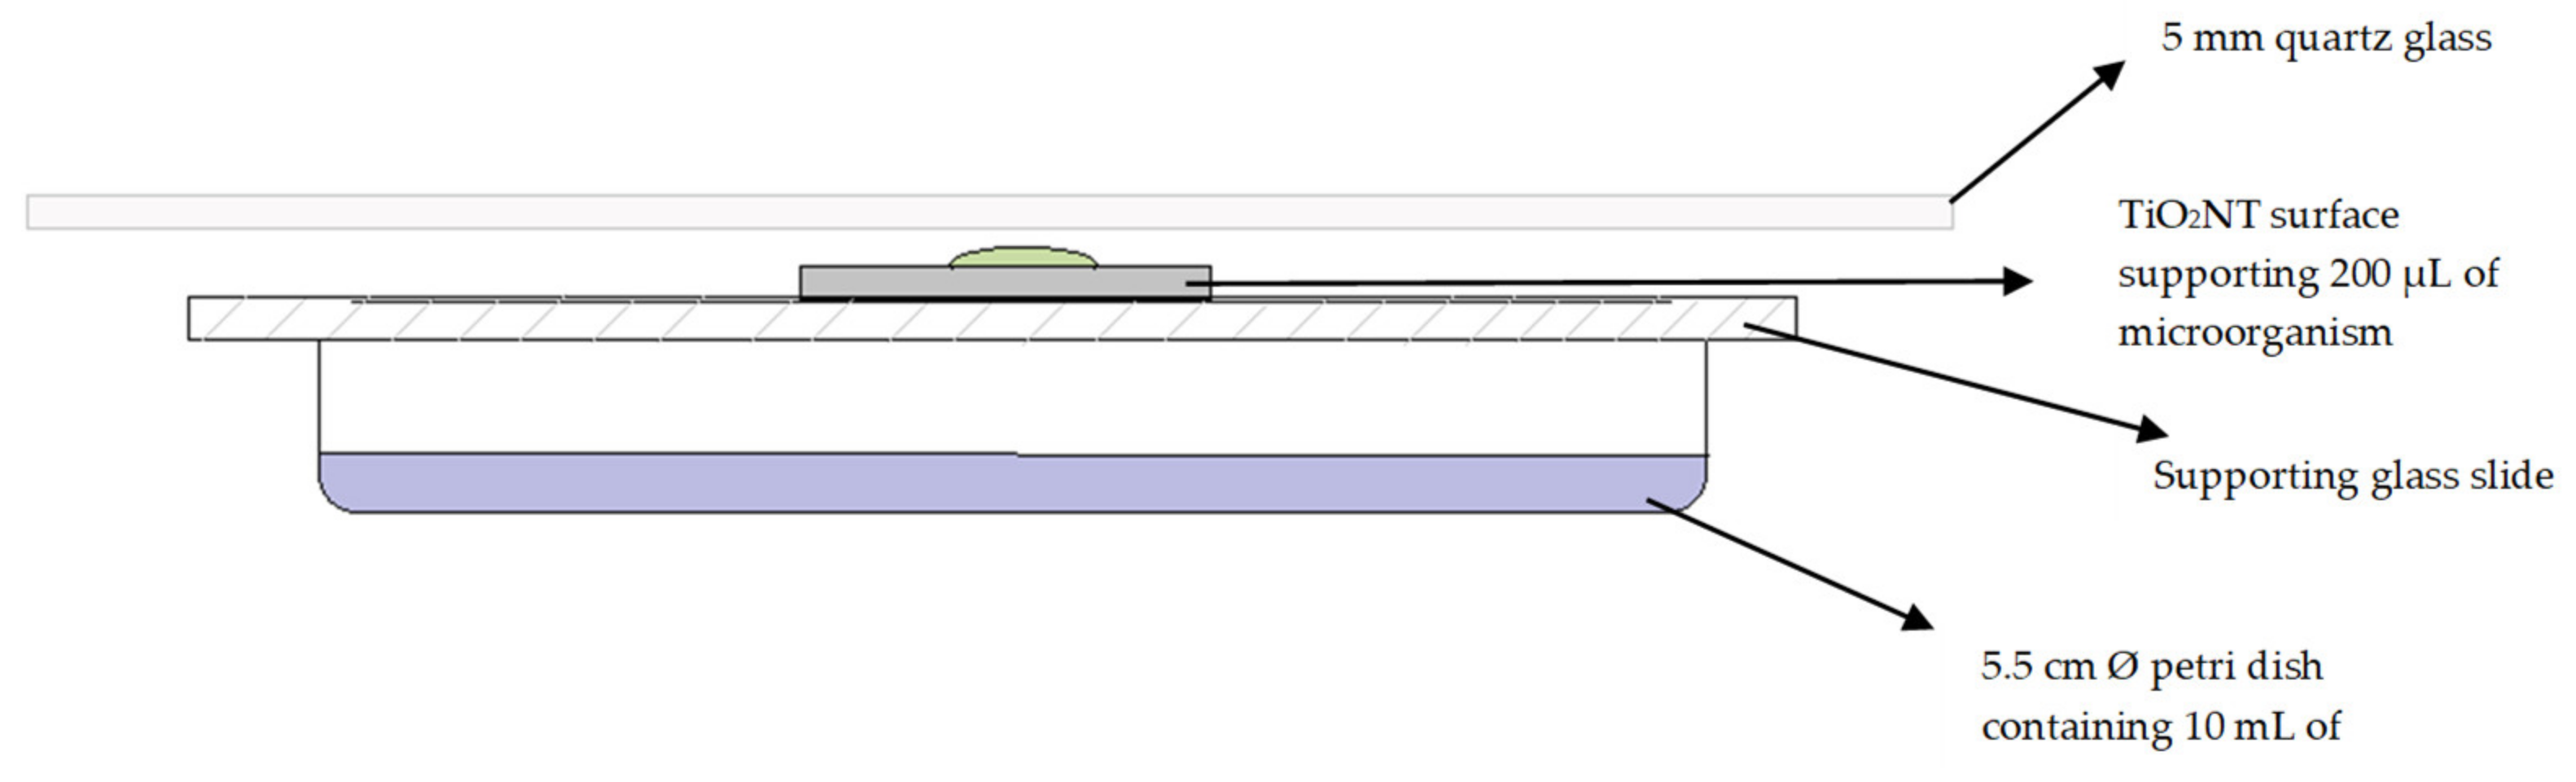
2.7. Determination of Antibacterial and Antifungal Activity of the of TiO2-NT Surfaces

A panel of microorganisms composed of an equal amount of three Gram-negative bacteria Escherichia coli ATCC® 8739™, Pseudomonas aeruginosa ATCC® 9027™ and Brevundimonas diminuta ATCC® 19146™, three Gram-positive bacteria composed of Bacillus subtilis subsp. spizizenii ATCC® 6633™, Staphylococcus epidermidis ATCC® 12228™ and Staphylococcus aureus ATCC ® 12600™, two yeast cultures composed of Candida albicans ATCC® 10231™ and Saccharomyces cerevisiae ATCC® 9763™, and three fungal cultures composed of Aspergillus brasiliensis (niger) ATCC® 9642™, Cryptococcus albidus ATCC® 34140™ and Penicillium chrysogenum ATCC® 10106™ were all purchased as certified Culti-Loops from Thermo Scientific™ Oxoid™.
The loops were rehydrated in 50 mL of previously sterilized tryptic soya broth (TSB Oxoid™). A. brasiliensis and P. chrysogenum were rehydrated in a sterile Sabouraud-dextrose broth (SDB Oxoid™) supplemented with 0.05% of Tween 80. The addition of Tween 80 prevented the formation of cellular clumps and allowed the formation of single-celled cultures. C. albidus and A. brasiliensis were rehydrated in SDB without Tween 80. All the cultures were incubated with shaking at 37 °C at 120 rpm for 8 h under aerobic conditions. The microbial suspensions were individually adjusted with broth to 0.5 abs units at 600 nm which corresponded to 1.5 × 10⁸ CFU. The resulting solution was used to test the antimicrobial activity of the coupons at full spectrum UV radiation. A total of 200 µL of microbial solution was uniformly placed on each coupon through the aid of a micropipette and placed into a climatic chamber (ICH 256 Memmert GmbH) set at 37 °C and 80% relative humidity. Figure 2 shows the typical experimental setup used. The coupons were placed onto a clean microscope slide and elevated on top of a 5 cm open petri dish [27]. To further prevent the microbial suspension from drying out the petri dish, over which the slide was placed, the petri dish filled with 10 mL of water. After 1 h of irradiation, the microbial solution was transferred into a sterile 5 cm petri dish and 1 mL of sterile 1× PBS was added. The contents of the petri dish was mixed gently to ensure that all the bacteria were recovered from the surface of the coupons. The PBS solution was transferred into a sterile microcentrifuge tube and aliquots were taken to prepare a serial dilution ranging from 10−2–10−6. From which 50 µL were taken and plated onto previously prepared plates of total count agar for bacteria and Sabouraud-dextrose agar (SDA Oxoid™ Basingstoke, United Kingdom) for yeast and fungi. The plates were incubated upside down for 10–20 h at 35 °C. The resultant colonies were counted, and the percentage antimicrobial activity of the surface was expressed relative to untreated titanium blank coupons. The experiment was repeated using the same conditions without UV light to ensure that the observed antimicrobial activity could be attributed to the effect of UV light and coupons.

3. Results

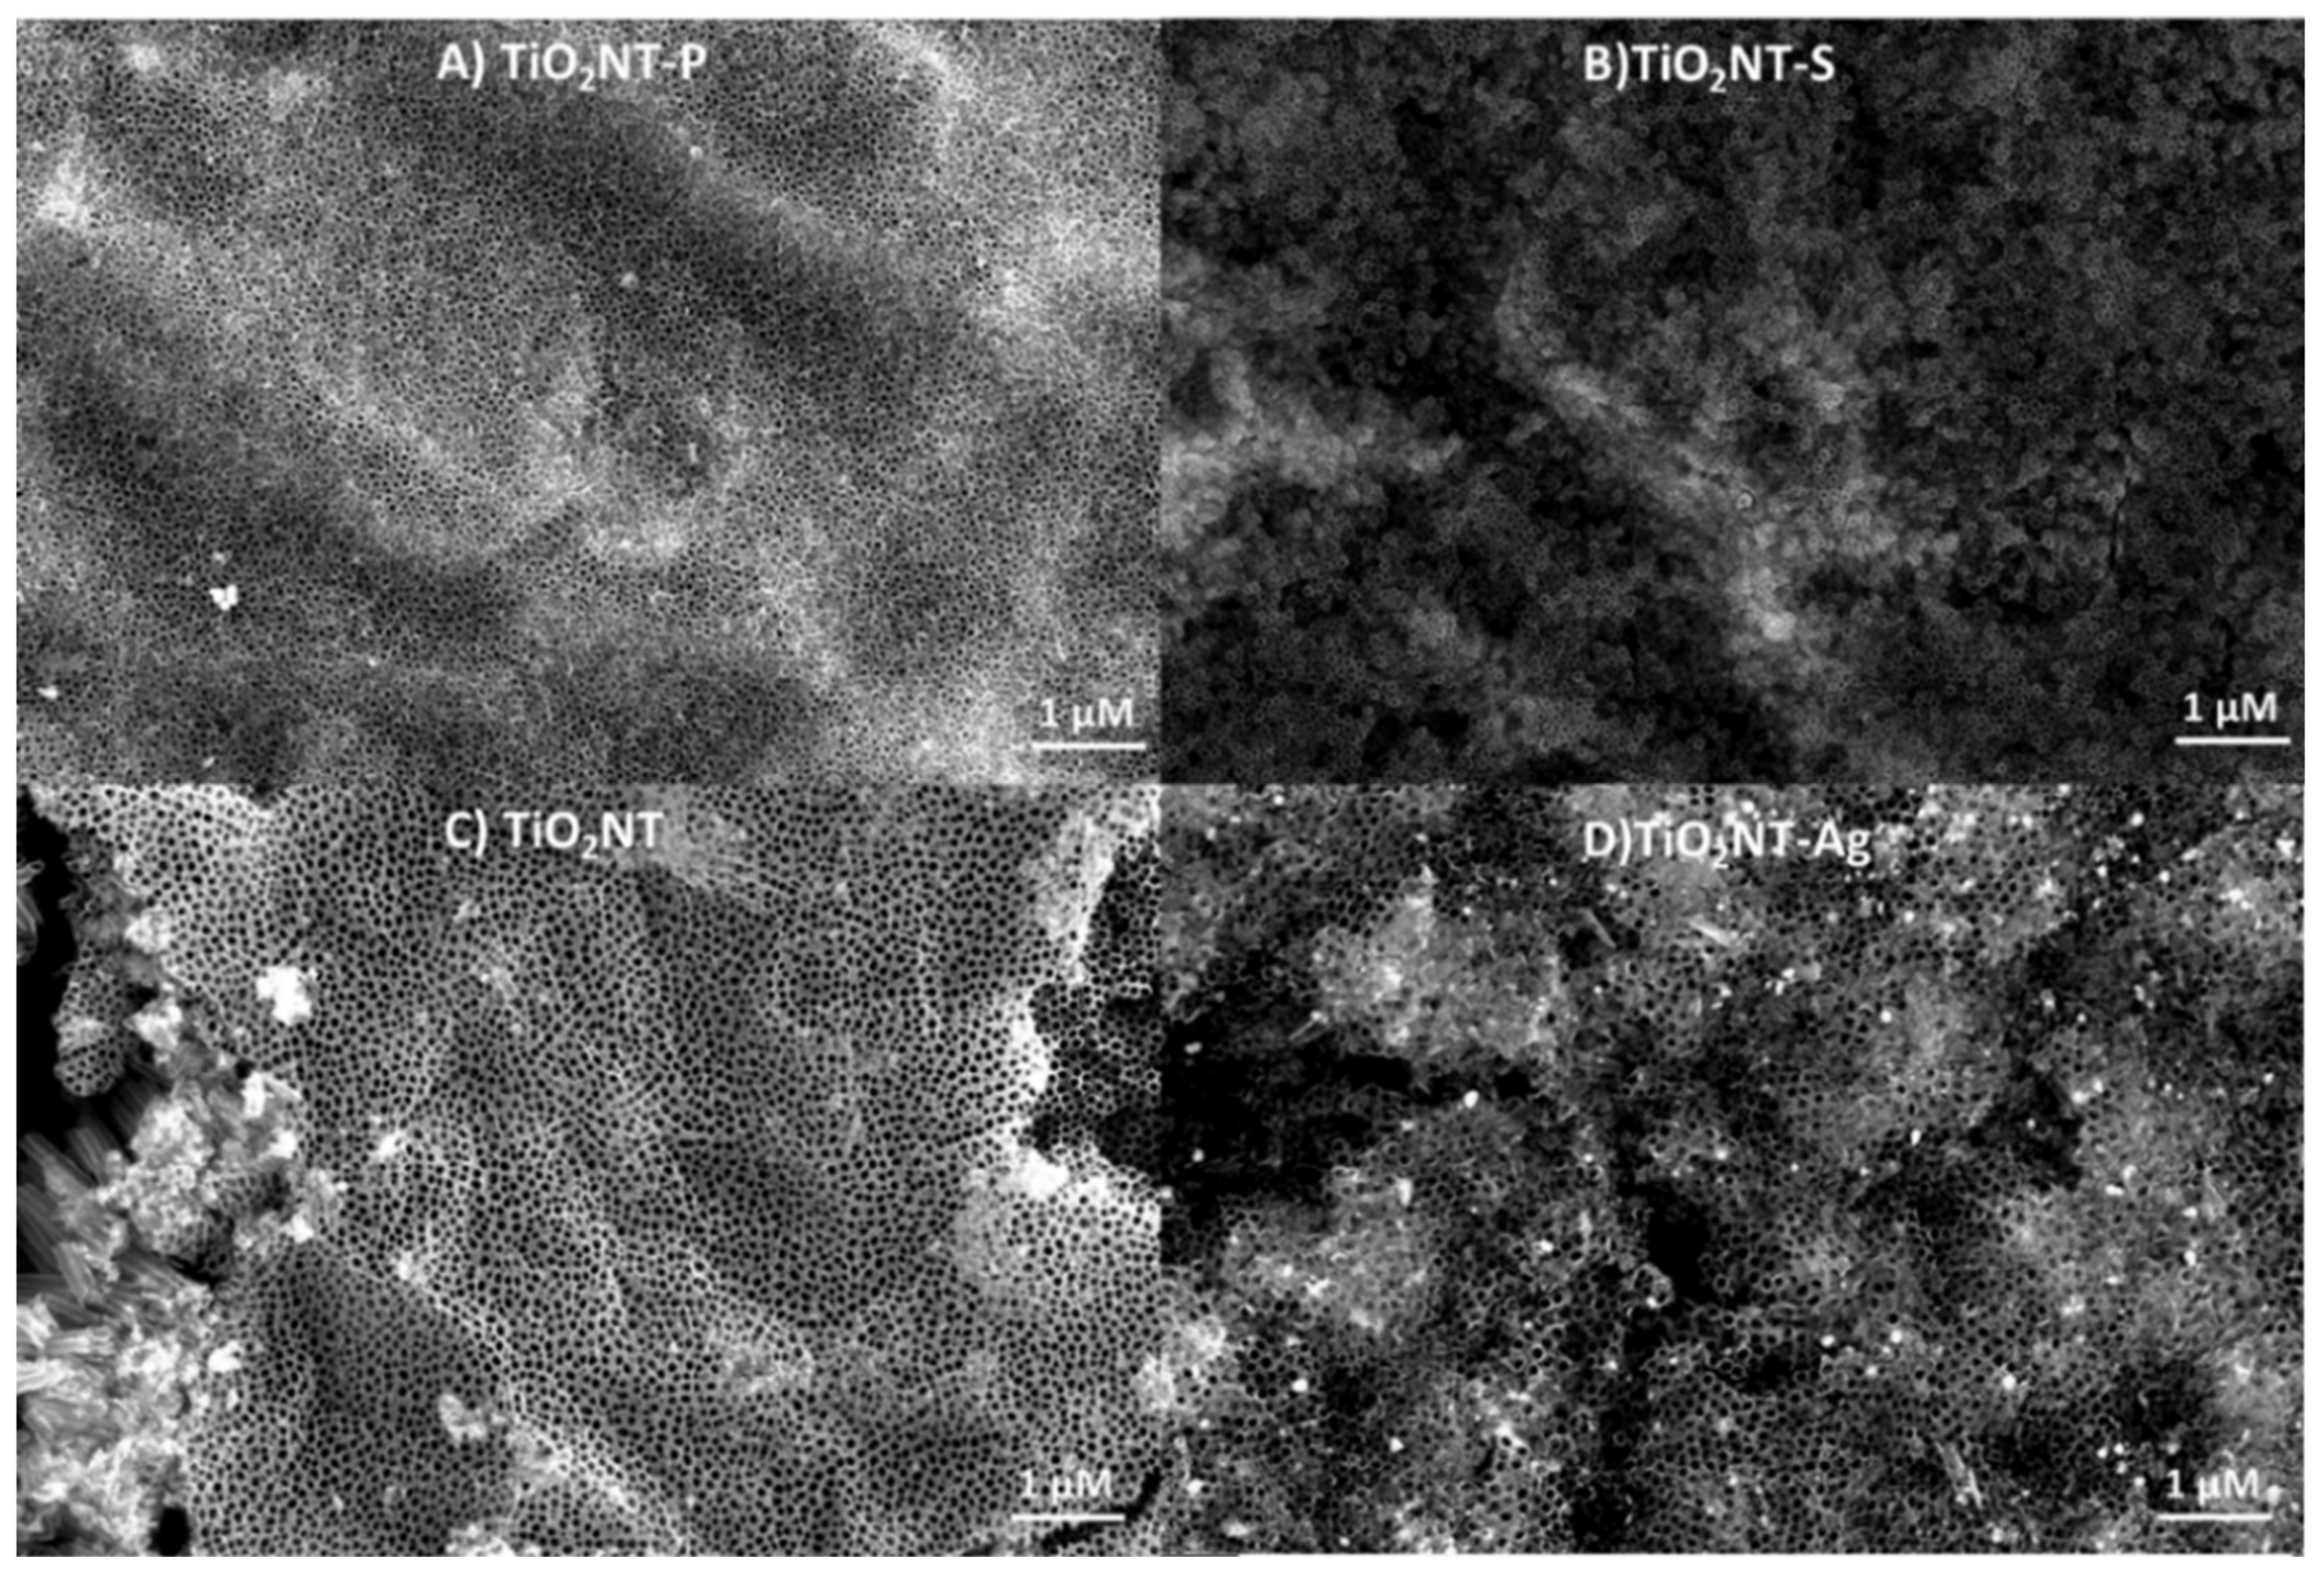
3.1. Characterisation of Titanium Dioxide Surfaces

The nanotubular structures are presented in panel form in Figure 3. The different synthetic methods resulted in the complete formation of nanotubes rather than just nanopores. The nanotube arrays synthesised in ethylene glycol had the more ordered and regularly shaped tubes (Figure 3A,B). The TiO2NT-S nanostructure is the most irregular, with tubes having vastly different diameters and with tubes growing to the side rather than vertically. The TiO2NT-P array on the other hand is more regular than that of TiO2NT-S. The materials produced in the organic electrolyte, whilst having a well-defined nanotubular structure, does not have prominent voids between the tubes. The separate tubes in Figure 3C can be attributed to the over etching of the more reactive titanium grain boundaries. Similar features can be seen in Figure 3D. The TiO2NT-Ag morphology differs from that of TiO2NT in that there are spherical silver nanoparticles on the surface. This indicates the successful deposition of silver nanoparticles resulting from the simple dipping process.
The morphological parameters of the surfaces produced are presented in Table 1. The most marked difference in morphology is in the thickness of the different nanotube arrays. The arrays produced in ethylene glycol are significantly thicker than those formed in the aqueous solutions. The difference in thickness between TiO2NT-S and TiO2NT-P indicates the effect of the longer process duration of the former. The nanotubes synthesised in the organic medium are also wider, whilst there is no appreciable difference in wall thickness.

3.2. Chemical Composition of the TiO2-NT Surface

EDX measurements were used to obtain information on the composition of the different nanotube varieties. The results are presented in Table 2. The nanotubes synthesised in the aqueous solutions have elements belonging to their corresponding solution, i.e., phosphorus and sulfate. The difference between the two arrays produced in ethylene glycol is the silver content in TiO2NT-Ag. The reading for silver in the TiO2NT-Ag indicates to an area devoid of visible nanoparticles, therefore suggesting that silver could have formed nanoparticles deep inside the tube structure, rendering them invisible.

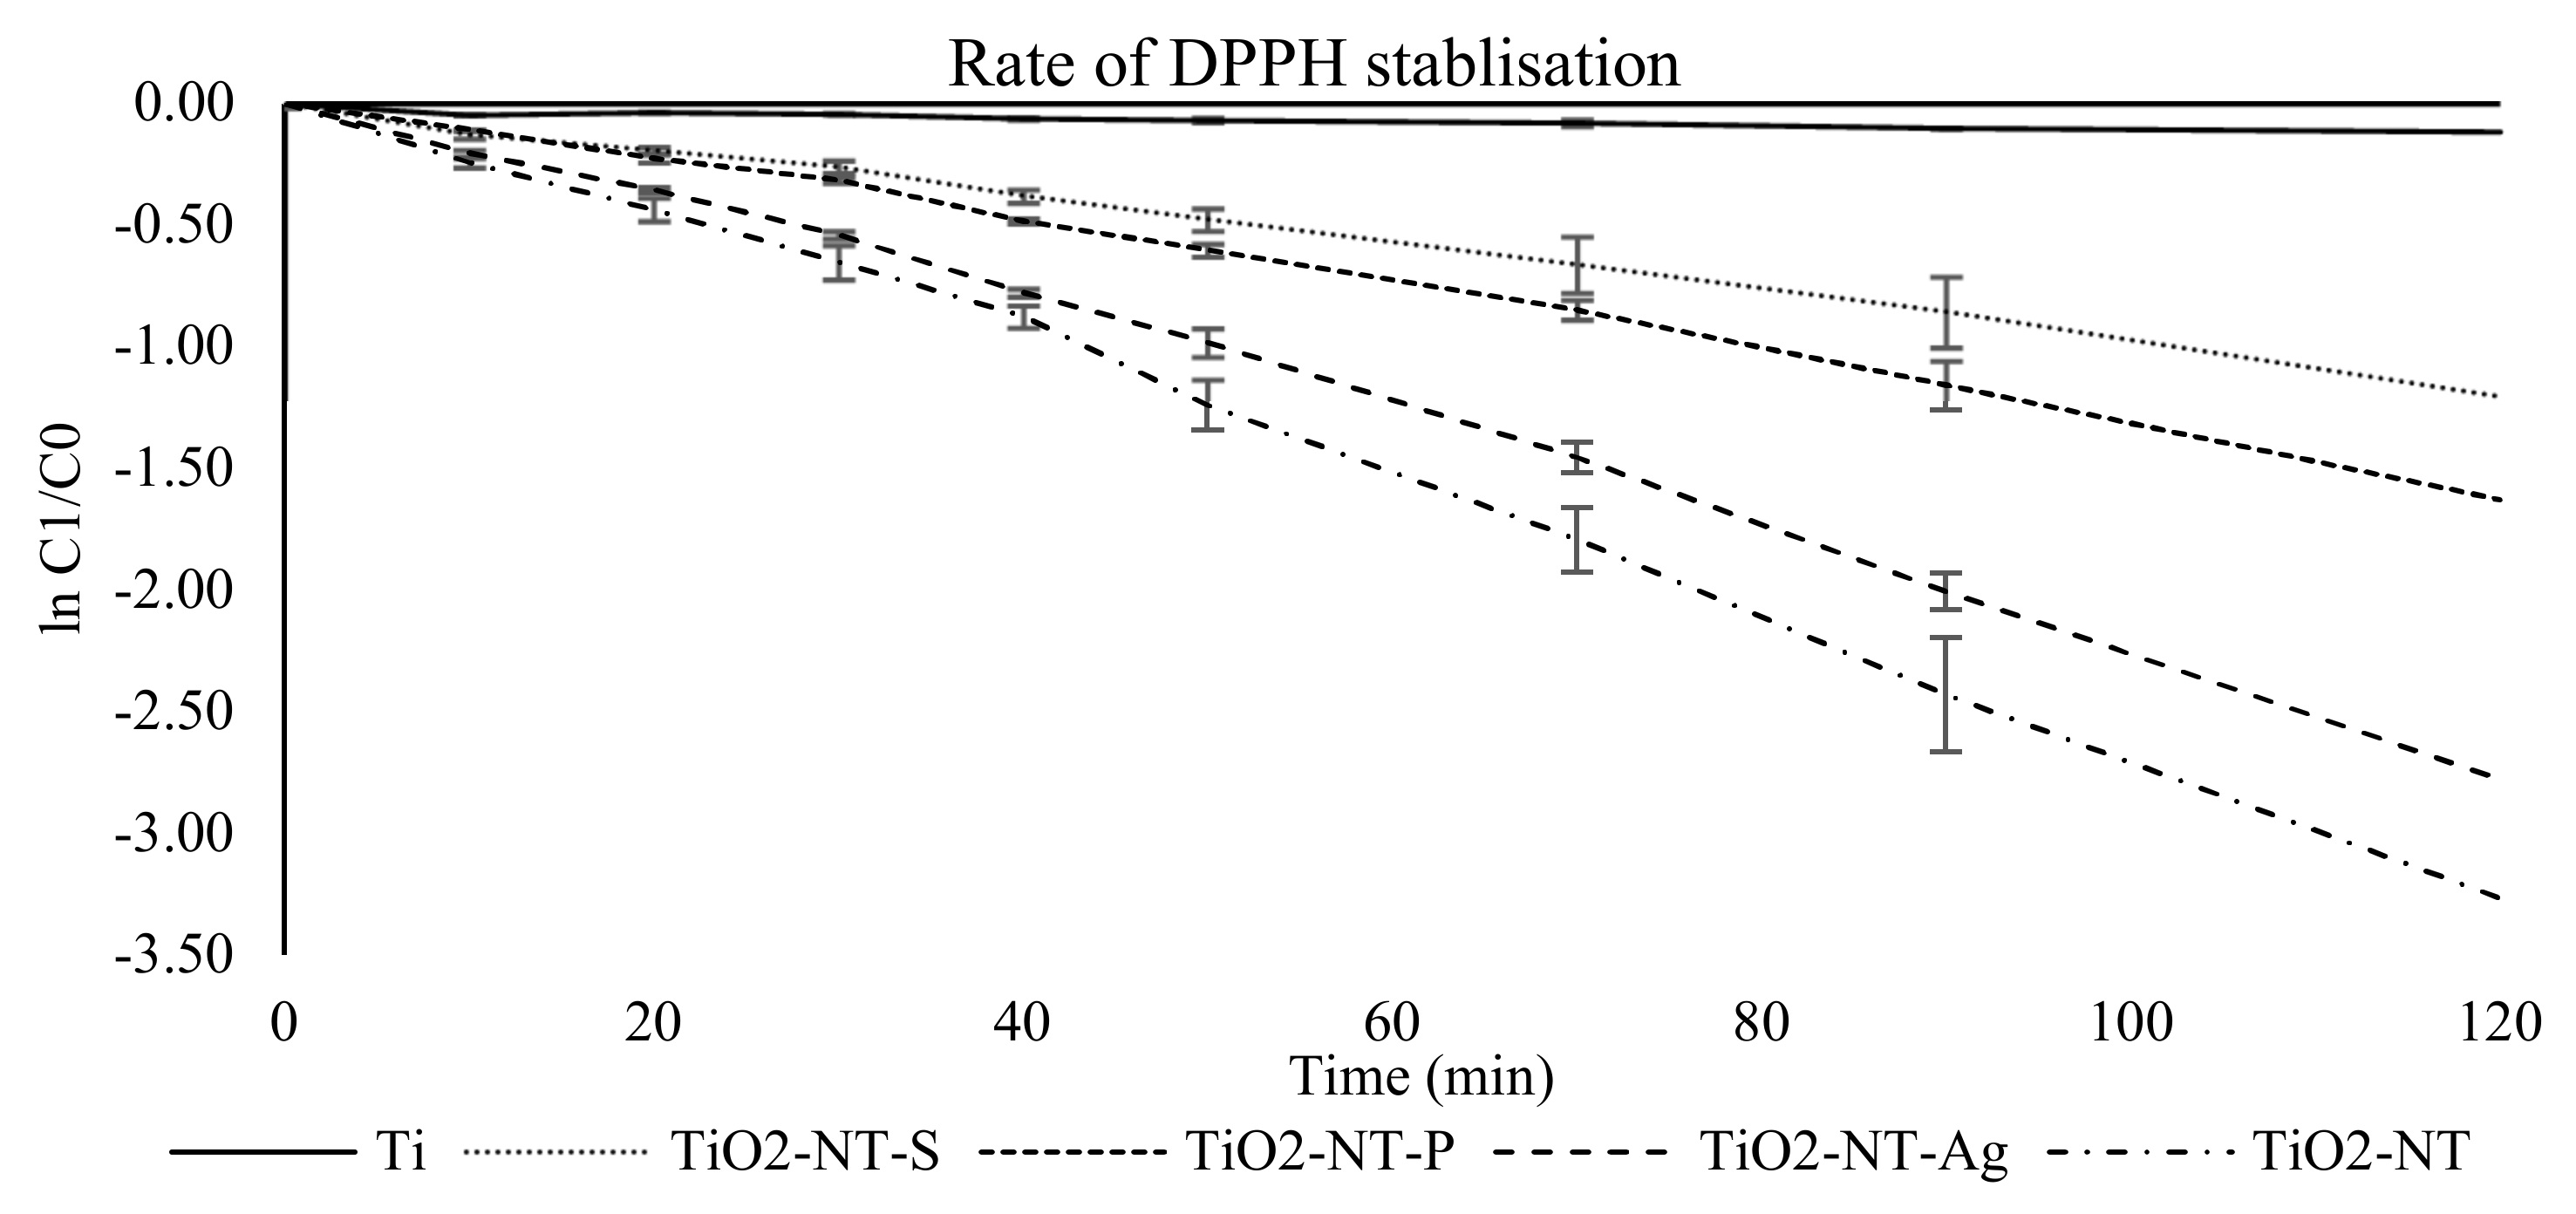
3.3. 2,2-Diphenyl-1-picrylhydrazyl (DPPH) Radical Stabilisation of TiO2-NT Surfaces

The DPPH assay was used as a measure of the catalytic activity of the surfaces. The reaction behind the decolourisation of the DPPH radicals seems to follow a pseudo first-order rate of reaction. This can be seen from Figure 4, where the plots of the logarithm of the absorbance at 532 nm against reaction time give straight lines for the different materials. The reaction rate constants, k, were determined from the gradient of each line. Figure 4 reveals that TiO2-NT and TiO2NT-Ag silver had a significantly higher rate of DPPH stabilisation when compared to the nanotubes formed in aqueous media.

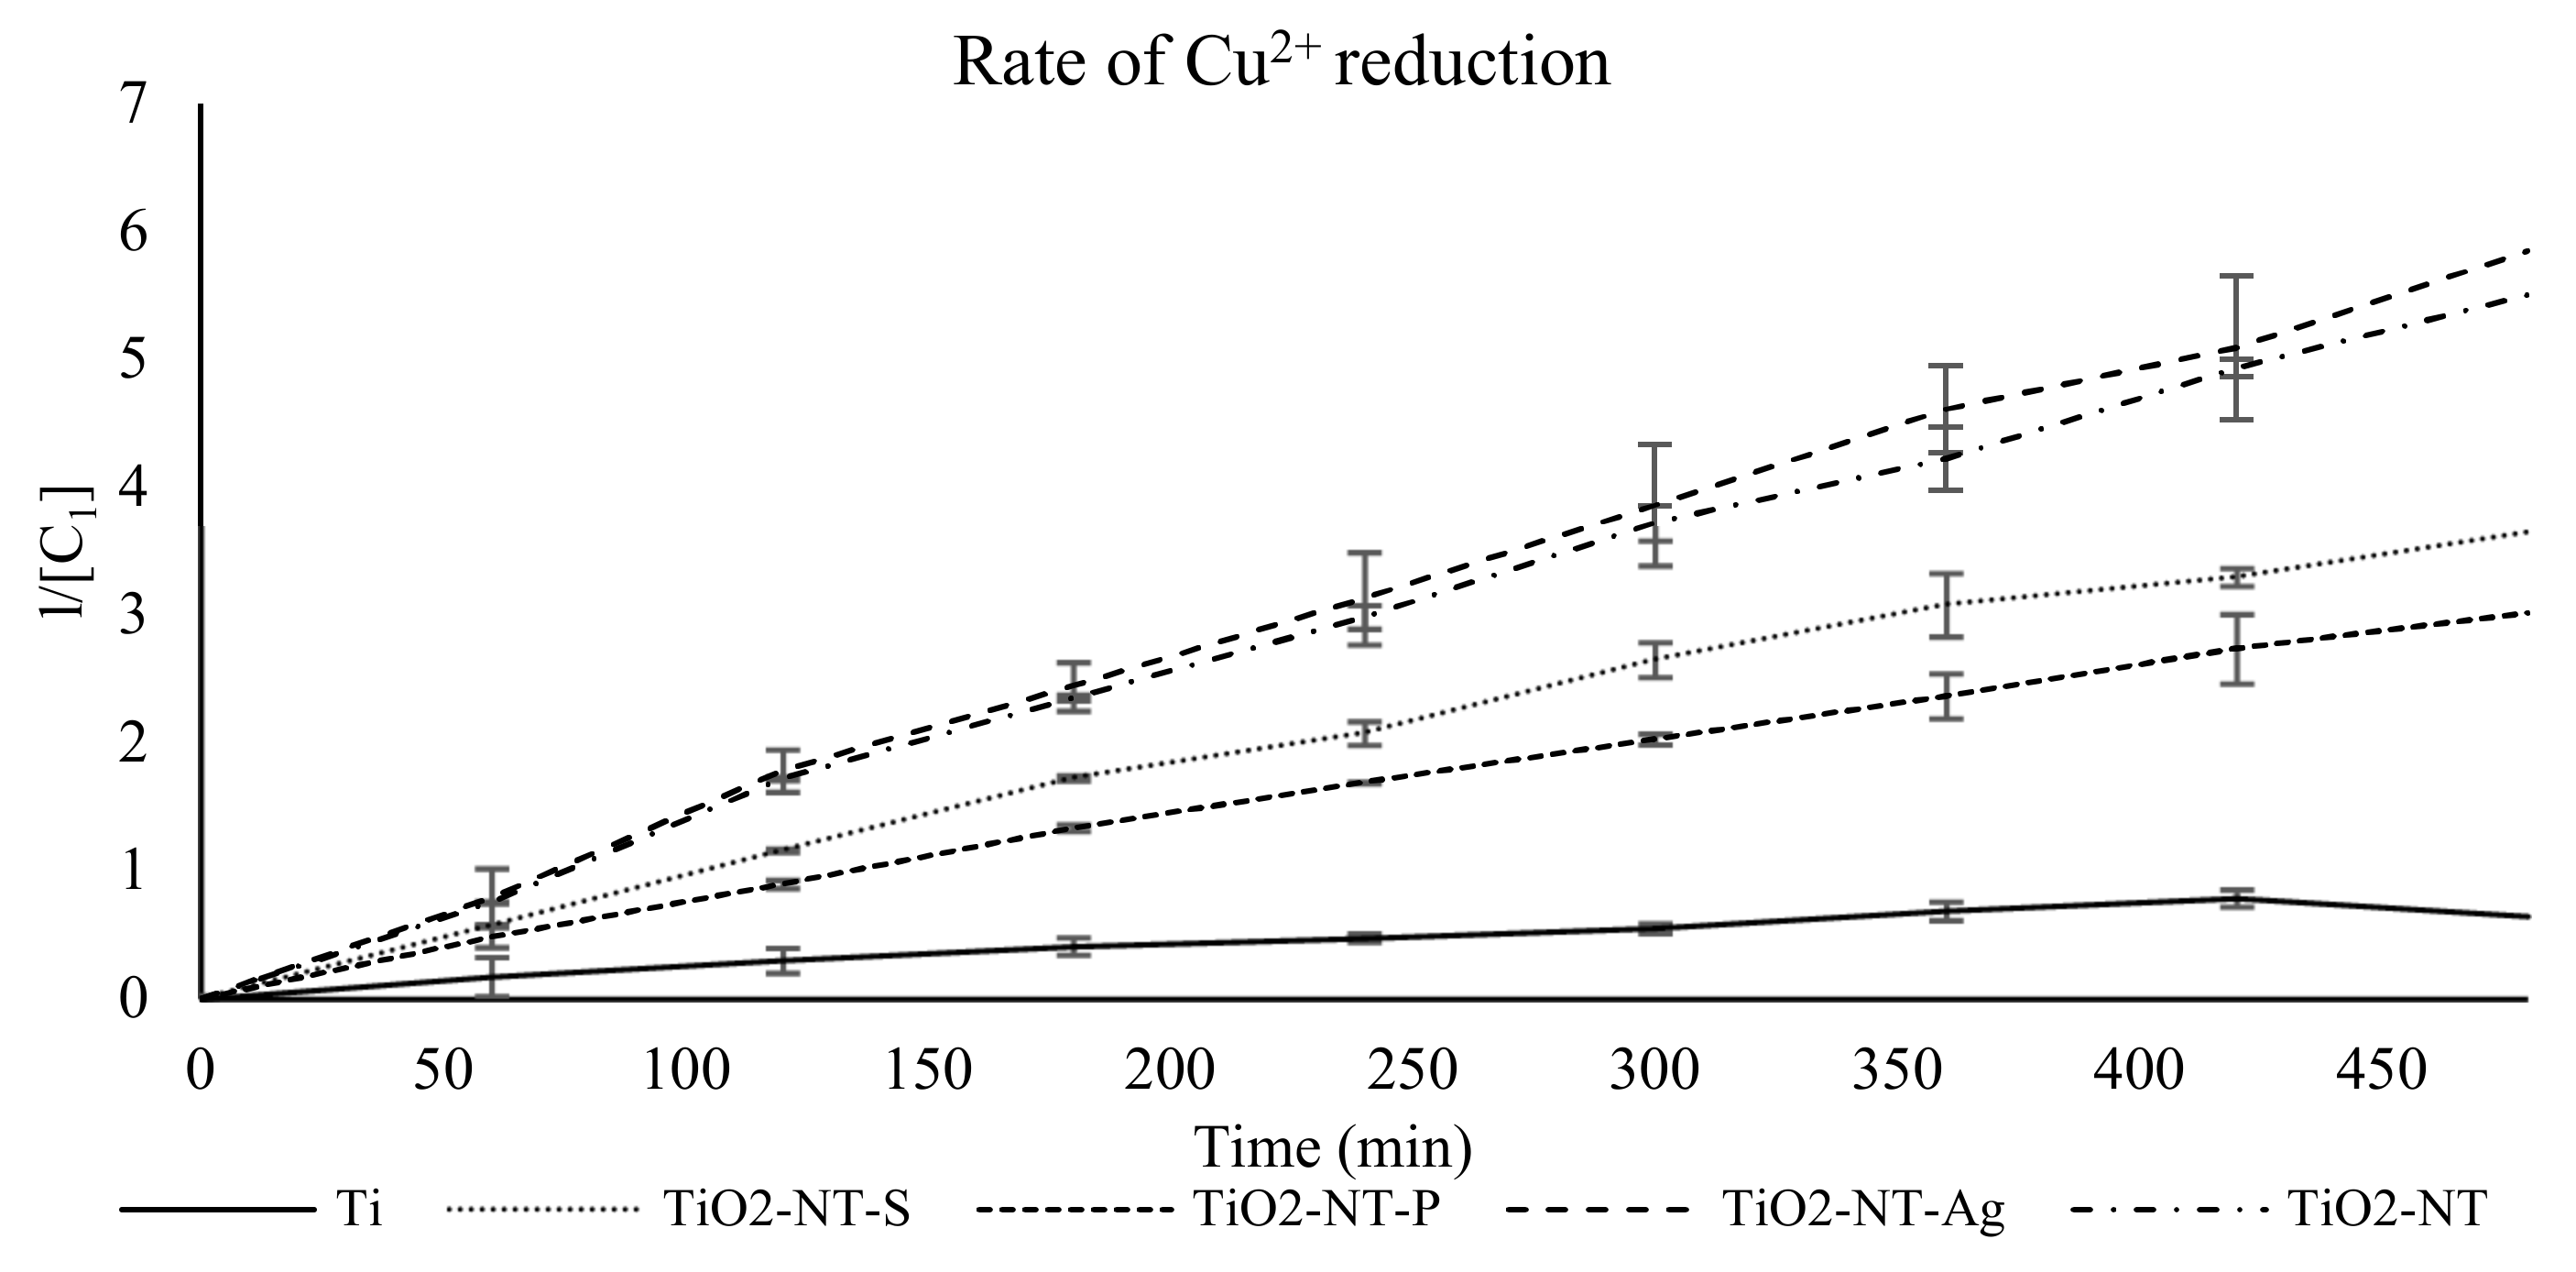
3.4. Cupric Ion Reduction Capacity of TiO2-NT Surfaces Using a Modified CUPRAC Assay

The potential reducing activity of the surfaces against Cu2+ ions was found to follow a second-order rate of reaction. This can be demonstrated in Figure 5, where the plots of the reciprocal absorbance at 450 nm against reaction time give straight lines for the different materials. The reaction rate constants k was determined from the gradient of each line. From Figure 4, it was shown that the TiO2-NT and the surfaces containing silver had a significantly higher rate of Cu2+ reduction when compared to TiO2NT-S and TiO2NT-P.

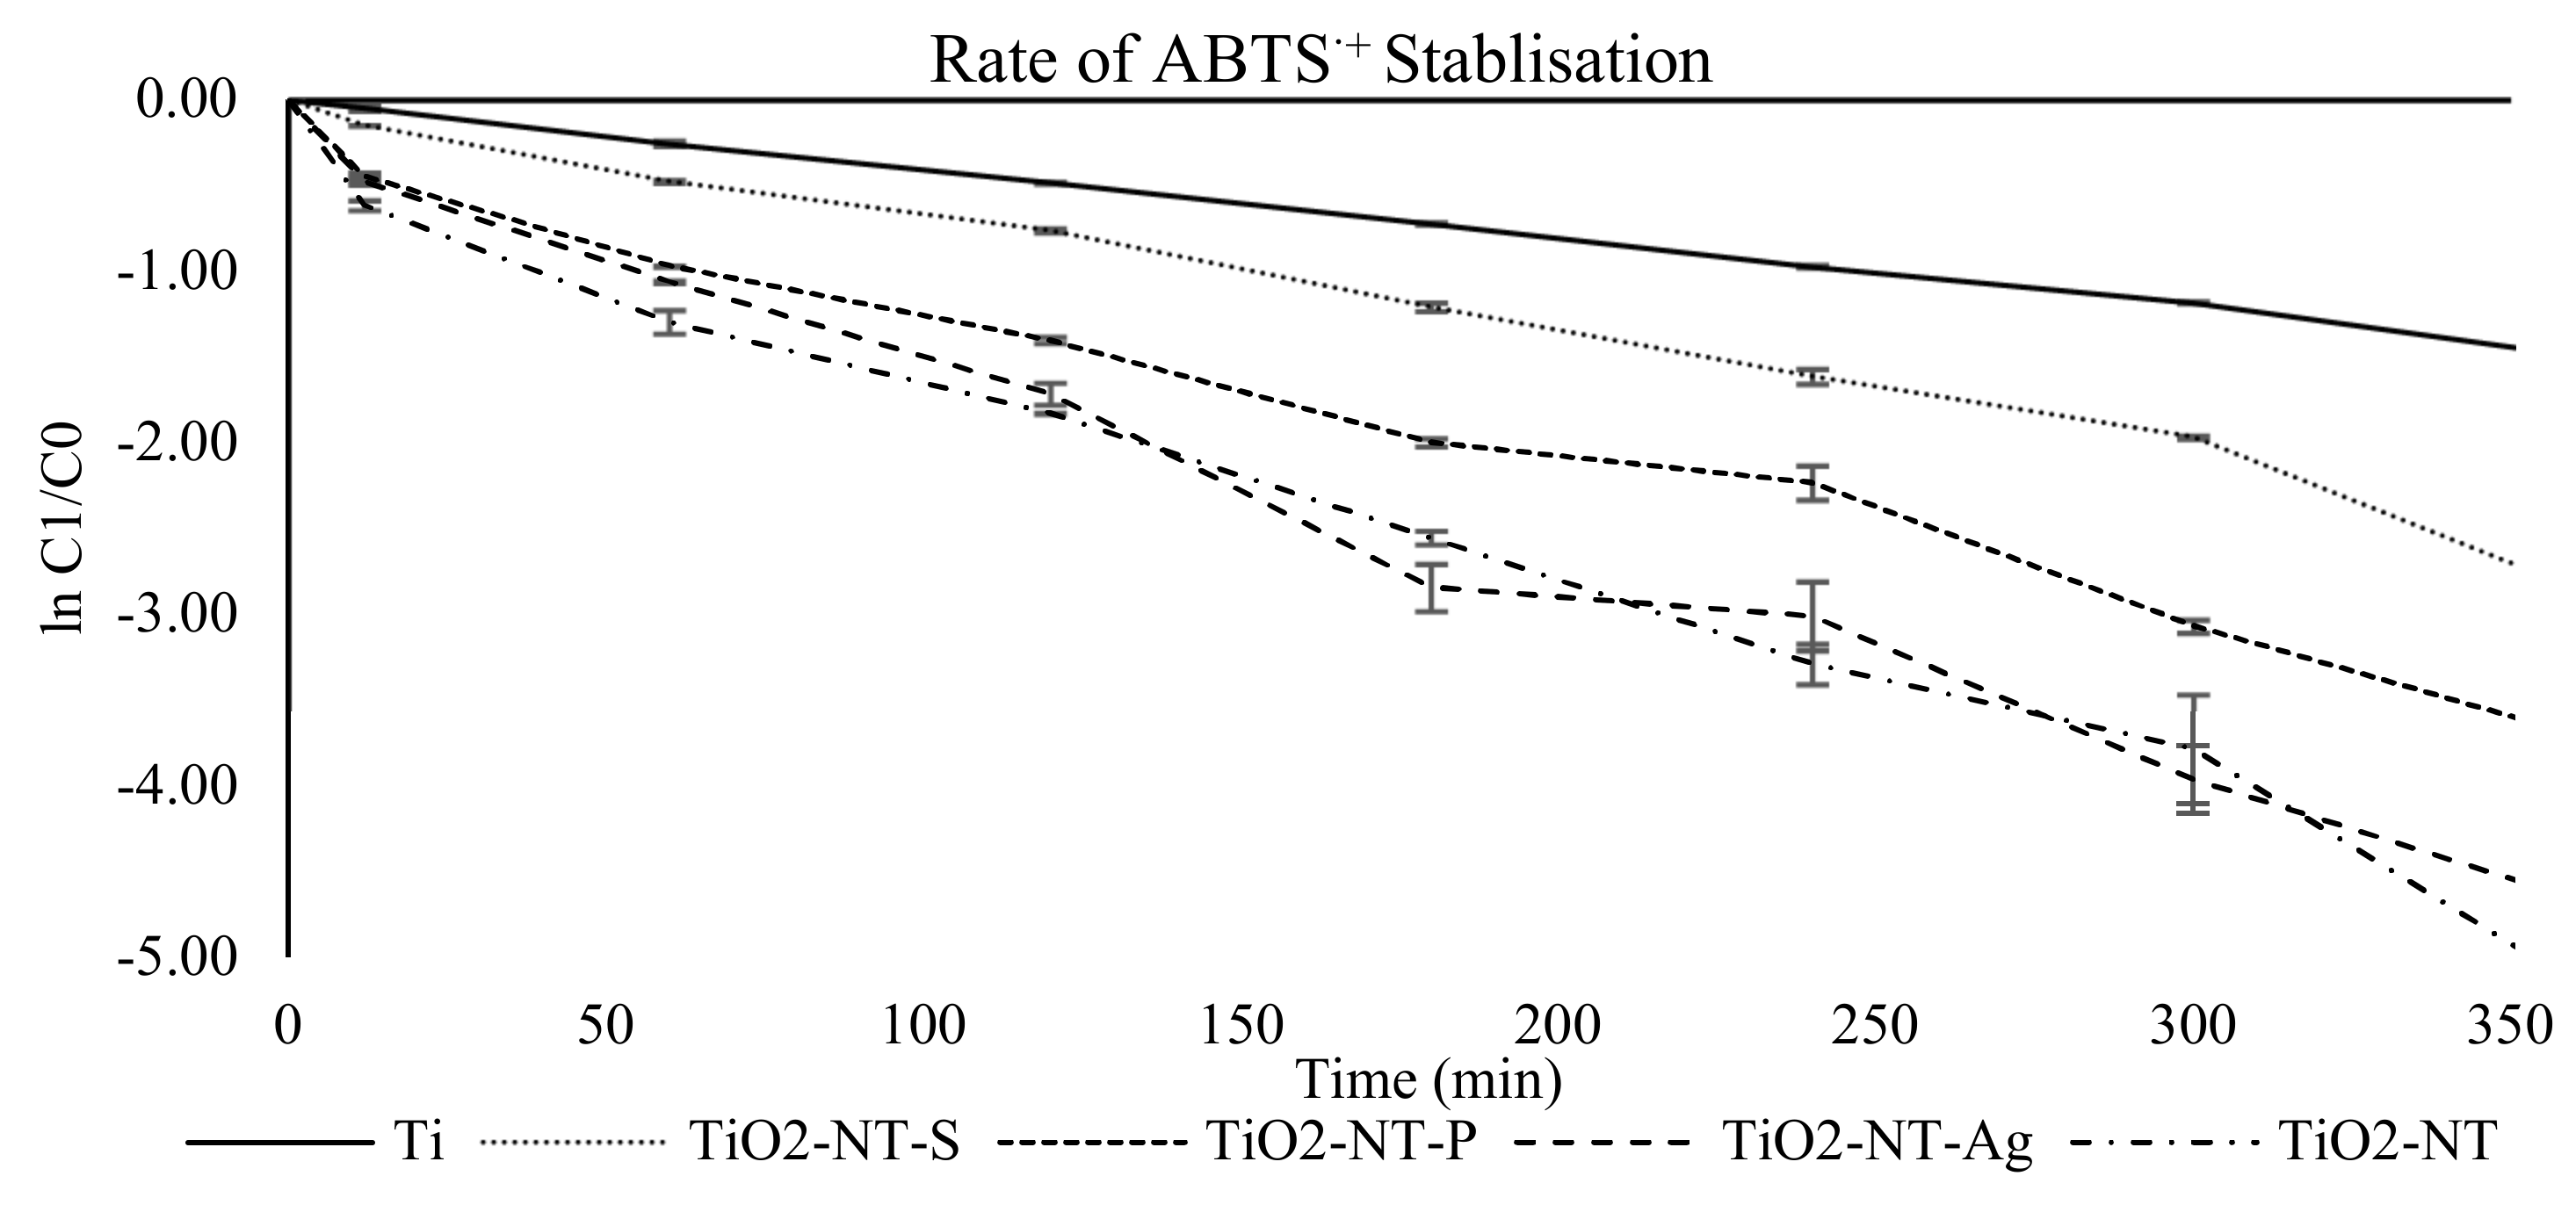
3.5. Determination of ABTS Radical Cation Stabilisation Activity of TiO2-NT Surfaces

As with the DPPH radical stabilization, the potential of ABTS radical cation stabilization was used as a measure of the catalytic activity of the surface. The reaction behind the decolourisation of the ABTS radicals seems to follow a pseudo first-order rate of reaction. This can be demonstrated in Figure 6, where the plots of the logarithmic absorbance at 734 nm against reaction time give straight lines for the different nanomaterials.

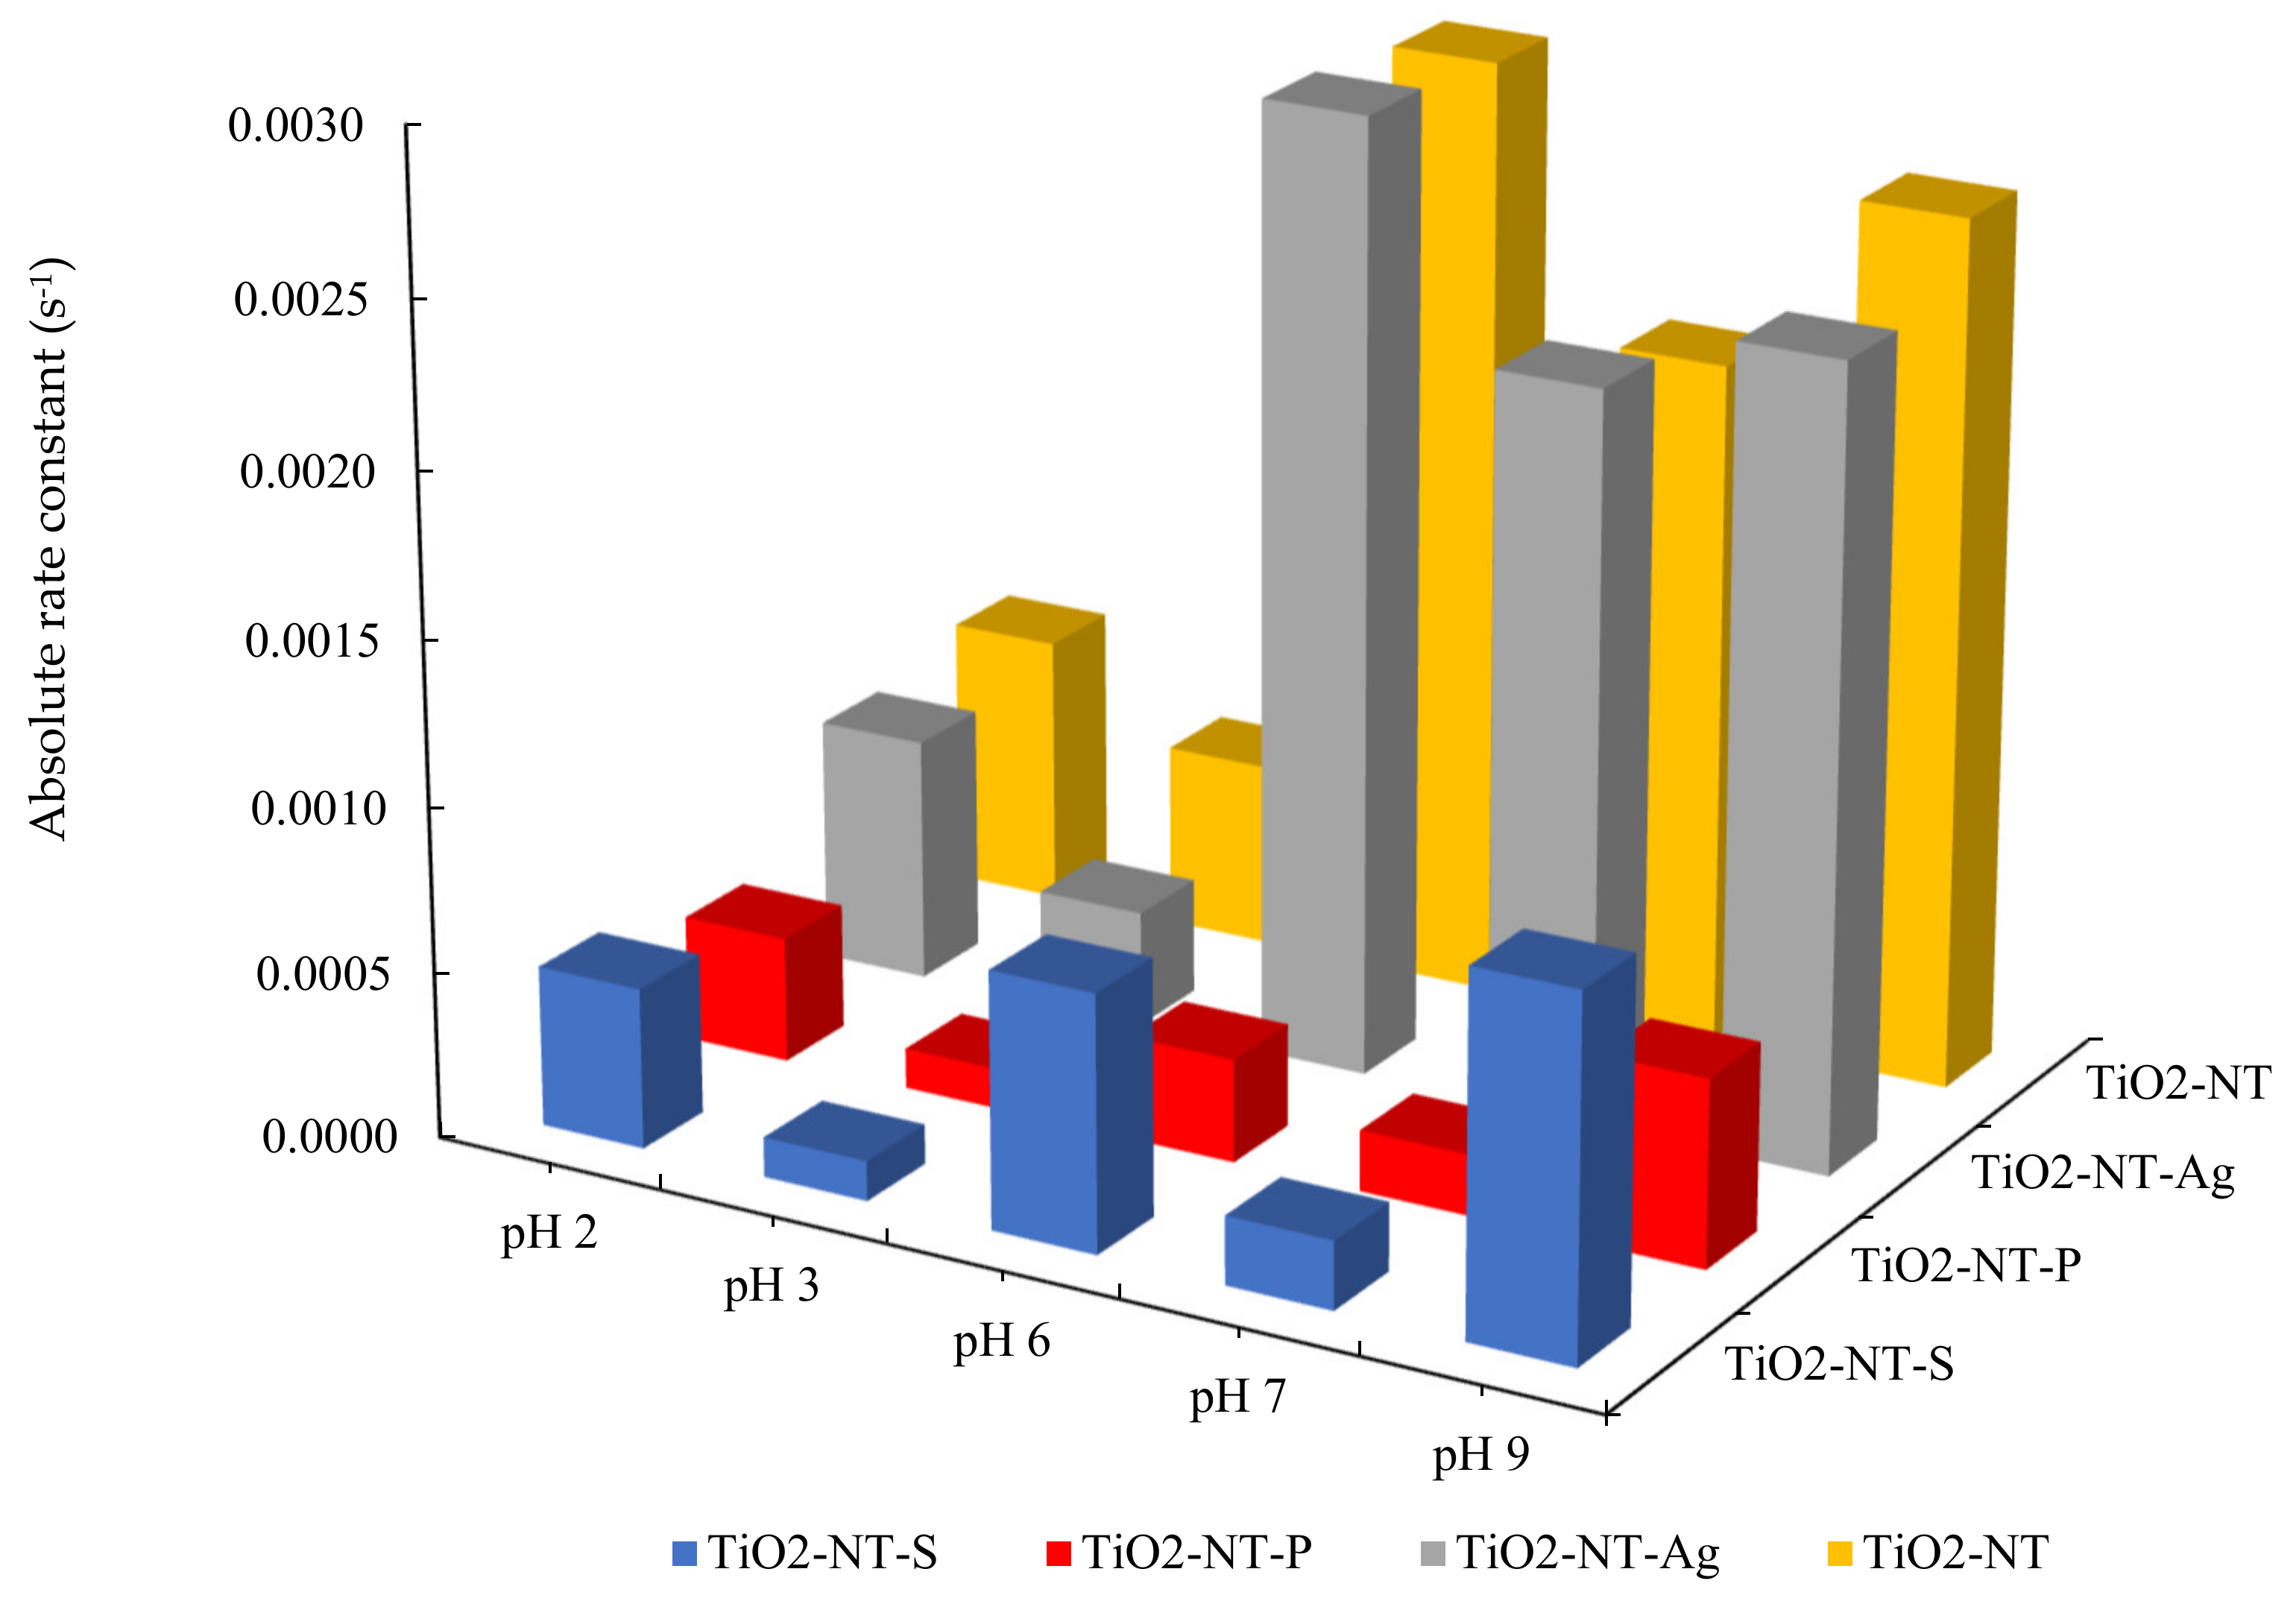
3.6. Determination of Chemical Degradation Activity of the of TiO2-NT Surfaces under Different pH Conditions

Tannic acid was used as a model recalcitrant contaminant and its degradation rate was recorded using UV-Vis spectroscopy. The absorbance at 276 nm was used as a direct measure of the amount of tannic acid present in solution. To determine the effect of pH on the surface activity, the 2 mg/L tannic acid was adjusted at four different pH’s. The absorbance of tannic acid decomposition was measured for each surface under different pH conditions, and the rate constant was determined using first-order reaction kinetics. The results shown in Figure 7 indicate that the rate constant varies with the type of surfaces as well as different pH conditions.

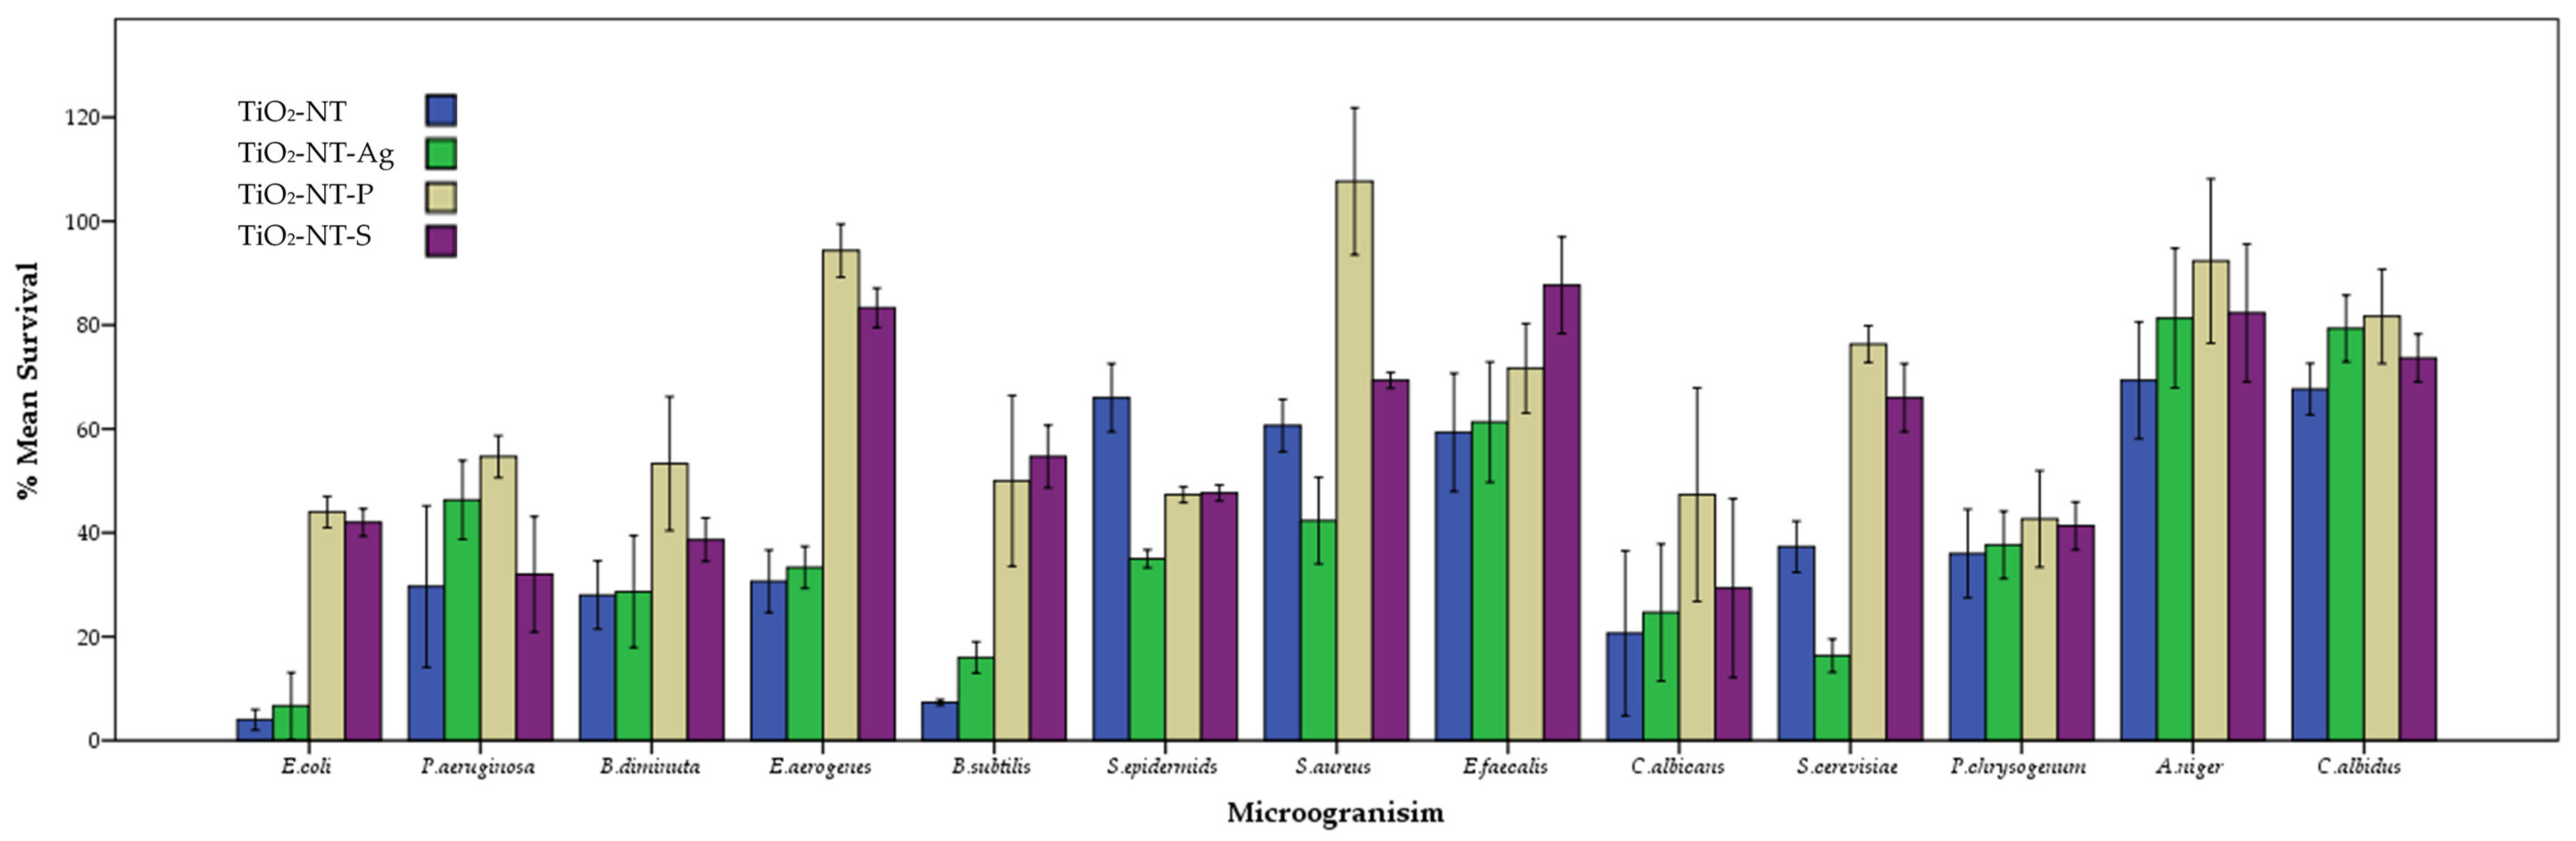
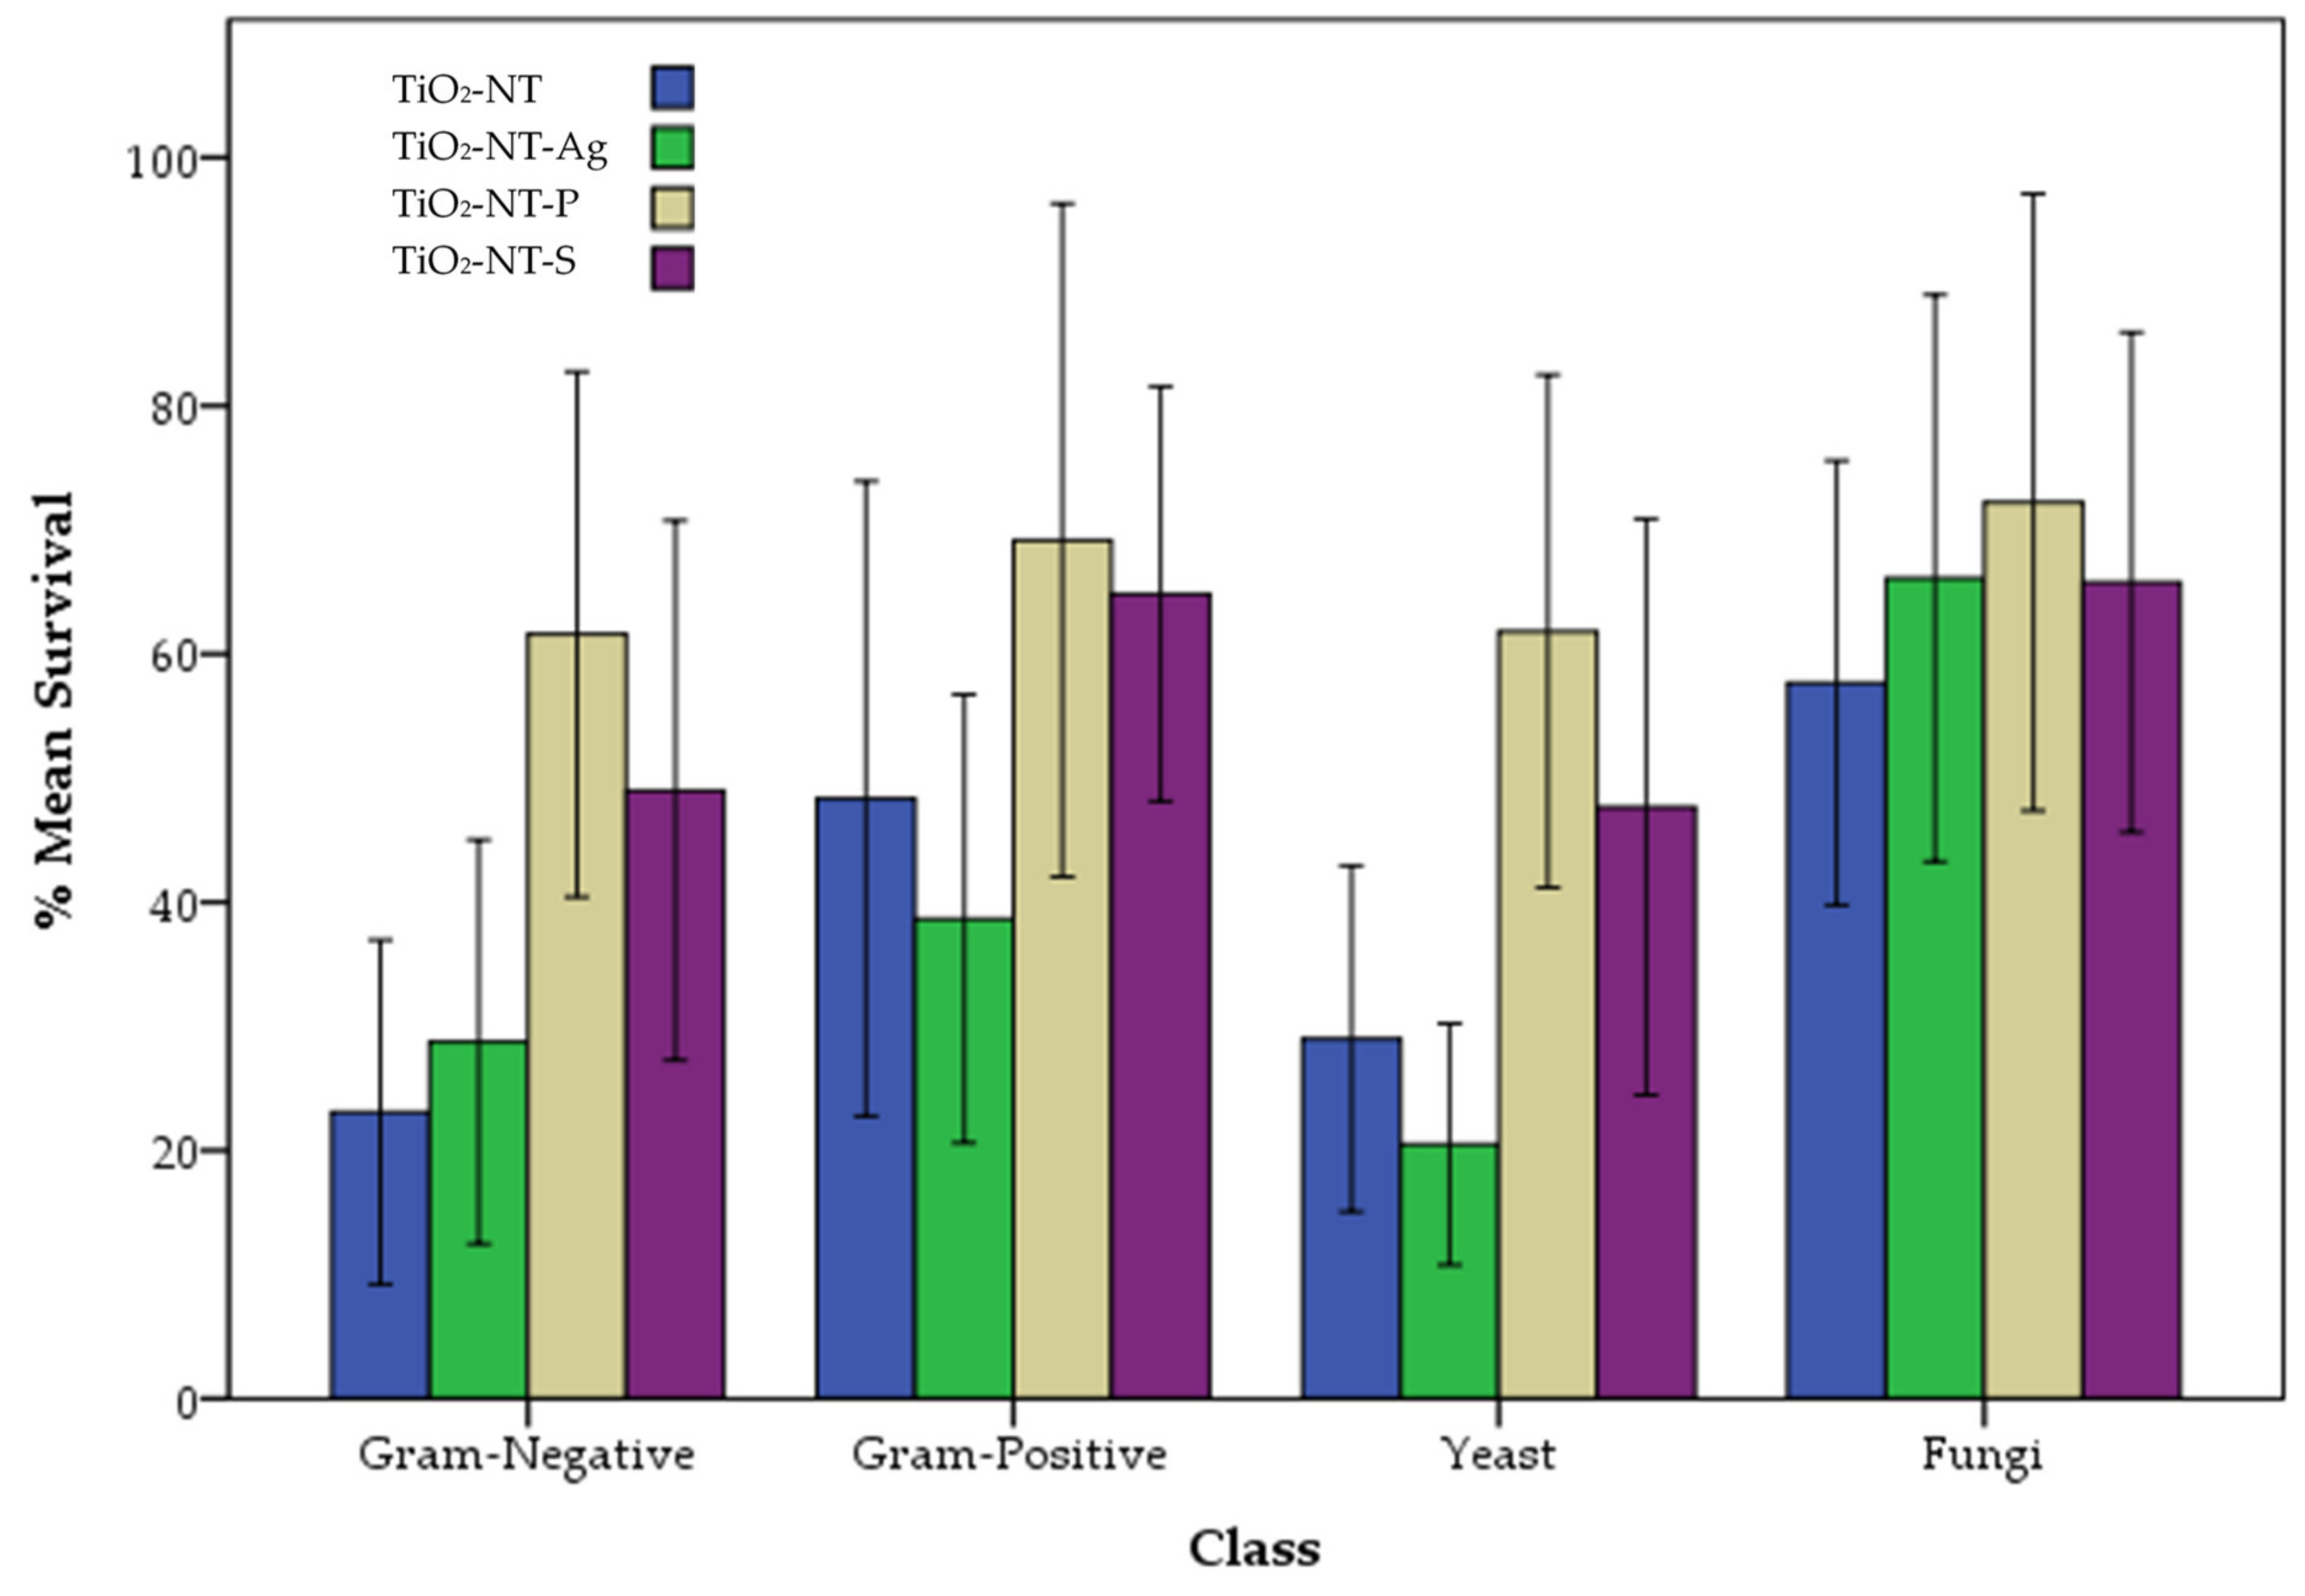
3.7. Determination of Antibacterial and Antifungal Activity of the of TiO2-NT Surfaces

The potential application of TiO2 nanotube layers as antimicrobial surfaces was determined against a panel of microorganisms composed of three Gram-positive and three Gram-negative bacteria, together with two yeast and three fungal organisms. The individual percentage mean survivability of the microorganisms tested on different surfaces is shown in Figure 8. The selection of microorganisms was based on cell wall variation and the experiment was designed to determine whether the cellular outer protective layer affects the susceptibility of microorganisms to the photocatalyst surfaces. Figure 9 shows the % survival rate of the microorganisms grouped combined into four groups, according to their characteristics using different materials.

4. Discussion

High-quality surfaces were produced using the three electrolytes and correspondingly different process parameters. The nanotube tops were completely etched open and devoid of any significant debris. The separation of the nanotubes produced in ethylene glycol into separate bundles shown in Figure 3C,D is due to the accelerated etching over the highly reactive grain boundaries. The grain boundaries are etched at a faster rate than the areas within the grain. The absence of this separation in Figure 3A,B is due to the lower potentials used. In Figure 3A,B, bright areas can be seen, which indicate that the nanotubes are growing over the high energy grain boundaries. The high potential used to produce TiO2NT and TiO2NT-Ag sustained a high dissolution rate, causing the separation of the tubes into bundles. The coverage of the TiO2NT-Ag surface with silver nanoparticles was relatively low, indicating that the dipping time was not sufficient or that the deposition could be aided by employing an electrophoretic method [28]. The effect of the potential on the layer thickness and tube diameter is immediately evident when the parameters presented in Table 1 are assessed. The higher potentials employed in the synthesis of TiO2NT-O and TiO2NT-Ag resulted in thicker arrays with wider tube diameters. The longer duration required for the production of TiO2NT-S resulted in a thicker layer than that in TiO2NT-P; however, the lower potential used still could not support the formation of layers as thick as those produced in ethylene glycol.
The approximate elemental compositions presented in Table 2 show that the differences between TiO2NT, TiO2NT-S and TiO2NT-P are due to the electrolyte being used. The phosphorus and sulfur detected in TiO2NT-P and TiO2NT-S, respectively, indicate the impregnation of the structure with the electrolyte. The efficiency of the cleaning process is limited by the nanostructure in the material that is trapped within the tubes and requires a more laborious process for its complete removal. Similarly, the silver content in TiO2NT-Ag can be attributed to the component of the solution that did not coalesce to produce nanoparticles. This might limit the effect of the integration process as the silver in this shape might not be suitable to form the Schottky junction required for the increased charge transfer separation [29,30].
The application of electron-based antioxidant assays on TiO2-NT surface allowed for the determination of the surface activity towards the stabilisation of DPPH and ABTS radicals. Figure 3, Figure 5 and Table 3 show that surface synthesised at 20V (TiO2NT-S and TiO2NT-P) had a significantly lower rate of DPPH and ABTS radical stabilisation potential when compared to TiO2NT and TiO2NT-Ag. The stabilisation of these radicals was attributed to the photogenerated electrons, as well as other intermediates generated from the participation of the solvent and oxygen present in the solution. The latter reacted with surface generating free radicals stabilising ABTS•+ and DPPH radicals. This indicates that the surfaces produced in the organic medium had a higher electron and reactive oxygen species production rate. The direct interaction of the oxidizing agent with the excited conduction band electrons were considered for these molecular probe experiments. In the case of ABTS•+, the reaction was possible by considering the standard potential of ABTS•+ (Equation (1)) reduction coupled with water oxidation in aqueous media, along with the TiO2 conduction band potentials (Equation (4)) as determined by Kadnikova and Kostic [31] and Yoneyama [32]. Similarly, the feasibility of the reaction with respect to DPPH radicals (Equation (3)) was determined using the electrode potentials determined by Zhuang et al. [33]. Both reactions were found to be thermodynamically feasible with a positive overall electromotive force. Similarly, in the case of CUPRAC, the redox potential of Cu(II,I) chelated to neocuproine was found to be E0 = 0.6 V (Equation (2)), as determined by Apak et al. [18] This is close to that of ABTS•+/ABTS (E0 = 0.68 V); hence, the electron transfer from the TiO2-NT surface conduction band was also thermodynamically feasible.
ABTS•+ + e → ABTS [0.68V]
Cu(Nu)2+ + e → Cu(Nu)+ [0.60V]
DPPH + e → DPPH[0.62V]
TiO2 + e → TiO2 (e) [−0.50V]
ABTS•+ + TiO2 (e) → TiO2 + ABTS [1.18V]
Cu(Nu)2+ + TiO2 (e) → TiO2 + Cu(Nu)+ [1.10V]
DPPH + TiO2 (e) → TiO2 + DPPH [1.12V]
The variation in the rates of reaction for the different TiO2 morphologies can be explained in terms of both (1) the structural variation caused by the electrolyte being used and (2) the manipulation of the structural growth on the surface influenced by the different process parameters, namely the potential. In TiO2, the absorption of light containing sufficient energy results in electrons being promoted from the valence band to the conduction band leaving behind voids, or photoholes (h+), in the valence band. The promoted electrons migrate to the surface and can later react with other chemical compounds. However, the most reactive form of TiO2, anatase, has a low quantum yield and the promoted electrons can rapidly recombine with the void holes generated in the valence band. The scope of controlling or obtaining a specific morphology is to increase the reactivity of the TiO2 through enhancing the ability of the surface to interact more with the pollutant or the light.
The results obtained showed that layer thickness, rather than wall thickness, and tube diameters had the largest effect on the rate of reaction. In fact, with respect to DPPH, ABTS and Cu2+ ions, the reaction rate was found to decrease by almost half when the TiO2NT-S and TiO2NT-P surfaces were compared to TiO2NT and TiO2NT-Ag surfaces. Of the different morphological features presented in Table 1, photocatalytic activity is largely reliant on the thickness of the nanomaterial layer, and hence the exposed area. This is inferred when the thickness of the samples prepared in ethylene glycol, namely the TiO2NT and TiO2NT-Ag surfaces are compared to the TiO2NT-S and TiO2NT-P surfaces, prepared in the aqueous media. The thickness of the former is several times larger than that of the other two materials. The difference in activity between TiO2NT-S and TiO2NT-P towards the redox probes is not a clear cut and indicates different affinity of the molecules to the surface. This may be due to a different number of hydroxyl groups on the surface. The addition of silver to the bare TiO2NT did not provide any appreciable benefits. This could be due to the low surface coverage with the spherical nanoparticles. The high content of impregnated silver can be misleading, in that while it is present it is not contributing to the formation of the Schottky junction which will promote a higher activity. This is likely to be due to the silver being incorporated along the tube length, resulting in little to no contact with the solution or the UV source.
Whilst ABTS, DPPH and CUPRAC assays are based on the reduction-based reactions, the removal of tannic acid and microorganisms are attributed to the oxidation reactions that occur at the surface of the titanium dioxide nanotubes. This photodegradation mechanism is based on the conversion of organic compounds into harmless gaseous CO2 and water. This can occur through the direct interaction between tannic acid and the generated holes to produce an oxidized product (Equation (17)) or else through the photolysis of water, which generates free oxidizing radicals (Equation (18)) that, in turn, oxidize tannic acid. The generation of free radicals generally follows a ten-step process. The initiation step involves the absorbance of UV light by TiO2 (Equation (8)), which causes an electron propagation to the conduction band and a positive hole generation in the valence band [34,35]. The photohole generated reacts with water causing photolysis of water to H+ and OH (Equation (9)). Furthermore, the photoholes neutralize OH groups to produce more OH radicals (Equation (10)). The promoted electron in the conduction band reacts with dissolved oxygen found within the solvent to produce superoxide anions (Equation (11)), which are neutralized by protons in solutions to form perhydroxyl radicals (Equation (12)) that combine and form hydrogen peroxide (Equation (13)) [36]. The hydrogen peroxide formed under UV light decomposes to release more hydroxyl radicals and anions (Equation (14)). The oxidation of tannic acid occurs through the reaction with hydroxyl radicals generated through the photolysis of water [37].
TiO2 + hν → e CB + hVB+
TiO2(hVB+) + H2O → TiO2 + H+ + OH
TiO2(hVB+) + OH → TiO2 + OH
TiO2(eCB) + O2 → TiO2 + O2−•
O2− • + H+ → HO2
2HO2 → H2O2 + O2
H2O2 + e → OH + OH
Tannic acid + OH → degradation products
Tannic acid + hVB+ → oxidation products
Tannic acid + eCB → reduction products
Figure 7 shows the rate constants obtained for the different TiO2NT surfaces under different pHs. The results indicate that, in general, as the pH values decrease, the rate of tannic acid decomposition decreases; however, this does not vary in a linear fashion. To understand the influence of pH on photocatalytic degradation, several factors need to be taken into consideration, including the charge of the surface and the tannic acid at each pH and also the concentration of radical precursors in solution. The surface charge is greatly affected by the pH of the solution. An isoelectric point at approximately pH 6 is widely reported for titanium dioxide surfaces in contact with aqueous solution [38,39,40]. Thus, it is expected that, below the isoelectric point, the TiO2 surfaces would be positively charged, while, above the isoelectric point, the TiO2 surfaces would be negatively charged due to the following ionization reactions.
TiOH + H+ → TiOH2+
TiOH + OH = TiO + H2O
Similarly, tannic acid being a weak organic acid (pKa = 6), at acidic pH, the molecule exists at its protonated or undissociated form, while, in alkaline conditions, above pH 6, it exists as a deprotonated dissociated form of anions. Thus, it is expected that, at low pH conditions (pH 2 and 3), there would be an electrostatic repulsion between the positive charges carried onto the surface and the tannic acid molecule; in turn, the rate of degradation would be much slower. The rate of reaction increases drastically at pH 6, which correspond to the isoelectric point of both the tannic acid and surface, thus resulting in an equal amount of attraction and repulsive forces between the two. Increasing the pH beyond 7 results in a slight drop in the reaction constant. This is attributed to the repulsive forces between the negative surface and the deprotonated forms of tannic acid. A further increase in pH should surely cause the Coulombic repulsion [41,42] to be accentuated; however, similar to what was observed by a number of researchers [43,44], this was not the case, as the rate of reaction increased drastically. It has been proposed [45] that a higher concentration of OH radicals is generated by photogenerated holes due to the high concentration OH- ions. Table 4 summarizes the electrostatic forces and the charges that occur with an aqueous solution of tannic acid exposed to TiO2 surfaces. Figure 7 further demonstrates that TiO2NT and TiO2NT-Ag surfaces had a larger rate constant irrelevant of the pH of the medium. This further indicates that the layer thickness had an effect where a lower generation of photoholes decreases the production of hydroxyl radicals and active sites for the oxidation of tannic acid.
The antimicrobial potential of TiO2 nanotube arrays’ surfaces has been determined for the different microorganisms, as shown in Figure 8. To determine whether the observed activity is related to the thickness and chemical composition of the cell wall, the microorganisms were grouped into groups reflecting the cell wall characteristics, as shown in Figure 9. Statistical analysis showed that the data did not deviate from normality, as a p-value of 0.075 was observed for the Shapiro–Wilk normality test. The application of one-way ANOVA using the Tuckey post hoc test showed that TiO2NT and TiO2NT-Ag surfaces were equally effective (p-value 0.999) in the removal of microorganisms, while also being significantly different for TiO2NT-S (p-value 0.003) and TiO2NT-P (p-value < 0.001). Furthermore, there were no significant differences in the observed survivability of microorganisms between TiO2NT-S and TiO2NT-P surfaces (p-value 0.336). These observations further indicate that the activity of the thinner layers is inferior to that of their thicker counterparts. The difference in antimicrobial activity between TiO2NT-S and TiO2NT-P is not immediately evident, possibly indicating that the interaction of the microorganisms with the surfaces might also influence the reaction rate. The formation of organic surface layers that may form after the lysis of the cell membrane might interfere with the interaction of the other bacteria with the oxidising species. The shape of the tubes might provide preferential sites for attachment of the bacteria resulting in a fouled surface. The addition of silver was also ineffective, indicating that it was present in a sub-biocidal dose. Studies carried out by Anitha et al. and Hajjaji et al. [46,47] show that biofilm formation and bacterial inactivation on titanium nanotubes are dependent on the pore diameter, surface roughness and defects. The smaller the pore diameter, the larger the amount of biofilm formed whilst the bacterial inactivation was increased with a decrease in surface defects. Furthermore, Pham et al. [48] showed that the addition of 20 ppm of silver nanoparticles to titanium nanotubes eliminated 99.99% of Staphylococcus aureus after 60 min under sunlight irradiation. In this study, the TiO2-NT-Ag only resulted in the removal of 58.2% of Staphylococcus aureus, indicating that the impreganation process used was not suitable. This could be due to the incomplete adhesion of the particles to the surface, which did not provide a suitable contact area for the formation of a Schottky barrier.
To determine the difference in the susceptibility of a microorganism to TiO2-NT surfaces, these were grouped into four groups depending on the characteristic of the cell walls of different microorganisms, as shown in Figure 9, corresponding to Gram-negative bacteria, Gram-positive bacteria, yeast, and fungi. Statistical analysis showed that there was a significant difference in % survivability between Gram-positive and Gram-negative bacteria (p-value 0.015) and between fungi and yeast (p-value < 0.001). On the other hand, no significant difference was observed in the susceptibility between yeast and Gram-negative bacteria (p-value 0.998). These observations suggest that, apart from the effect of the photocatalyst, the observed susceptibility is also dependent on the group of microorganisms under investigation.
Several different studies have shown that TiO2-NT surface photocatalysis is capable of neutralizing a wide range of organisms, including Gram-negative [49,50,51] and Gram-positive bacteria [52,53], including their endospore forms [54], fungi [55,56], algae [57,58], protozoa [59,60] viruses, and prions [61,62]. The complete mechanism of microbial cell death via photocatalysis is still not completely elucidated [63]; however, it was shown that it is a combination of non-specific oxidation-related damage to the cell wall and DNA [64] via hydroxyl, peroxide and superoxide radicals generated during photocatalysis. This oxidative damage leads to the activation of several genes coding for enzymes and proteins [65] that try to minimize the entry of free radicals inside the cell. Kubacka et al. [66] showed that free radical attack had a significant damaging effect on the cell wall and its components. The disturbance of the cell wall and the cells activates a number of genes and proteins that produce lipids for the cell membrane found immediately below the cell wall as a second line of defence. The results obtained in the study at hand are in line with the literature [65,66], in which it was shown that Gram-positive bacteria were more resistant than Gram-negative bacteria. This difference is usually attributed to the difference in cell wall structure. Gram-positive bacteria have a thicker peptidoglycan layer that buffers the entry of free radicals inside the cell. In the case of yeast and fungi, the cell wall characteristics are more complex than the ones of bacteria. The results showed that yeast cells tend to be more susceptible to free radical oxidation when compared to fungal cells; in fact, Cryptococcus albidus and Penicillium chrysogenum were the most resistant. The difference between the susceptibility of fungi and yeast can also be explained in terms of their cell wall structure. In the case of yeast cells, the inner cell membrane is protected by a cell wall that is composed of an inner chitin layer followed by a layer of β-1,6-glucans and β-1,3-glucans, which connect the inner and outer cell wall [67,68]. The outer most layer of the cell wall is packed with mannoproteins that cross-linked to β-1,6-glucans [69]. In the case of fungi, the cell wall composition is more complex than that found in yeast cells. Fungal genera such as Aspergillus have been shown to mannoproteins and are covalently bonded to the glucanchitin core, while, in the case of yeasts such as S. cerevisiae and C. albicans, these are linked but not covalently bonded [70,71]. Furthermore, Aspergillus genera have been shown to have additional β-1,3-1,4-glucan and α-1,3-glucan apart from of β-1,6-glucan and β-1,3-glucan found in yeast. Furthermore, studies carried out by Costachel et al. [71] and Fontaine et al. [70] showed that the outermost layer is composed of galactosaminogalactan, which is constituted of α-1-4 linked galactose and α-1-4 linked N-acetylgalactosamine residues rather than mannoproteins such as those found in yeast. The additional β-1,3-1,4-glucan, α-1,3-glucan and the presence of a stronger bonding interaction between the chitin layer and mannoproteins could in fact explain the higher percentage survival rate of fungi when compared to yeast.

5. Conclusions

Anodically produced titanium oxide nanotube surfaces have great potential in the removal of chemical and microbiological contaminates. The results show that the observed chemical and antimicrobial activity were closely related to the surface morphology. It was shown that the larger the tube length, the faster is the rate of DPPH and ABTS radical stabilization and the faster the rate of tannic acid removal relevant to the pH of solution. The antimicrobial activity against various genera showed a similar trend to that observed for the chemical activity, with TiO2-NT and TiO2-NT-Ag showing the best removal of microorganisms. Furthermore, it was found that the rate of tannic acid removal was highly dependent on the pH of the solution. An increase in the pH caused a significant increase in the rate of tannic acid degradation. This was attributed to the increase in the concentration of hydroxyl anion, one of the primary precursors for hydroxyl radicals. The susceptibility of the various microorganisms tested seems to be highly dependent on the cell wall structure, with Gram-negative bacteria being the most susceptible.

Author Contributions

Conceptualization, F.L., M.A.B and C.F.; methodology F.L. and C.F.; software, F.L. and C.F.; validation, F.L. and C.F.; formal analysis, F.L. and C.F.; investigation, F.L., M.A.B. and C.F.; resources, E.Z., A.Z., P.R., G.R., M.G.; data curation, F.L. and C.F.; writing—original draft preparation, F.L., M.A.B. and C.F.; writing—review and editing, G.R., A.R., E.Z., M.A.B., S.A., P.R., M.G.; visualization, F.L., M.A.B. and C.F.; supervision, A.R., E.Z., S.A., P.R., M.G.; project administration, M.G., P.R., E.Z., G.R., A.R.; funding acquisition, M.G., P.R., S.A., A.R., G.R. All authors have read and agreed to the published version of the manuscript.

Funding

This work is part of the project Micro Wastewater Treatment Systems using Photocatalytic Surfaces (Micro WatTS)—Project C1-1.1-70, co-financed by the European Regional Development Fund (ERDF)—INTERREG V. A. Italia-Malta.

Conflicts of Interest

The authors declare no conflict of interest.

References

  1. Gamage, J.; Zhang, Z. Applications of Photocatalytic Disinfection. Int. J. Photoenergy 2010, 2010, 764870. [Google Scholar] [CrossRef] [Green Version]
  2. Chong, M.N.; Jin, B.; Chow, C.; Saint, C. Recent developments in photocatalytic water treatment technology: A review. Water Res. 2010, 44, 2997–3027. [Google Scholar] [CrossRef] [PubMed]
  3. Fujishima, A.; Honda, K. Electrochemical Photolysis of Water at a Semiconductor Electrode. Nature 1972, 238, 37–38. [Google Scholar] [CrossRef]
  4. Fujishima, A.; Zhang, X. Titanium didioxide photocatalysis: present situation and future approaches. C. R. Chim. 2006, 9, 750–760. [Google Scholar] [CrossRef]
  5. Valencia, S.; Marín, J.M.; Restrepo, G. Study of the bandgap of synthesized titanium dioxide nanoparticules using the sol-gel method and a hydrothermal treatment. Open Mater. Sci. J. 2010, 4, 9–14. [Google Scholar] [CrossRef]
  6. Jing, L.; Li, S.; Song, S.; Xue, L.; Fu, H. Investigation on the electron transfer between anatase and rutile in nano-sized TiO2 by means of surface photovoltage technique and its effects on the photocatalytic activity. Sol. Energy Mater. Sol. Cells 2008, 92, 1030–1036. [Google Scholar] [CrossRef]
  7. Ohno, T.; Sarukawa, K.; Tokieda, K.; Matsumura, M. Morphology of a TiO2 Photocatalyst (Degussa, P-25) Consisting of Anatase and Rutile Crystalline Phases. J. Catal. 2001, 203, 82–86. [Google Scholar] [CrossRef]
  8. Bersani, D.; Antonioli, G.; Lottici, P.P.; López, T. Raman study of nanosized titania prepared by sol–gel route. J. Non-Cryst. Solids 1998, 232, 175–181. [Google Scholar] [CrossRef]
  9. Etacheri, V.; Di Valentin, C.; Schneider, J.; Bahnemann, D.W.; Pillai, S.C. Visible-light activation of TiO2 photocatalysts: Advances in theory and experiments. J. Photochem. Photobiol. C. 2015, 25, 1–29. [Google Scholar] [CrossRef] [Green Version]
  10. Riboni, F.; Bettini, L.G.; Bahnemann, D.W.; Selli, E. WO3–TiO2 vs. TiO2 photocatalysts: Effect of the W precursor and amount on the photocatalytic activity of mixed dioxides. Catal. Today 2013, 209, 28–34. [Google Scholar] [CrossRef]
  11. Szczepanik, B. Photocatalytic degradation of organic contaminants over clay-TiO2 nano-composites: A review. Appl. Clay Sci. 2017, 141, 227–239. [Google Scholar] [CrossRef]
  12. Dong, H.; Zeng, G.; Tang, L.; Fan, C.; Zhang, C.; He, X.; He, Y. An overview on limitations of TiO2-based particles for photocatalytic degradation of organic pollutants and the corresponding countermeasures. Water Res. 2015, 79, 128–146. [Google Scholar] [PubMed]
  13. Bhattacharyya, A.; Kawi, S.; Ray, M.B. Photocatalytic degradation of orange II by TiO2 catalysts supported on adsorbents. Catal Today 2004, 98, 431–439. [Google Scholar] [CrossRef]
  14. Torimoto, T.; Okawa, Y.; Takeda, N.; Yoneyama, H. Effect of activated carbon content in TiO2-loaded activated carbon on photodegradation behaviors of dichloromethane. J. Photochem. Photobiol. A 1997, 103, 153–157. [Google Scholar] [CrossRef]
  15. Yoo, H. TiO2-Based Electrodes for Electrochemical Energy Conversion and Storage. Ph.D. Thesis, Inha University, Incheon, South Korea, 2018. [Google Scholar]
  16. Mohamed, A.M.; Aljaber, A.S.; Allam, N.K.; Al-Qaradawi, S.Y. TiO2 nanotubes with ultrathin walls for enhanced water splitting. Chem. Commun. 2015, 51, 12617–12620. [Google Scholar] [CrossRef]
  17. Bastús, N.G.; Merkoçi, F.; Piella, J.; Puntes, V. Synthesis of Highly Monodisperse Citrate-Stabilized Silver Nanoparticles of up to 200 nm: Kinetic Control and Catalytic Properties. Chem. Mater. 2014, 26, 2836–2846. [Google Scholar] [CrossRef]
  18. Apak, R.; Özyürek, M.; Güçlü, K.; Çapanoğlu, E. Antioxidant Activity/Capacity Measurement. 1. Classification, Physicochemical Principles, Mechanisms, and Electron Transfer (ET)-Based Assays. J. Agric. Food Chem. 2016, 64, 997–1027. [Google Scholar] [CrossRef]
  19. Yu, J.C.; Zhang, L.; Zheng, Z.; Zhao, J. Synthesis and characterization of phosphated mesoporous titanium didioxide with high photocatalytic activity. Chem. Mater. 2003, 15, 2280–2286. [Google Scholar] [CrossRef]
  20. Moma, J. Modified Titanium Didioxide for Photocatalytic-Photocatalysts-Applications and Attributes. IntechOpen 2018, 37–56. [Google Scholar]
  21. Sun, C.; Xiong, B.; Pan, Y.; Cui, H. Adsorption removal of tannic acid from aqueous solution by polyaniline: Analysis of operating parameters and mechanism. J. Colloid Interface Sci. 2017, 487, 175–181. [Google Scholar] [CrossRef]
  22. Wang, J.H.; Zheng, S.R.; Liu, J.L.; Xu, Z.Y. Tannic acid adsorption on amino functionalized magnetic mesoporous silica. Chem. Eng. J. 2010, 165, 10–16. [Google Scholar] [CrossRef]
  23. Buso, A.; Balbo, L.; Giomo, M.; Farnia, G.; Sandona, G. Electrochemical Removal of Tannins from Aqueous Solutions. Ind. Eng. Chem. Res. 2000, 39, 494–499. [Google Scholar] [CrossRef]
  24. Cañizares, P.; Perez, A.; Camarillo, R.; Llanos, J. Tannic acid removal from aqueous effluents using micellar enhanced ultrafiltration at pilot scale. Desalination 2006, 200, 310–312. [Google Scholar] [CrossRef]
  25. Rodríguez, H.; de las Rivas, B.; Gómez-Cordovés, C.; Muñoz, R. Degradation of tannic acid by cell-free extracts of Lactobacillus plantarum. Food Chem. 2008, 107, 664–670. [Google Scholar] [CrossRef] [Green Version]
  26. Cantarella, M.; Sanz, R.; Buccheri, M.A.; Romano, L.; Privitera, V. PMMA/TiO2 nanotubes composites for photocatalytic removal of organic compounds and bacteria from water. Mater. Sci. Semicond. Process. 2016, 42, 58–61. [Google Scholar] [CrossRef]
  27. Dbira, S.; Bensalah, N.; Zagho, M.M.; Ennahaoui, M.; Bedoui, A. Oxidative degradation of tannic acid in aqueous solution by UV/S2O82- and UV/H2O2/Fe2+ processes: A comparative study. Appl. Sci. 2019, 9, 156. [Google Scholar] [CrossRef] [Green Version]
  28. Jiang, Y.; Zheng, B.; Du, J.; Liu, G.; Guo, Y.; Xiao, D. Electrophoresis deposition of Ag nanoparticles on TiO₂ nanotube arrays electrode for hydrogen peroxide sensing. Talanta 2013, 112, 129–135. [Google Scholar] [CrossRef]
  29. Wang, D.; Liu, Y.; Yu, B.; Zhou, F.; Liu, W. TiO2 Nanotubes with Tunable Morphology, Diameter, and Length: Synthesis and Photo-Electrical/Catalytic Performance. Chem. Mater. 2009, 21, 1198–1206. [Google Scholar] [CrossRef]
  30. Fu, Y.-S.; Li, J.; Li, J. Metal/Semiconductor Nanocomposites for Photocatalysis: Fundamentals, Structures, Applications and Properties. Nanomaterials 2019, 9, 359. [Google Scholar] [CrossRef] [Green Version]
  31. Kadnikova, E.N.; Kostić, N.M. Oxidation of ABTS by hydrogen perdioxide catalyzed by horseradish peroxidase encapsulated into sol-gel glass. Effects of glass matrix on reactivity. J. Mol. Catal. B Enzym. 2002, 18, 39–48. [Google Scholar] [CrossRef]
  32. Yoneyama, H. Electrochemical aspects of light-induced heterogeneous reactions on semiconductors. Crit. Rev. Solid State Mater. Sci. 1993, 18, 69–111. [Google Scholar] [CrossRef]
  33. Zhuang, Q.-K.; Scholz, F.; Pragst, F. The voltammetric behaviour of solid 2,2-diphenyl-1-picrylhydrazyl (DPPH) microparticles. Electrochem. Commun. 1999, 1, 406–410. [Google Scholar] [CrossRef]
  34. Adán, C.; Marugán, J.; Sánchez, E.; Pablos, C.; Van Grieken, R. Understanding the effect of morphology on the photocatalytic activity of TiO2 nanotube array electrodes. Electrochim. Acta 2016, 191, 521–529. [Google Scholar] [CrossRef] [Green Version]
  35. Zhuang, H.F.; Lin, C.J.; Lai, Y.K.; Sun, L.; Li, J. Some Critical Structure Factors of Titanium Oxide Nanotube Array in Its Photocatalytic Activity. Environ. Sci. Technol. 2007, 41, 4735–4740. [Google Scholar] [CrossRef] [PubMed]
  36. Azeez, F.; Al-Hetlani, E.; Arafa, M.; Abdelmonem, Y.; Abdel-Nazeer, A.; Amin, M.O.; Madkour, M. The effect of surface charge on photocatalytic degradation of methylene blue dye using chargeable titania nanoparticles. Sci. Rep. 2018, 8, 7104. [Google Scholar] [CrossRef]
  37. Khan, M.; Chowdhurya, M.; Chuan, T.; Cheng, C.K.; Yousuf, A. Schottky barrier and surface plasmonic resonance phenomena towards the photocatalytic reaction: study of their mechanisms to enhance photocatalytic activity. Catal. Sci. Technol. 2015, 5, 2522–2531. [Google Scholar] [CrossRef] [Green Version]
  38. Rockafellow, E.M.; Stewart, L.K.; Jenks, W.S. Is sulfur-doped TiO2 an effective visible light photocatalyst for remediation? Appl. Catal. B 2009, 91, 554–562. [Google Scholar] [CrossRef]
  39. Baram, N.; Starosvetsky, D.; Starosvetsky, J.; Epshtein, M.; Armon, R.; Ein-Eli, Y. Photocatalytic inactivation of microorganisms using nanotublar TiO2. Appl. Catal. B Environ. 2011, 101, 212. [Google Scholar] [CrossRef]
  40. Beranek, R.; Tsuchiya, H.; Sugishima, T.; Macak, J.; Taveira, L.; Fujimoto, S.; Kisch, H.; Schumki, P. Enhancement and limits of the photoelectrocheical response from anodic TiO2 nanotubes. Appl. Phys. Lett. 2005, 87, 243114. [Google Scholar] [CrossRef]
  41. Smith, Y.; Ray, R.; Carlson, K.; Sarma, B.; Misra, M. Self-ordered titanium didioxide nanotube arrays: Anodic synthesis and their photo/electro-catalytic applications. Materials 2013, 6, 2892. [Google Scholar] [CrossRef]
  42. Anitha, V.C.; Lee, J.H.; Lee, J.; Banerjee, A.N.; Joo, S.W.; Min, B.K. Biofilm formation on a TiO₂ nanotube with controlled pore diameter and surface wettability. Nanotechnology 2015, 26, 065102. [Google Scholar] [CrossRef] [PubMed]
  43. Hajjaji, A.; Elabidi, M.; Trabelsi, K.; Assadi, A.A.; Bessaïs, B.; Rtimi, S. Bacterial adhesion and inactivation on Ag decorated TiO2-nanotubes under visible light: Effect of the nanotubes geometry on the photocatalytic activity. Colloid Surface B 2018, 170, 92–98. [Google Scholar] [CrossRef] [PubMed]
  44. Van Viet, P.; Phan, B.T.; Mott, D.; Maenosono, S.; Sang, T.T.; Thi, C.M.; Van Hieu, L. Silver nanoparticle loaded TiO2 nanotubes with high photocatalytic and antibacterial activity synthesized by photoreduction method. J. Photochem. Photobiol. A 2018, 352, 106–112. [Google Scholar] [CrossRef]
  45. Akpan, U.G.; Hameed, B.H. Parameters affecting the photocatalytic degradation of dyes using TiO2-based photocatalysts: A review. J. Hazard. Mater. 2009, 170, 520–529. [Google Scholar] [CrossRef] [PubMed]
  46. Gonçalves, M.S.T.; Oliveira-Campos, A.M.; Pinto, E.M.; Plasência, P.M.; Queiroz, M.J.R.P. Photochemical treatment of solutions of azo dyes containing TiO2. Chemosphere 1999, 39, 781–786. [Google Scholar] [CrossRef]
  47. Viet, P.; Tran, H.N. Adsorption and photocatalytic degradation of methylene blue by titanium didioxide nanotubes at different pH conditions. Adv. Nat. Sci. Nanosci. 2019, 10, 045011. [Google Scholar]
  48. Bahnemann, D.W.; Cunningham, J.; Fox, M.A.; Pelizzetti, E.; Pichat, P.; Serpone, N. Aquatic Surface Photochemistry; Lewis Publishers: Boca Raton, FL, USA, 1994. [Google Scholar]
  49. Dunlop, P.S.M.; Byrne, J.A.; Manga, N.; Eggins, B.R. The photo-catalytic removal of bacterial pollutants from drinking water. J. Photochem. Photobiol. A 2002, 148, 355–363. [Google Scholar] [CrossRef]
  50. Dunlop, P.S.M.; Sheeran, C.P.; Byrne, J.A.; McMahon, M.A.S.; Boyle, M.A.; McGuigan, K.G. Inactivation of clinically relevant patho-gens by photocatalytic coatings. J. Photochem. Photobiol. A 2010, 216, 303–310. [Google Scholar] [CrossRef]
  51. Cheng, C.-L.; Sun, D.-S.; Chu, W.-C.; Tseng, Y.-H.; Ho, H.-C.; Wang, J.-B.; Chung, P.-H.; Chen, J.-H.; Tsai, P.-J.; Lin, N.-T.; et al. The effects of the bacterial interaction with visible-light responsive titania photocatalyst on the bactericidal performance. J. Biomed. Sci. 2009, 16, 7. [Google Scholar] [CrossRef] [PubMed] [Green Version]
  52. Singh, A.; Singh, R.; Purohit, S.; Malodia, P.; Kumar, R. Photocatalytic disinfection of water using immobilized titanium didioxide. Pollut. Res. 2005, 24, 29–33. [Google Scholar]
  53. Kozlova, E.A.; Safatov, A.S.; Kiselev, S.A.; Marchenko, V.Y.; Sergeev, A.N.; Skarnovich, M.O.; Emelyanova, E.K.; Smetannikova, M.A.; Buryak, G.A.; Vorontsov, A.V. Inactivation and Mineralization of Aerosol Deposited Model Pathogenic Microorganisms over TiO2 and Pt/TiO2. Environ. Sci. Technol. 2010, 44, 5121–5126. [Google Scholar] [CrossRef] [PubMed]
  54. Greist, H.T.; Hingorani, S.K.; Kelly, K.; Goswami, D.Y. Using scanning electron microscopy to visualize photocatalytic miner-alization of airborne microorganisms. In Proceedings of the 9th International Conference on Indoor Air Quality and Climate, Monterey, CA, USA, 30 June–5 July 2002; pp. 712–717. [Google Scholar]
  55. Veselá, M.; Veselý, M.; Chomoucká, J.; Lipenská, M. Photocatalytic disinfection of water using Ag/TiO2. Chem. List. 2008, 102, 507–508. [Google Scholar]
  56. Chen, F.N.; Yang, X.D.; Wu, Q. Antifungal capability of TiO2 coated film on moist wood. Build. Environ. 2009, 44, 1088–1093. [Google Scholar] [CrossRef]
  57. Hong, J.; Ma, H.; Otaki, M. Controlling algal growth in photo-dependent decolorant sludge by photocatalysis. J. Biosci. Bioeng. 2005, 99, 592–597. [Google Scholar] [CrossRef]
  58. Kim, S.-C.; Lee, D.-K. Inactivation of algal blooms in eutrophic waterof drinking water supplies with the photocatalysisof TiO2 thin film on hollow glass beads. Water Sci. Technol. 2005, 52, 145–152. [Google Scholar] [CrossRef] [PubMed]
  59. Sökmen, M.; Degerli, S.; Aslan, A. Photocatalytic disinfection of Giardia intestinalis and Acanthamoeba castellani cysts in water. Exp. Parasitol. 2008, 119, 44–48. [Google Scholar] [CrossRef]
  60. Ryu, H.; Gerrity, D.; Crittenden, J.C.; Abbaszadegan, M. Photo-catalytic inactivation of Cryptosporidium parvum with TiO2 and low-pressure ultraviolet irradiation. Water Res. 2008, 42, 1523–1530. [Google Scholar] [CrossRef]
  61. Gerrity, D.; Ryu, H.; Crittenden, J.; Abbaszadegan, M. Photocatalytic inactivation of viruses using titanium didioxide nano-particles and low-pressure UV light. J. Environ. Sci. Health A 2008, 43, 1261–1270. [Google Scholar] [CrossRef]
  62. Paspaltsis, I.; Kotta, K.; Lagoudaki, R.; Grigoriadis, N.; Poulios, I.; Sklaviadis, T. Titanium didioxide photocatalytic inactivation of prions. J. Gen. Virol. 2006, 87, 3125–3130. [Google Scholar] [CrossRef]
  63. Kubacka, A.; Suarez-Diez, M.; Rojo, D.; Bargiela, R.; Ciordia, S.; Zapico, I.; Albar, J.P.; Barbas, C.; Dos Santos, V.A.P.M.; Fernández-García, M.; et al. Understanding the antimicrobial mechanism of TiO2-based nanocomposite films in a pathogenic bacterium. Sci. Rep. 2014, 4, 1–9. [Google Scholar] [CrossRef] [Green Version]
  64. Yemmireddy, V.K.; Hung, Y.C. Using Photocatalyst Metal Dioxides as Antimicrobial Surface Coatings to Ensure Food Safety—Opportunities and Challenges. Compr. Rev. Food Sci. Food Saf. 2017, 16, 617–631. [Google Scholar] [CrossRef] [Green Version]
  65. Skorb, E.V.; Antonouskaya, L.I.; Belyasova, N.A.; Shchukin, D.G.; Möhwald, H.; Sviridov, D.V. Antibacterial activity of thin-film photo-catalysts based on metal-modified TiO2 and TiO2: In2O3 nano-composite. Appl. Catal. B 2008, 84, 94–99. [Google Scholar] [CrossRef]
  66. Sheel, D.W.; Brook, L.A.; Ditta, I.B.; Evans, P.; Foster, H.A.; Steele, A.; Yates, H.M. Biocidal Silver and Silver/Titania Composite Films Grown by Chemical Vapour Deposition. Int. J. Photoenergy 2008, 2008, 168185. [Google Scholar] [CrossRef]
  67. Brown, G.D.; Gordon, S. Immune recognition of fungal β-glucans. Cell. Microbiol. 2005, 7, 471–479. [Google Scholar] [CrossRef]
  68. Garcia-Rubio, R.; De Oliveira, H.C.; Rivera, J.; Trevijano-Contador, N. The Fungal Cell Wall: Candida, Cryptococcus, and Aspergillus Species. Front. Microbiol. 2020, 10, 1–13. [Google Scholar] [CrossRef]
  69. Shibata, N.; Suzuki, A.; Kobayashi, H.; Okawa, Y. Chemical structure of the cell-wall mannan of Candida albicans serotype A and its difference in yeast and hyphal forms. Biochem. J. 2007, 404, 365–372. [Google Scholar] [CrossRef] [PubMed] [Green Version]
  70. Fontaine, T.; Simenel, C.; Dubreucq, G.; Adam, O.; Delepierre, M.; Lemoine, J. Molecular organization of the alkali-insoluble fraction of Aspergillus fumigatus cell wall. J. Boil. Chem. 2000, 275, 27594–27607. [Google Scholar] [CrossRef] [Green Version]
  71. Costachel, C.; Coddeville, B.; Latgé, J.-P.; Fontaine, T. Glycosylphosphatidylinositol-anchored Fungal Polysaccharide in Aspergillus fumigatus. J. Boil. Chem. 2005, 280, 39835–39842. [Google Scholar] [CrossRef] [Green Version]
Figure 1. Diagrammatic representation of the experimental set up used for the determination of the redox activity of the titanium dioxide nanotubes (TiO2-NT) surfaces.
Applsci 10 05243 g001
Figure 2. Diagrammatic representation of the experimental set up used for the determination of antimicrobial activity of the TiO2-NT surfaces.
Applsci 10 05243 g002
Figure 3. Surface view of the nanotubular morphology of the different photocatalysts: (A) TiO2NT-P, (B) TiO2NT-S, (C) TiO2NT and (D) TiO2NT-Ag.
Applsci 10 05243 g003
Figure 4. Rate of reaction for the stabilisation of 2,2-Diphenyl-1-picrylhydrazyl (DPPH) radicals using TiO2 nanotube surfaces with different morphologies.
Applsci 10 05243 g004
Figure 5. Rate of reaction for the reduction of Cu2+ to Cu+ in the presence of neocuproine and different TiO2 surfaces after exposure to UV at 10 mWcm−2.
Applsci 10 05243 g005
Figure 6. Rate of reaction for the stabilisation of ABTS radical cations using TiO2 nanotube arrays with different morphologies exposed to 10 mWcm−2 UV.
Applsci 10 05243 g006
Figure 7. Rate constants for the degradation of tannic acid under different pH using TiO2 nanotube layers irradiated with 10 mWcm−2 UV.
Applsci 10 05243 g007
Figure 8. Percentage survival rate of various microorganisms belonging to Gram-negative and Gram-positive bacteria, fungi and yeast after being exposed for 1 h to different surface morphologies and UV radiation at 10 mWcm−2.
Applsci 10 05243 g008
Figure 9. Percentage survivability of various microorganisms classified according to their group.
Applsci 10 05243 g009
Table 1. Morphological parameters of the different materials.
MaterialTube Length (µm)Tube Diameter (nm)Wall Thickness (nm)
TiO2NT-P0.65 ± 0.1170–10012.00 ± 1.54
TiO2NT-S1.51 ± 0.0970–10013.00 ± 1.17
TiO2NT9.76 ± 0.1890–12210.15 ± 1.41
TiO2NT-Ag9.65 ± 0.2790–12510.21 ± 1.36
Table 2. Approximate surface elemental composition of the four different nanomaterials.
TiO2NT-PTiO2NT-STiO2NTTiO2NT-Ag
ElementWt %At %Wt %At %Wt %At %Wt %At %
C00.8601.9303.8507.0003.7908.1500.9102.04
O35.7360.4728.7749.5139.1260.9038.0063.74
F00.9701.3803.5305.1100.4400.7601.4702.07
Na00.8501.00------
P01.3101.14------
S--04.2903.69----
Ag------04.0301.00
Ti60.2934.0860.3634.6956.6530.1955.5931.15
Table 3. Rate constant k for the various electron-transfer-based methods tested using first-order kinetics for DPPH and 2,2’-azino-bis (3-ethylbenzothiazoline-6-sulfonic acid) (ABTS), while second-order kinetics were used for cupric ion reducing antioxidant capacity (CUPRAC).
DPPH (s−1)ABTS (s−1)CUPRAC (M−1s−1)
Blank−1.12 × 10⁻³ ± 5.80 × 10−53.82 × 10−3 ± 6.12 × 10⁻⁵ s−11.68 × 10⁻³ ± 4.76 × 10⁻⁴
TiO2NT−2.63 × 10⁻² ±2.13 × 10⁻³ s−1−1.03 × 10⁻² ± 4.30 × 10⁻⁴ s−11.15 × 10⁻² ± 9.64 × 10⁻⁴
TiO2NT-Ag−2.19 × 10⁻² ± 9.87 × 10⁻⁴ s−1−1.07 × 10⁻² ± 1.17 × 10⁻³ s−11.21 × 10⁻² ± 4.62 × 10⁻⁴
TiO2NT-S9.73 × 10−3 ± 9.87 × 10⁻⁴ s−1−7.24 × 10⁻³ ± 3.34 × 10⁻⁴ s−17.09 × 10⁻³ ± 5.01 × 10⁻⁴
TiO2NT-P−1.29 × 10⁻² ±5.22 × 10⁻³ s−1−8.58 × 10⁻³ ± 4.12 × 10⁻⁴ s−16.29 × 10⁻³ ± 6.25 × 10⁻⁵
Table 4. Summary of the charges and interactions under different pH conditions between the TiO2NT surface and tannic acid.
pH
pH 2pH 3pH 6pH 7pH 9
TiO2NT Surface+ve+veNeutral-ve-ve
Tannic acid+ve+veNeutral-ve-ve
InteractionRepulsionRepulsionEqualRepulsionRepulsion

