Article

Opportunities for Two-Color Experiments in the Soft X-ray Regime at the European XFEL

by
Svitozar Serkez
1,
Winfried Decking
2,
Lars Froehlich
2,
Natalia Gerasimova
1,
Jan Grünert
1,
Marc Guetg
2,
Marko Huttula
3,
Suren Karabekyan
1,
Andreas Koch
1,
Vitali Kocharyan
2,
Yauhen Kot
2,
Edwin Kukk
4,
Joakim Laksman
1,
Pavel Lytaev
1,
Theophilos Maltezopoulos
1,
Tommaso Mazza
1,
Michael Meyer
1,
Evgeni Saldin
2,
Evgeny Schneidmiller
2,
Matthias Scholz
2,
Sergey Tomin
1,2,
Maurizio Vannoni
1,
Torsten Wohlenberg
2,
Mikhail Yurkov
2,
Igor Zagorodnov
2 and
Gianluca Geloni
1,*
add Show full author list remove Hide full author list
1
European XFEL, Holzkoppel 4, 22869 Schenefeld, Germany
2
Deutsches Elektronen-Synchrotron, Notkestrasse 85, 22607 Hamburg, Germany
3
Nano and Molecular Systems Research Unit, University of Oulu, P.O.Box 3000, FI-90014 Oulu, Finland
4
Department of Physics and Astronomy, University of Turku, FI-20014 Turun Yliopisto, Finland
*
Author to whom correspondence should be addressed.
Appl. Sci. 2020, 10(8), 2728; https://doi.org/10.3390/app10082728
Submission received: 11 March 2020 / Revised: 3 April 2020 / Accepted: 9 April 2020 / Published: 15 April 2020
(This article belongs to the Special Issue Science at X-ray Free Electron Lasers)

Abstract

:
X-ray pump/X-ray probe applications are made possible at X-ray Free Electron Laser (XFEL) facilities by generating two X-ray pulses with different wavelengths and controllable temporal delay. In order to enable this capability at the European XFEL, an upgrade project to equip the soft X-ray SASE3 beamline with a magnetic chicane is underway. In the present paper we describe the status of the project, its scientific focus and expected performance, including start-to-end simulations of the photon beam transport up to the sample, as well as recent experimental results demonstrating two-color lasing at photon energies of 805 eV + 835 eV and 910 eV + 950 eV. Additionally, we discuss methods to analyze the spectral properties and the intensity of the generated radiation to provide on-line diagnostics for future user experiments.

1. Introduction

Two-color pump–probe spectroscopy is a very powerful tool to study the temporal evolution of an excited system or, more generally, to investigate the dynamics of a photoinduced process [1,2]. Typically, a first photon is used to initiate the process and a second interrogates the system under study in a time-resolved way. The technique is widely used combining an intense optical laser as a pump and a short wavelength source, such as a synchrotron [3] or a high harmonic generation source [4] as a probe. The advent of Free Electron Lasers (FELs) operating in the soft and hard X-ray regimes has enabled scientists to explore processes on the femtosecond time scale by taking advantage of the short pulse duration and the high intensity of FEL pulses [5,6]. Recent examples of this type of studies at FELs are related to the dissociation dynamics of molecules, magnetic ordering of material, as well as charge transfer processes [7]. One major challenge in these experiments is related to the inherent temporal jitter of the two independent laser sources and to its precise characterization in order to actually take advantage of the short pulse duration. Until now, only experiments using a seeded FEL in combination with the optical seed laser could demonstrate high temporal resolution reaching the sub-femtosecond time scale [8].
New developments at FEL sources have shown that it is also possible to generate two FEL pulses at different photon energies, which enable pump–probe experiments [9,10,11]. This method has two major advantages; first, the temporal jitter is drastically reduced, since both pulses are produced by the same electron bunch and, second, pump and probe pulses are both of high photon energies. This allows, for example, to selectively address different sites in a molecule or different subshells in an atom for inducing a process (pump) as well as for monitoring its evolution (probe). Very soon after the start of operation of the European XFEL discussions were initiated about the possibilities to realize such a two-color pump–probe scheme at the SASE3 Soft X-ray branch of the facility.
Already the simplest way of generating two-color pulses at the SASE3 beamline of the European XFEL, in combination with the high-repetition rate capabilities of the facility is expected to enable novel exciting science at the two soft X-ray instruments Small Quantum Systems (SQS) [12,13] and Spectroscopy & Coherent Scattering (SCS) [12,14].
In the following we will summarize the scope of the project (Section 2) and the scientific background for the two-color pump–probe (2CPP) set-up at the European XFEL with the help of concrete proof-of-principle experimental proposals (Section 3) followed by the results of simulations for pulse generation and transport (Section 4), while in Section 5 we show the results of recent experiments demonstrating the first two-color lasing capabilities. Finally, Section 6 comprises a short conclusion and outlook.

2. Project Scope

The simplest way currently available to enable the generation of two temporally separated pulses of different wavelengths at X-ray Free-Electron lasers (XFELs) consists of inserting a magnetic chicane between two undulator sections as suggested in [15] and experimentally proven in [11,16]. The scheme is illustrated in Figure 1. The two sections act as independent undulators, which will be referred to as U1 and U2. We briefly remind that the fundamental wavelength in an undulator is calculated as
λ = λ u ( 1 + K 2 ) 2 γ 2 ,
where λ is the radiation wavelength, λ u is the undulator period, K is the root mean square (rms) undulator parameter, and γ is the relativistic Lorenz factor of electrons. The undulator parameters in U1 and U2 are independently tunable, and will be indicated with K 1 and K 2 , respectively, leading to two independent resonant wavelengths λ 1 and λ 2 in U1 and U2.
The electron beam enters the first undulator U1, tuned to the resonant wavelength λ 1 . After passing through U1, both the electron beam and the emitted Self-Amplified Spontaneous Emission (SASE) radiation enter the magnetic chicane. The chicane introduces a delay Δ t to the electron beam, while the radiation propagates unperturbed. When the delayed electron beam enters the second undulator U2, the SASE process starts from shot-noise again. Therefore, if U2 is tuned to the resonant wavelength λ 2 , then at the undulator exit, one obtains a first radiation pulse at wavelength λ 1 , followed by a second one with wavelength λ 2 delayed by an interval Δ t that can be varied by changing the strength of the chicane magnets.
The energy of the electron beam remains practically unchanged while passing through U1 and U2. Therefore, the accessible photon energies for different electron beam energies are defined by the tunability range of the undulator parameter K as presented on Table 1.
The FEL amplification process causes deterioration of the quality of the electron beam, as the slice energy spread grows together with radiation power. To ensure lasing at two wavelengths, the electron beam quality at the entrance of the second undulator U2 has to be still good enough to sustain the FEL process. The longer the target SASE wavelength λ 2 is, the more relaxed the electron beam quality requirements are, therefore, the more radiation power can be extracted in U1. As a result, in order to maximize the combined extracted radiation power at large wavelength separations, it is preferable to operate under the condition λ 1 < λ 2 . In addition, due to deterioration of the electron beam quality, the lasing window—and hence the emitted pulse duration—in U2 is expected to be longer than in U1.
In an undulator, the electron beam is delayed by one resonance wavelength per one undulator period. Therefore, the radiation emitted in U1 will slip ahead of the electron beam in U2. The actual delay depends on the wavelength of the second color, and can be estimated to be about several femtoseconds. Ramping up the magnetic field in the chicane can only increase this delay and, depending on the electron beam energy, delays of up to 3 ps can be achieved (see Table 1). Therefore, even when the chicane is switched off, one cannot expect to achieve full temporal overlap of the two colors, and in particular zero-crossing is not possible. However, as discussed above, the duration of the second pulse is generally longer, so the arrival times of the two pulses can be comparable.
We consider two methods to deliver soft X-ray pulses from U1 and U2 with tunability through zero delay.
The first method is to introduce a compact optical delay line into the magnetic chicane. This will lead to a full control of the relative temporal separation between the two pulses as shown in Figure 2a. Installation of an optical delay line requires a larger separation between the central dipoles of the magnetic chicane which, in turn, limits the maximum electron delay (see below).
The second method can be found in electron beam manipulations enabling fresh slice lasing [17], for instance by means of a wakefield structure. In this case, the electron trajectories in an undulator vary for different longitudinal positions along the beam. It is possible to arrange that the electron beam in U1 emits radiation from a short lasing window at its tail, while in U2 the lasing window is located at the head of the beam, see Figure 2b. If the distance between the two lasing windows is larger than the expected radiation slippage in U2, both positive and negative pump–probe delays are achievable using a magnetic chicane.
The upgrade of the SASE3 undulator line to deliver two-color soft X-ray pulses will be performed in two phases. In Phase 1, the device displayed on Figure 1 will be made available to SQS and SCS users in 2021. In Phase 2, based on the performances measured in Phase 1, on the results of numerical simulations and on scientific interest, one of the solutions enabling zero-crossing and negative delays, as presented on Figure 2, will be implemented. We note that a scheme similar to that in Figure 1 is already available at the SASE2 hard X-ray line of the European XFEL, owing to the presence of the Hard X-ray Self-Seeding (HXRSS) chicanes [18].

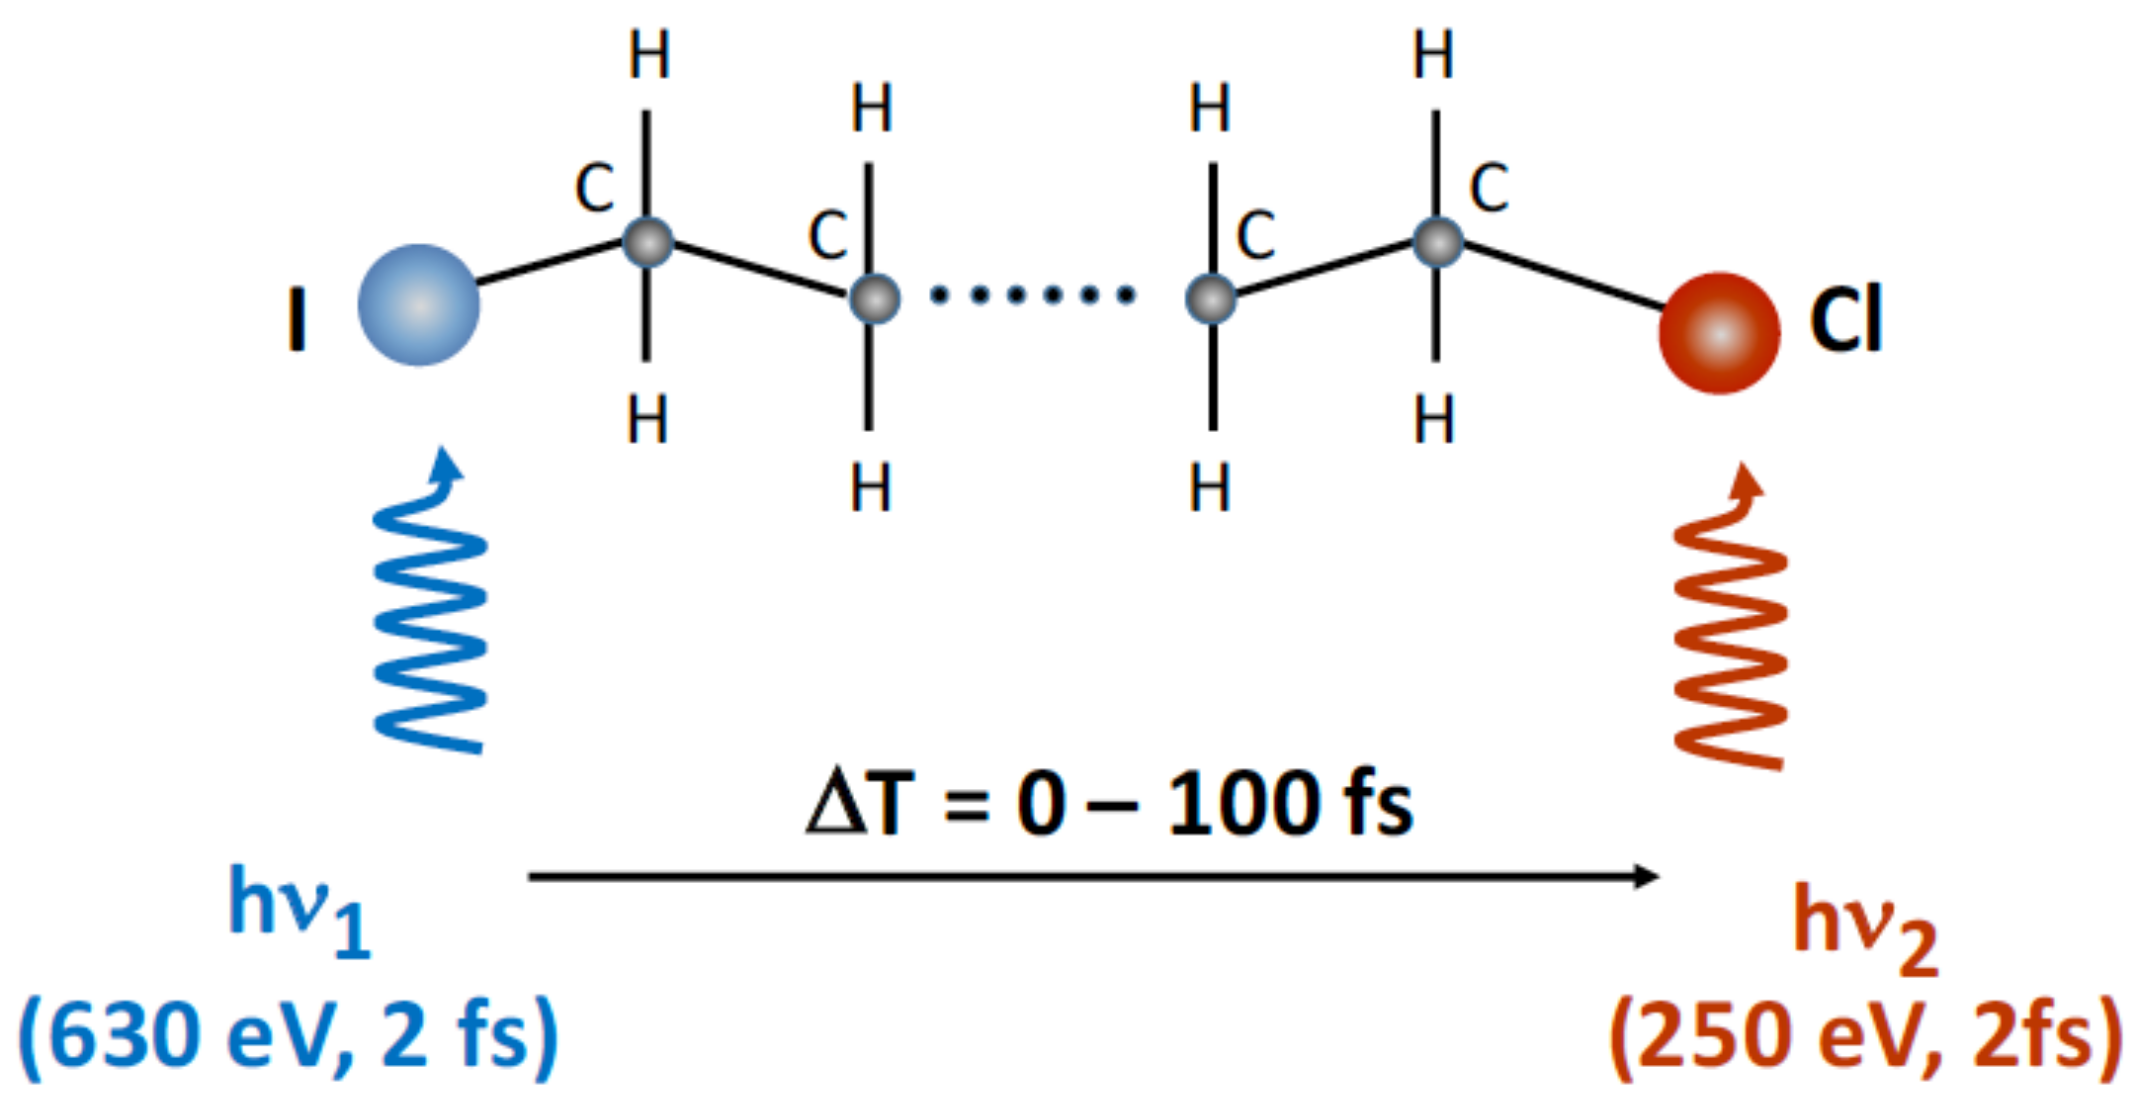
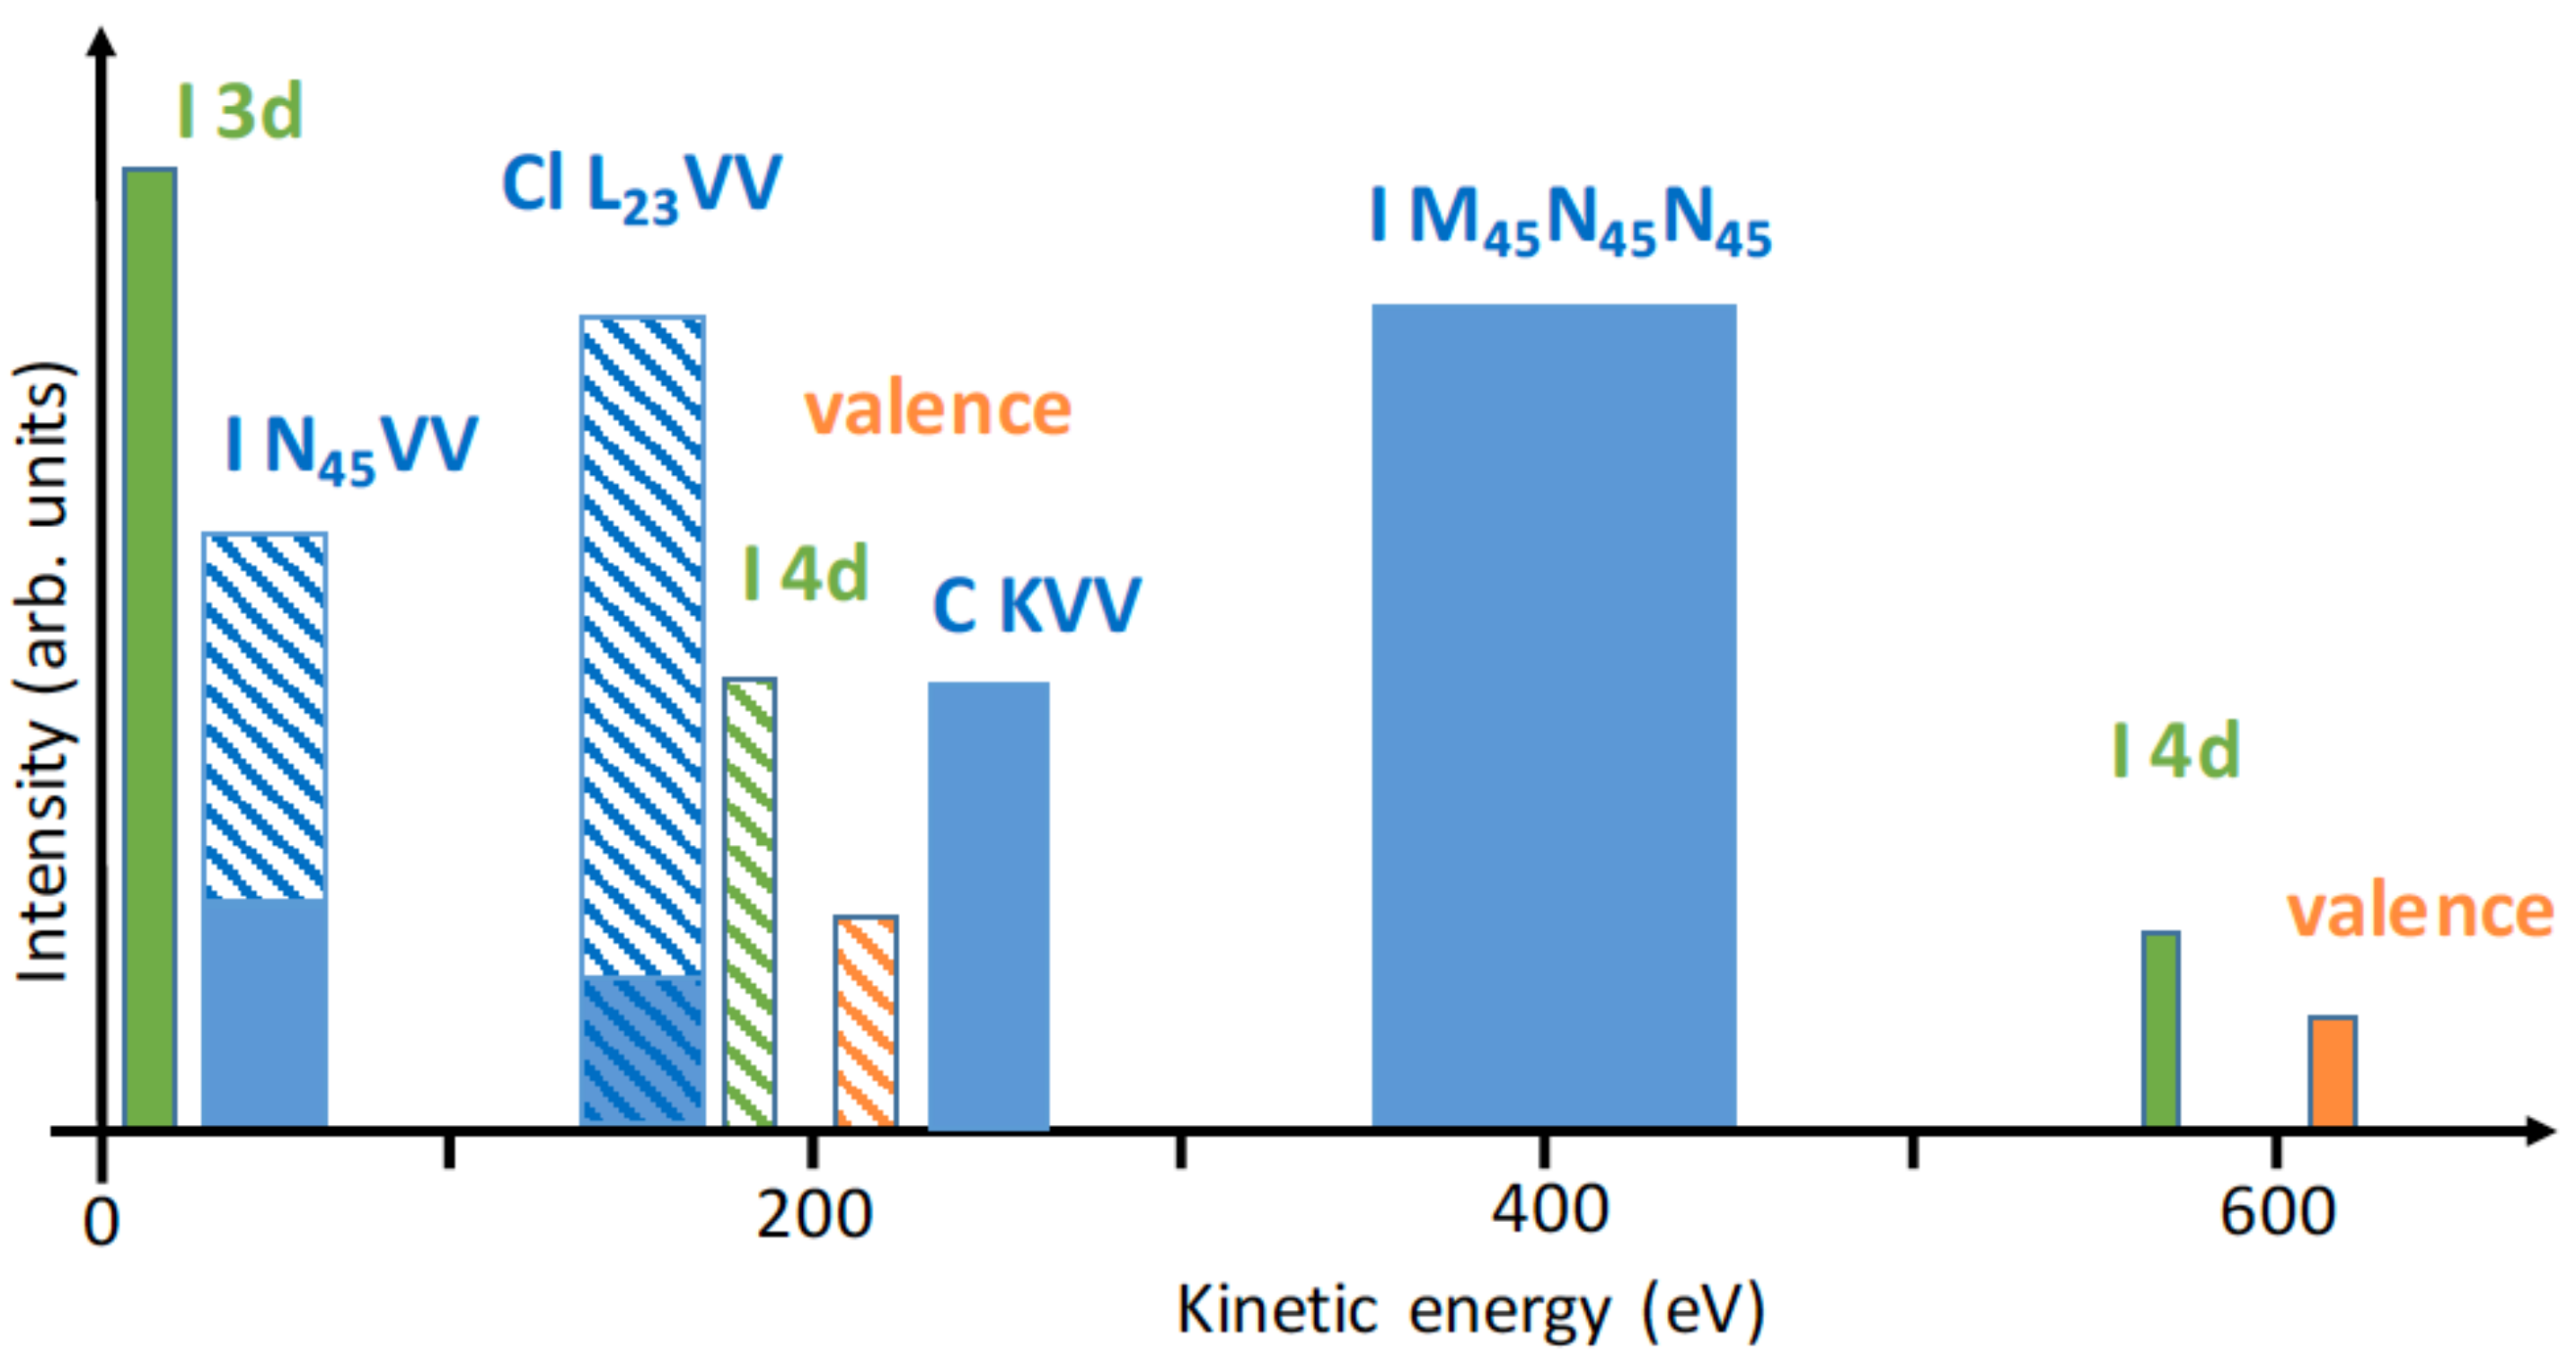
3. Scientific Relevance

The two-color operation mode described above offers numerous advantages in various scientific applications utilizing the pump–probe scheme. The examples presented in the following illustrate how nuclear, electron or combined dynamics in small quantum systems can be investigated using time-resolved two-color spectroscopy; they are not intended to represent a comprehensive scientific case.
In the first example, the two-color capability enables site selectivity. Pump and probe pulses are independently tuned to particular well-defined photon energies, so that the X-ray pulses interact with the system at different atomic sites. This can be achieved most clearly by resonant absorption, which in the case of the present setup would be the photoexcitation from an atomic core level to unoccupied orbitals. Excitation energies of the strongly bound 1 s core electrons of various relevant elements are found in the wavelength range covered by the SASE3 undulator of the European XFEL, for example C 1 s around 290 eV, N 1 s around 400 eV, O 1 s around 540 eV, F 1 s around 690 eV and S 1 s around 2.4 keV, to name only a few. Tuning the photon energy of the pump to a resonant transition allows one not only to excite specific elements in the system, but also populate desired unoccupied states, such as the π * orbitals in many organic compounds. Site-selectivity can also be obtained by non-resonant photoionization, by tuning the pump pulse energy just above the binding energy of a specific core electron whereby that partial ionization cross-section becomes the dominant one in the system. Tuning now the photon energy of the probe pulse to another core excitation or above another core ionization threshold, the effects induced by the pump pulse are observed at a different location in the system. Varying the delay between the pulses allows one to follow in time the propagation of the effects, such as changes in the charge density or in the molecular geometry.
One category of compounds where site selectivity can easily be obtained is organic molecules containing elements other than H, C, N, or O—most commonly (in biomolecules) S and P, but also halogenated or metal-containing compounds. Halogenated linear hydrocarbons would represent a basic model system where the electronic charge propagation and dynamics can be investigated. For example, in a halogenated polyethane (PE) IC n H 2 n Cl , composed of a carbon chain terminated by iodine and chlorine (Figure 3), the pump can be tuned to ≈630 eV to most efficiently create 3 d core holes at the iodine site. At this energy, the photoionization cross-section at the iodine site exceeds that at the chlorine more than ten times. Tuning the probe pulse to ≈250 eV shifts the site-selectivity to the chlorine atom as now the Cl 2 p cross-section is over four times higher than the 4 d cross-section at the iodine site. Depending on the charge propagation during pump–probe delay, the local charge at the chlorine site starts to change, which will be manifested as changes in the Cl electron binding energies. Observing the electron emission in the energy ranges specifically relevant to the chlorine atom adds further site-selectivity to the probe. In addition, at longer timescales molecular fragmentation proceeds and the probe would be able to explore chlorine-containing fragments. Absorption of the probe photons by these fragments can have a different effect than absorption by the still-intact parent molecule, such as more pronounced secondary fragmentation. Thus, a two-color time-dependent study of the fragmentation pattern can yield information not only on the charge migration but also on the dynamics of the spread of radiation damage.
An efficient and informative experimental method to monitor the intramolecular processes is given by high-resolution Auger spectroscopy, ideally in combination with ion spectroscopy performed in a coincidence arrangement. The 3 d Auger spectrum of iodine is located in the kinetic energy range around 350–450 eV. Similar to the 3 d hole relaxation in atomic Xe [19] and molecular CH 3 I [20], the most prominent Auger lines in iodine are also assigned to transitions to doubly charged states with electron configurations 4 d 2 and 4 d 1 4 p 1 . These lines are well separated from the corresponding Cl 2 p Auger spectrum ( L 23 V V ) at kinetic energies between 165 and 175 eV [21] and other ionization processes taking place at the photon energies considered here. An illustration of all possible ionization processes, including also the valence ionization of all atoms at both wavelengths is given in Figure 4.
Due to the high intensity of the FEL pulses sequential ionization processes are possible and likely to happen. As a consequence, the electron spectrum of the neutral parent molecule (depicted in Figure 4) will be overlaid with emission lines arising from the ionization of the ionic species and of the dissociation fragments. In order to separate the emission from different species coincidences between electrons and ionic fragments can be used for a more detailed analysis. In fact, coincidence experiments will be one of the major experimental tools available at the SQS instrument, and are feasible due to the high number of X-ray pulses (up to 27,000 per second) at the European XFEL. This high repetition rate allows one to record data of high statistics for coincident measurements between electrons and ionic fragments coming unambiguously from the same molecule.
In a typical experimental scenario, first the Auger spectra would be recorded at the individual wavelength 250 eV and 630 eV, respectively, in order to obtain the one-photon reference spectra. In addition, electron-ion coincidence will provide charge and fragment resolved electron spectra would at these photon energies. In a second step, the Cl 2 p Auger spectrum—caused by the 250 eV photon pulse—will be monitored in the presence of the additional the 630 eV pulse. When the 630 eV pulse comes after the 250 eV pulse, the spectrum will be unchanged compared to the single color spectrum. When both pulses are overlapping or the 630 eV comes earlier, the observation of the chlorine Auger spectrum for different delays between both pulses provide the information about the intermolecular processes. Changes of the kinetic energy position and of the intensity distribution within the Cl 2 p Auger spectrum are the monitor to follow charge migration processes inside the molecule to determine, for example, the time required to transmit the information about the creation of a 3 d core hole on the iodine site to the chlorine atom. For small molecules this time scale is in the order of a few femtoseconds [22], so probably difficult to access with pulses of about 2 fs duration each. For longer carbon chains the time scale is expected to increase to about 10 fs or more and therefore well suited to be studied with the set-up at the SQS instrument.
Furthermore, by selecting in coincidence mode a fragment containing the iodine atom or the iodine atom itself, also information on charge transfer processes is made available. Compared to earlier work using an optical laser to initiate the fragmentation [23], the pump can be used in a very selective way, changing for example between excitations of the chlorine and the carbon atom. In this way a more versatile and detailed analysis of the complex intra-molecular interaction and on the related electron and nuclear dynamics will become possible.
As the last example, two-color pump–probe scheme is also well suited for transient absorption experiments such as proposed by Li et al. for small protonated water clusters [24]. The pump pulse would be tuned well below the O 1 s ionization threshold, so that valence and inner-valence holes are created in the first step. In the second step, the probe would be tuned just below the O 1 s threshold (at 540 eV, resonantly exciting the O 1 s electrons to the vacancy previously created. In the case of outer-valence vacancies, the resonant energy is around 523 eV [24]. The valence hole relaxation following the pump affects the binding energy of the outer-valence hole state and thus also the core-excitation energy substantially. These energy variations can be probed by two-color core-level transient absorption spectroscopy with femtosecond time-resolution, providing a time-resolved picture of electronic relaxation in a water cluster.

4. Numerical Simulations for Two-Color Generation and Transport

FEL simulations followed by radiation transport simulations allow for a full characterization of the expected radiation properties at the interaction point with the sample. For a given initial electron beam, it is possible to calculate the distribution of the SASE FEL pulses of both colors at the sample, enabling thereby the advanced modeling of experiments. In the following subsections we provide numerical simulations of the SASE3 performances for both low-charge (chicane + optical delay) and fresh-slice (chicane + wakefield structure) two-color generation options, as illustrated in Figure 2. In addition, the re-imaging of two distinct sources, one for each radiation pulse, onto the sample is discussed. Finally, the results of numerical simulations for three scientifically-interesting combinations of photon energies are compared for both techniques.

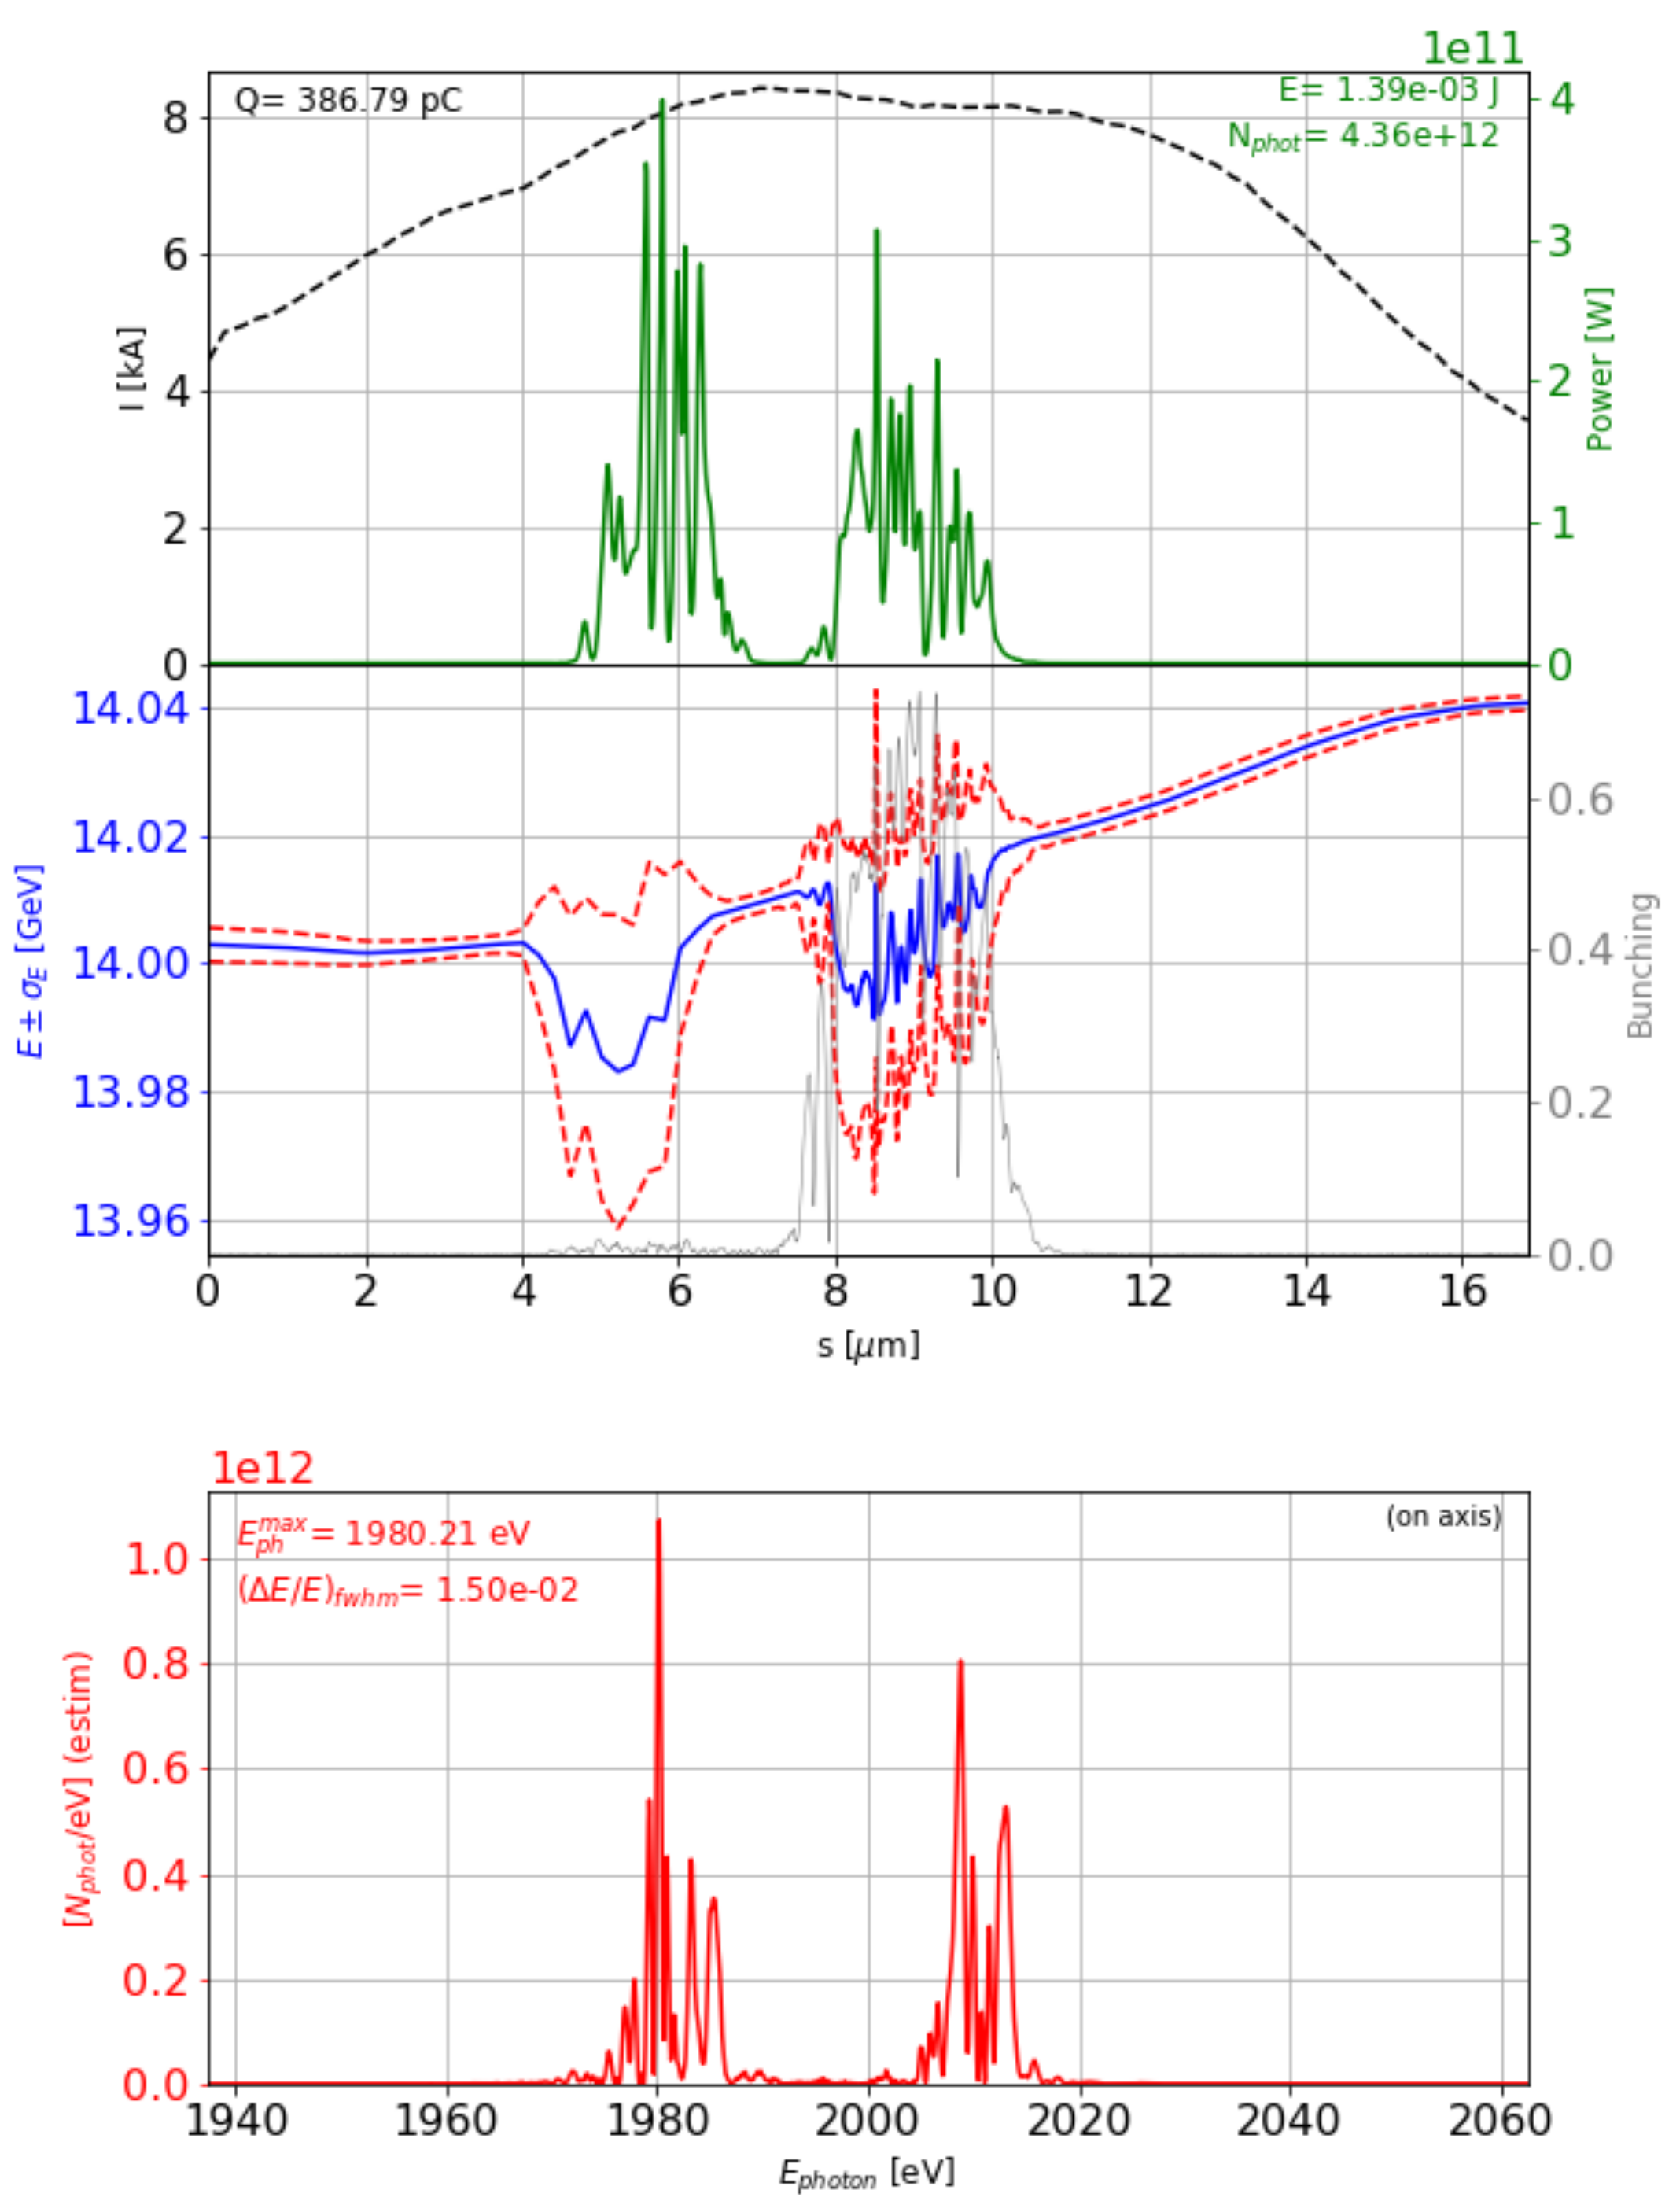
4.1. Generation and Transport of fs-Long Two-Color Pulses in the Low-Charge Mode of Operation

The SASE3 undulator consists of 21 undulator segments each providing 5 m magnetic length (corresponding to a total length of about 6 m each) with a period of 68 mm. A magnetic chicane splits the SASE3 undulator into 11 cells for U1 and 10 cells for U2; we assume that all cells are closed except for the first 2 and the last 4 cells in U1 as well as the first 3 cells in U2. Therefore, 5 cells of U1 and 7 cells of U2 are closed and contribute to lasing.
In order to be delivered to the SASE3 undulator, the electron beam must pass through the SASE1 line [25]. It was shown [26] that lasing in the SASE1 undulator can be inhibited, but due to quantum fluctuations [27,28] and synchrotron radiation, the electron parameters deteriorate. Also, the influence of resistive wakes in the SASE1 undulator affects the electron beam energy distribution. Therefore, the electron beam propagation through the SASE1 undulator, accounting for these effects, was included in the simulations. Figure 5 shows the results of start-to-end simulations of the electron beam passing through the European XFEL linac [29] and SASE1 undulator up to the entrance of the SASE3 undulator. It refers to a low-charge 20 pC mode of operation, not yet enabled at the time of writing, but foreseen at the European XFEL.
The electron beam obtained in this way is sent through the first part of the SASE3 undulator U1, with 5 active segments tuned at 630 eV. The results of a statistical simulation run calculated by Genesis [30], which has been used for all simulations in this paper, are shown in Figure 6.
After lasing in U1, the electron beam goes through the magnetic chicane, while the photon beam passes through the optical delay line. Under the assumption that X-ray diffraction effects in the optical delay line are negligible and that its mirrors do not sensibly modify the wavefront, the 630 eV radiation pulse, generated in the U1 undulator, is just delayed with respect to the electron beam at the U2 undulator entrance. In our simulations the electron beam propagating through the chicane maintains all its parameters, except for the electron density modulation (micro-bunching), which is washed out during the passage through the chicane. We therefore take the numerically simulated electron beam distribution at the end of undulator U1 and use it for the FEL simulations in U2. The proper shot noise is automatically introduced into the electron beam by the Genesis simulation code. The results from the lasing of the seven active segments at the end of U2, tuned at 250 eV are presented in Figure 7, where a statistical run is shown. Both pulses are characterized by pulse durations much shorter than the 10 fs and pulse energies of several 10 microJ are reached. As discussed already above, the pulse generated in U2 has a slightly longer pulse duration (about 3.3 fs FWHM) that the one generated in U1 (about 1.5 fs FWHM). The second radiation pulse has larger variance in spectral position, power profile and intensity, compared to the first pulse. In fact, assuming a perfectly reproducible electron beam, shot-to-shot variations of the first radiation properties originate from the stochastic nature of the SASE process; in the second undulator, radiation is emitted by a stochastically spoiled electron beam, therefore the properties of the second pulse are not only driven driven by the stochastic SASE process, but also by shot-to-shot differences in electron beam.
The final step consists in performing wavefront propagation simulations through the SQS beamline. In order to efficiently simulate radiation propagation through the optical beamline, properties of the FEL radiation sources were analized by backpropagation of the simulated radiation distribution with a dedicated module of Ocelot [31]. The position of the source is defined as the point of the maximum photon density. A full FEL pulse propagation through the optical beamline is possible, but this procedure does not add particular insight to the final results. Therefore, in order to simplify the propagation analysis, here we model the source with a Gaussian beam of the same divergence.
We model the SQS beamline with two offset mirrors OM1 and OM2 and two Kirpatrick-Baez (KB) mirrors KB1 and KB2 as illustrated on Figure 8. For simplicity, in this example we chose the same incident angle of 9 mrad for all mirrors, though other angles are possible for the offset mirrors. The total reflectivity of four mirrors is 71% at 250 eV and 80% at 630 eV, assuming 1 nm RMS height errors for the mirror surfaces. The finite length of the KB focusing mirrors (80 cm) may be affecting the photon density on the sample via clipping the radiation pulse and increasing the Rayleigh length of the image. After passing through the entire beamline, the photon beam is focused at the sample position. One issue concerning the optimal focusing is related to the presence of two spatially separated sources of the two pulses: in fact, the first pulse originates from the last closed cells of U1, and the second pulse from the last cells of U2. In our case study, the distance between the two sources, labelled S 1 and S 2 , amounts to 15 undulator segments, corresponding to a length of about 90 m. Therefore, only one of the two sources, either at 630 or at 250 eV, can be effectively focused at the sample position. Moreover, the two KB mirrors have different focal lengths. Therefore, if we choose to obtain an image of S 2 in both transverse planes, S 1 would be imaged at different positions in the horizontal and vertical planes. In other words, if we decide to tune the KB mirrors to image one of the two sources at one particular position, the image of the other will not only appear shifted in space, but will also be a subject to astigmatism.
In order to solve this problem we suggest to re-image on the sample an intermediate, imaginary source located between S 1 and S 2 , labelled S ¯ , as in Figure 9 by properly tuning the KB mirror system. In this case, the image of S ¯ appears at the position denoted I ¯ . This yields a good compromise in terms of beam sizes at the sample, Figure 10. Based on our simulations, the resulting photon fluxes would be sufficient to conduct the experiment proposed in Section 3.

4.2. Performance of the Fresh-Slice Upgrade Option

As discussed above, the SASE3 two-color setup can potentially benefit from an adaptation of the fresh slice technique proposed and tested at the LCLS [17] exploiting a wakefield structure, where the generation of 10-fs-long radiation pulses was reported. A similar wakefield structure is considered for installation at the European XFEL [33]. The fresh slice technique is based on exploiting two different lasing windows within the electron beam at different parts of the undulator, both up to the saturation level. Aside from a magnetic chicane, the only crucial component for the realization of this scheme is a wakefield structure to transversely deflect the tail of the electron beam. If the electron beam orbit is tuned in a way that the tail of the electron beam radiates in the first undulator part and the head in the second, it is possible to obtain a negative delay between the two FEL pulses, provided that the distance between the lasing windows exceeds the electron beam retardation responsible for radiation slippage in the undulator.
The lengths of the head and the tail lasing windows depend on the amplitude of the transverse kick induced by the wakefield structure onto the electron beam; in particular, the head window is longer than the tail one, and their length also decreases with the wavelength. Therefore, in case of large photon energy separation, it may be beneficial to emit the pulse with lower photon energy with the tail of the beam in U1, followed by emission of the pulse with larger photon energy with the head of the beam in U2. This sequence should yield pulses with similar durations and minimize the radiation slippage in U2.
We performed numerical simulations for the two-color SASE3 scheme based on the setup in Figure 2b. In our particular case study we consider a 500 pC electron beam with 8 kA compression and 15 m average beta function. One 2m-long corrugated wakefield structure module is assumed to be installed upstream the SASE3 undulator to deflect the tail of the electron bunch vertically. Two SASE pulses of about 2 keV photon energy reach saturation, as illustrated in Figure 11. No electron beam delay is introduced by the magnetic chicane in this case, and the temporal separation of the two pulses is roughly −10 fs (−3 μ m of spatial separation). With the magnetic chicane turned on, the second radiation pulse can be delayed up to +1 ps level; hence, zero delay between the radiation pulses is possible. Photon energy separation of the two pulses is chosen to be small only for illustration purposes and can be adjusted freely over the full range of photon energies available at the specific setting of the electron beam energy (see Table 1).

4.3. Comparison of Low-Charge and Fresh-Slice Options

To compare in more detail the performance of the low-charge and the fresh-slice methods, three additional cases with different combinations of photon energies were considered. As input for the simulations we used the start-to-end-simulated electron beams with 20 and 500 pC charges, both compressed to 5 kA and transported with an average beta function of 30 m. For the fresh-slice simulations we assumed that a single 2m-long corrugated structure module deflects the tail of the beam vertically. The distance of the orbit from the plate was 0.5 mm. The electron beam was assumed to be re-aligned and re-matched for the new lasing window. The results of these numerical simulations are provided in Table 2. The pulse durations correspond to the 2 σ spread of the power distribution (in the time domain). A systematic difference in terms of both pulse energy and pulse duration between the two generation methods is observed. On the one hand, typical durations of pulses emitted with the fresh-slice technique (10 fs), are about one order of magnitude longer (installation of additional wakefield modules is expected to decrease the pulse duration, in comparison with the 20 pC low-charge mode (1 fs)). On the other hand, the pulse energies are substantially larger with the fresh-slice operation mode. Also, in simulations we see that the number of active undulator cells affects significantly and non-linearly pulse duration and pulse energy, and is adjusted to obtain comparable energies and durations for both colors.

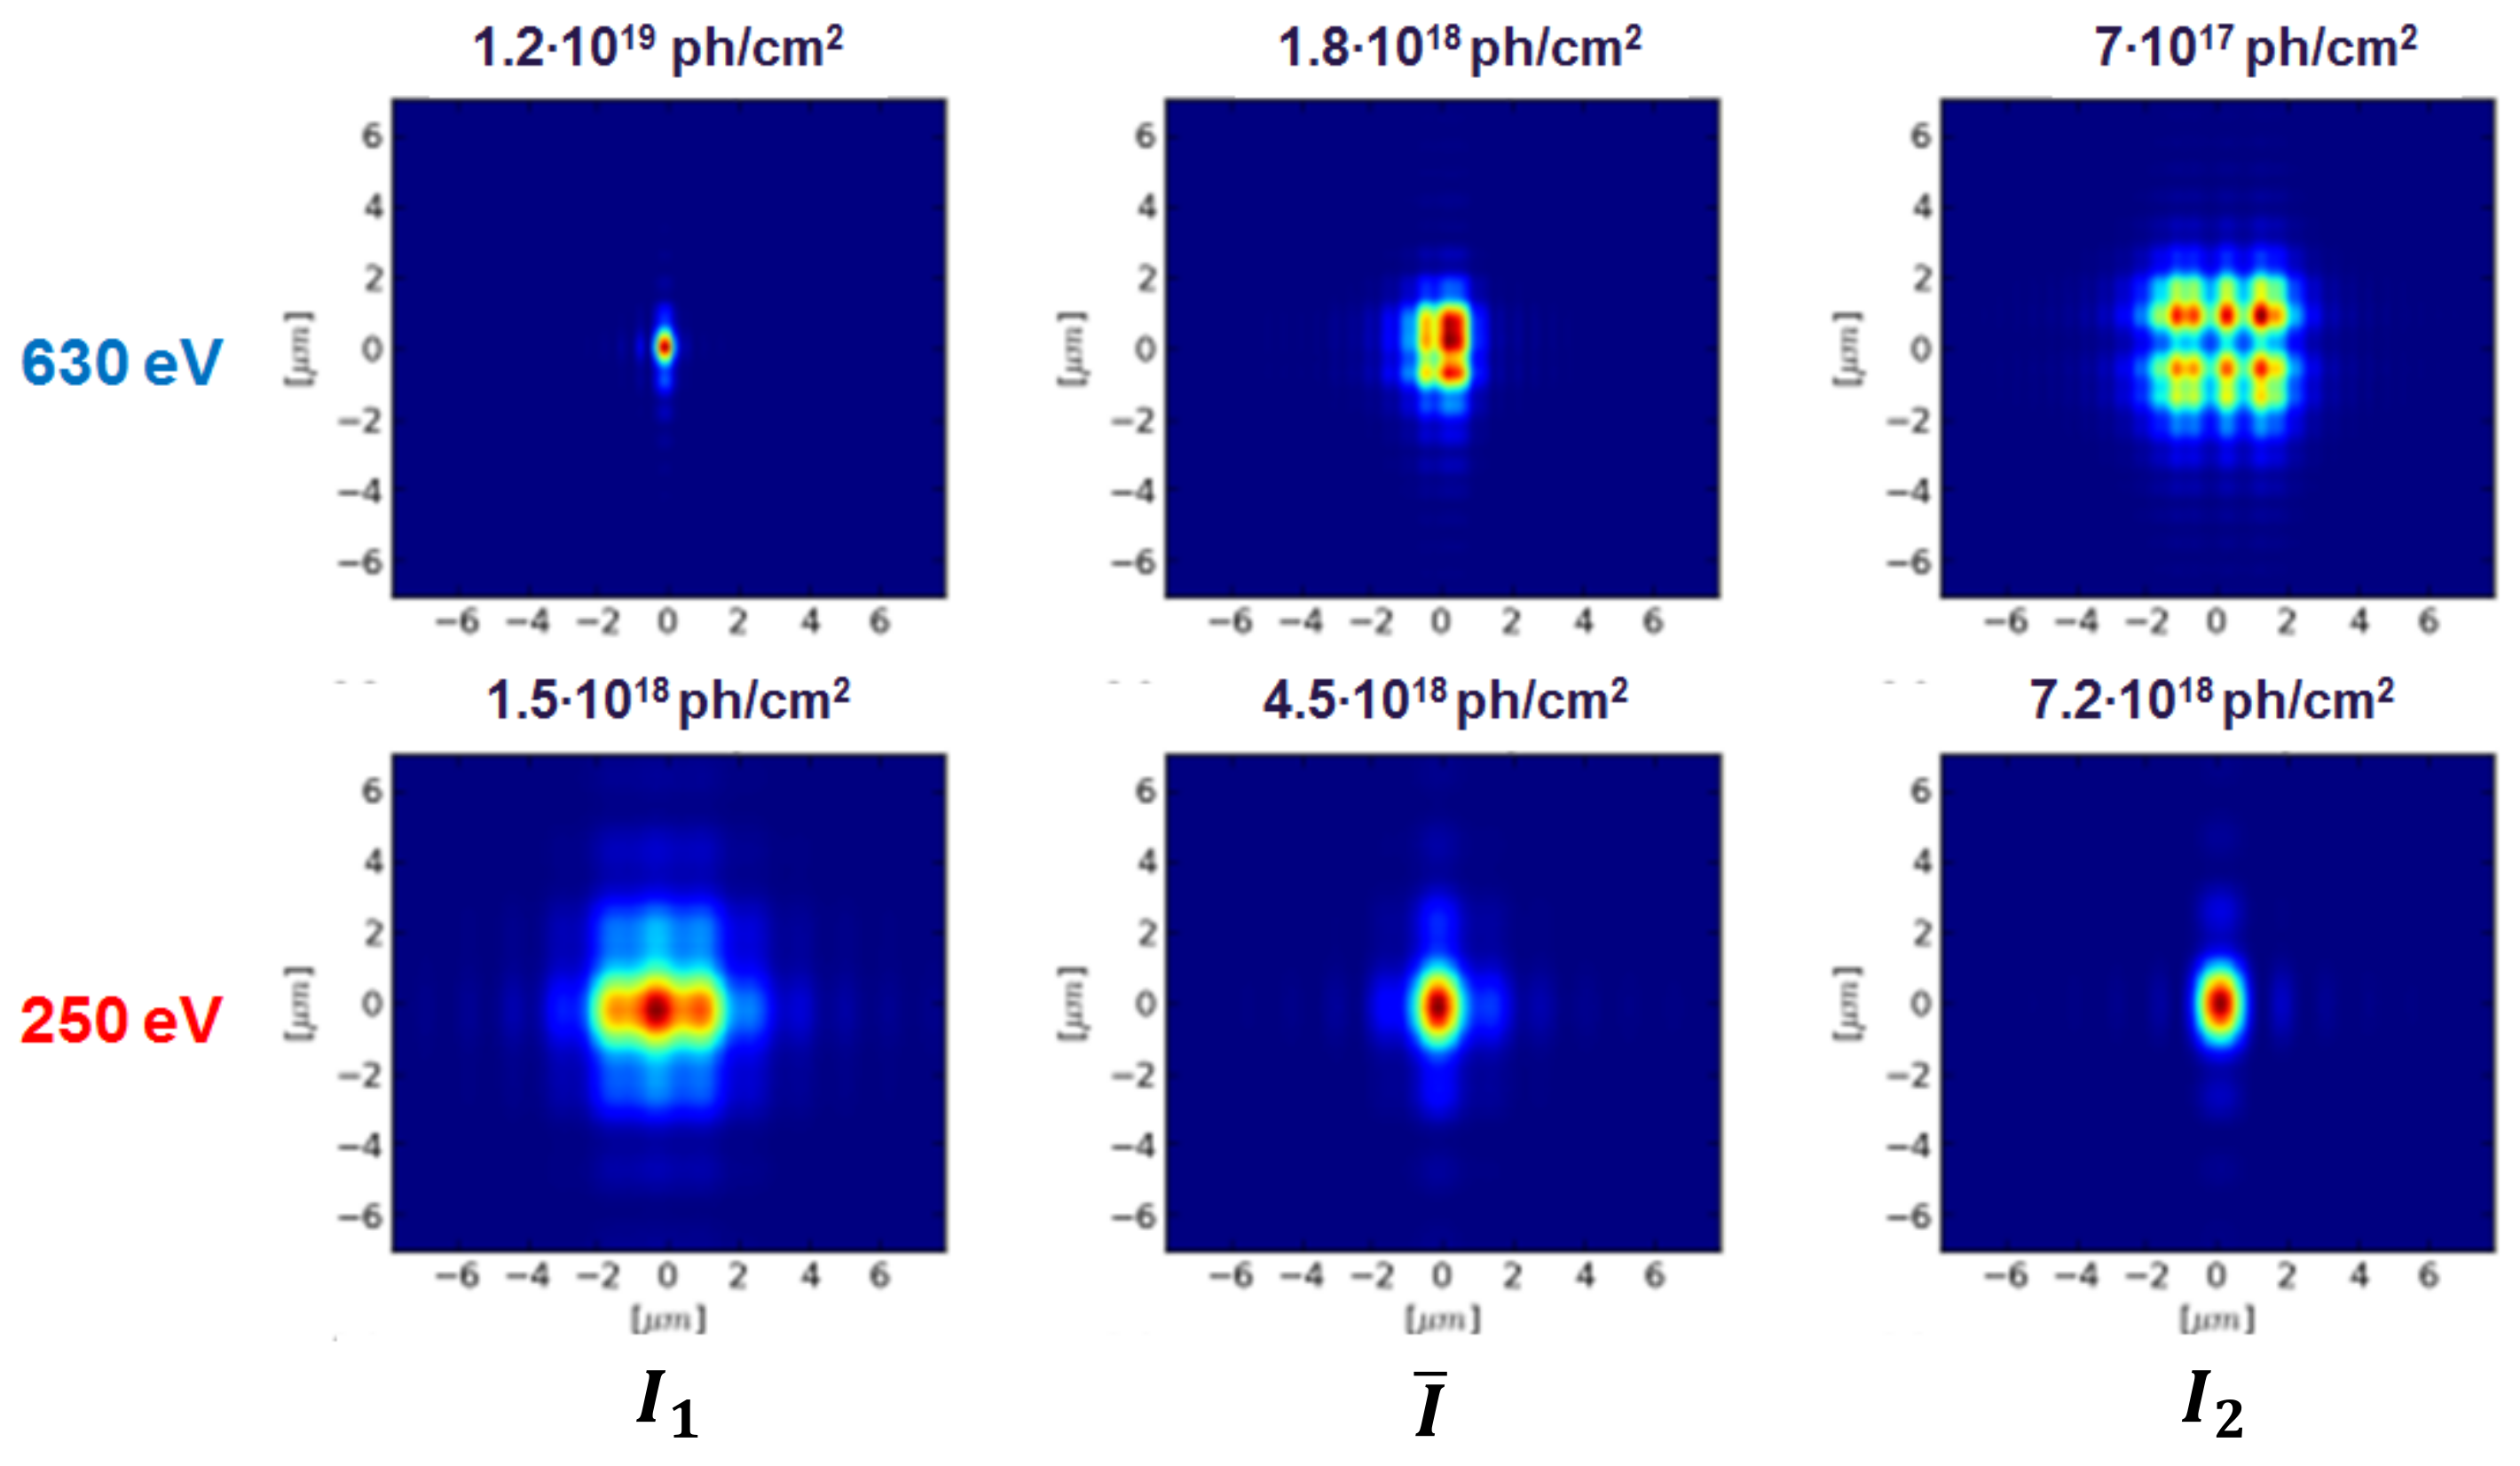
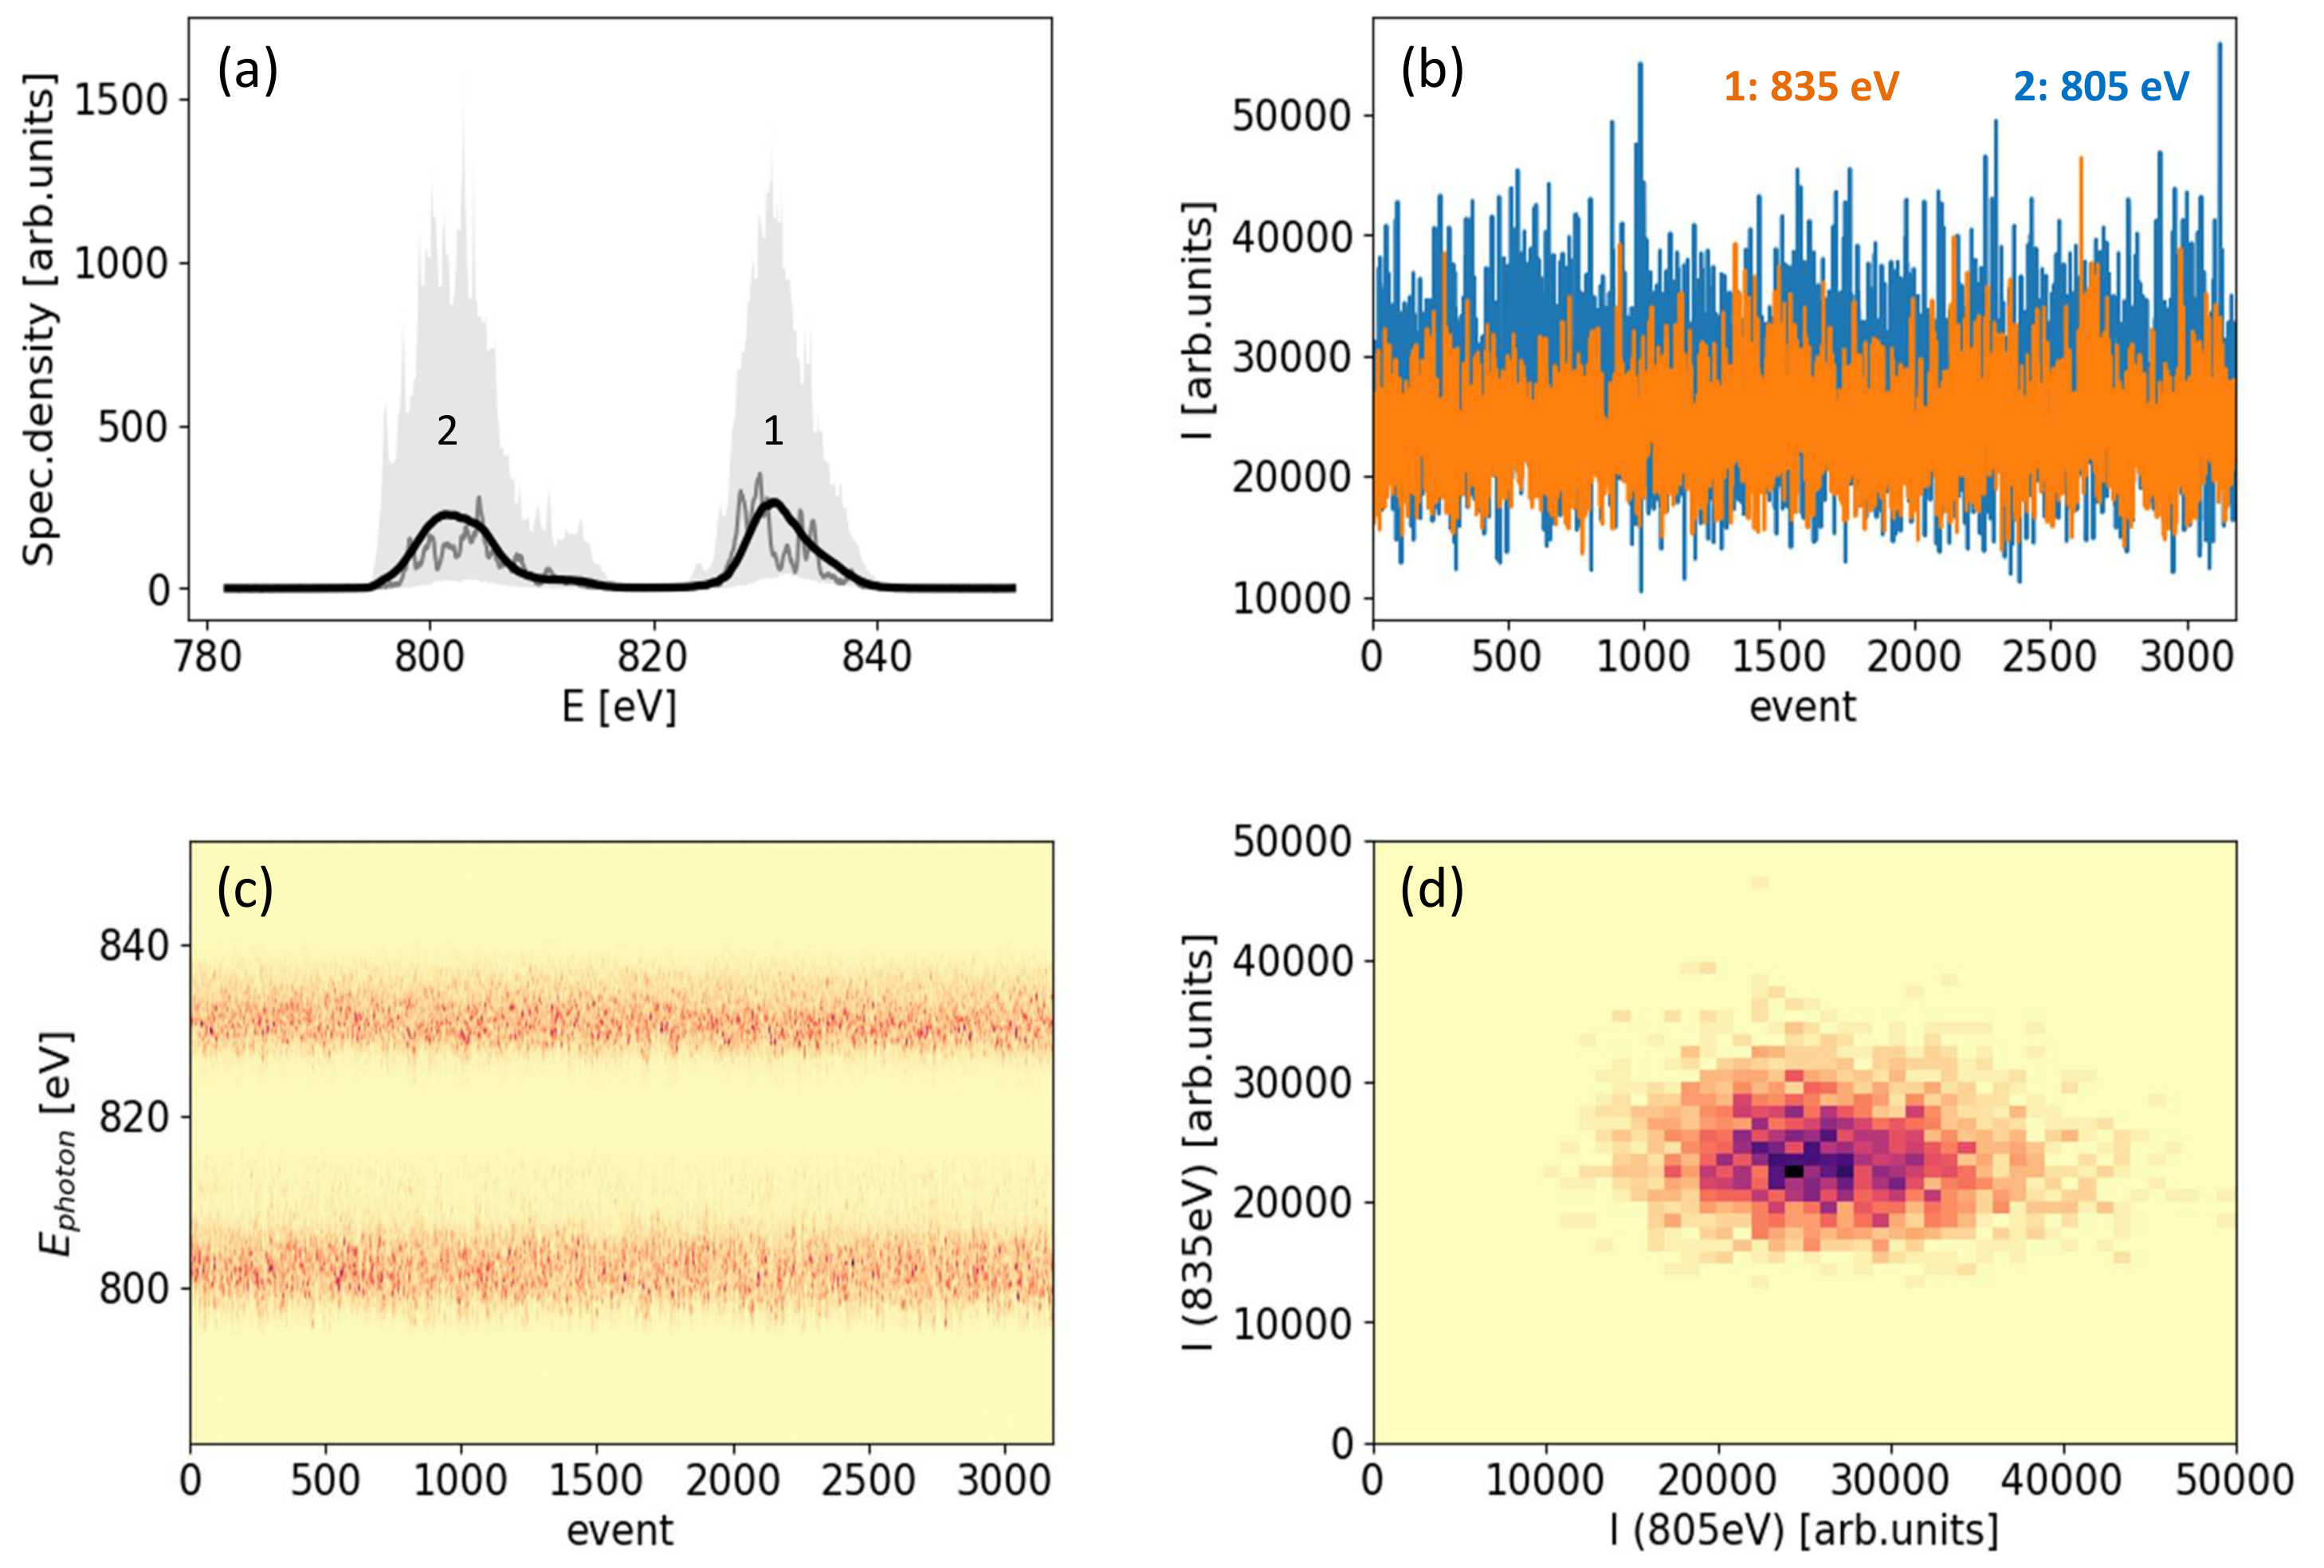
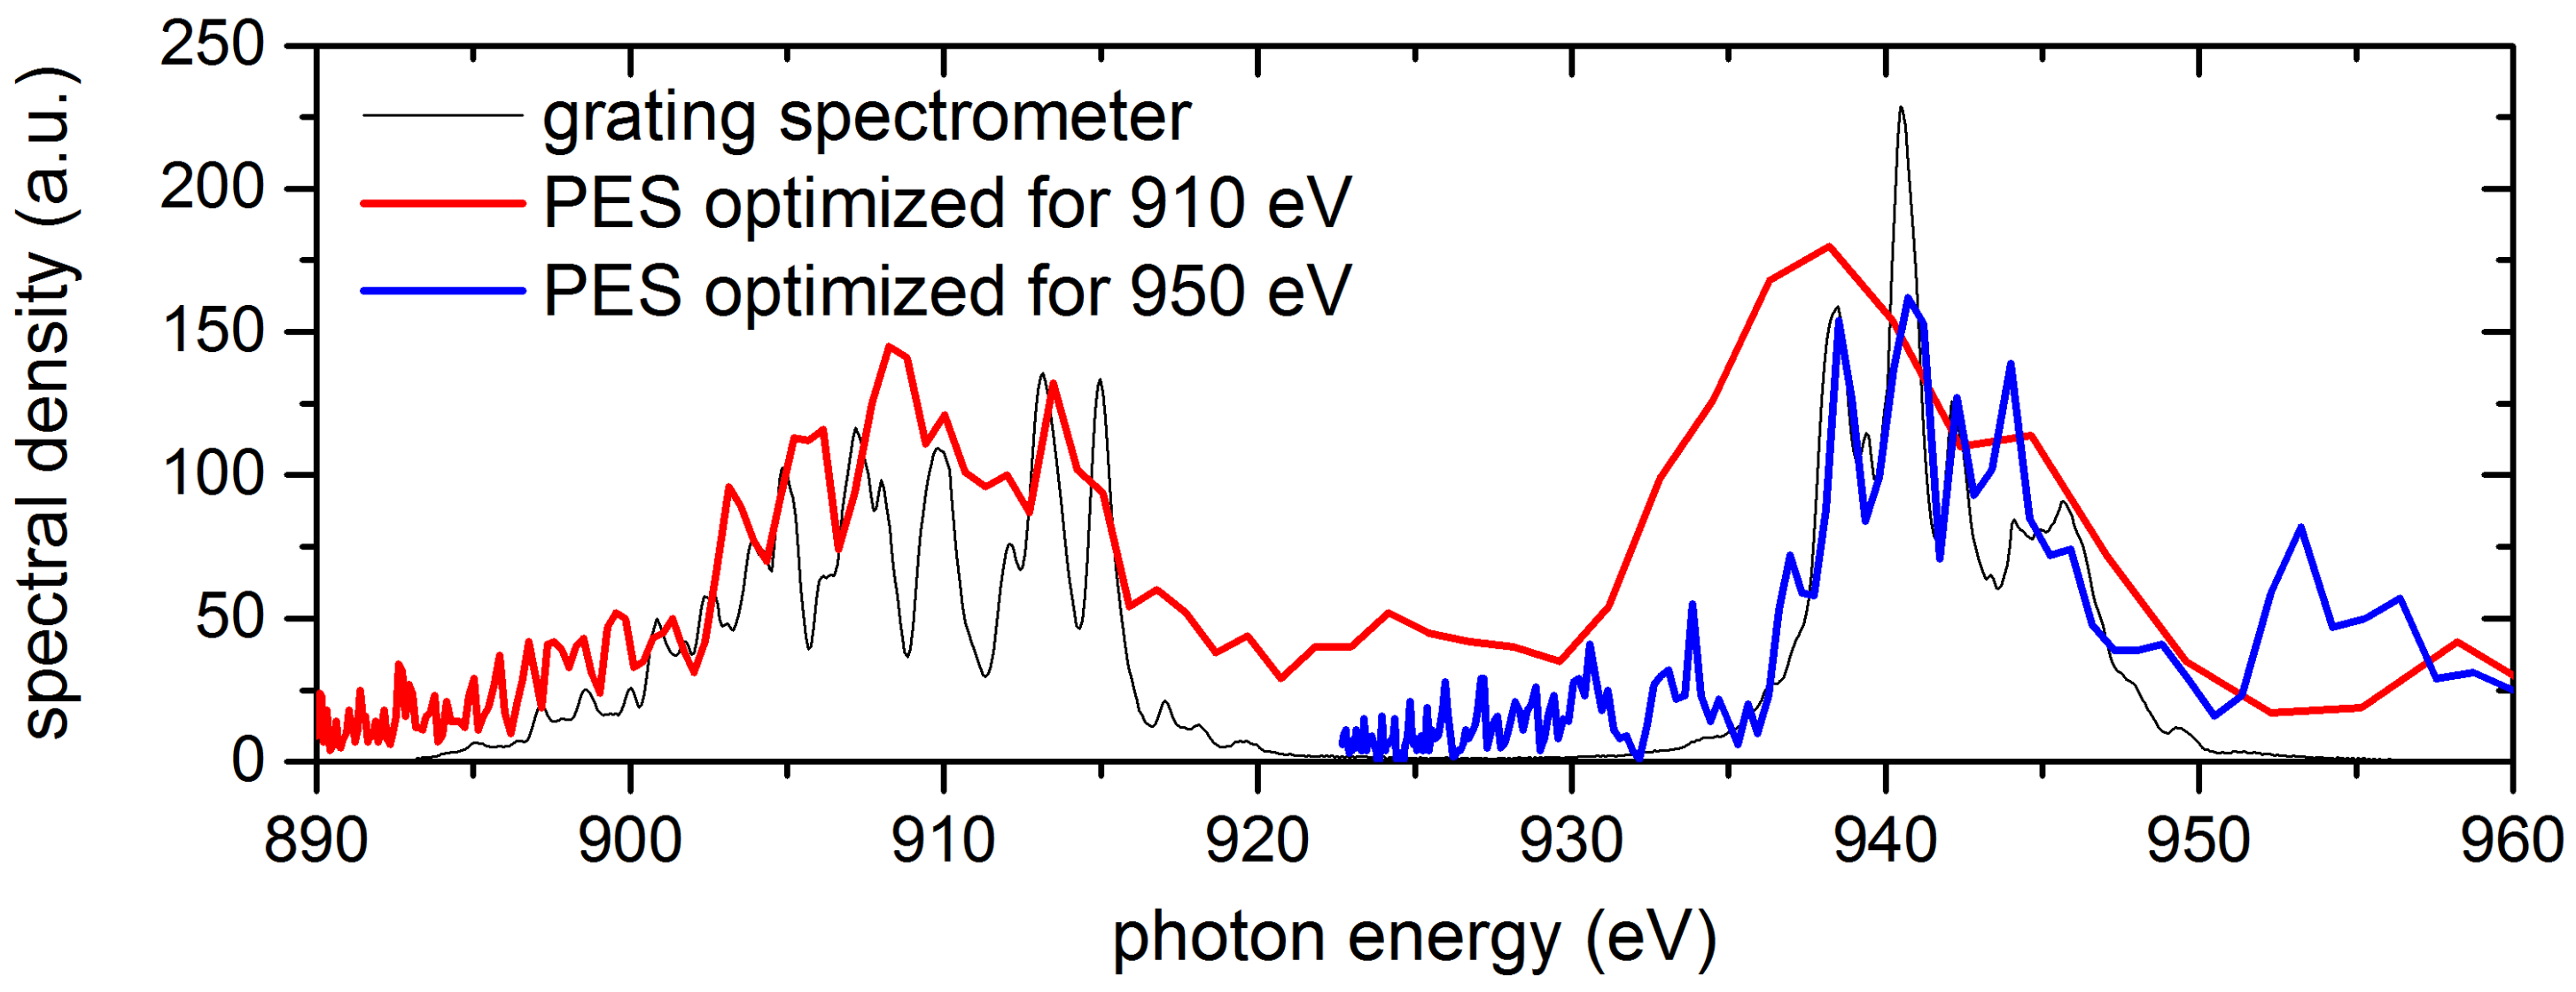
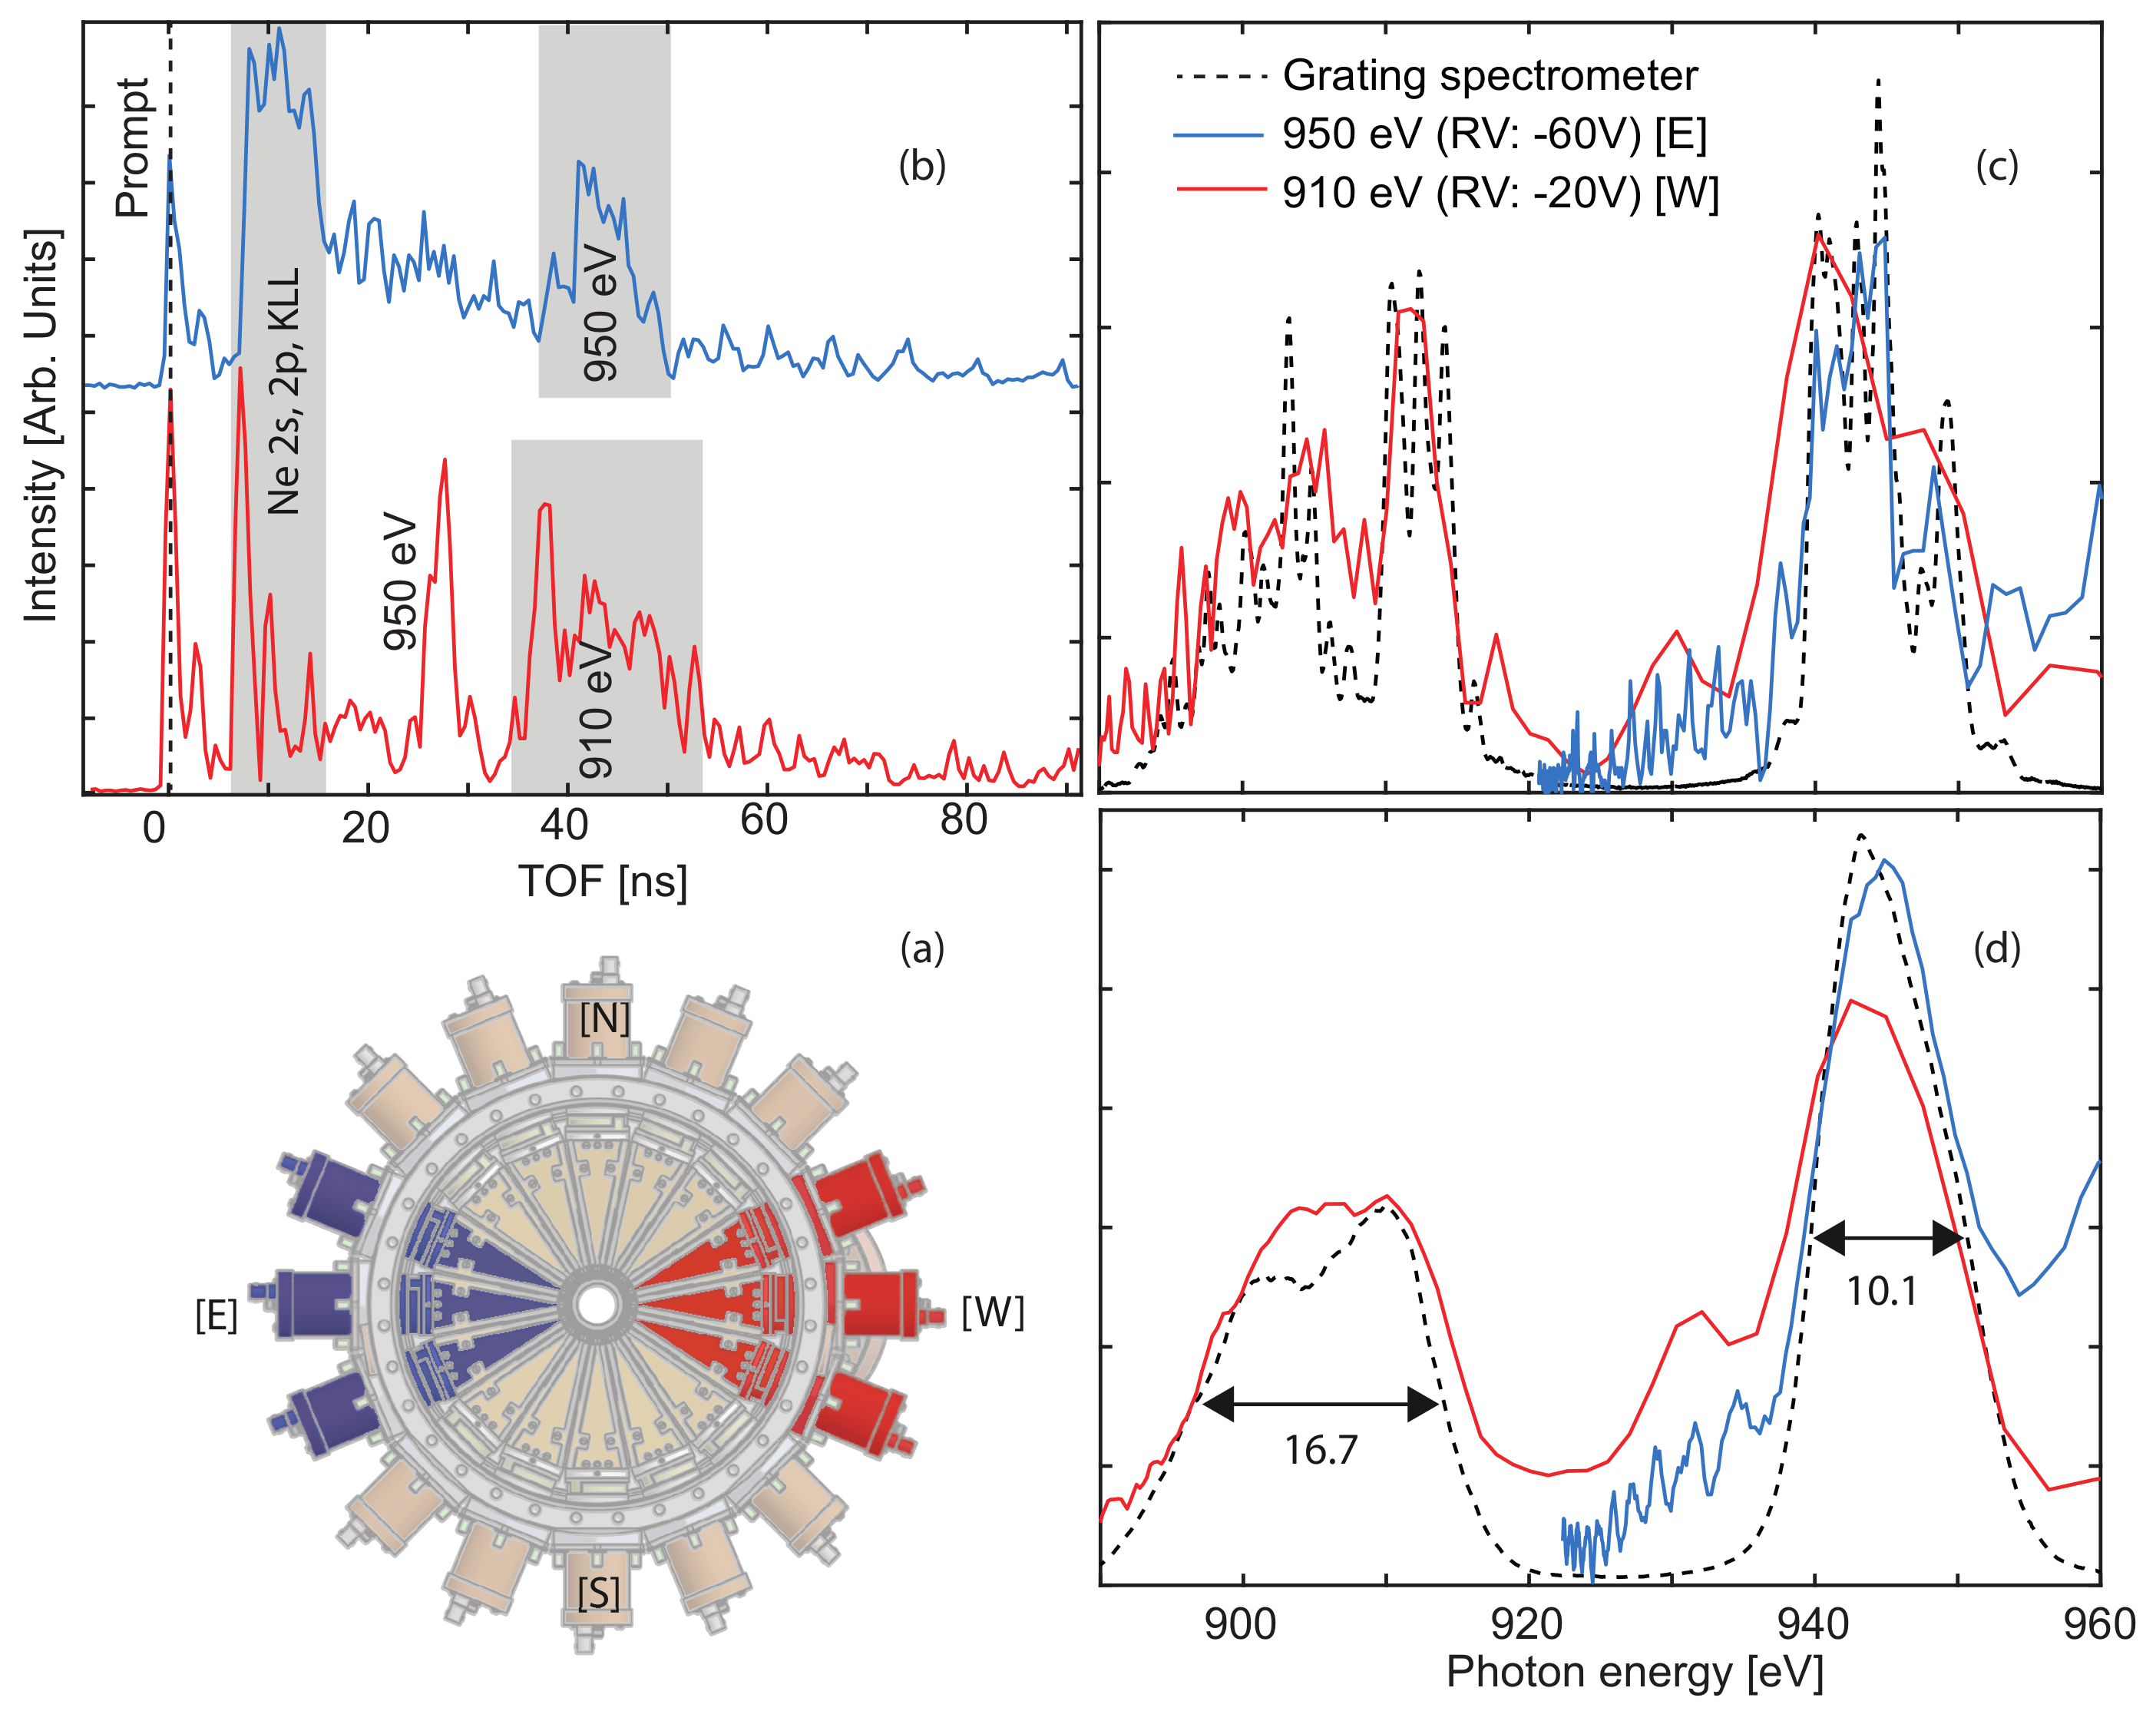
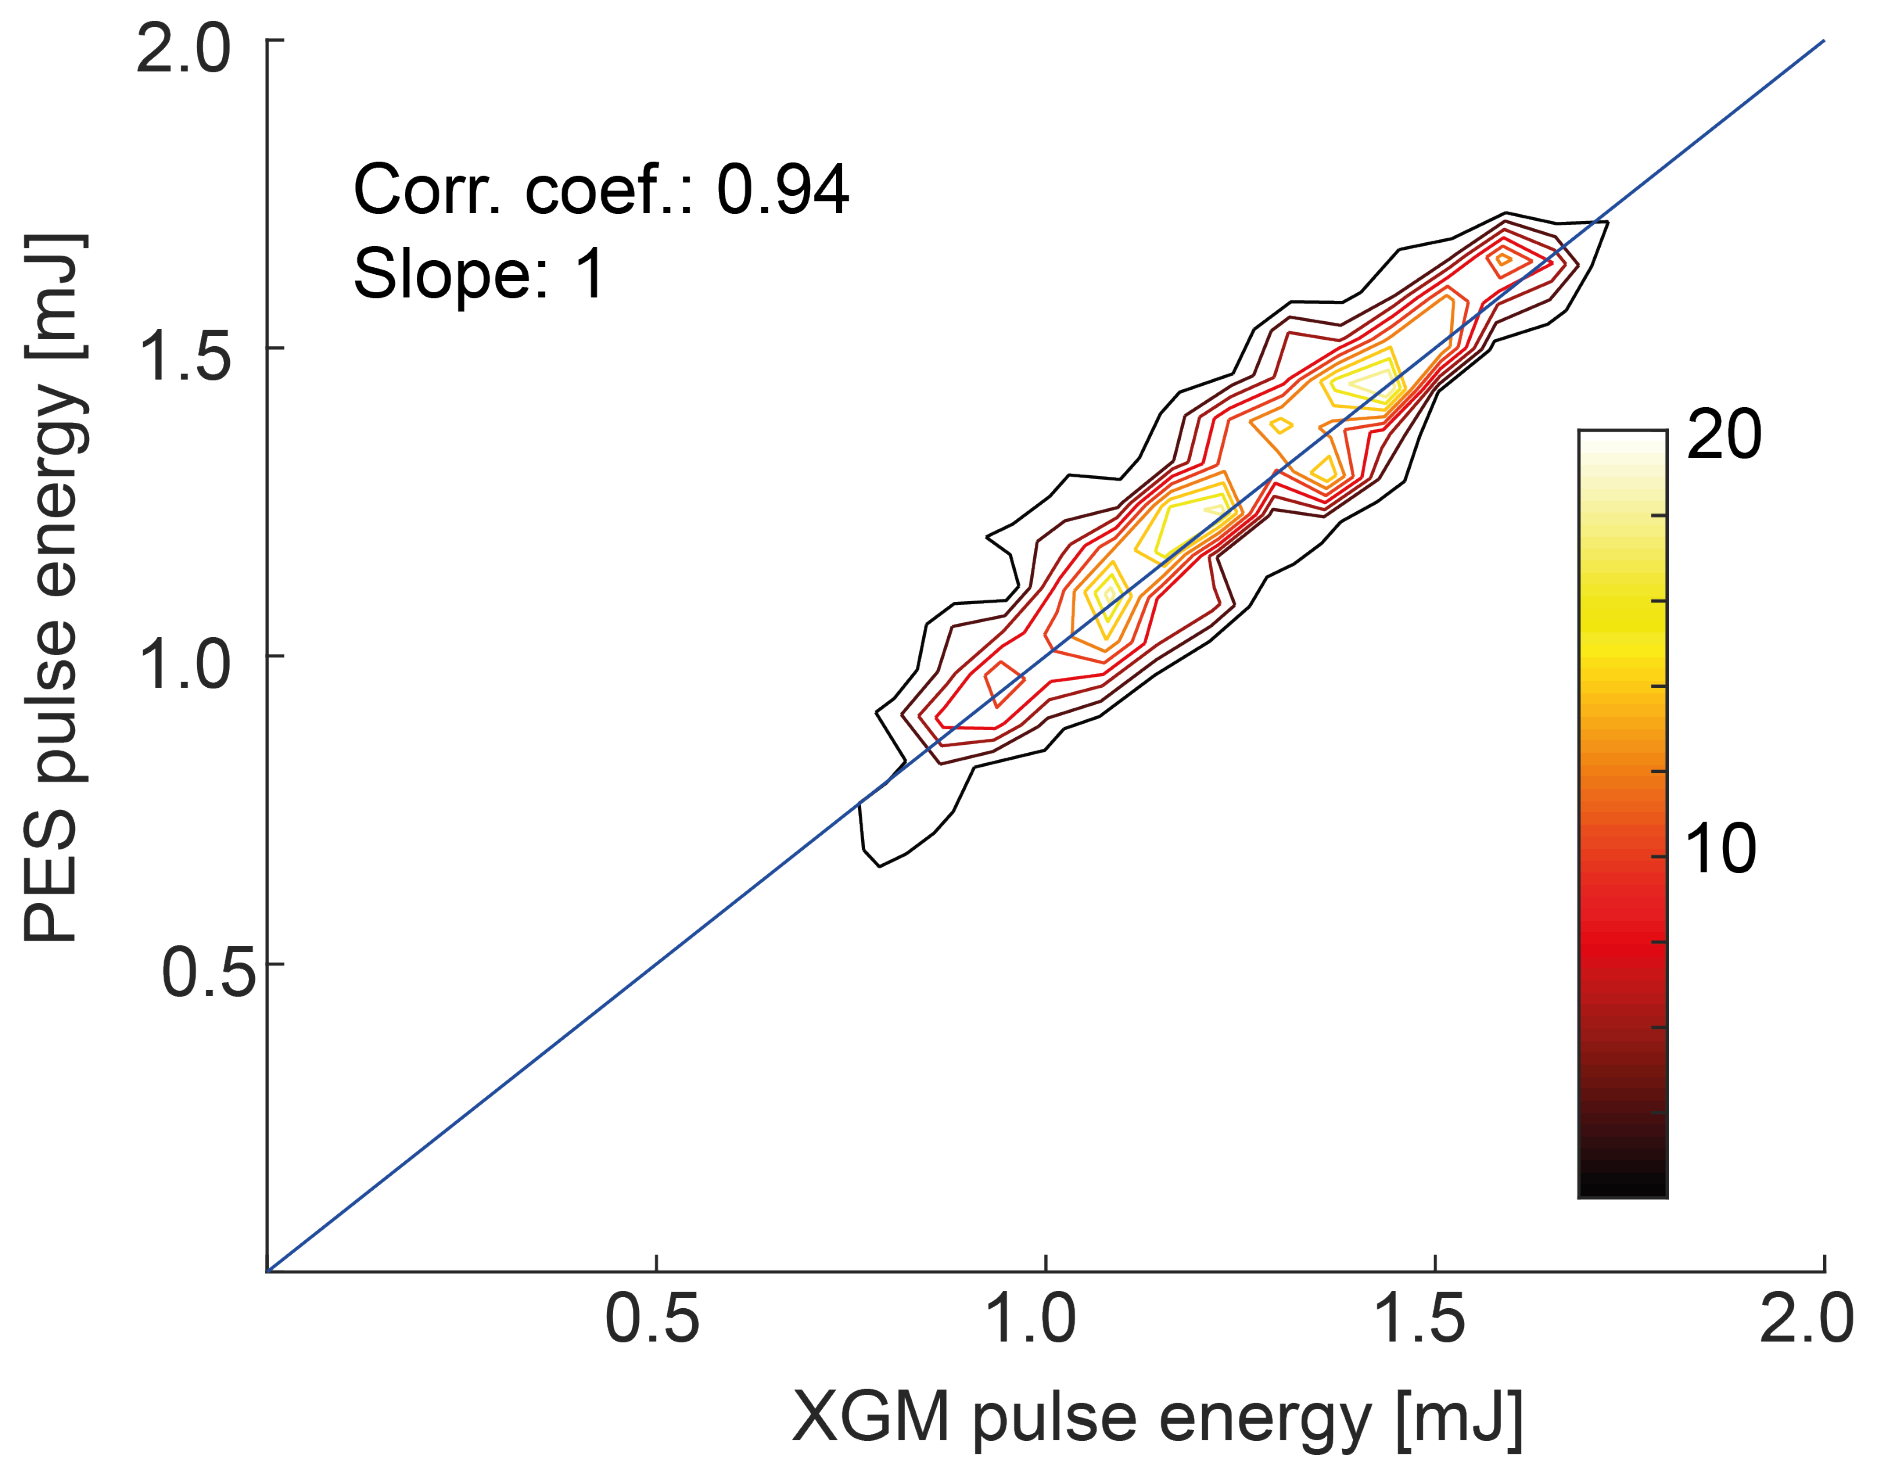
5. Results of First Measurements

First performance tests of the two-color setup at the SASE3 line of the European XFEL (Figure 1) have been carried out without the chicane, which is expected to be installed in 2020. We used a 250 pC electron beam at the energy of 14 GeV. The SASE3 undulator was divided into two roughly equal parts, and tuned to different photon energies, ranging between 700 eV and 1 keV, selected such that the two emission spectra did not overlap. Typical measured pulse energies were above the 350 μ J-range for each of the two colors. Figure 12a shows the radiation spectrum for the case of 835 eV emitted in U1 and 805 eV emitted in U2 with an average pulse energy of about 1.2 mJ in each color. Subfigures (b), (c) and (d) indicate stability of pulse intensities, photon energies and absence of significant correlation due to the presence of a large number of statistically independent SASE modes.
The spectra were measured using a soft X-ray grating spectrometer which makes use of the SASE3 monochromator beamline [32]. This is achieved by introducing a YAG:Ce crystal at the exit slit plane; the crystal converts X-rays into optical luminescence, which is detected by a CCD or MCP-coupled CCD. If not limited by the detection system (imaging crystal and CCD), the performance of the spectrometer is similar to the performance of the SASE3 beamline monochromator [34]. The grating spectrometer, although providing high resolution up to 5 × 10 3 , is an invasive device with a limited spectral window which does not allow to detect two pulses simultaneously in case they are largely separated in photon energy.
In a second campaign a set of 16 Time-Of-Flight (TOF) Photo-Electron Spectrometers (PES) [35], which are arranged around the intersection volume of the FEL radiation and a gas-phase target was used for the experiments to overcome this issue. A subset of the PES TOFs was optimized for the detection of the first color (950 eV) and another subset for the second color (910 eV). This arrangement allows for simultaneous non-invasive shot-to-shot detection of both colors, as shown in Figure 13. A more detailed description of the diagnostics system used can be found in Appendix B.

6. Conclusions

We reported on the status of the European XFEL two-color project at the soft X-ray SASE3 undulator. The simplest two-color setup, based on Figure 1, will be installed and made available to users in 2021. This scheme will provide two femtosecond soft X-ray pulses of different colors, separated in time by up to 3 ps, depending on electron beam energy.
The more advanced setup depicted in Figure 2a, based on the addition of an optical delay line, can be implemented in order to enable zero-crossing of both pulses in the time domain. Pulse durations of about 1 fs can be achievable in the 20 pC low-charge operation mode, hence the “low-charge” scheme name. The maximum negative delay would be −85 fs, while the positive delay would depend on electron beam energy: from 1550 fs at 8.5 GeV to 250 fs at 17.5 GeV. As a possible upgrade alternative, the fresh slice generation scheme, see Figure 2b, could be chosen, allowing 3100 fs and 730 fs of positive delay, respectively. The range for negative delays would depend on the precise electron beam properties and chosen photon energies, resulting in about −10 fs.
Regardless of the technique, both pulses are emitted in different locations, separated by about 50 m along the undulator. Therefore, upon refocusing, the waists of both pulses at the sample location will also be separated. The desired ratio of photon density on the sample may be optimized by adjusting the settings of the KB focusing system. Experiments can be modeled by simulating the generation as well as the transport of the two-color FEL pulses from the source up to the sample position. In order to illustrate this possibility we presented simulations for radiation generation and transport at SASE3 for a particular pump–probe experiment, whose scientific relevance has been discussed in Section 3. Two-color generation and delivery can be tailored for each experiment. In fact, pulse duration and photon density on the sample strongly depend on the generation technique, on the number of active undulators, on the distance between the sources of undulators as well as on settings of the KB mirror system and location of the sample with respect to the waists of each focused pulse.
Finally, we reported on the first realization and observation of generating two temporally superimposed two-color pulses of photon energies about 700–1000 eV and pulse energies up to 1 mJ at the SASE3 undulator line. Radiation spectra were diagnosed with both grating spectrometer and a gas-based time-of-flight photo-electron spectrometer (PES). The latter can be used as a non-invasive diagnostic device to determine pulse energies of both colors on a shot-to-shot basis.

Author Contributions

Conceptualization, V.K., E.S. (Evgeni Saldin) and G.G.; Data curation, S.S., S.K., E.S. (Evgeny Schneidmiller), M.Y., I.Z.; G.G.; Funding acquisition, E.K.; Investigation, S.S., N.G., J.G., A.K., J.L.; T.M. (Theophilos Maltezopoulos); Methodology, M.H., E.K., T.M. (Tommaso Mazza) and M.M.; Resources, W.D., L.F., M.G., M.H., Y.K., M.S., T.W., M.V.; Software, S.S., S.K., E.S. (Evgeny Schneidmiller), S.T., M.Y., I.Z., G.G., P.L.; Supervision, G.G.; Writing—original draft, S.S., N.G., E.K., J.L., T.M. (Theophilos Maltezopoulos), M.M.; G.G. All authors have read and agreed to the published version of the manuscript.

Funding

The instrumentation of the two-color project at the European XFEL is funded by the Academy of Finland with co-funding by the European XFEL.

Acknowledgments

The Authors acknowledge the help of European XFEL and DESY support groups in the technical developments of the setup.

Conflicts of Interest

The authors declare no conflict of interest.

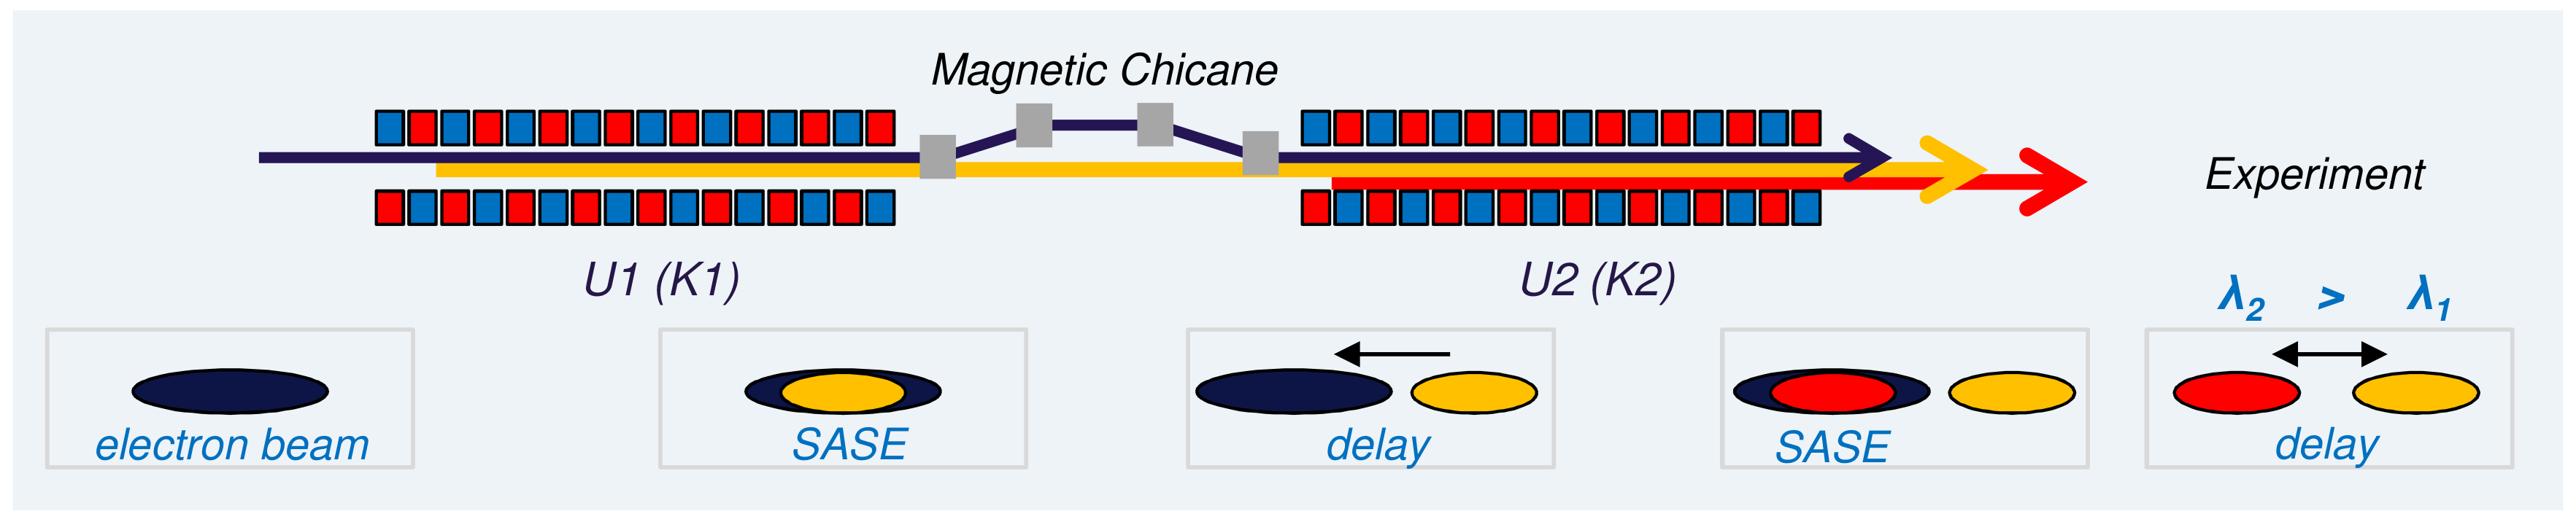
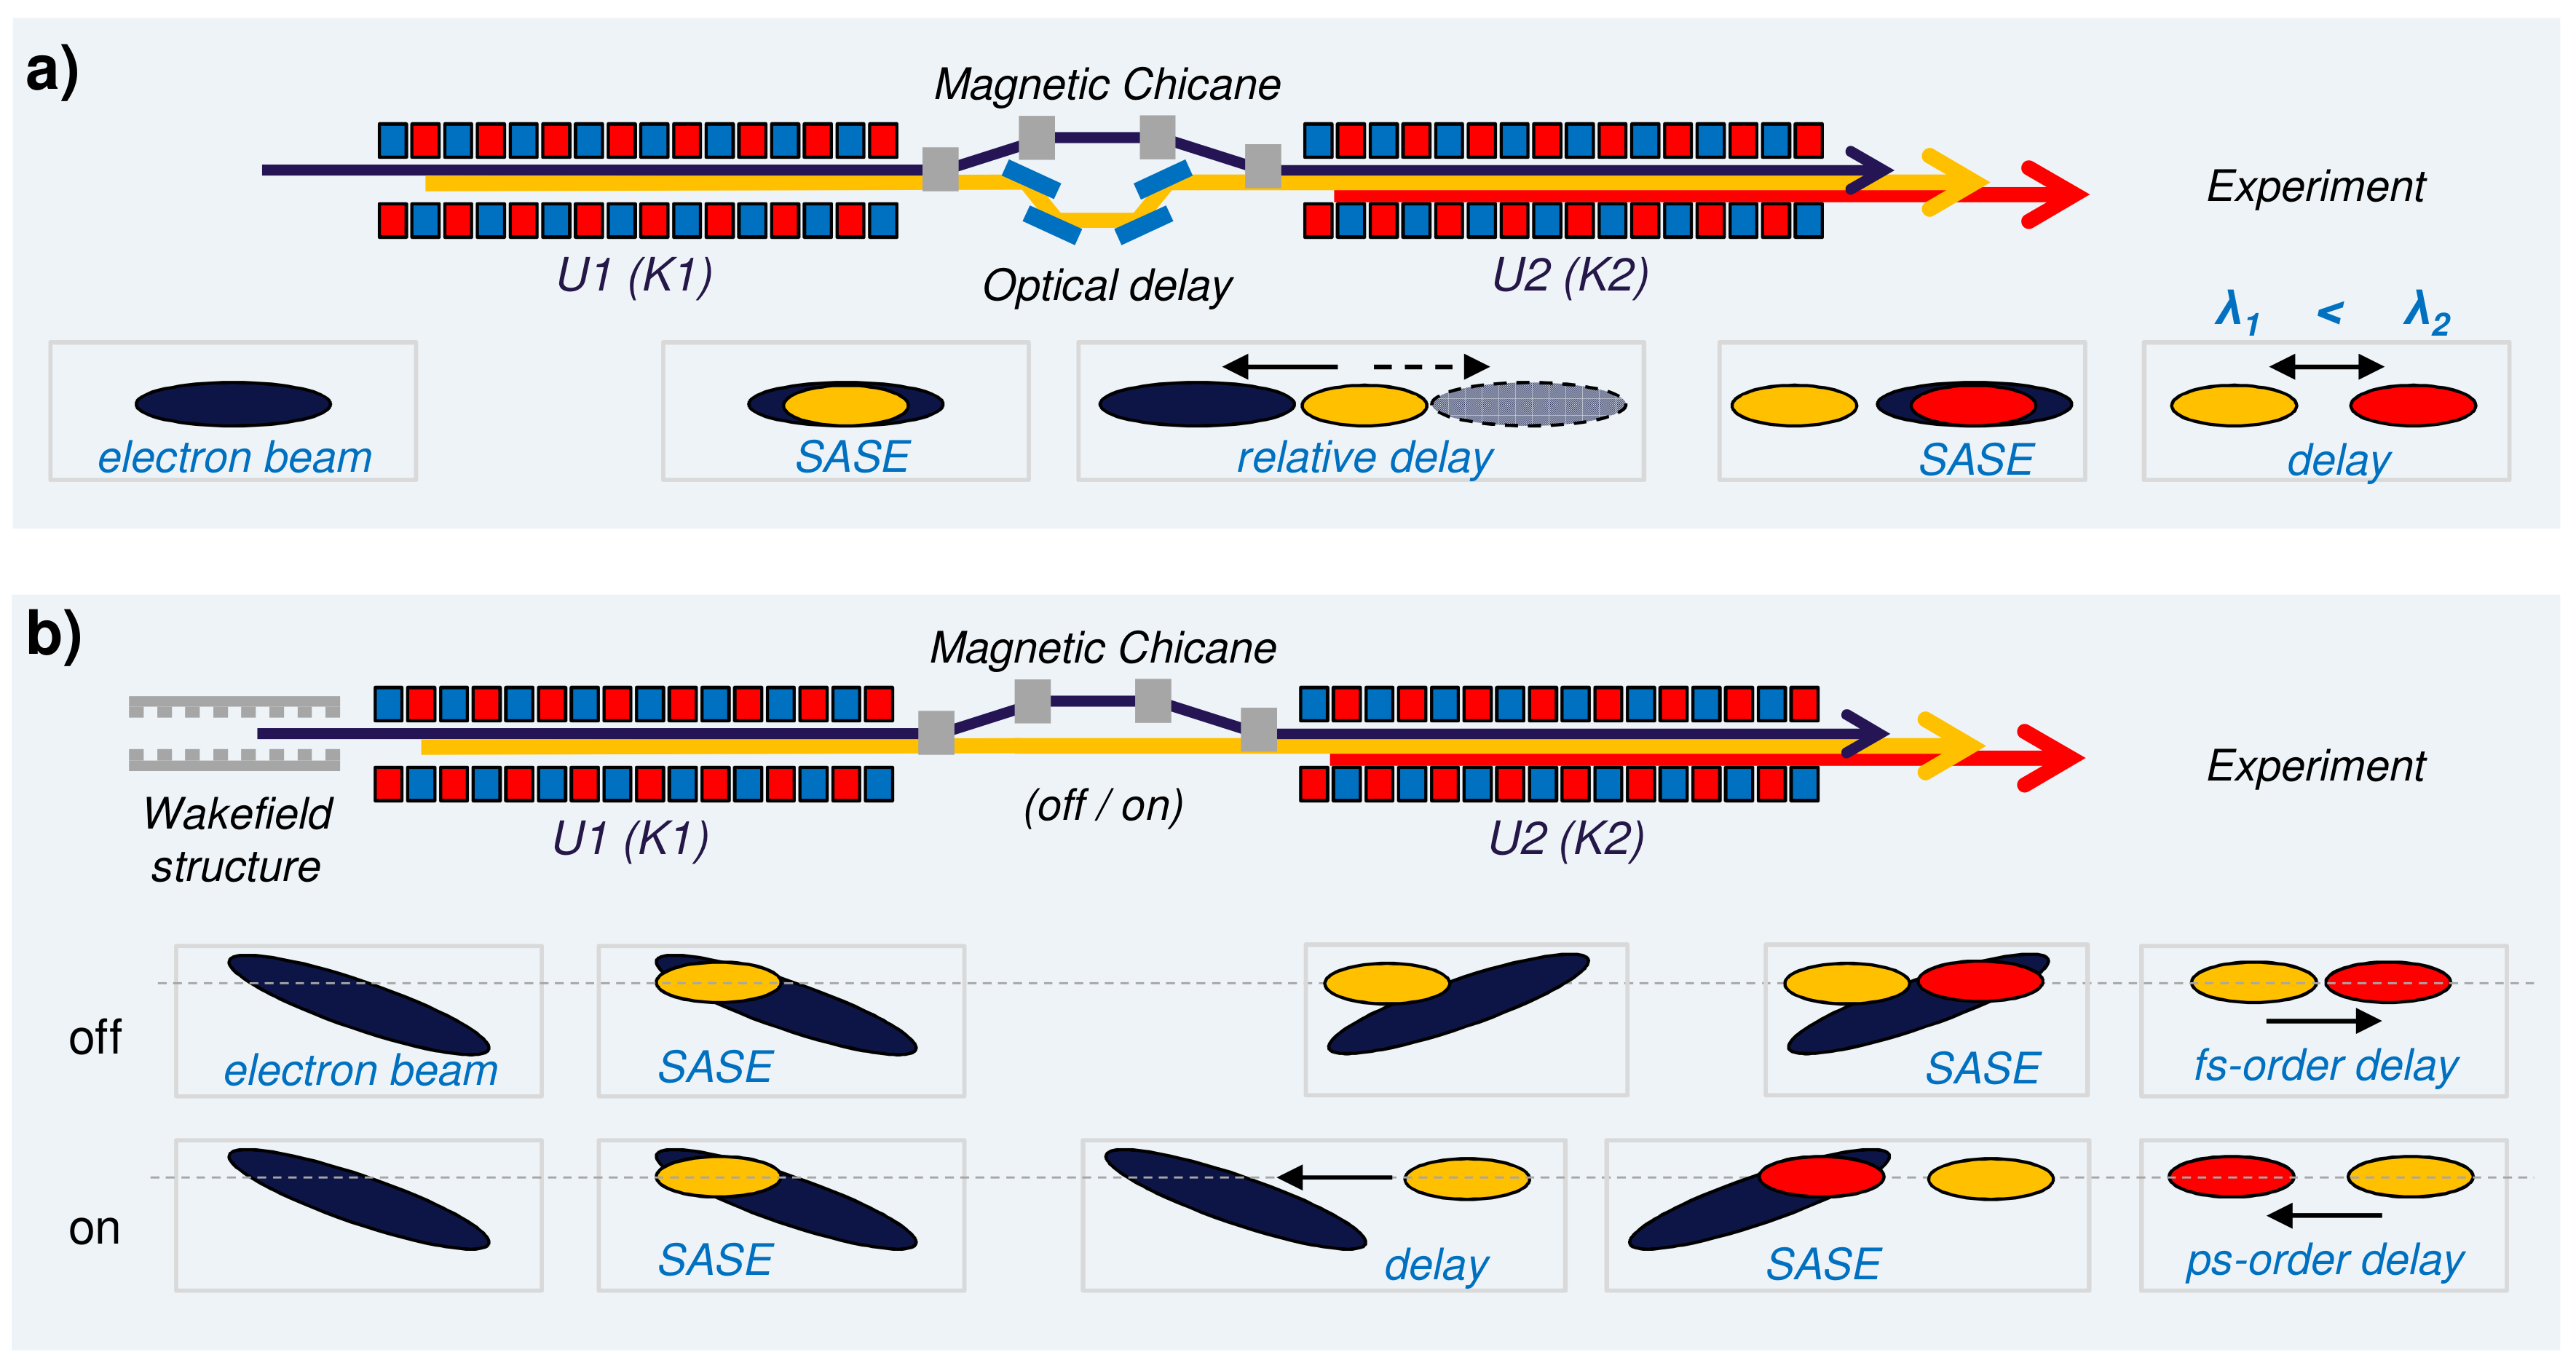
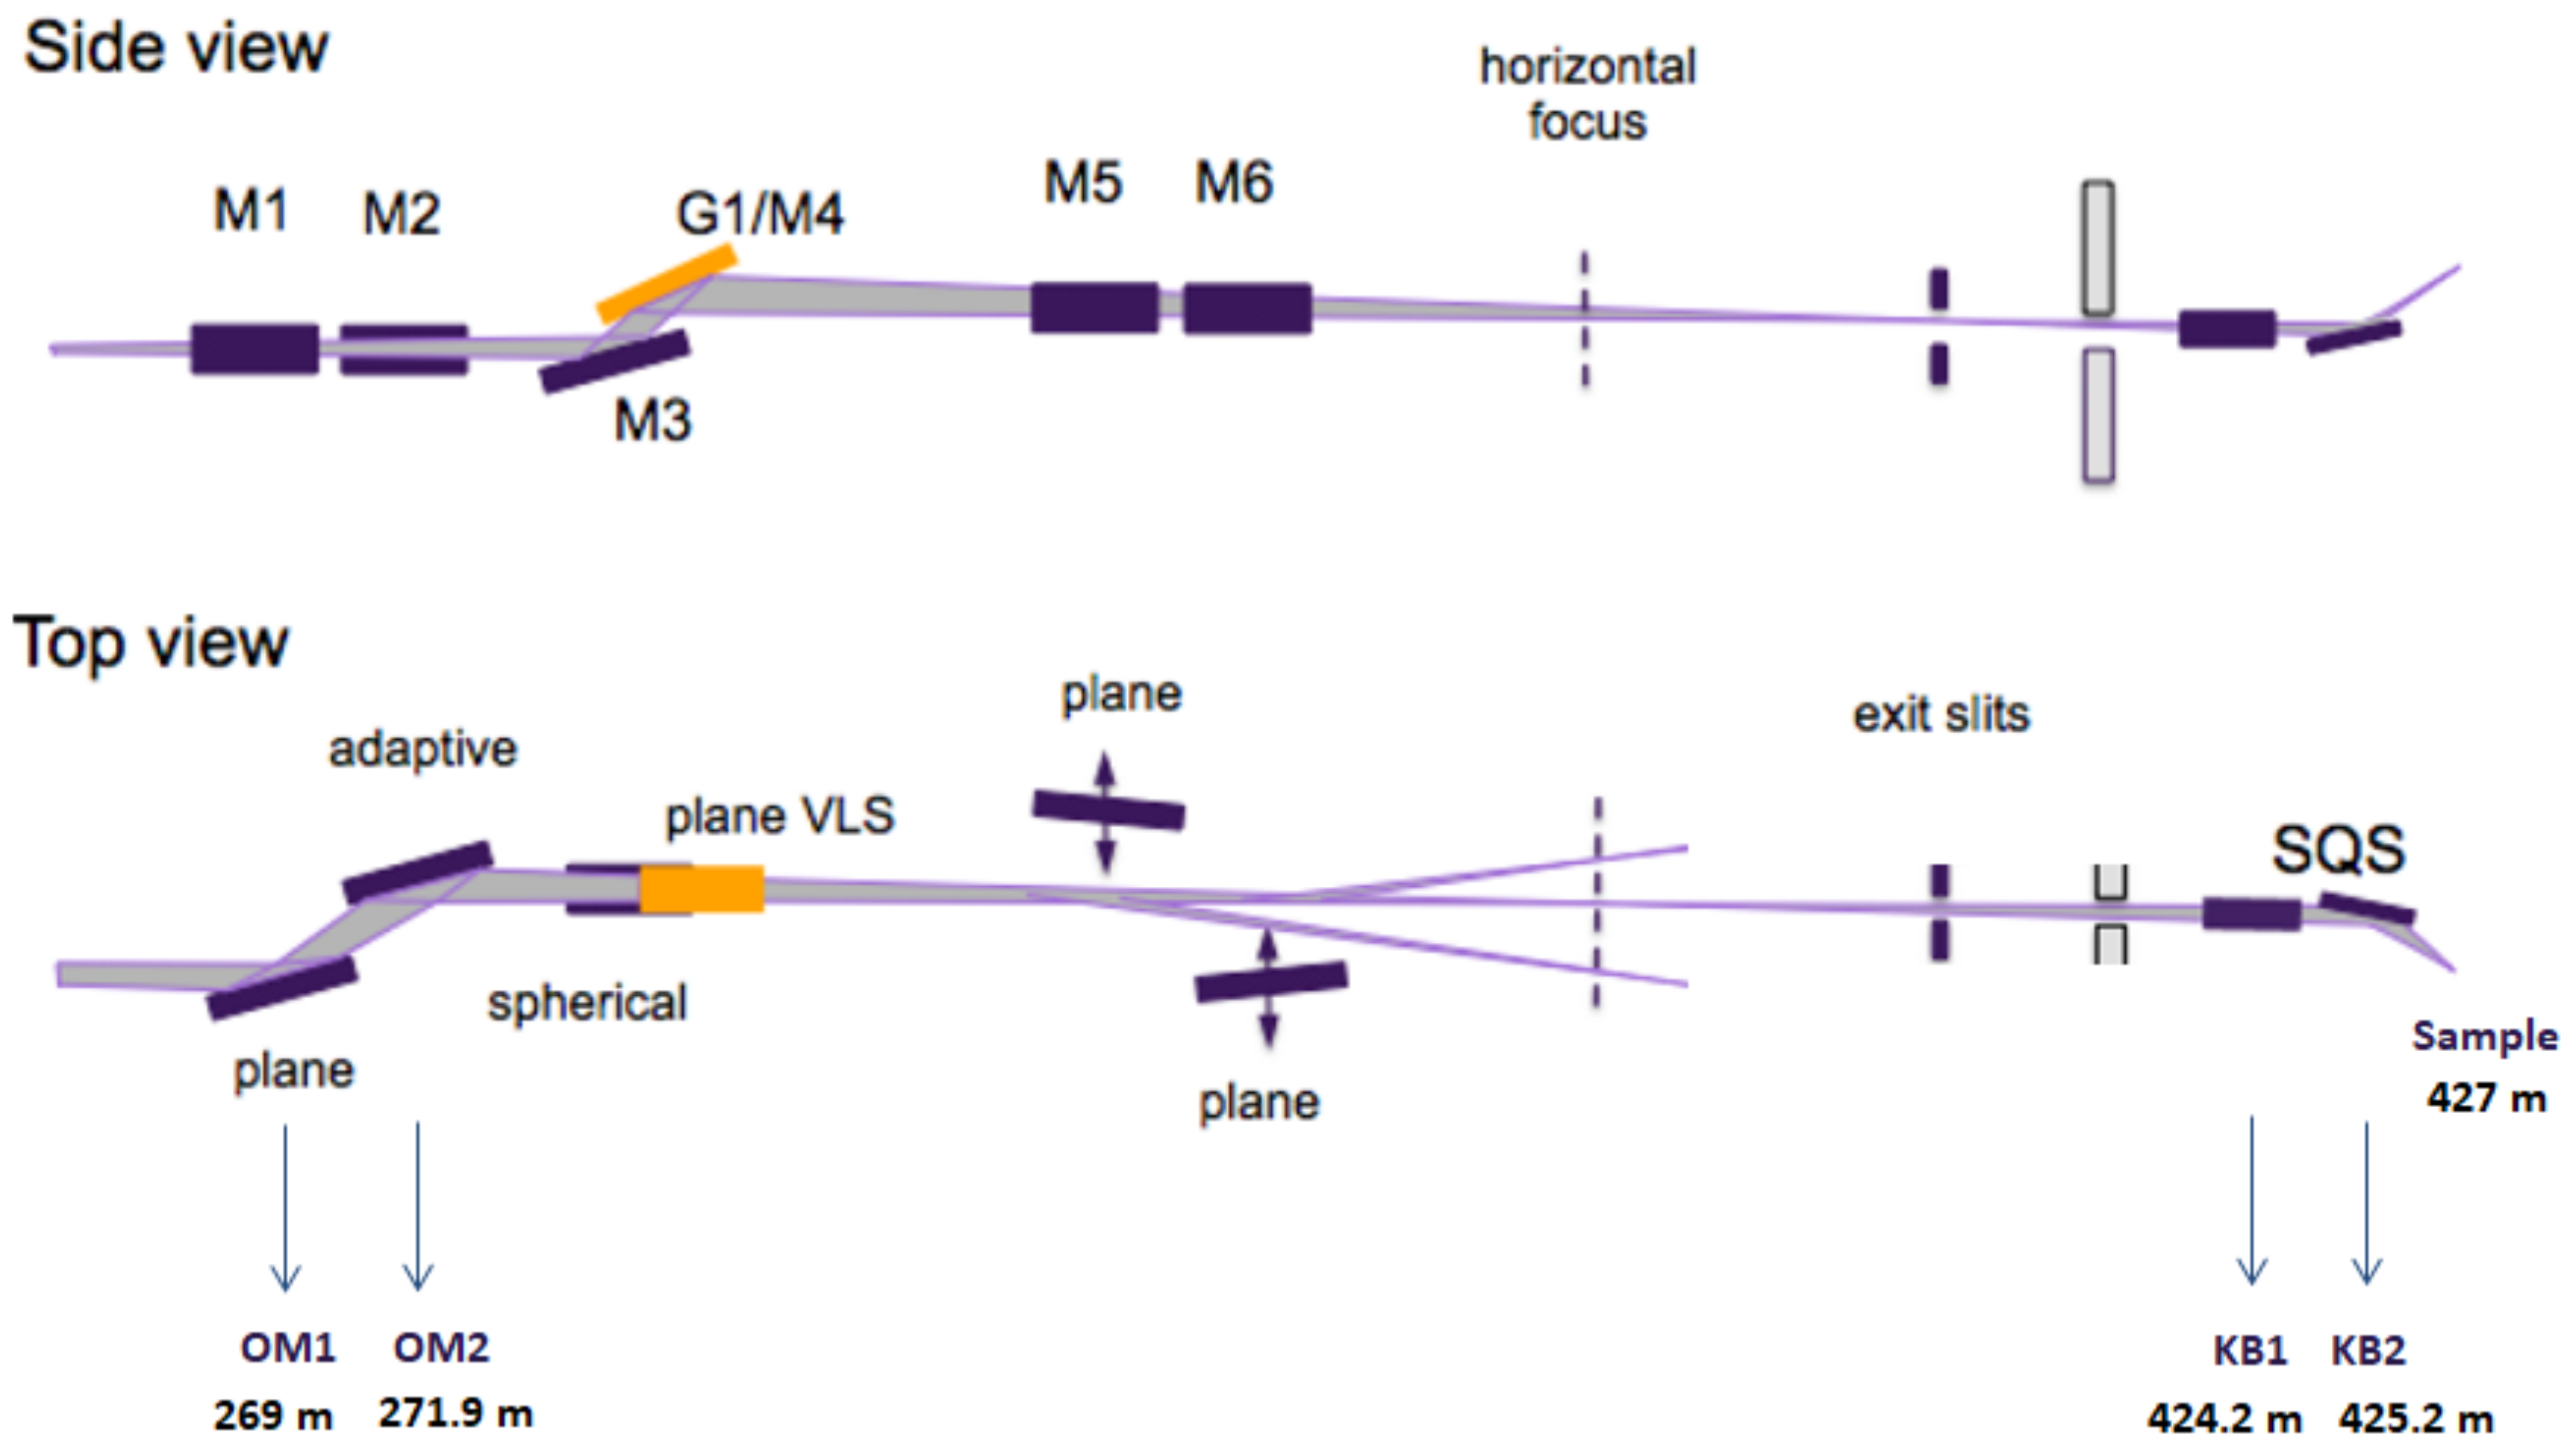
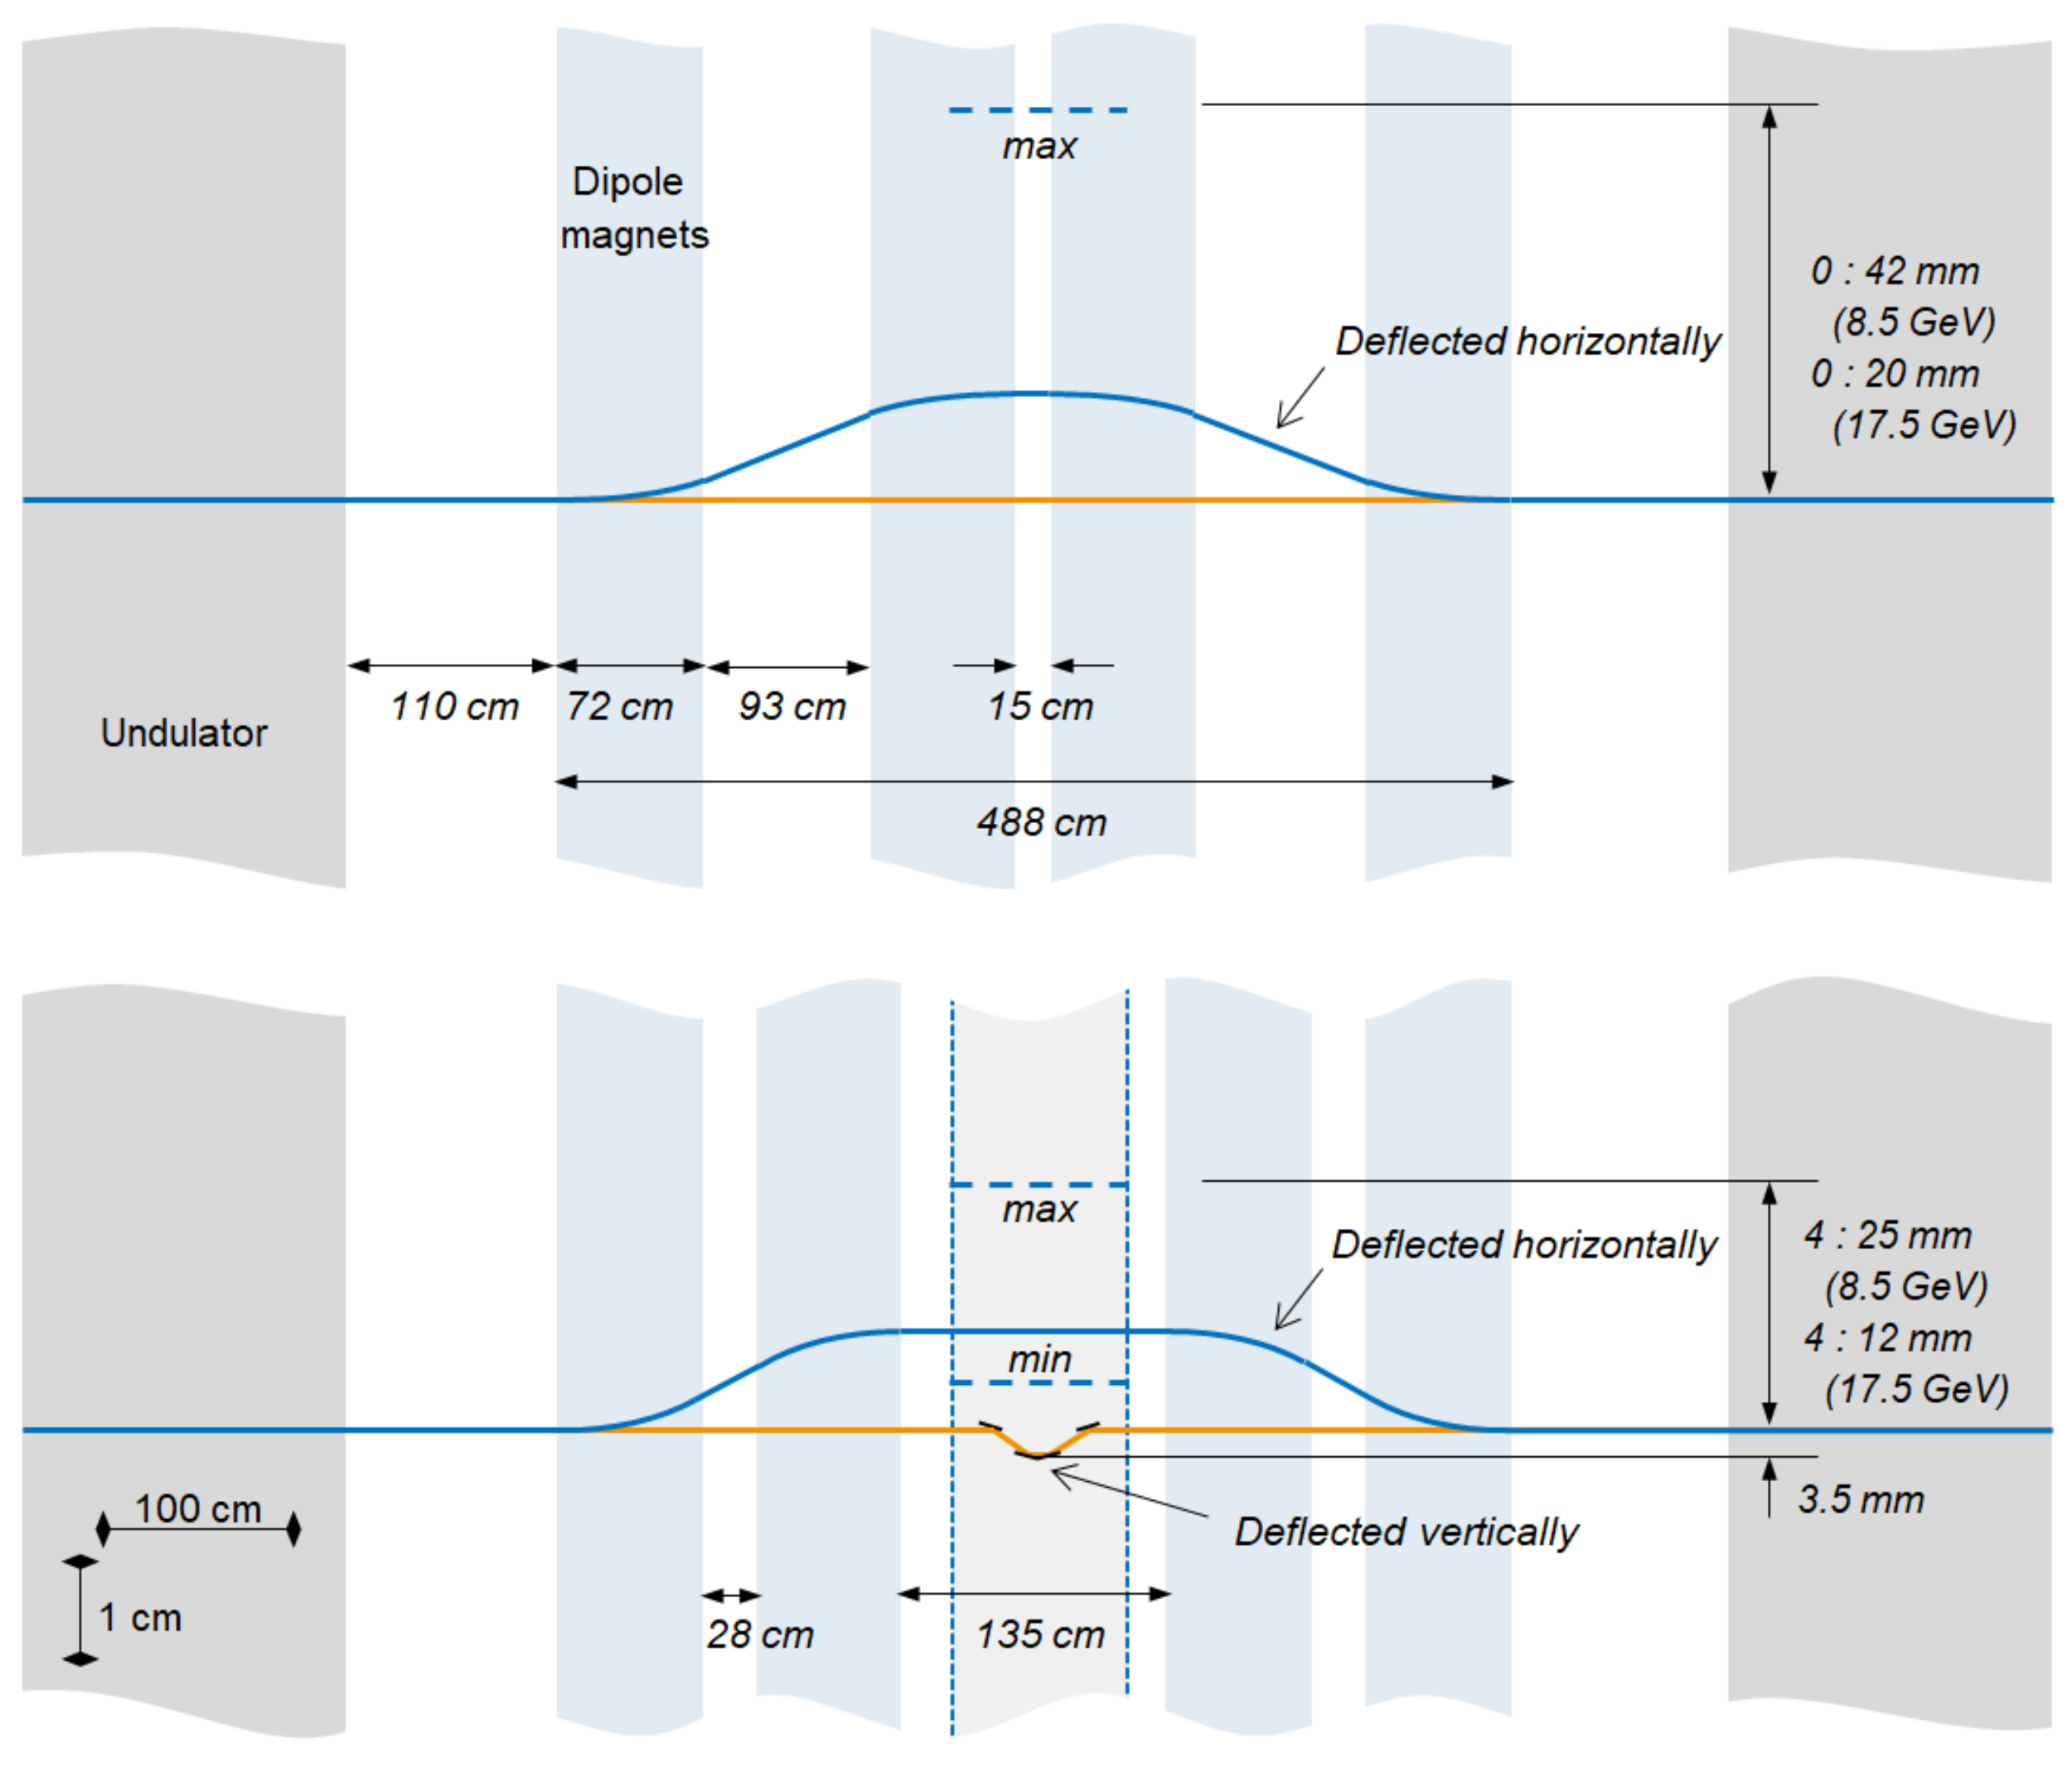
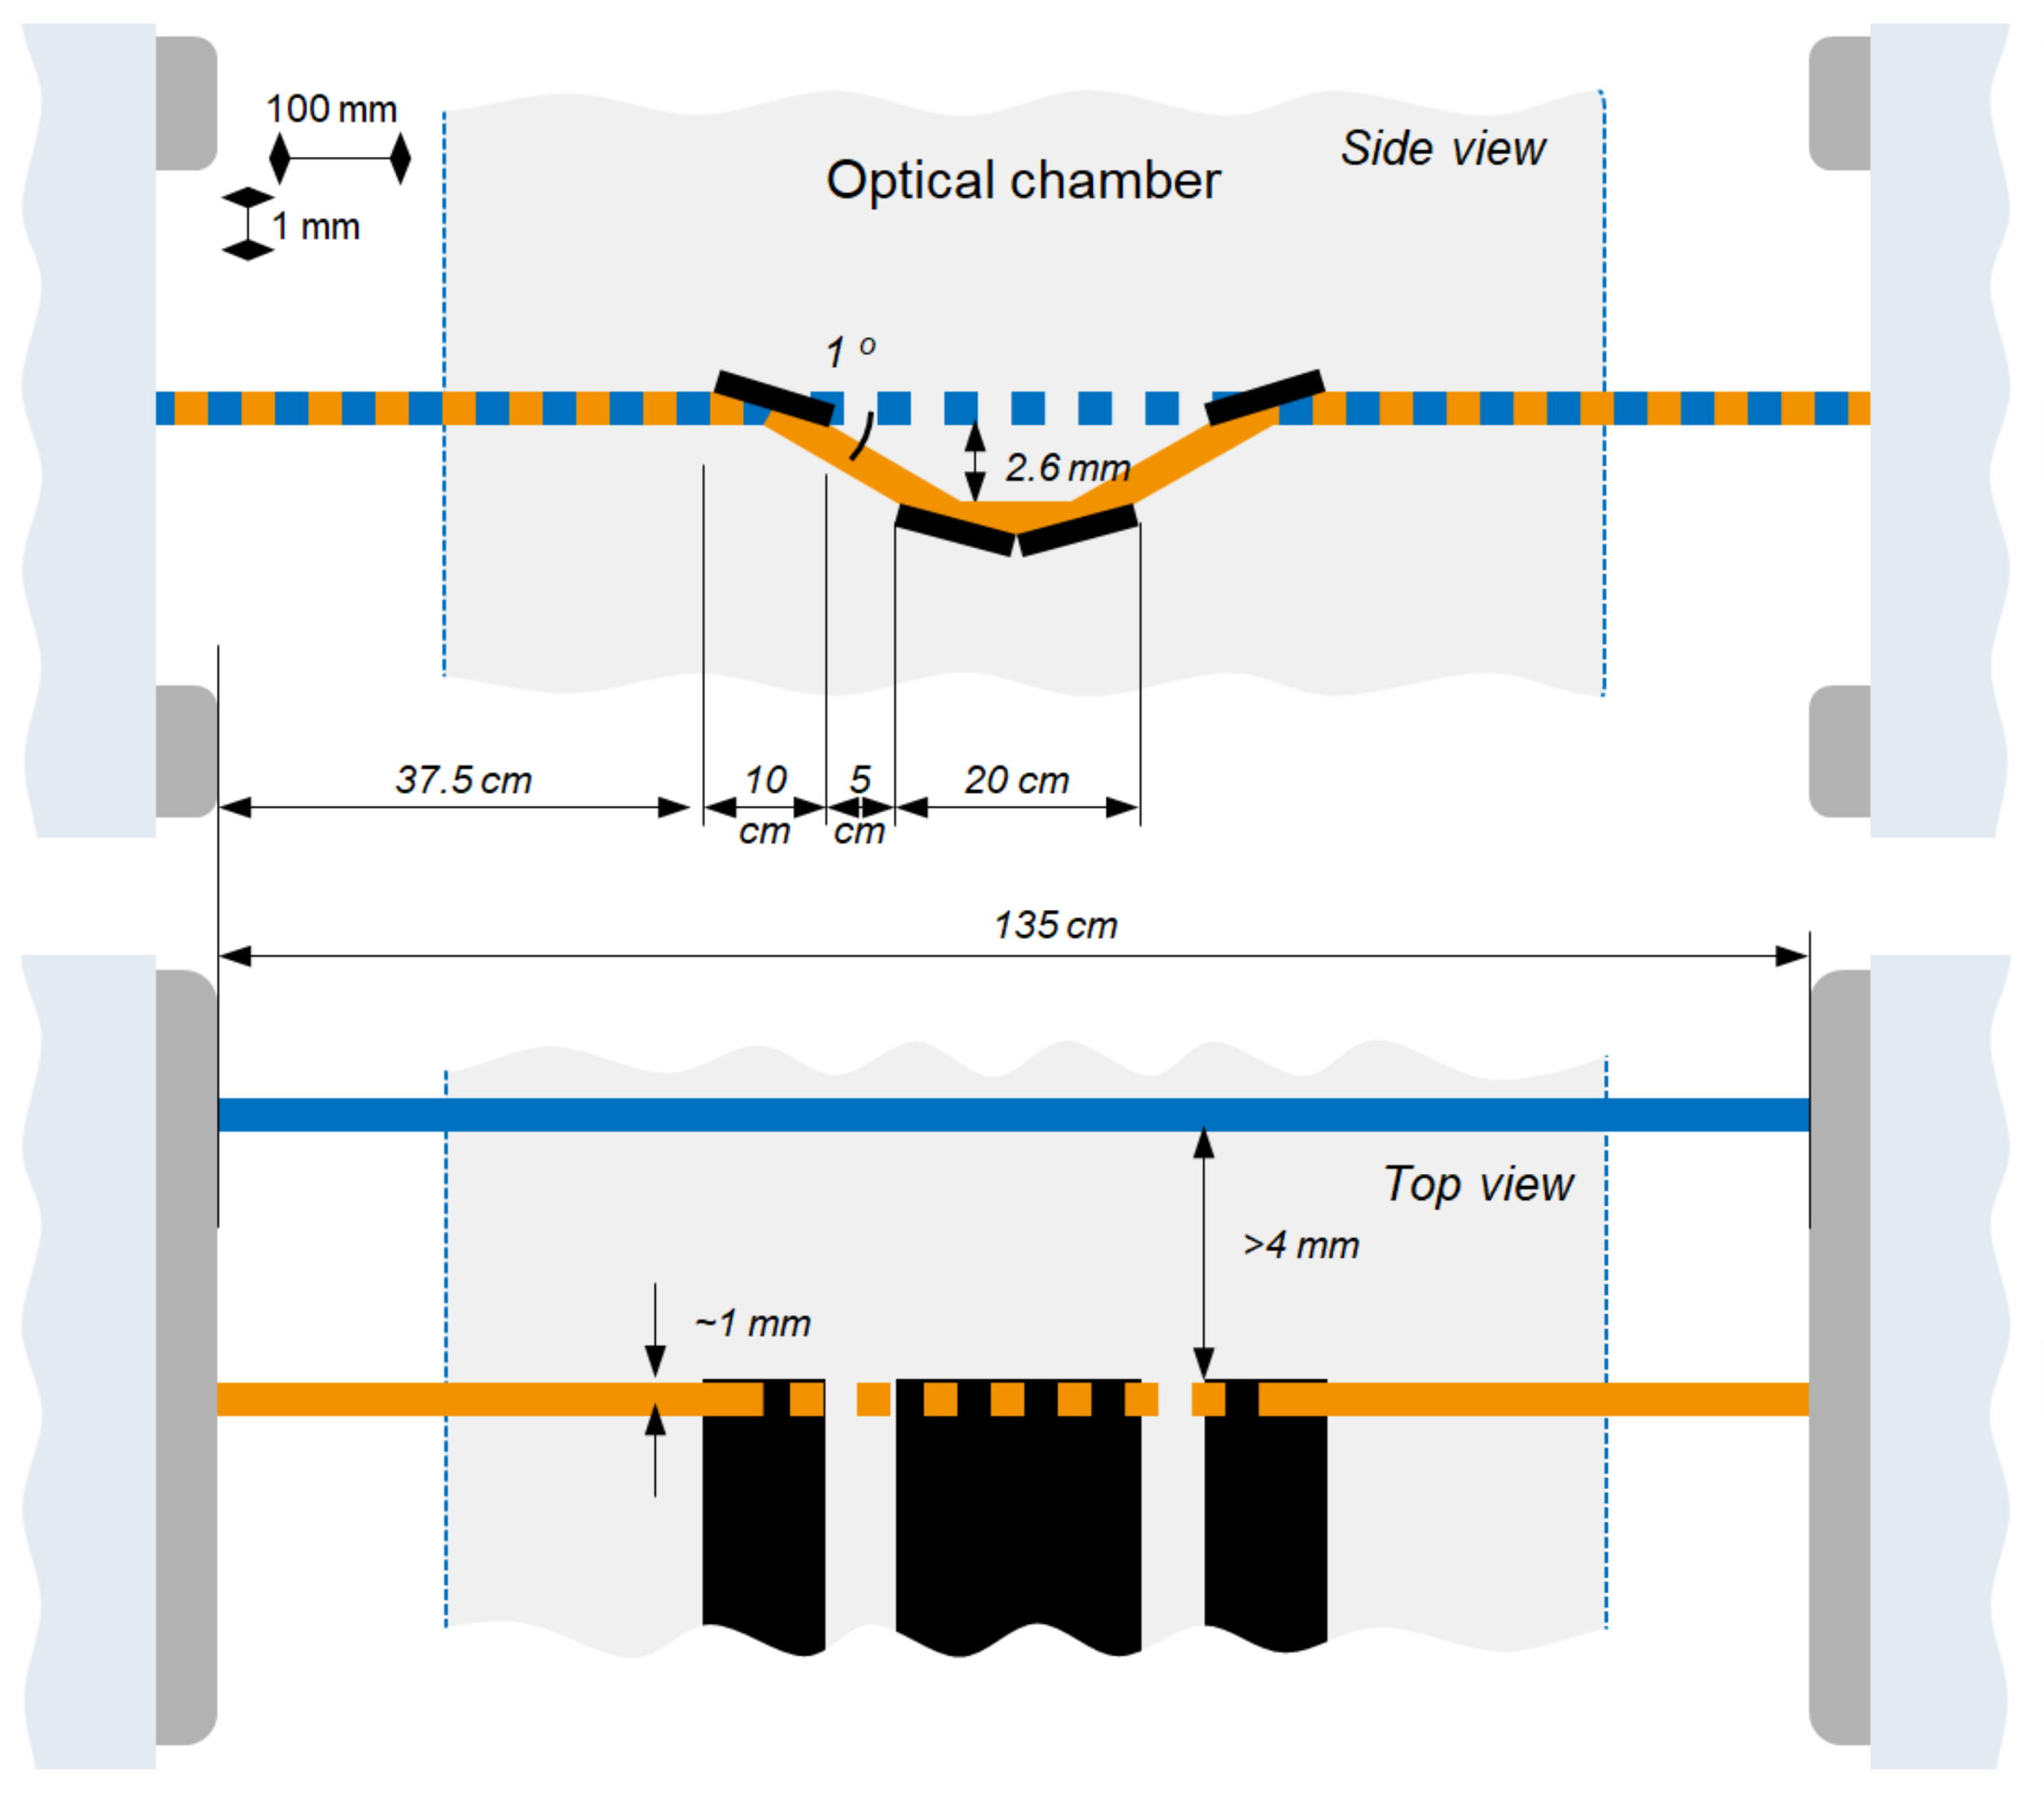
Appendix A. Design Concept

The two-color setup at SASE3 should allow for scanning from negative to positive temporal delays between the two X-ray pulses. As discussed, we proposed to achieve this goal with the introduction of an Optical Delay Line (ODL) or with the exploitation of a fresh-slice technique. Because of this, we consider two symmetrical designs for the magnetic chicane: with and without the ODL, located between second and third dipole magnets, as illustrated on Figure A1. Both designs assume 0.6 m-long magnet yokes with coils extending by 6 cm from each side of the magnets.
Figure A1. Concepts of chicane without (top picture) and with (bottom picture) optical delay line (ODL). Electron beam orbit is depicted with blue lines, radiation path with orange ones.
Applsci 10 02728 g0a1
In case the negative delay is enabled by a fresh-slice technique, the magnetic design with 15 cm separation between the central magnets (Figure A1, top picture) would allow to significantly delay the electron beam, and hence to separate the radiation pulses by up to 3 ps, assuming an electron beam energy of 8.5 GeV and dipole magnetic field of 1.2 T, see Figure A2 (left plot).
Figure A2. Left plot. Delay, introduced to the electron beam by the chicane operating at maximum magnetic field of 1.2 T, calculated for both geometries. The dotted orange line depicts the maximum pulse separation if the ODL is installed (see text). Right plot. The resulting separation of two SASE pulses from U1 and U2 is approximately given by the sum of tunable positive delay introduced to the electron beam in the magnetic chicane and a fixed −152 fs negative delay introduced to the radiation pulse in the ODL. The latter, when introduced to delay the radiation beam, poses limits to the minimum electron beam displacement.
Applsci 10 02728 g0a2
If, instead, the negative delay is obtained by installing a compact ODL, the large distance of 135 cm between the middle dipoles (Figure A1, bottom picture) necessary to accommodate the optical chamber would limit the maximum electron beam delay to about 1.7 ps. The ODL consists of four 10 cm-long mirrors, see Figure A3. The electron beam is deflected horizontally, the radiation vertically. Such design allows to introduce a fixed delay of 152 fs to the U1 radiation. The resulting temporal separation between the two radiation pulses, presented on Figure A2 (right plot) is the sum of the tunable positive electron beam delay and a fixed negative radiation delay.
Figure A3. Concept of optical delay line, located between the second and third dipoles. Electrons are deflected in the horizontal plane, radiation in the vertical plane. For illustration purposes, the mirror thickness is reduced.
Applsci 10 02728 g0a3
When the ODL is introduced, minimal spatial separation between the electron beam and the edges of the mirrors should be respected. An offset from the optical axis of around 5 mm corresponds to 67 fs delay of the electron beam in U2. If we limit ourselves to a minimum distance between the electron beam and the mirror surface of 4 mm (the radiation footprint is located around 1 mm from the mirror edge), then the maximum negative separation of radiation pulses would be 152 + 67 = 85 fs for all electron beam energies. The maximum positive delay is the electron beam retardation with deduced 152 fs of optical delay: 1550 fs at 8.5 GeV and 250 fs at 17.5 GeV, see Figure A2 (left plot).
The cut-off incidence angle of the B4C mirror coating material is 0.6 degrees at 3 keV (maximum nominal photon energy at SASE3). We choose 0.5 degrees incidence angle to maximize the total reflectivity. The latter reaches 80 % at 300 eV and 90 % at 3 keV for 4 mirrors.
The mirror length is chosen to avoid geometrical clipping and related diffraction effects on the radiation at the most divergent photon energy of 250 eV. Given the distance from the radiation source (around the middle of the upstream undulator segment) to the first mirror of around 5.6 m, we can calculate the transverse radiation spot size at the mirror position and the consequent geometrical transmission. The latter exceeds 99% at 250 eV .
Assuming 100 μ J of incidence pulse energy, the estimated radiation dose on the mirror coating does not exceed 0.1 eV/atom for 1 opened cell upstream the chicane at photon energies up to 750 eV and for 2 opened upstream cells—up to 2000 eV.
Further investigation on the actual implementation of the ODL is being conducted.

Appendix B. Time-Of-Flight Photo-Electron Spectrometer

To provide non-invasive shot-to-shot diagnostics of spectrum and intensity of each color in multi-bunch mode, the gas-based Time-Of-Flight (TOF) Photo-Electron Spectrometer (PES) [35] can be used. The PES device consists of 16 eTOF drift-tubes oriented perpendicularly with respect to the X-ray beam. A target gas is injected in the interaction region via an effusive gas-jet. The drift-tubes have been partitioned into four groups (one per quadrant) where the retardation voltages can be set individually to optimize the resolution for different photon energies. With this approach, a subset of the drift-tubes can be optimized for the first color and another subset for the second color, see Figure A4a. Figure A4b shows single pulse TOF spectra with U1 tuned to 950 eV (retardation voltage: −60 V) and U2 tuned to 910 eV (retardation voltage: −20 V). These spectra are only from detectors [E] and [W], respectively, although we have the possibility to add signal from several detectors to improve statistics. Target gas is Neon with a 1 s binding energy of 870.2 eV and a natural line width Γ of 0.24 eV.
Figure A4. (a) 16 eTOF drift-tubes oriented perpendicularly with respect to the X-ray beam. The retardation voltages can be set individually for different subsets of eTOFs to optimize the resolution for different photon energies. (b) Single pulse TOF spectrum registered at detectors [E] and [W] with U1 tuned to 950 eV and U2 tuned to 910 eV respectively. (c) Spectra converted to photon-energy. This data set was collected in single-bunch mode which enables us to compare the spectra with the grating spectrometer for both colors. (d) The average intensity of 500 consecutive pulses which represents the XFEL bandwidth.
Applsci 10 02728 g0a4
For these photon energies, the anisotropy parameter β is 2.0 and the cross-section σ is 2 × 10 1 Mb. Drift-tubes at the horizontal plane are selected to take advantage of the higher yield due to the horizontal polarization of the electromagnetic field and the β value of the Neon 1 s photo-line. The first peak in the spectrum is the prompt from scattered light with a TOF of 0.45 ns, from which we can define our time zero. The peak at around 10 ns is comprised of Ne 2 s , 2 p , and KLL Auger lines. On detector [E], we see the U1 photo-electrons, while the U2 photo-electrons have too low kinetic energy to reach the detector with this retardation voltage. On detector [W], we see the U1 and U2 photo-electrons, but those from U1 have a high kinetic energy which leads to poorer photon-energy resolution. Figure A4c shows the spectra converted from TOF to photon-energy. This data set was collected in single-bunch mode, which enables us to compare the spectra with the grating spectrometer. Indeed, the agreement is good and to some extent, we can even resolve individual SASE spikes. To study the XFEL bandwidth, Figure A4d shows the average intensity of 500 consecutive pulses. From the grating spectra, we find, for U1 and U2, a FWHM of 10.1 eV and 16.7 eV, respectively. The PES spectra give no significant additional line broadening, thus demonstrating that it is a reliable instrument for spectral diagnostics.
For single color operation, absolute intensity measurements are performed by the gas-based X-ray Gas Monitor (XGM) device [36,37]. An intrinsic challenge to the two-color operation mode is that the XGM information can no longer be used. To get around this obstacle, the PES can be calibrated in terms of intensity to the XGM when FEL operates in single color mode. This way, the PES can also play the pulse energy diagnostics role during two-color experiments. Figure A5 shows a contour plot of pulse energy correlation for 500 pulses measured with XGM and PES with U2 tuned to 910 eV. For PES, we used the added intensity of the three detectors for better statistics. We found the Pearson correlation coefficient to be 0.94 from which we estimate a pulse energy error of 7%. The absolute measurement uncertainty of the XGM is 7% to 10% of the measurement value.
Figure A5. Contour plot of pulse energy correlation for 500 pulses measured with XGM and PES with U2 tuned to 910 eV. Bins are 0.1 mJ × 0.1 mJ. We found the correlation coefficient to be 0.94.
Applsci 10 02728 g0a5

References

  1. Kraus, P.M.; Zürch, M.; Cushing, S.K.; Neumark, D.M.; Leone, S.R. The ultrafast X-ray spectroscopic revolution in chemical dynamics. Nat. Rev. Chem. 2018, 2, 82. [Google Scholar] [CrossRef]
  2. Pfeifer, T.; Spielmann, C.; Gerber, G. “Femtosecond X-ray science” reports. Prog. Phys. 2006, 69, 443. [Google Scholar] [CrossRef]
  3. Wuilleumier, F.J.; Meyer, M. Pump–probe experiments in atoms involving laser and synchrotron radiation: An overview. J. Phys. B At. Mol. Opt. Phys. 2006, 39, R425–R477. [Google Scholar] [CrossRef]
  4. Reduzzi, M.; Carpeggiani, P.; Kühn, S.; Calegari, F.; Nisoli, M.; Stagira, S.; Vozzi, C.; Dombi, P.; Kahaly, S.; Tzallas, P.; et al. Advances in high-order harmonic generation sources for time-resolved investigations. J. Electron Spectrosc. Rel. Phenom. 2015, 204, 257. [Google Scholar] [CrossRef] [Green Version]
  5. Ullrich, J.; Rudenko, A.; Moshammer, R. Free-Electron Lasers: New Avenues in Molecular Physics and Photochemistry. Annu. Rev. Phys. Chem. 2012, 63, 635. [Google Scholar] [CrossRef]
  6. Young, L.; Ueda, K.; Gühr, M.; Bucksbaum, P.H.; Simon, M.; Mukamel, S.; Rohringer, N.; Prince, K.C.; Masciovecchio, C.; Meyer, M.; et al. Roadmap of ultrafast X-ray atomic and molecular physics. J. Phys. B At. Mol. Opt. Phys. 2018, 51, 032003. [Google Scholar] [CrossRef]
  7. Ueda, K.; Sokell, E.; Schippers, S.; Aumayr, F.; Sadeghpour, H.; Burgdörfer, J.; Lemell, C.; Tong, X.; Pfeifer, T.; Calegari, F.; et al. Roadmap on photonic, electronic and atomic collision physics I. Light-matter interaction. J. Phys. B At. Mol. Opt. Phys. 2019, 52, 171001. [Google Scholar] [CrossRef]
  8. Prince, K.C.; Allaria, E.; Callegari, C.; Cucini, R.; De Ninno, G.; Di Mitri, S.; Diviacco, B.; Ferrari, E.; Finetti, P.; Gauthier, D.; et al. Coherent control with a short-wavelength Free Electron Laser. Nat. Photonics 2016, 10, 176. [Google Scholar] [CrossRef]
  9. Ferrari, E.; Spezzani, C.; Fortuna, F.; Delaunay, R.; Vidal, F.; Nikolov, I.; Cinquegrana, P.; Diviacco, B.; Gauthier, D.; Penco, G.; et al. Widely tunable two-colour seeded free-electron laser source for resonant-pump resonant-probe magnetic scattering. Nat. Commun. 2016, 7, 10343. [Google Scholar] [CrossRef] [Green Version]
  10. Marinelli, A.; Ratner, D.; Lutman, A.; Turner, J.; Welch, J.; Decker, F.; Loos, H.; Behrens, C.; Gilevich, S.; Miahnahri, A.; et al. High-intensity double-pulse X-ray free-electron laser. Nat. Commun. 2015, 6, 6369. [Google Scholar] [CrossRef] [Green Version]
  11. Hara, T.; Inubushi, Y.; Katayama, T.; Sato, T.; Tanaka, H.; Tanaka, T.; Togashi, T.; Togawa, K.; Tono, K.; Yabashi, M.; et al. Two-colour hard X-ray free-electron laser with wide tunability. Nat. Commun. 2013, 4, 3919. [Google Scholar] [CrossRef] [PubMed] [Green Version]
  12. Tschentscher, T.; Bressler, C.; Grünert, J.; Madsen, A.; Mancuso, A.; Meyer, M.; Scherz, A.; Sinn, H.; Zastrau, U. Photon beam transport and scientific instruments at the European XFEL. Appl. Sci. 2017, 7, 592. [Google Scholar] [CrossRef] [Green Version]
  13. Mazza, T.; Zhang, H.; Meyer, M. Scientific Instrument SQS. Tech. Des. Rep. 2012. [Google Scholar] [CrossRef]
  14. Scherz, A.; Krupin, O.; Buck, J.; Gerasimova, N.; Palmer, G.; Poolton, N.; Samoylova, L. Scientific Instrument Spectroscopy and Coherent Scattering(SCS). Concept. Des. Rep. 2013. [Google Scholar] [CrossRef]
  15. Geloni, G.; Kocharyan, V.; Saldin, E. Scheme for femtosecond-resolution pump–probe experiments at XFELs with two-color ten GW-level X-ray pulses. arXiv 2010, arXiv:1001.3510. [Google Scholar]
  16. Lutman, A.A.; Coffee, R.; Ding, Y.; Huang, Z.; Krzywinski, J.; Maxwell, T.; Messerschmidt, M.; Nuhn, H. Experimental Demonstration of Femtosecond Two-ColorX-ray Free-Electron Lasers. Phys. Rev. Lett. 2013, 110, 134801. [Google Scholar] [CrossRef]
  17. Lutman, A.A.; Maxwell, T.J.; MacArthur, J.P.; Guetg, M.W.; Berrah, N.; Coffee, R.N.; Ding, Y.; Huang, Z.; Marinelli, A.; Moeller, S.; et al. Fresh-slice multicolour X-ray free-electron lasers. Nat. Phot. 2016, 10, 745–750. [Google Scholar] [CrossRef]
  18. Liu, S.; Decking, W.; Kocharyan, V.; Saldin, E.; Serkez, S.; Shayduk, R.; Sinn, H.; Geloni, G. Preparing for high-repetition rate hard X-ray self-seeding at the European X-ray Free Electron Laser: Challenges and opportunities. Phys. Rev. AB 2019, 22, 060704. [Google Scholar] [CrossRef] [Green Version]
  19. Jonauskas, V.; Partanen, L.; Kučas, S.; Karazija, R.; Huttula, M.; Aksela, S.; Aksela, H. Auger cascade satellites following 3d ionization in xenon. J. Phys. B At. Mol. Opt. Phys. 2003, 36, 4403–4416. [Google Scholar] [CrossRef]
  20. Forbes, R.; De Fanis, A.; Bomme, C.; Rolles, D.; Pratt, S.T.; Powis, I.; Besley, N.A.; Simon, M.; Nandi, S.; Milosavljević, A.R.; et al. Photoionization of the iodine 3d, 4s, and 4p orbitals in methyl iodide. J. Chem. Phys. 2018, 149, 144302. [Google Scholar] [CrossRef]
  21. Kivilompolo, M.; Kivimäki, A.; Aksela, H.; Huttula, M.; Aksela, S.; Fink, R.F. The gas phase L2,3VV Auger electron spectra of chlorinein XCl (X = H, D, Li, Na, K) molecules. J. Chem. Phys. 2000, 113, 662–675. [Google Scholar] [CrossRef]
  22. Golubev, N.V.; Kuleff, A.I. Control of charge migration in molecules by ultrashort laser pulses. Phys. Rev. 2015, A91, 051401. [Google Scholar] [CrossRef] [Green Version]
  23. Erk, B.; Boll, R.; Trippel, S.; Anielski, D.; Foucar, L.; Rudek, B.; Epp, S.W.; Coffee, R.; Carron, S.; Schorb, S.; et al. Imaging charge transfer in iodomethane upon X-ray photoabsorption. Science 2014, 345, 288–291. [Google Scholar] [CrossRef] [PubMed]
  24. Li, Z.; El-Amine Madjet, M.; Vendrell, O.; Santra, R. Core-level transient absorption spectroscopy as a probe of electron hole relaxation in photoionized H+(H2O)n. Faraday Discuss. 2014, 171, 457–470. [Google Scholar] [CrossRef] [PubMed]
  25. Abela, R.; Aghababyan, A.; Altarelli, M.; Altucci, C.; Amatuni, G.; Anfinrud, P.; Audebert, P.; Ayvazyan, V.; Baboi, N.; Baehr, J.; et al. XFEL: The European X-ray Free-Electron Laser - Technical Design Report; DESY XFEL Project Group European XFEL Project Team Deutsches Elektronen-Synchrotron Member of the Helmholtz Association: Hamburg, Germany, 2006; ISBN 978-3-935702-17-1. [Google Scholar] [CrossRef]
  26. Brinkmann, R.; Schneidmiller, E.; Yurkov, M. Possible operation of the Euro-pean XFEL with ultra-low emittance beams. Nucl. Instrum. Methods Phys. Res. Sect. A Accel. Spectrom. Detect. Assoc. Equip. 2010, 616, 81–87. [Google Scholar] [CrossRef] [Green Version]
  27. Rossbach, J.; Saldin, E.L.; Schneidmiller, E.A.; Yurkov, M.V. Interdependence of parameters of an X-ray FEL. Nucl. Instrum. Methods Phys. Res. Sect. A Accel. Spectrom. Detect. Assoc. Equip. 1996, 374, 401–407. [Google Scholar] [CrossRef] [Green Version]
  28. Rossbach, J.; Saldin, E.L.; Schneidmiller, E.A.; Yurkov, M.V. Fundamental limitations of an X-ray FEL operation due to quantum fluctuations of undulator radiation. Nucl. Instrum. Methods Phys. Res. Sect. A Accel. Spectrom. Detect. Assoc. Equip. 1997, 393, 152–156. [Google Scholar] [CrossRef]
  29. Zagorodnov, I. DESY MPY Start-to-End Simulations Page. 2014. Available online: http://www.desy.de/fel-beam/s2e/xfel.html (accessed on 15 December 2019).
  30. Reiche, S. GENESIS 1.3: A fully 3-D time dependent FEL simulation code. Nucl. Instrum. Meth. 1999, A429, 243–248. [Google Scholar] [CrossRef]
  31. Ocelot Collaboration Project. Available online: https://github.com/ocelot-collab/ocelot (accessed on 15 December 2019).
  32. Sinn, H.; Dommach, M.; Dong, X.; La Civita, D.; Samoylova, L.; Villanueva, R.; Yang, F. Technical Design Report: X-ray Optics and Beam Transport; European X-ray Free-Electron Laser Facility GmbH: Hamburg, Germany, 2012. [Google Scholar] [CrossRef]
  33. Zagorodnov, I. Beam Manipulation and Diagnostics with Wakefield Structure at the European XFEL. 2017. Available online: http://www.desy.de/xfel-beam/data/talks/files/2018.05.15_08_15_15_02_1_TEMF2018_Zagorodnov.pdf (accessed on 15 December 2019).
  34. Gerasimova, N. Performance of the SASE3 Monochromator equipped with Provisional Short Grating; European X-ray Free-Electron Laser Facility GmbH: Schenefeld, Germany, 2018. [Google Scholar] [CrossRef]
  35. Laksman, J.; Buck, J.; Glaser, L.; Planas, M.; Dietrich, F.; Liu, J.; Maltezopoulos, T.; Scholz, F.; Seltmann, J.; Hartmann, G.; et al. Commissioning of a photoelectron spectrometer for soft X-ray photon diagnostics at European XFEL. J. Synchrotron Rad. 2019, 26, 1010. [Google Scholar] [CrossRef]
  36. Maltezopoulos, T.; Dietrich, F.; Freund, W.; Jastrow, U.F.; Koch, A.; Laksman, J.; Liu, J.; Planas, M.; Sorokin, A.A.; Tiedtke, K.; et al. Operation of X-ray gas monitors at the European XFEL. J. Synchrotron Rad. 2019, 26, 1045. [Google Scholar] [CrossRef] [Green Version]
  37. Sokorin, A.A.; Bican, Y.; Bonfigt, S.; Brachmanski, M.; Braune, M.; Jastrow, U.F.; Gottwald, A.; Kaser, H.; Richter, M.; Tiedtke, K. An X-ray gas monitor detector for free-electron lasers. J. Synchrotron Rad. 2019, 26, 1092. [Google Scholar]
Figure 1. Simplest two-color scheme relying on a single magnetic chicane.
Applsci 10 02728 g001
Figure 2. Solutions to obtain zero-crossing in the temporal delay by implementing an optical delay line (a) or a fresh-slice technique (b).
Applsci 10 02728 g002
Figure 3. Schematic representation of the two-color pump–probe process in molecular IC n H 2 n Cl . The pump pulse with photon energy h ν 1 (630 eV) is ionizing selectively the 3 d shell in the iodine atom. The subsequent electronic relaxation and charge migration is monitored with the probe pulse h ν 2 (250 eV) of variable temporal delay Δ T between both pulses via selective ionization in the 2 p shell of the chlorine atom and the corresponding Auger decay. Typical pulse durations for pump and probe pulses are in the order of 2 fs.
Applsci 10 02728 g003
Figure 4. Schematic representation of the electron spectrum recorded on a IC n H 2 n Cl molecule upon ionization with two pulses at photon energies at 250 eV and 630 eV, the corresponding contributions are marked by striped and full rectangles, respectively. The intensity ratios between the different contributions are not to scale.
Applsci 10 02728 g004
Figure 5. Nominal 20 pC electron beam at the entrance to the SASE3 undulator. (a) current profile (red) and resistive wakefields in the undulator (green); (b) energy (red) and energy spread (green) profiles of the electron bunch; (c) horizontal (red) and vertical (green) normalized emittance as a function of the position inside the bunch; (d) horizontal (red) and vertical (green) betatron function inside the bunch. The head of the bunch is on the right.
Applsci 10 02728 g005
Figure 6. Radiation properties from U1 tuned at the fundamental photon energy of 630 eV: distribution of FEL shots with different energies per pulse (left subfigure), power along the FEL pulses (middle) and their spectra (right). The mean energy per pulse is 50 μ J ( 5 × 10 11 photons) and the mean pulse duration is about 1.5 fs FWHM.
Applsci 10 02728 g006
Figure 7. Radiation properties from U2 tuned at the fundamental photon energy of 250 eV. Notation the same as on Figure 6. The mean energy per pulse is 70 μ J ( 1.7 × 10 12 photons) and the mean pulse duration is about 3.3 fs FWHM.
Applsci 10 02728 g007
Figure 8. Optical elements relevant to SQS and their distances from the end of the SASE3 undulator. Four indicated optical elements are critical for beam transport and were simulated. Reprinted from [32].
Applsci 10 02728 g008
Figure 9. Schematic representation of the focusing conditions for two-color lasing at SASE3. If both KB mirrors are tuned in order to minimize the astigmatism for imaging the virtual source S ¯ , located between sources S 1 and S 2 , then the images at planes I 1 and I 2 , separated by 1.3 mm, suffer from aberration. However this solution allows one to obtain good radiation quality and comparable photon densities at the I ¯ image plane (see lower figure and Figure 10).
Applsci 10 02728 g009
Figure 10. False color representation of radiation intensity distribution of both radiation pulses with different photon energies at various image planes from Figure 9. Peak photon density is provided above the plots. The method of an intermediate source re-imaging would allow one to obtain comparable radiation distribution size as well as the photon flux.
Applsci 10 02728 g010
Figure 11. Simulated radiation and electron beam properties at the end of U2 for the fresh-slice technique. Top subplot: electron beam current (dashed black line) and radiation power (green line). Middle subplot: mean electron beam energy (blue line), energy spread ± σ (area within the dashed red lines) and density modulation factor—bunching—(gray line). Bottom subplot: on-axis radiation spectrum. The head of the beam is located on the right, and emits after the tail with a photon energy of 1980 eV.
Applsci 10 02728 g011
Figure 12. Experimental demonstration of two-color lasing: (a) single shot spectral distribution measured with grating spectrometer (grey line) and average over 3100 consecutive events (black line). The light grey area shows the span of spectral densities in the ensemble; the 835 eV pulses were emitted in U1, and the 805 eV pulses in U2, as indicated with numbers “1” and “2”; (b) integrals under the spectra for both colors over time; (c) positions of the spectra over time; (d) correlation between the two integrals depicted on subfigure (c).
Applsci 10 02728 g012
Figure 13. Single shot spectra measured with grating spectrometer (black line), with PES optimized for 910 eV emitted in U2 (red line) and with PES optimized for 950 eV emitted in U1 (blue line). An average pulse energy was about 600 μ J in each color.
Applsci 10 02728 g013
Table 1. Available photon energies in the SASE3 undulator for different electron beam energies, and corresponding temporal delays between two pulses (see also Figure A2 in Appendix A).
Electron Energy [GeV]Minimum
Photon Energy [eV]
Maximum
Photon Energy [eV]
Maximum Delay [fs]
8.524010803000
1248021601500
1465029301200
17.510203000750
Table 2. Estimated performance of low-charge and fresh-slice methods for generating two-color SASE radiation for three different combinations of photon energies.
Generation Method,
Photon Energies [eV]
420 eV + 280 eV1500 eV + 420 eV2000 eV + 1500 eV
Low charge (20 pC)100 μ J, 1 fs + 10 μ J, 1.5fs5 μ J, 1 fs + 130 μ J, 1.3 fs20 μ J, 1 fs + 6 μ J, 1 fs
Fresh-slice (2 m structure)400 μ J, 15 fs + 250 μ J, 15fs100 μ J, 12 fs + 500 μ J, 12 fs80 μ J, 6 fs + 50 μ J, 10 fs

