1. Introduction
Renewable generation (RG), such as the solar PV (photovoltaic) and wind power, has been widely utilized in the last decades due to the depleted fossil fuels and the environment concerns [
1,
2,
3]. Compared to traditional power plants, renewable generation units are more scalable to be either equipped close to the demand or concentrated into renewable plants. Voltage-sourced converters (VSCs) are commonly equipped for the integration of renewable generation, which provides fast and accurate adjustments on generation profiles [
4,
5]. The solar PV and wind power can be categorized as inverter-based generation (IBG) because inverters are required to regulate their outputs [
6,
7,
8]. According to the BP energy outlook 2018, by 2040, there would be strong growth in the share of renewables, reaching 25% of total energy consumption in an evolving transition scenario [
9,
10]. Therefore, with the increasing penetration of renewable generation and the consequent displacement of traditional synchronous generators (SGs), the current power system has been undergoing an intrinsic transition toward converter-dominated grids.
However, the fast power electronic interfaces (PEIs) (which are tens or hundreds of times faster than system frequency) also incur problems as they have almost no inertia. The overall inertia is an important indicator to evaluate system strength. On the one hand, when frequency events happen, inertia response (IR) could slow down the change of the range of frequency (ROCOF). On the other hand, it buys time for the activation of the primary frequency response (PFR, which kicks in when the frequency deviation crosses a preset deadband) and mitigates the nadir [
11]. In the meantime, the parallel operation involving SGs and the PEI-based RG could cause unstable operation because their responses activate at very different paces. Moreover, for the paralleled RG units, autonomous operation and proportional load share are also hard to achieve [
12,
13,
14,
15,
16,
17].
The critical problem for high-penetration IBG integration is caused by its incompatible characteristics with the synchronous machines. In other words, the IBG units could not provide IR and PFR jointly and collaboratively with the SGs. As the current power system is still dominated by the synchronous machines, it is desired to make the IBG compatible in current power systems. Under this background, the concept of the virtual synchronous generator (VSG) is proposed [
18,
19,
20,
21,
22,
23,
24]. The VSG concept is to modify the highly programmable supplementary controllers of the VSC interfaces and mimic the external characteristics of the traditional SGs [
18]. By the VSG control, the emulation of IR and PFR can be implemented [
18,
19,
20,
21,
22,
23,
24].
However, as one of the major advantages for power converters is its ability of fast response, the fixed inertia property may limit the response time and flexibility. So, there is a tradeoff between fast response and frequency stability [
22,
25,
26]. As the parameters of PEIs are tunable rather than predominated by physical equipment, VSG-IBG units could also alter their external properties for advanced performances. Continuous changes and the step change of virtual inertia parameters are designed to minimize the frequency deviation and energy support [
27,
28,
29]. However, the parameter settings are straightforward but arbitrary. In [
30], quantitative performance analysis is presented for the inertia response provided by the capacitors in the DC links. From its results, the designs for capacitance and DC voltage are completed. However, the capacitors can only provide short-term inertia response. As the frequency response involves two stages, including the inertial response and the primary frequency response, then the virtual inertia constant, virtual speed droop, and the load disturbances should be considered.
In this paper, an adaptive method of parameter tuning for VSG-based VSCs providing both inertia response (IR) and PFR for counteracting the load disturbances is presented based on quantitative performance analysis. The contributions of this work could be summarized as follows:
(1) The analysis of frequency response dynamics, based on the simplification of the transfer function down to the second-order form, is conducted. Performance indices are proposed, and the frequency responses influenced by different parameters are analyzed.
(2) It is noted that the performance indices are influenced by composite parameters, but the hierarchical stages of IR and PFR operate in chronological order. Therefore, a parameter tuning algorithm is designed in which the parameters are also determined following a chronological sequence.
(3) The adaptive parameter tuning approach is verified when load disturbances in different magnitudes happen. The proposed parameter approach could be used to enhance the flexibility and response time as well as maintain the required frequency stability.
The rest of the paper is organized as follows:
Section 2 presents the VSG algorithm to perform frequency response.
Section 3 analyzes the parameter influence. Through analyzing the composite influence on system performances by different parameters,
Section 4 proposes a parameter tuning algorithm by consideration of the time sequence of performance indices in the multiple frequency control stages.
Section 5 verifies the proposed algorithm by simulation.
2. Implementation of VSG Algorithm to Emulate Frequency Control
The system frequency indicates the overall power balance between the generation and the demand at any instantaneous time. In the traditional SG-dominated power system, the active power-frequency control is a series of multiple temporal stages. The stage of IR is naturally provided by all SGs from the direct coupling between mechanical and electrical parts. The stage of PFR is spontaneously provided by the SGs with headroom from the turbine-speed governor systems [
31]. The properties of IR and PFR are summarized in
Table 1.
For the PEI-based IBG, the external characteristics are largely determined by the supplementary controller. In inchoate studies, among the VSG implementations in different orders, the simplest second-order model is with better stability in transients [
32] and can be combined with virtually any VSC control strategies based on the conventional cascade structure [
33]. By the modification of the supplementary controller, the VSG algorithm enables the PEIs to function in the same way as SGs with the ability to perform IR and PFR.
The inertia response of the SGs is instantaneous without prerequisite measurements. For traditional SGs, the inertia is provided by the kinetic energy stored in the rotation equipment. The inertia constant HSG indicates the inertia property, which can be expressed as
where
J is the moment of inertia,
is the angular speed of the rotor, and
VAbase is the rated power. Similar to
HSG, the virtual inertia constant
Hvir of PEIs can be expressed as the ratio of the provided energy to the rated power
where
Jvir is the virtual moment of inertia and
is the virtual angular speed. The inertia response follows Newton’s law of motion, which can be expressed as the swing equation
where
M = 2
Hvir,
D is the damping coefficient of the load,
Pm and
Pe are the virtual mechanical and electrical power, and
is the virtual angular speed. When the swing equation is represented by the inertia constant, all the parameters are per-unit values.
The PFR of SGs is provided by the turbine–governor system. In per-unit value, the droop property is
where
R is the speed droop,
Y is the valve position, and
TG is the time constant of the speed governor. For a typical steam turbine,
TCH is the time constant of main inlet volumes and steam chest;
TRH is the time constant of the reheater; and
FHP is the fraction of the total turbine power generated by high-pressure (HP) sections. The control structure of the active power-frequency loop is shown in
Figure 1.
The IR and PFR provided by VSG-PEIs is shown in
Figure 2. The inertia and primary frequency response are autonomously delivered to stabilize the system frequency after load disturbances. The key performance indices involve the magnitude of ROCOF, the frequency nadir, the settling time, and the settling frequency.
3. Simplification and Performance Analysis
The emulation of IR and PFR is derived from the mechanism imitation of the swing equation and the speed governor. The effect of the closed-loop transfer function of the VSI based on the cascade control structure is assumed to be fast and accurate. The high-order transfer function of IR and PFR can be simplified by the dominant poles and zeros according to control theory. By the inverse Laplace transformation, the performance indices of the dynamic responses in the time domain can be deduced.
As the frequency is a common factor, when there is a load change, it is reflected instantaneously throughout the whole system by a change in frequency. For a step change of demand
, the transfer function from
to the virtual angular speed of rotor
is
where
s is the Laplace operator.
For traditional SGs, the typical parameters are shown in
Table 2.
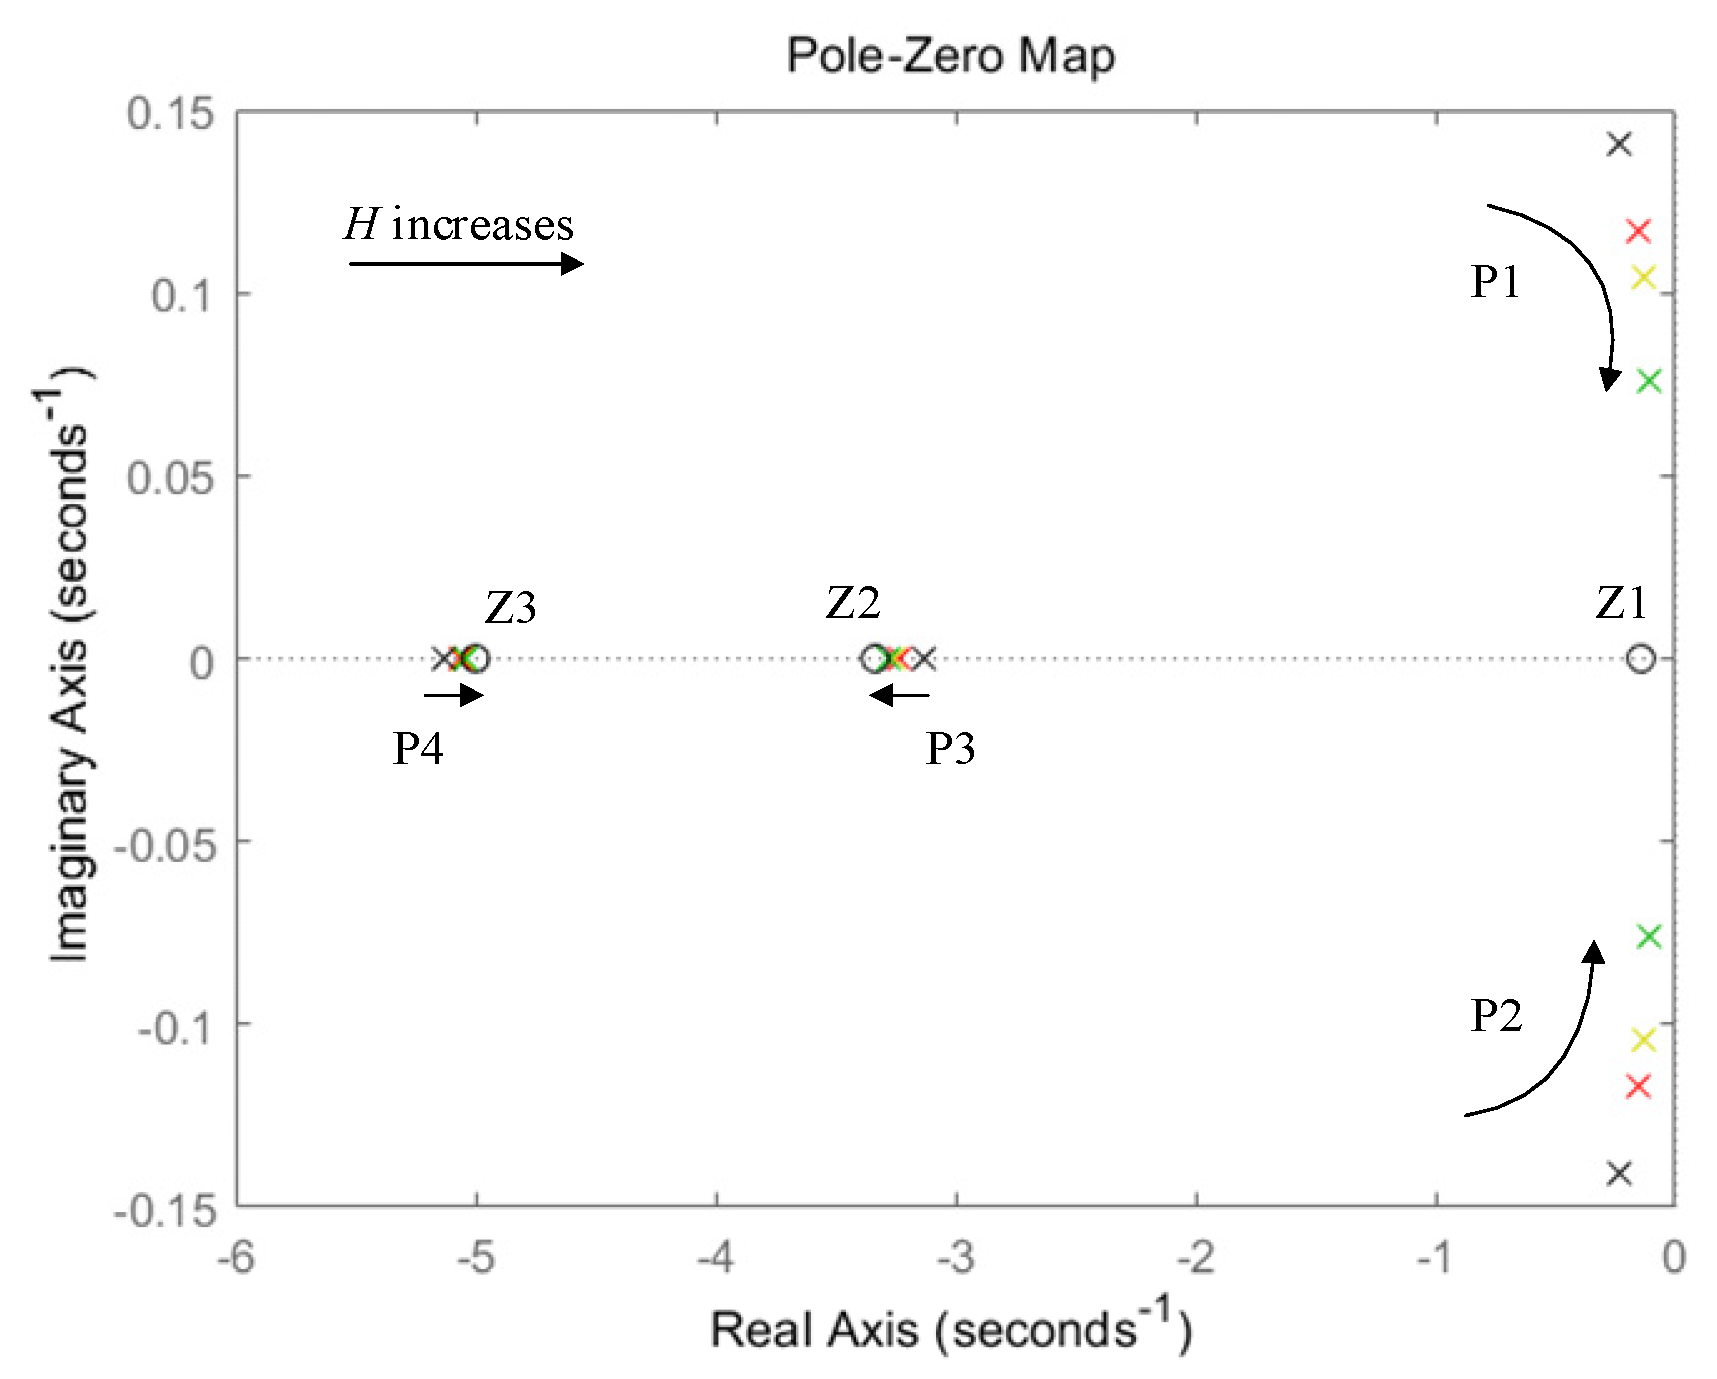
The pole-zero map of the transfer function is shown in
Figure 3.
From the transfer function
G(
s), the zeros are fixed on the real axis. With the increasing of H, the poles P3 and P4 tend to approach the zeros Z2 and Z3. As P3 and P4 are fast poles and very close to Z2 and Z3, the dynamic responses are determined by the dominant zeros Z1 and the slow poles P1 and P2 [
34].
Simplifying the system by Z1, P1, and P2, the system transfer function is
where
and
are the undamped natural frequency and damping ratio,
When the system is subjected to a step increase in demand,
By taking the inverse Laplace transformation, the dynamic response of the frequency deviation in the time domain is
where
Assuming the original state of the system frequency is 1.0 pu, the dynamic response of the system frequency is
From Equation (11), system performance indices during IR and PFR can be derived. First, the rate of change of frequency (ROCOF) is
Further, when
t = 0, ROCOF reaches its maximum value, which can be expressed as
the peak time
tpeak, or the time when the frequency reaches a nadir, can be expressed as
Substituting Equation (14) for Equation (11), then the peak frequency
fpeak, or the frequency nadir, is
and the quasi-steady-state frequency
fss is
The settling time
ts can be defined as the dynamic response entering the 2% quasi-steady-state error band,
Then, the settling time can be expressed as
From the expressions of the deduced indices, the performance of IR and PFR provided by VSG-PEIs is determined by three parameters: the inertia constant H, the speed droop
R, and the step change of load
. The performance properties affected by a single parameter are shown in
Figure 4,
Figure 5 and
Figure 6.
Figure 4 shows the influences of the inertia constant
H to the performance indices. In
Figure 4,
H increases from 3 to 100. The load change is set to be 0.03 pu, and the parameters of
R and
D remain constant.
From
Figure 4a,b, the increasing in inertia constant
H leads to the decreased magnitude of the ROCOF and the nadir. However, the increasing
H would extend the duration of the dynamic response and slow down the later frequency control stages, as shown in
Figure 4d. Therefore, there is a tradeoff for the determination of
H. From
Figure 4c, the settling frequency is irrelative to
H.
Figure 5 shows the influence of the speed droop
R to the performance indices. In
Figure 3 and
Figure 4, R increases from 0.03 to 0.07. The load change is set to be 0.03 pu, and the parameters of
H and
D remain constant.
From
Figure 5a, percentage
R does not influence the magnitude of the ROCOF. From
Figure 5b, the nadir gets worse as
R increases. From
Figure 5d, the changes in percentage
R do not alter the settling time very much. From
Figure 5c, the increase of
R would decrease the settling frequency, since the speed droop
R indicates the amount of power supported for a specific frequency deviation, and the lower
R indicates more supportive power to stabilize the frequency. Therefore, PFR would further suppress the ROCOF and improve the frequency nadir.
Figure 6 shows the influence of load deviation
on the performance indices. In
Figure 3 and
Figure 5,
increases from 0 to 0.06 (pu), while the parameters of
H,
R, and
D remain constant.
From
Figure 6a–c, with the increasing of load deviation, the magnitude ROCOF, the peak frequency, and the settling frequency gets worse. From
Figure 6d, the load deviation does not influence the settling time.
4. Composite Performance Analysis and Adaptive Performance Tuning
From the expressions and properties before, in the process of IR and PFR, the performance is determined by composite influences by different parameters, including the inertia constant H and the speed droop R, as well as the load deviation .
In order to analyze the composite influences, four key performance indices (the magnitude of ROCOF, the frequency nadir, the settling frequency, and the settling time) are chosen.
Figure 7,
Figure 8,
Figure 9 and
Figure 10 show the relations between the performance indices and the varying parameters. The range selections are set as follows:
H varies from 3 to 10,
R varies from 0.03 to 0.08, and the step increase of load varies from 0 to 0.06.
4.1. Composite Parameter Influences on Performance Indices
Figure 7 shows the composite influences on the magnitude of the ROCOF. In
Figure 7a, the inertia constant and the load deviation vary while the speed droop remains constant. In
Figure 7b, the speed droop and the load deviation vary while the inertia constant remains constant. It shows that the ROCOF is determined by the inertia constant
H and the load deviation
.
Figure 8 shows the composite influences on the peak frequency. In
Figure 8a, the inertia constant and the load deviation vary while the speed droop remains constant. In
Figure 8b, the speed droop and the load deviation vary while the inertia constant remains constant. It shows that the peak frequency is determined by all these three parameters.
Figure 9 shows the composite influences on the settling frequency. In
Figure 9a, the inertia constant and the load deviation vary while the speed droop remains constant. In
Figure 9b, the speed droop and the load deviation vary while the inertia constant remains constant. It shows that the settling frequency is determined by the speed droop
R and the load deviation
.
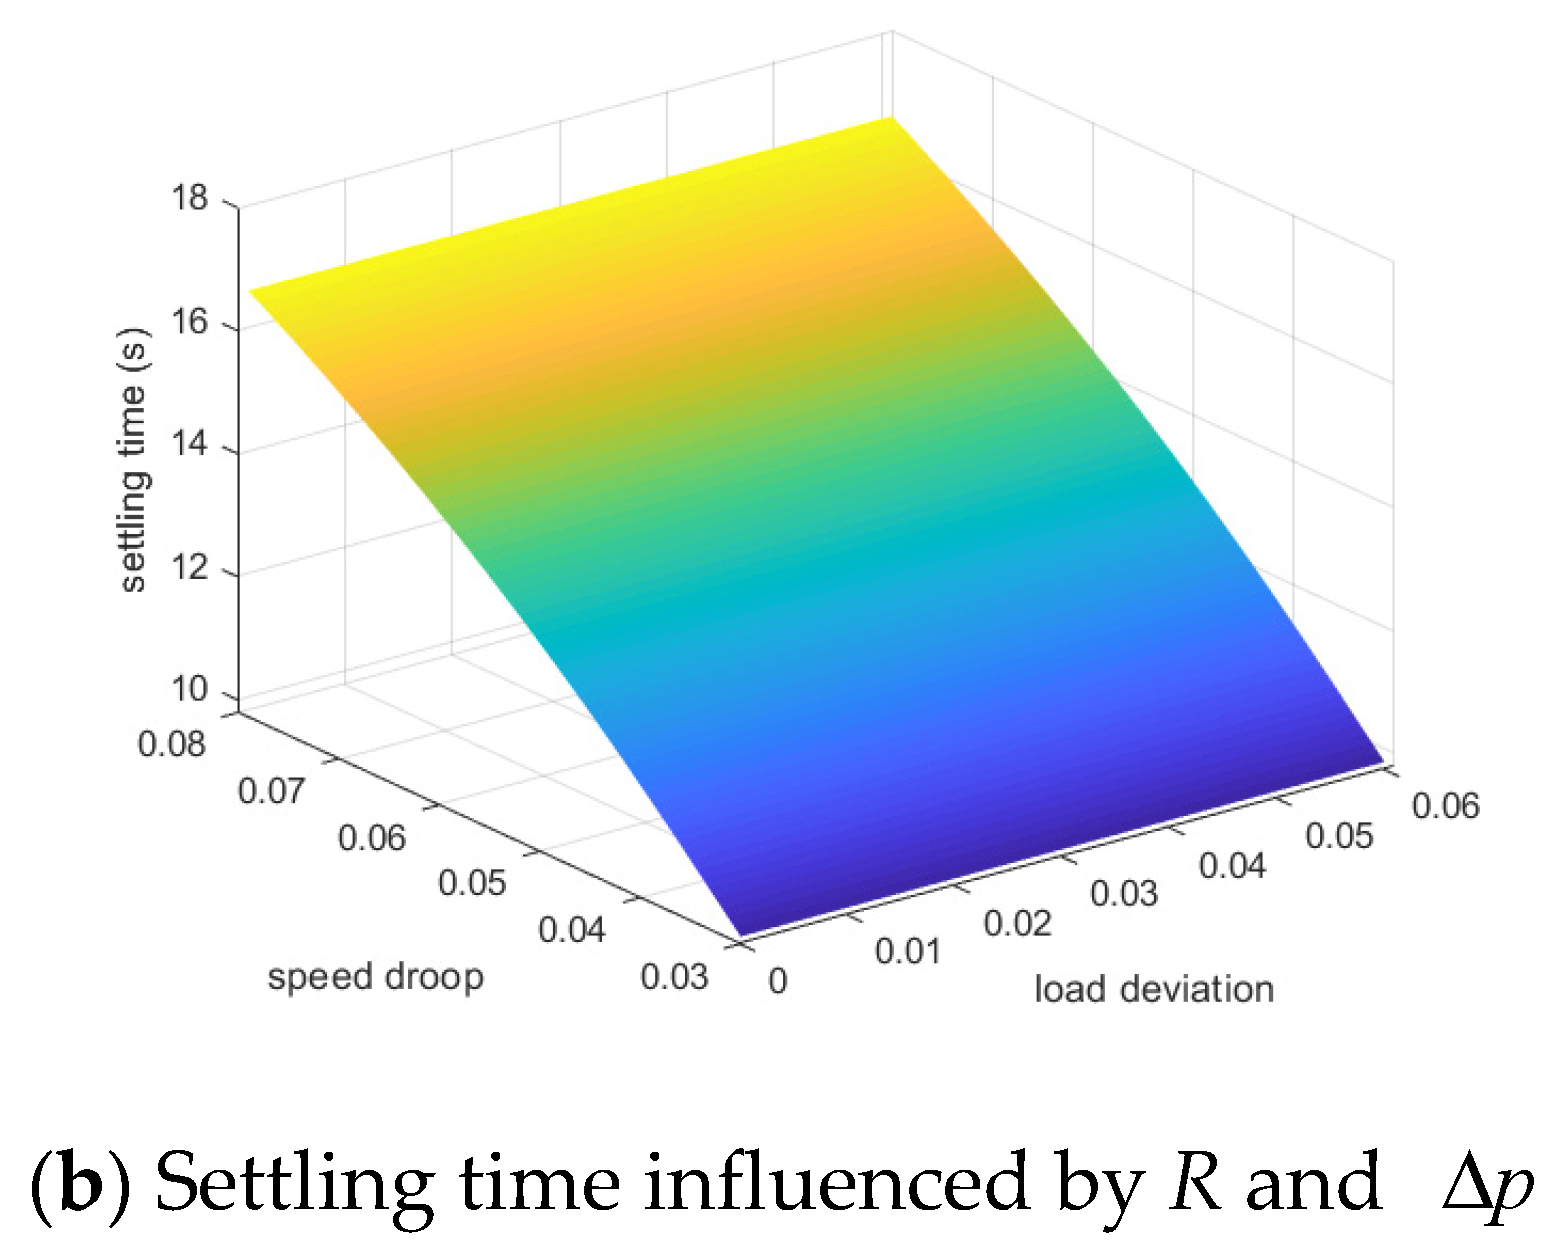
Figure 10 shows the composite influences on the settling time. In
Figure 10a, the inertia constant and the load deviation vary while the speed droop remains constant. In
Figure 10b, the speed droop and the load deviation vary while the inertia constant remains constant. It shows that the settling time is determined by the speed droop
R and the inertia constant
H.
4.2. Supported Energy and Power during IR and PFR
In the process of IR, the kinetic energy stored in the rotating equipment of SGs is provided to suppress the ROCOF. Correspondingly, when IBG provides IR, kinetic energy (such as rotating blades in wind turbines) or virtual kinetic energy (such as the spare generation availability, the electrostatic energy in capacitors, or the storage energy) is provided. The provided energy by the VSG-PEI can be expressed as
where
and
are virtual angular speed and its initial value,
Jvir is the virtual moment of inertia. From Equation (19), the provided energy is related to the inertia constant
Hvir and the frequency.
For an IBG unit with a VA base of 15,000 watts, under different inertia constants, the provided energy is shown in
Figure 11 (R = 0.05, D = 1,
= 0.03). From
Figure 11, the IBG with larger virtual inertia constant provides more energy during the frequency response. This is because the IR activates instantaneously and faster than the activation of the PFR. Therefore, there is a tradeoff in the design of
H. Although the larger
H indicates better nadir and settling frequency, it requires more energy from the PEIs.
From the previous sections, the virtual moment of inertia
Jvir is determined by the inertia constant
H. In steady state, the settling frequency is determined by the speed droop
R (when
D and
are considered as constants). Therefore, the provided energy at the settling time varies according to the
H and
R settlings, as shown in
Figure 12. From
Figure 12, the supported energy increases with the increase of
H and
R.
In steady state, the provided power in the PFR loop can be expressed as
where
is the PFR power and
is the step deviation of the load. From the expression, there is also a tradeoff between the speed droop
R and the frequency deviation. In parallel operation with other PFR players, the speed droop
R is inversely proportional to the supportive power. In a stand-alone scenario, the smaller speed droop
R can improve the settling frequency, but it requires a little more power.
It is noted that the supportive kinetic energy from traditional SGs is from and recharged by the primary energy input. The primary energy sources for the SGs (such as coal, nuclear) are abundant and persistent. However, the primary input for renewable generation is stochastic and fluctuant. The stored energy in capacitors or batteries can only provide frequency responses in a limited time-span, and after the responses, their operation status needs to be restored for self-stability. In the view of time, the IR and its support energy are short-term, while the PFR and its support power are long-term. Under a specific grid code, the provided energy and power from PEIs should be designed to be as low as possible to avoid the oversized headroom and financial costs. Consequently, the desired H and R should be set as the lowest values in their satisfying ranges.
4.3. Adaptive Parameter Tuning
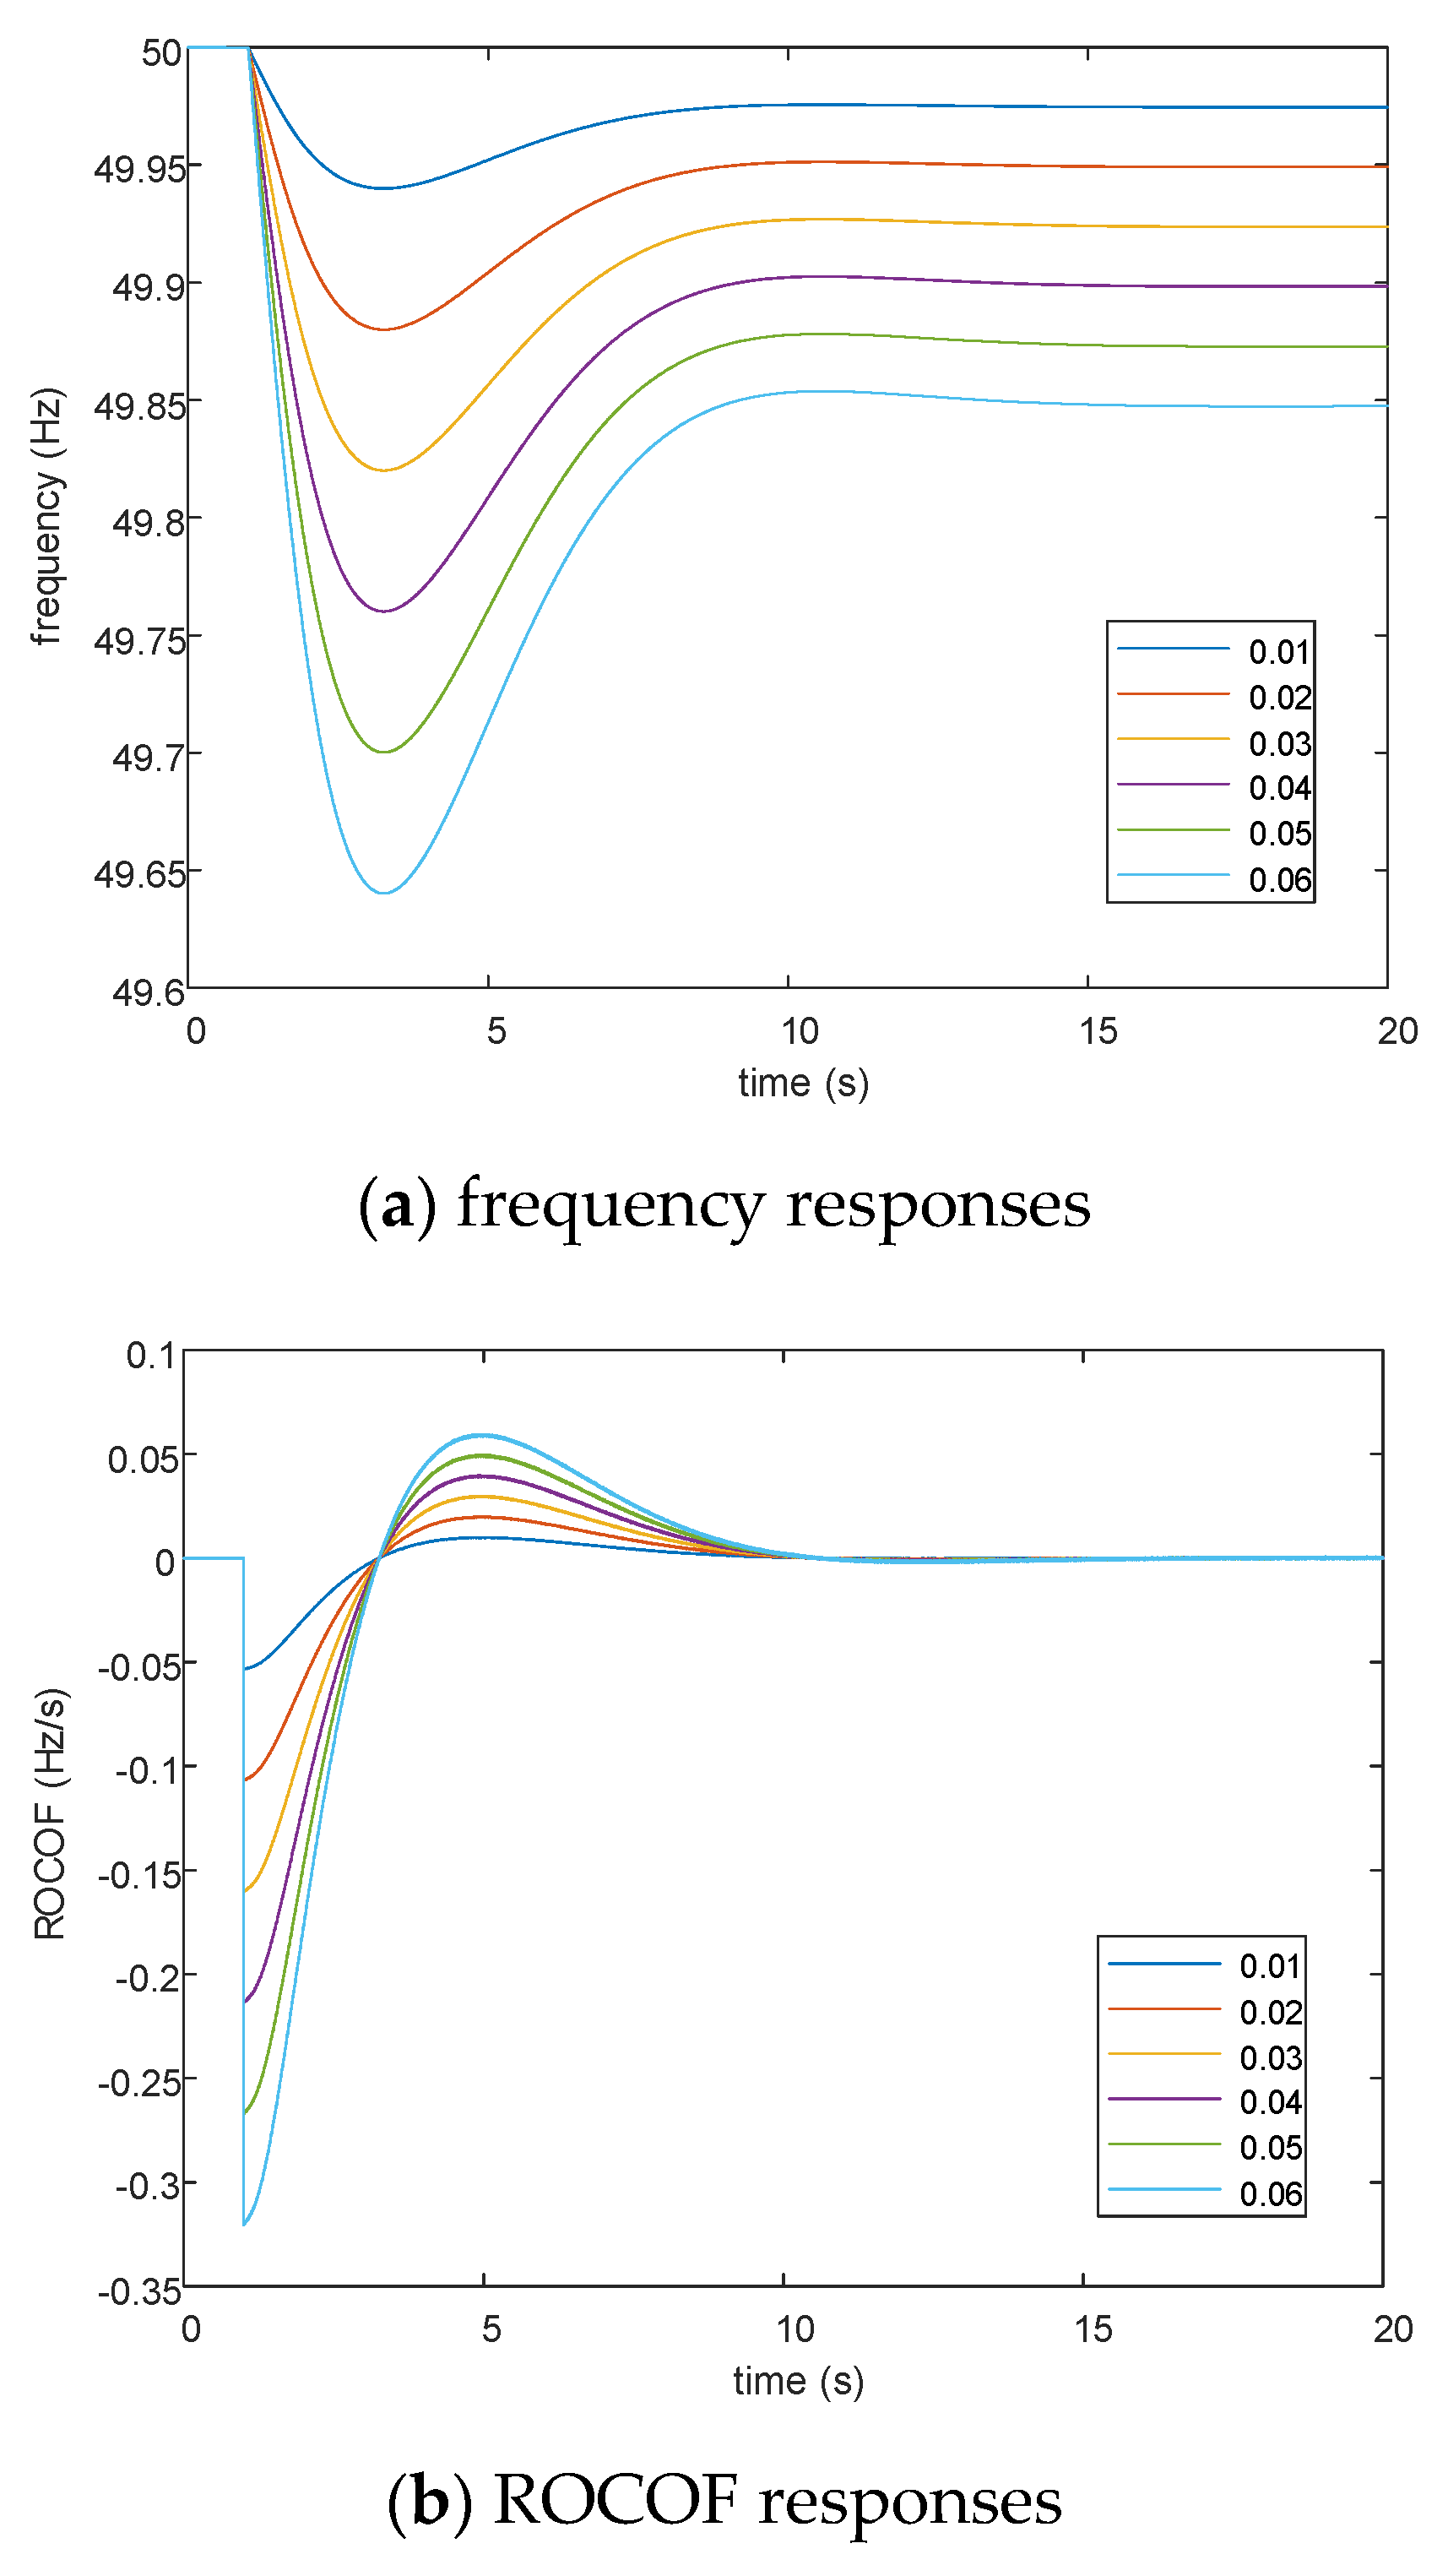
In power systems, the disturbances are mainly caused by the loss of the load, and large disturbances, which are represented by the step changes of the load, range from 0.03 to 0.05 pu [
11,
22]. In some renewable-rich countries (such as Germany, the United States, and the UK), the system operators have made grid codes for renewables to provide ancillary services [
35]. For example, the prescribed limit for ROCOF is 0.125 Hz/s [
36]. In addition, in this material, the maximum ROCOF and PFR delivery time in its case study are set to be 0.5 Hz/s and 10 s, respectively. In another research, the maximum frequency deviation
is set as 0.2 Hz [
30]. It is noted that if the ROCOF exceeds 1 Hz/s, the frequency relay would be tripped and incur a large disturbance to a power system [
37]. Generally, the delivery of PFR is required to be within 10–30 s, and the PFR capacity should always limit the frequency between 49.5 and 50.5 Hz. The conventional standards (when the nominal frequency is 50 Hz) are summarized in
Table 3.
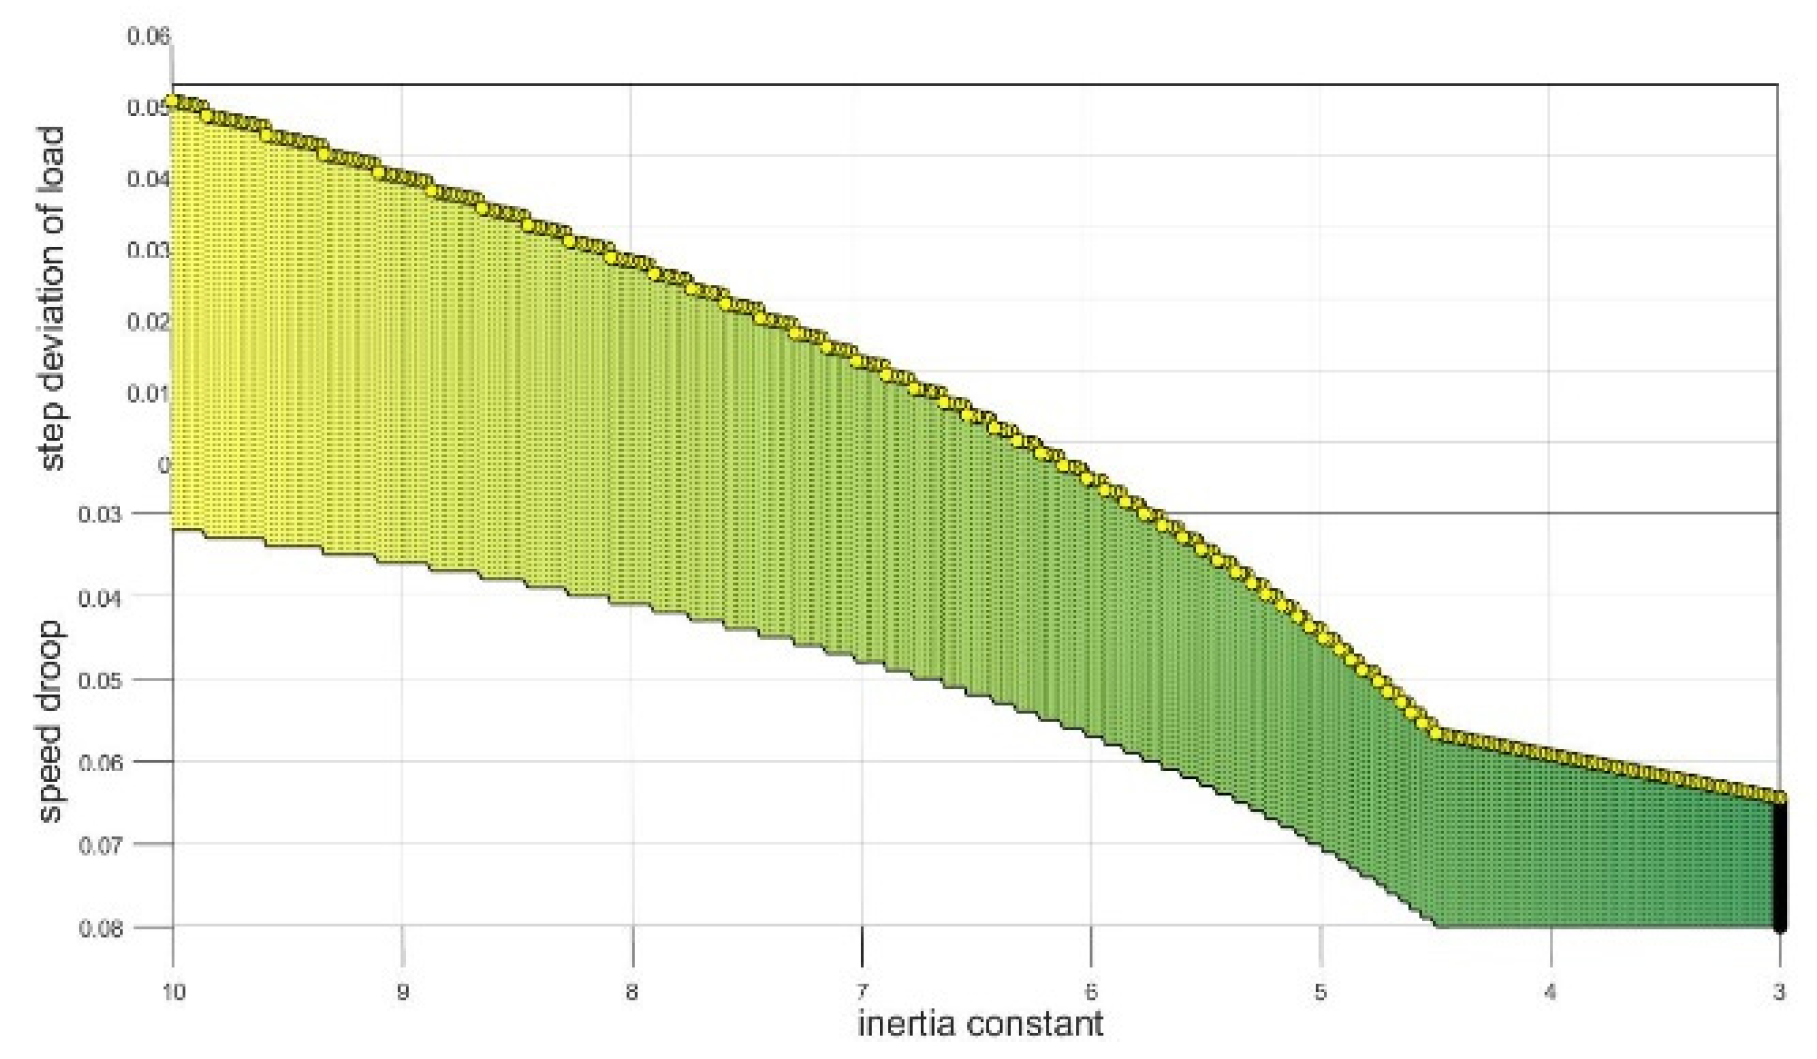
It is noted that the stages of IR and PFR activate in chronological order. Therefore, based on the composite effects and the preset standards, a flowchart of parameter design for VSG-PEIs is shown in
Figure 13. In step A, the standards for ROCOF and the frequency nadir are input. In step B, the satisfying range of
H is obtained according to the standard of the ROCOF. In step C, the satisfying range of
R is obtained by the nadir requirement. In step D, the desired
H and
R are determined by checking the settling time and frequency.
6. Conclusions
Based on the quantitative analysis of the performance indices in the IR and PFR stages, this paper proposes a parameter tuning method adaptive to load changes for VSG-PEIs performing frequency control. From the previous, the conclusions are made.
(1) The frequency responses of PEIs include two stages: the inertia response and the primary frequency response. When subjected to load disturbances, the transfer function of the dynamic system of VSG-PEIs performing frequency response can be derived from the control structures.
(2) By the properties of the fast and slow poles and zeros, the dynamic system can be simplified into a second-order system. The performance indices are deduced by the inverse Laplace transformation.
(3) In the frequency response, the maximum deviation and the magnitude of the ROCOF are two key indices that determine the performance. The magnitude of the ROCOF is determined by the load deviation and the inertia constant. The nadir is determined by the load step, the inertia constant, and the speed droop.
(4) By the properties of the performance indices, adaptive parameter tuning can be implemented. The inertia constant is obtained by the ROCOF standard and the measurement of the load step. Then, the speed droop R is obtained by the nadir standard and the inherited setting of H. Finally, the desired H and R are checked to satisfy the standards of the settling frequency and time.
By the simulation results, the parameter settings of the VSG-PEIs are adaptive to the step change of the demand. Consequently, the proposed method can fully satisfy the predetermined standards in various conditions.
In parallel scenario, as the overall properties of frequency response are determined by all the responsive sources (in the same way as the frequency response dominated by online synchronous machines in traditional power systems), the calculated inertia and speed droop characteristics can be used to (1) examine the overall frequency stability and (2) allocate parameter references for coordinative operation.


