Review on Computer Aided Weld Defect Detection from Radiography Images


Abstract
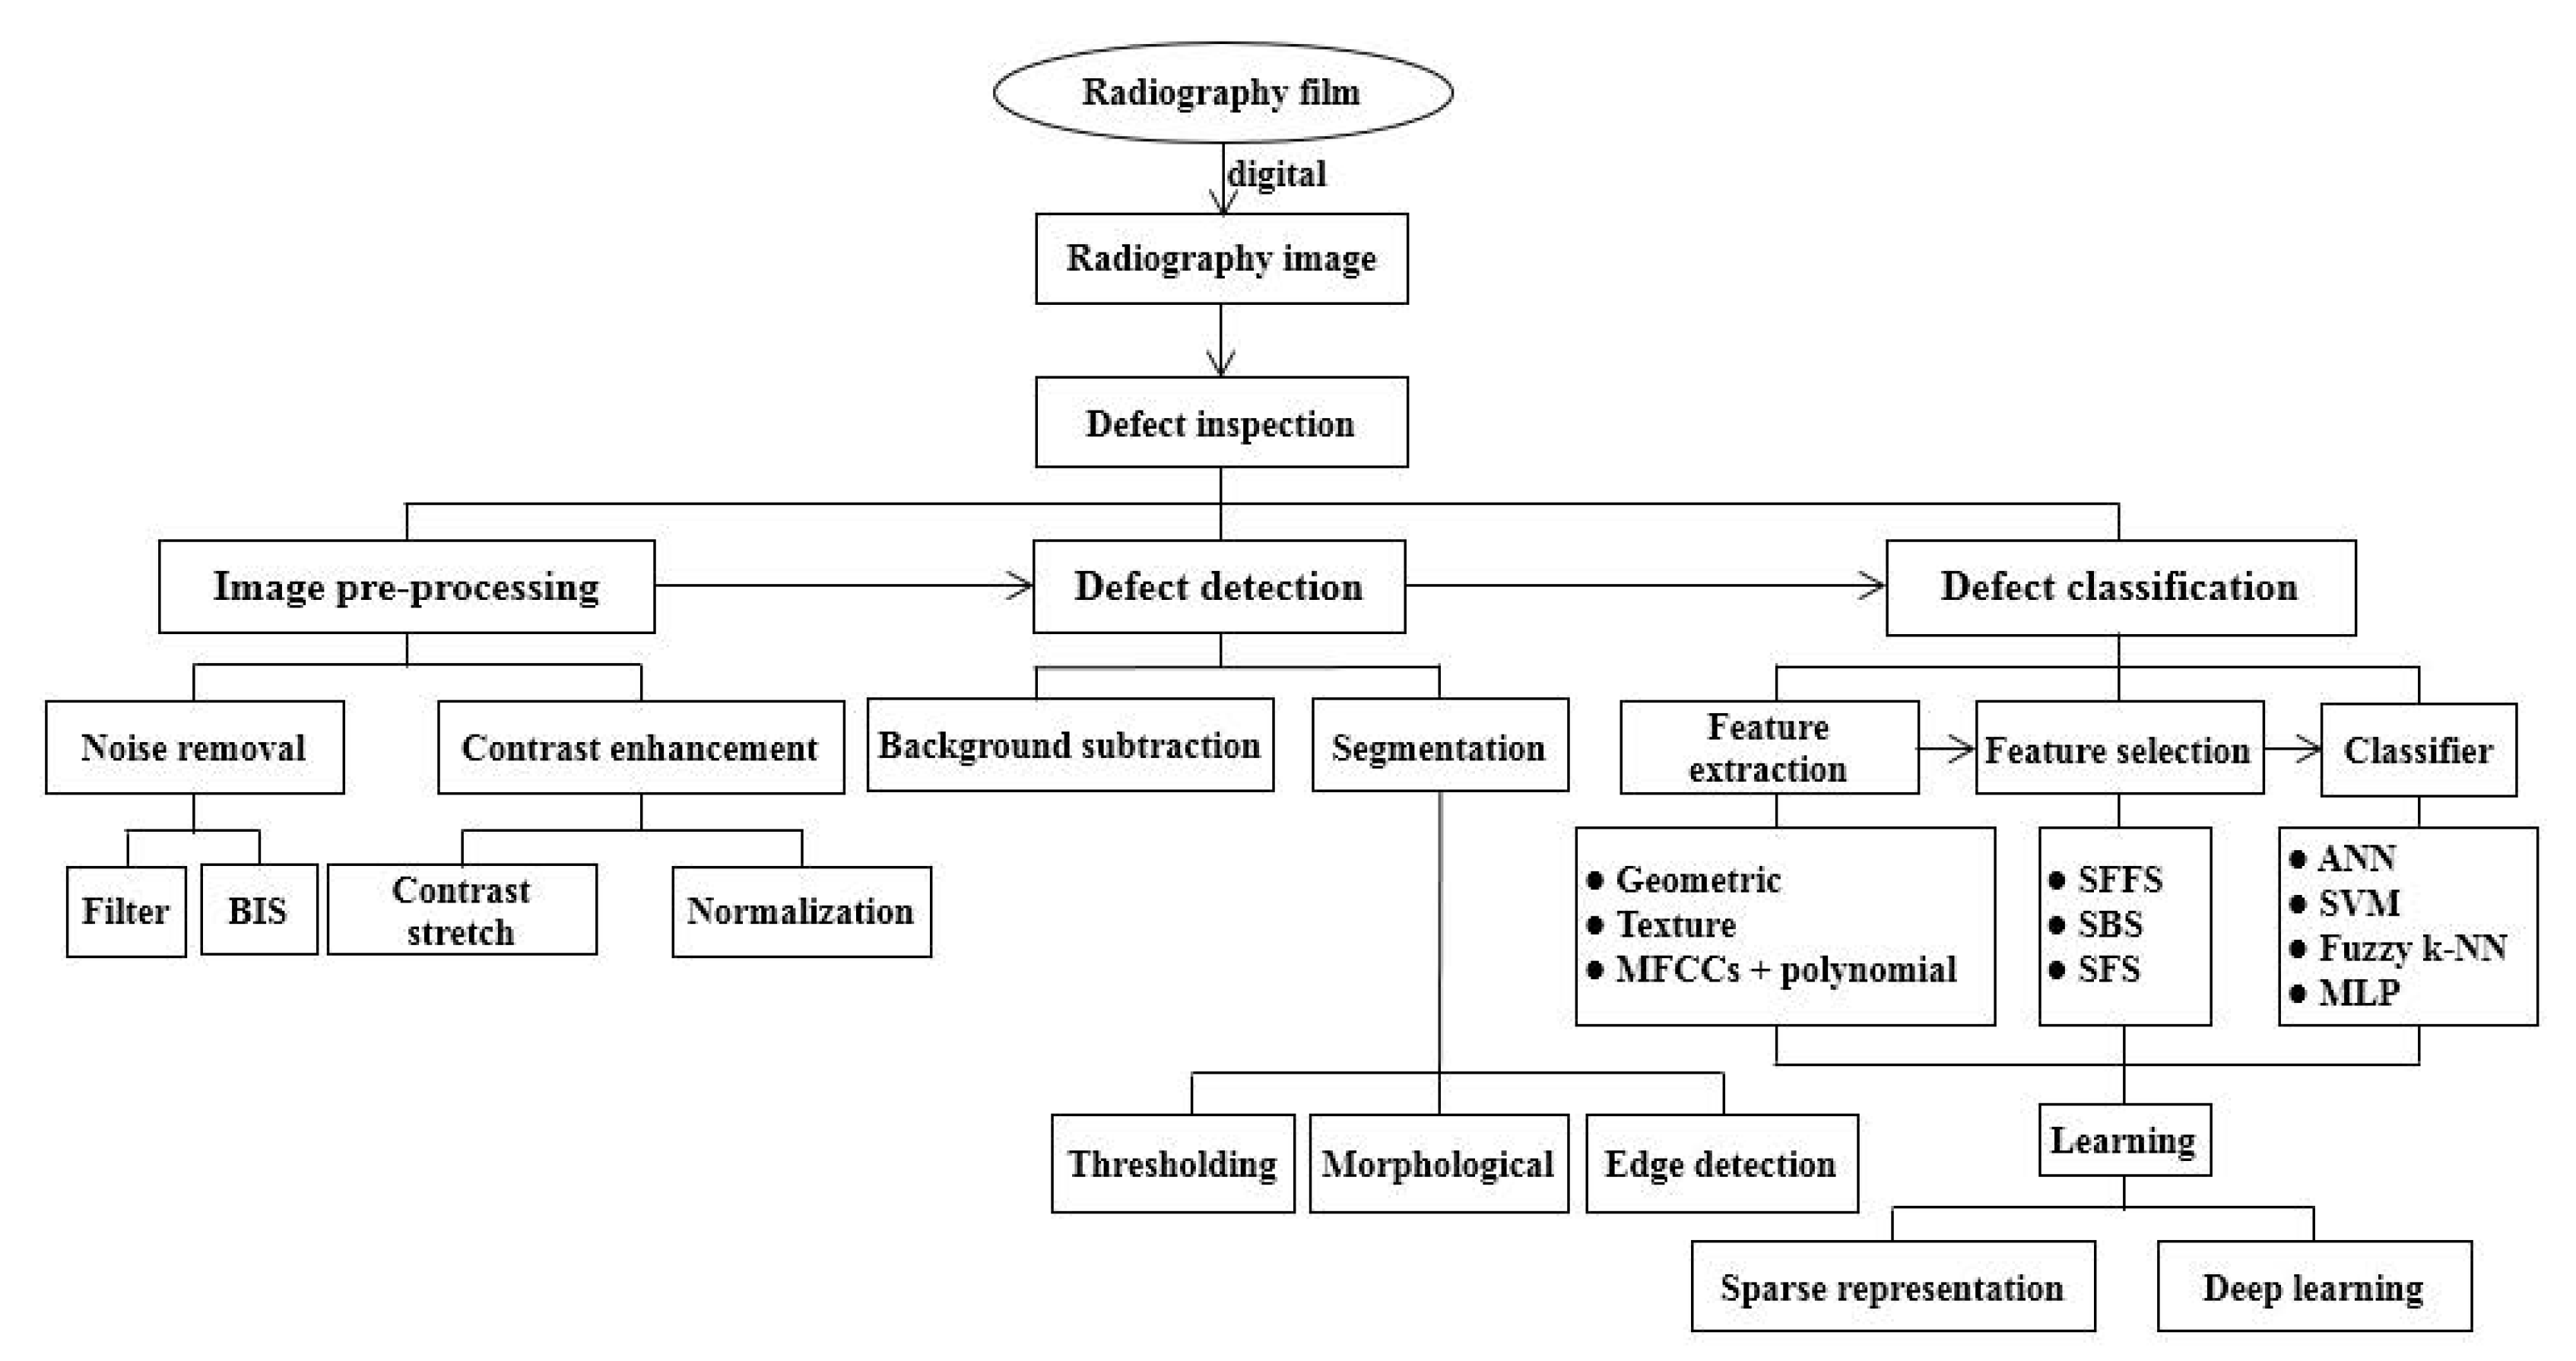
:1. Introduction
2. Data Collection
3. Image Preprocessing
3.1. Noise Removal
3.2. Contrast Enhancement
4. Defect Segmentation
5. Defect Classification
5.1. Feature Extraction
5.2. Feature Selection
5.3. Classifier
5.4. New Methods
6. Discussions
6.1. Achievements
6.2. Challenges
7. Conclusions
Author Contributions
Funding
Acknowledgments
Conflicts of Interest
References
- Nafaa, N.; Redouane, D.; Amar, B. Weld defect extraction and classification in radiographic testing based artificial neural networks. In Proceedings of the 15th World Conference on Non Destructive Testing, Rome, Italy, 15–21 October 2000. [Google Scholar]
- Shafeek, H.I.; Gadelmawla, E.S.; Abdel-Shafy, A.A. Assessment of welding defects for gas pipeline radiographs using computer vision. NDT E Int. 2004, 37, 291–299. [Google Scholar]
- Yeh, P.S.; Le Moigne, J.; Fong, C.B. Computer-aided X-ray film interpretation. In MML TR 88–76; Martin Marietta Laboratories: Baltimorem, MD, USA, 1988. [Google Scholar]
- Basart, J.P.; Xu, J. Automatic detection of flaws in welds. In Final Report to Martin Marietta MSS Contract# A71445; Center for NDE, Iowa State University: Ames, IA, USA, 1991. [Google Scholar]
- Cloud, E.; Fraser, K.; Krywick, S. Automated examination of X-ray welds. In Final Report to Martin Marietta MSS; Martin Marietta Electronics, Information & Missiles Group: Orlando, FL, USA, 1992. [Google Scholar]
- Zapata, J.; Vilar, R.; Ruiz, R. Performance evaluation of an automatic inspection system of weld defects in radiographic images based on neuro-classifiers. Expert Syst. Appl. 2011, 38, 8812–8824. [Google Scholar]
- Zscherpel, U.; Nockemann, C.; Mattis, A.; Heinrich, W. Neue Entwicklungen bei der Filmdigitalisierung. In Proceedings of the DGZfP-Jahrestagung in Aachen, Tagungsband, Aachen, Germany, 22–24 March 1995. [Google Scholar]
- Strang, G. Wavelets and dilation equations: A brief introduction. SIAM Rev. 1989, 31, 614–627. [Google Scholar]
- Wang, G.; Liao, T.W. Automatic identification of different types of welding defects in radiographic images. NDT E Int. 2002, 35, 519–528. [Google Scholar]
- Aoki, K.; Suga, Y. Application of artificial neural network to discrimination of defect type in automatic radiographic testing of welds. ISIJ Int. 1999, 39, 1081–1087. [Google Scholar]
- Zahran, O.; Kasban, H.; El-Kordy, M.; Abd El-Samie, F.E. Automatic weld defect identification from radiographic images. NDT E Int. 2013, 57, 26–35. [Google Scholar]
- Kumar, J.; Anand, R.S.; Srivastava, S.P. Flaws classification using ANN for radiographic weld images. In Proceedings of the IEEE International Conference on Signal Processing and Integrated Networks (SPIN), Noida, India, 20–21 February 2014; pp. 145–150. [Google Scholar]
- Li, L.; Xiao, L.; Liao, H. Welding quality monitoring of high frequency straight seam pipe based on image feature. J. Mater. Process. Technol. 2017, 246, 285–290. [Google Scholar]
- El-Tokhy, M.S.; Mahmoud, I.I. Classification of welding flaws in gamma radiography images based on multi-scale wavelet packet feature extraction using support vector machine. J. Nondestruct. Eval. 2015, 34. [Google Scholar] [CrossRef]
- Kumar, J.; Anand, R.S.; Srivastava, S.P. Multi-class welding flaws classification using texture feature for radiographic images. In Proceedings of the IEEE International Conference on Advances in Electrical Engineering (ICAEE), Vellore, India, 9–11 January 2014; pp. 1–4. [Google Scholar]
- Ye, H.; Juefei, L.; Huijun, L. Detection and recognition of defects in X-ray images of welding seams under compressed sensing. J. Phys. Conf. Ser. 2019, 1314, 012064. [Google Scholar]
- Hyatt, R.; Kechter, G.E.; Nagashima, S. A method for defect segmentation in digital radiographs of pipeline girth welds. Mater. Eval. 1996, 54, 379793. [Google Scholar]
- Daum, W.; Rose, P.; Heidt, H.; Builtjes, J.H. Automatic recognition of weld defects in x-ray inspection. Br. J. Nondestruct. Test. 1987, 29, 79–81. [Google Scholar]
- Liao, T.W.; Li, Y. An automated radiographic NDT system for weld inspection: Part II—Flaw detection. NDT E Int. 1998, 31, 183–192. [Google Scholar]
- Aoki, K.; Suga, Y. Intelligent image processing for abstraction and discrimination of defect image in radiographic film. In Proceedings of the Seventh International Offshore and Polar Engineering Conference, Honolulu, HI, USA, 25–30 May 1997. [Google Scholar]
- Carrasco, M.A.; Mery, D. Segmentation of welding defects using a robust algorithm. Mater. Eval. 2004, 62, 1142–1147. [Google Scholar]
- Kazantsev, I.; Lemahieu, I.; Salov, G.I.; Denys, R. Statistical detection of defects in radiographic images in nondestructive testing. Signal Process. 2002, 82, 791–801. [Google Scholar]
- Murakami, K. Image processing for non-destructive testing. Weld. Int. 1990, 4, 144–149. [Google Scholar]
- Grau, V.; Mewes, A.U.J.; Alcaniz, M.; Kikinis, R.; Warfield, S.K. Improved watershed transform for medical image segmentation using prior information. IEEE Trans. Med. Imaging 2004, 23, 447–458. [Google Scholar] [PubMed]
- Sofia, M.; Redouane, D. Shapes recognition system applied to the non destructive testing. In Proceedings of the 8th European Conference on Non-Destructive Testing, Barcelona, Spain, 17–21 June 2002. [Google Scholar]
- Canny, J. A computational approach to edge detection. IEEE Trans. Pattern Anal. Mach. Intell. 1986, 8, 679–698. [Google Scholar]
- Anand, R.S.; Kumar, P. Flaw detection in radiographic weld images using morphological approach. Ndt E Int. 2006, 39, 29–33. [Google Scholar]
- Felzenszwalb, P.F.; Huttenlocher, D.P. Efficient graph-based image segmentation. Int. J. Comput. Vis. 2004, 59, 167–181. [Google Scholar]
- Valavanis, I.; Kosmopoulos, D. Multiclass defect detection and classification in weld radiographic images using geometric and texture features. Expert Syst. Appl. 2010, 37, 7606–7614. [Google Scholar]
- Liao, T.W.; Li, D.M.; Li, Y.M. Detection of welding flaws from radiographic images with fuzzy clustering methods. Fuzzy Sets Syst. 1999, 108, 145–158. [Google Scholar]
- Liao, T.W.; Li, D.; Li, Y. Extraction of welds from radiographic images using fuzzy classifiers. Inf. Sci. 2000, 126, 21–40. [Google Scholar]
- Liao, T.W. Fuzzy reasoning based automatic inspection of radiographic welds: weld recognition. J. Intell. Manuf. 2004, 15, 69–85. [Google Scholar]
- Perner, P.; Zscherpel, U.; Jacobsen, C. A comparison between neural networks and decision trees based on data from industrial radiographic testing. Pattern Recognit. Lett. 2001, 22, 47–54. [Google Scholar]
- Boaretto, N.; Centeno, T.M. Automated detection of welding defects in pipelines from radiographic images DWDI. NDT E Int. 2017, 86, 7–13. [Google Scholar]
- Liao, T.W. Classification of welding flaw types with fuzzy expert systems. Expert Syst. Appl. 2003, 25, 101–111. [Google Scholar]
- da Silva, R.R.; Calôba, L.P.; Siqueira, M.H.S.; Rebello, J.M.A. Pattern recognition of weld defects detected by radiographic test. NDT E Int. 2004, 37, 461–470. [Google Scholar]
- Da Silva, R.R.; Siqueira, M.H.S.; de Souza, M.P.V.; Rebello, J.M.A. Estimated accuracy of classification of defects detected in welded joints by radiographic tests. NDT E Int. 2005, 38, 335–343. [Google Scholar]
- Shen, Q.; Gao, J.; Li, C. Automatic classification of weld defects in radiographic images. In Insight—Non-Destructive Testing and Condition Monitoring; The British Institute of Non-Destructive Testing: Northampton, UK, 2010; Volume 52, pp. 134–139. [Google Scholar]
- Shafeek, H.I.; Gadelmawla, E.S.; Abdel-Shafy, A.A.; Elewa, I.M. Automatic inspection of gas pipeline welding defects using an expert vision system. NDT E Int. 2004, 37, 301–307. [Google Scholar]
- Zhang, X.G.; Xu, J.J.; Ge, G.Y. Defects recognition on X-ray images for weld inspection using SVM. In Proceedings of the IEEE International Conference on Machine Learning and Cybernetics, Shanghai, China, 26–29 August 2004; Volume 6, pp. 3721–3725. [Google Scholar]
- Mery, D.; Berti, M.A. Automatic detection of welding defects using texture features. In Insight—Non-Destructive Testing and Condition Monitoring; The British Institute of Non-Destructive Testing: Northampton, UK, 2003; Volume 45, pp. 676–681. [Google Scholar]
- Civera, M.; Ferraris, M.; Ceravolo, R.; Surace, C. The Teager-Kaiser Energy Cepstral Coefficients as an Effective Structural Health Monitoring Tool. Appl. Sci. 2019, 9, 5064. [Google Scholar]
- Balsamo, L.; Betti, R.; Beigi, H. A structural health monitoring strategy using cepstral features. J. Sound Vib. 2014, 333, 4526–4542. [Google Scholar]
- Ferraris, M.; Civera, M.; Ceravolo, R.; Surace, C.; Betti, R. Using enhanced cepstral analysis for structural health monitoring. In Proceedings of the 13th International Conference on Damage Assessment of Structures, Porto, Portugal, 9–10 July 2019; Springer: Berlin, Germany, 2020; pp. 150–165. [Google Scholar]
- Kasban, H.; Zahran, O.; Arafa, H. Welding defect detection from radiography images with a cepstral approach. NDT E Int. 2011, 44, 226–231. [Google Scholar]
- Jain, A.; Zongker, D. Feature selection: Evaluation, application, and small sample performance. IEEE Trans. Pattern Anal. Mach. Intell. 1997, 19, 153–158. [Google Scholar]
- Garcia-Allende, P.B.; Mirapeix, J.; Conde, O.M.; Cobo, A.; Lopez-Higuera, J.M. Spectral processing technique based on feature selection and artificial neural networks for arc-welding quality monitoring. NDT E Int. 2009, 42, 56–63. [Google Scholar]
- Mery, D.; da Silva, R.R.; Calôba, L.P.; Rebello, J.M.A. Pattern recognition in the automatic inspection of aluminium castings. In Insight—Non-Destructive Testing and Condition Monitoring; The British Institute of Non-Destructive Testing: Northampton, UK, 2003; Volume 45, pp. 475–483. [Google Scholar]
- Vilar, R.; Zapata, J.; Ruiz, R. An automatic system of classification of weld defects in radiographic images. NDT E Int. 2009, 42, 467–476. [Google Scholar]
- Zhao, R.; Yan, R.; Chen, Z.; Mao, K. Deep learning and its applications to machine health monitoring. Mech. Syst. Signal Process. 2019, 115, 213–237. [Google Scholar]
- LeCun, Y.; Bengio, Y.; Hinton, G. Deep learning. Nature 2015, 521, 436–444. [Google Scholar]
- Tosic, I.; Frossard, P. Dictionary learning: What is the right representation for my signal? IEEE Signal Process. Mag. 2011, 28, 27–38. [Google Scholar]
- Olshausen, B.A.; Field, D.J. Emergence of simple-cell receptive field properties by learning a sparse code for natural images. Nature 1996, 381, 607. [Google Scholar]
- Xiang, Y.; Zhang, C.; Guo, Q. A dictionary-based method for tire defect detection. In Proceedings of the IEEE International Conference on Information and Automation, Hailar, China, 28–30 July 2014; pp. 519–523. [Google Scholar]
- Nhat-Duc, H.; Nguyen, Q.L.; Tran, V.D. Automatic recognition of asphalt pavement cracks using metaheuristic optimized edge detection algorithms and convolution neural network. Autom. Constr. 2018, 94, 203–213. [Google Scholar]
- Cha, Y.J.; Choi, W.; Büyüköztürk, O. Deep learning-based crack damage detection using convolutional neural networks. Comput.-Aided Civ. Infrastruct. Eng. 2017, 32, 361–378. [Google Scholar]
- Sassi, P.; Tripicchio, P.; Avizzano, C.A. A smart monitoring system for automatic welding defect detection. IEEE Trans. Ind. Electron. 2019. [Google Scholar] [CrossRef]
- Zhang, Y.; You, D.; Gao, X.; Zhang, N.; Gao, P.P. Welding defects detection based on deep learning with multiple optical sensors during disk laser welding of thick plates. J. Manuf. Syst. 2019, 51, 87–94. [Google Scholar]
- Zhang, Z.; Wen, G.; Chen, S. Weld image deep learning-based on-line defects detection using convolutional neural networks for Al alloy in robotic arc welding. J. Manuf. Process. 2019, 45, 208–216. [Google Scholar]
- Chen, B.; Fang, Z.; Xia, Y. Accurate defect detection via sparsity reconstruction for weld radiographs. NDT E Int. 2018, 94, 62–69. [Google Scholar]
- Yang, N.; Niu, H.; Chen, L.; Mi, G. X-ray weld image classification using improved convolutional neural network. In Proceedings of the 2018 International Symposium on Mechanics, Structures and Materials Science, Tianjin, China, 9–10 June 2018; Volume 1995, p. 020035. [Google Scholar]
- Yaping, L.; Weixin, G. Research on X-ray welding image defect detection based on convolution neural network. J. Phys. Conf. Ser. 2019, 1237, 032005. [Google Scholar]
- Hou, W.; Wei, Y.; Jin, Y.; Zhu, C. Deep Features Based A DCNN Model Classifying Imbalanced Weld Flaw Types. Measurement 2019, 131, 482–489. [Google Scholar]
- Rytter, A. Vibrational Based Inspection of Civil Engineering Structures. Ph.D. Thesis, Aalborg University, Aalborg, Denmark, 1993. [Google Scholar]
- Civera, M.; Zanotti Fragonara, L.; Surace, C. An experimental study of the feasibility of phase-based video magnification for damage detection and localisation in operational deflection shapes. Strain 2020, 56, e12336. [Google Scholar]
- Liao, T.W. Classification of weld flaws with imbalanced class data. Expert Syst. Appl. 2008, 35, 1041–1052. [Google Scholar]
- He, H.; Ma, Y. Imbalanced Learning: Foundations, Algorithms, and Applications; John Wiley & Sons: Hoboken, NJ, USA, 2013. [Google Scholar]


| Ref | Base | Pre-Processing | Feature Number; Type | Feature Selection | Classifier | Results | Evaluation |
|---|---|---|---|---|---|---|---|
| [30] | Line profile | - | 25 profile measurements | - | Fuzzy k-NN; Fuzzy C-means | 6.01% 18.67% | Missing rate False alarm |
| [31] | Line profile | - | 3 profile measurements | - | Fuzzy k-NN; Fuzzy C-means | - | False alarm |
| [33] | Line profile | - | 36 profile measurements | - | NN; Decision-tree | complex | Generalization; Representation; Quality; Cost; etc. |
| [32] | Line profile | - | 3 profile measurements | - | Fuzzy reasoning | 100% | Accuracy |
| [9] | 2D image | Noise removal; Contrast improve; Defect segment | 12 numeric | - | Fuzzy k-NN; MLP | 92.39% | Bootstrap accuracy |
| [41] | 2D image | Potential defect segment | 148 texture | SFS | Polynomial; Mahalanobis; Nearest neighbor | 90.91% | Area under the ROC |
| [35] | 2D image | - | 12 geometric | Filter methods | Fuzzy expert; Fuzzy k-NN; MLP | 0.9205 | Bootstrap accuracy |
| [36] | 2D image | Noise removal; Contrast improve; | 4 geometric | - | Nonlinear pattern classifiers using NN | complex | Classification performance; Relevance criterion; Principal components |
| [40] | 2D image | Noise removal; Enhancement; Segmentation | 8 geometric | - | SVM; Fuzzy NN | 83.3% | Accuracy rate |
| [37] | 2D image | - | 7 geometric | - | Nonlinear classifier | 92% | Bootstrap accuracy |
| [29] | 2D image | Defect segment | 43 geometric+ texture | SBS | SVM; ANN; k-NN | 98.51% | 3-fold cross validation accuracy |
| [15] | 2D image | Noise removal; Contrast improve | 8,64,44 texture | - | ANN | 86.1% | Classification accuracy |
| [12] | 2D image | Noise removal; Contrast improve; Image segment | 16 texture 8geometric 72 geometric + texture | - | ANN | 87.34% | Classification accuracy |
| [45] | 1D signal | - | 13MFCCs+ 26polynomial features | - | ANN | 100% | Recognition rates |
| [6] | 2D image | Noise removal; Contrast improve; Defect segment | 12 geometrical | - | ANN ANFIS | 100% | Classification accuracy |
| [11] | Power Density Spectra | Image enhancement; Image segmentation | MFCCs+ polynomial features | - | ANN | 100% | Probability of detection; False alarm rate |
| [14] | 2D image | Noise removal; Contrast improve; Image segment | Energy of the wavelet coefficients | - | SVM | 99.5% | Classification rate |
| [34] | 2D image | Location of the weld bead region | 8 geometrical | - | MLP | 88.6% 87.5% | Accuracy F-score |
© 2020 by the authors. Licensee MDPI, Basel, Switzerland. This article is an open access article distributed under the terms and conditions of the Creative Commons Attribution (CC BY) license (http://creativecommons.org/licenses/by/4.0/).
Share and Cite
Hou, W.; Zhang, D.; Wei, Y.; Guo, J.; Zhang, X. Review on Computer Aided Weld Defect Detection from Radiography Images. Appl. Sci. 2020, 10, 1878. https://doi.org/10.3390/app10051878
Hou W, Zhang D, Wei Y, Guo J, Zhang X. Review on Computer Aided Weld Defect Detection from Radiography Images. Applied Sciences. 2020; 10(5):1878. https://doi.org/10.3390/app10051878
Chicago/Turabian StyleHou, Wenhui, Dashan Zhang, Ye Wei, Jie Guo, and Xiaolong Zhang. 2020. "Review on Computer Aided Weld Defect Detection from Radiography Images" Applied Sciences 10, no. 5: 1878. https://doi.org/10.3390/app10051878