Article

Performance Analysis of a Hybrid Electric Vehicle with Multiple Converter Configuration

by
Josefa Morales-Morales
1,2,*,
Miguel A. Rivera-Cruz
1,
Pedro Cruz-Alcantar
1,
Horacio Bautista Santos
2,
Ilse Cervantes-Camacho
3 and
Vladimir A. Reyes Herrera
4
1
Coordinación Académica Región Altiplano, Universidad Autónoma de San Luis Potosí, Carretera Cedral Km, 5+600, Ejido San José de las Trojes Matehuala, San Luis Potosi 78700, Mexico
2
Tecnológico Nacional de México, ITS Chicontepec, Chicontepec, Veracruz 72709, Mexico
3
Centro de Investigación en Ciencia Aplicada y Tecnología Avanzada, Santiago de Queretaro, Queretaro 76090, Mexico
4
Instituto de Energía Renovables, Cuernavaca, Morelos 62580, Mexico
*
Author to whom correspondence should be addressed.
Appl. Sci. 2020, 10(3), 1074; https://doi.org/10.3390/app10031074
Submission received: 31 December 2019 / Revised: 29 January 2020 / Accepted: 3 February 2020 / Published: 5 February 2020
(This article belongs to the Special Issue Hybrid Vehicle Technologies for a Sustainable Future Mobility)

Abstract

:
The use of electric vehicles and their various configurations is seen as a major alternative in efforts towards reducing pollutant emissions from motor vehicles that continue to use fossil fuels. Electric transport technology presents more efficient means of energy conversion in vehicles: electric (EV), hybrid (VH), and hybrid electric (HEV) vehicles. For example, the energy storage system in the latter can be made up of ultracapacitors (UCs), batteries (Bs), and fuel cells. This work focuses on HEVs powered by batteries and ultracapacitors. In particular, the multiple converter configuration (C-CM) for the HEV powertrain system is analyzed using electric models of the vehicle powertrain components. To analyze the multiple converter configuration, parameters of a vehicle taken from the literature and the electrical model of the configuration were developed. With the above, the proposed configuration was evaluated before driving cycles (CITY II and ECE) and the configuration performance was compared with respect to other configurations. In the C-CM model, limitations in the choice of the number of Bs and UCs were observed in the powertrain depending on the maximum power of both energy sources and vehicle load demand. The results show that more energy is extracted from the batteries in the ECE cycle than in the CITY taking into account that the batteries are used as the main power source. C-CM results compared to other configurations show that energy extracted from batteries in the CITY is the same across all configurations. While energy consumption is lower in the ECE, C-CM results were not very significant compared to other configurations. However, the C-MC has the advantage of having better power flow control due to having two converters, thus improving HEV safety.

1. Introduction

Climate change brought on by environmental pollution has given rise to new requirements for energy conversion efficiency. Specifically, the transportation sector is one of the main contributors to pollution due to its reliance on internal combustion engines [1]. Currently, more efficient transportation technologies such as electric vehicles (EVs), hybrid vehicles (HVs), and hybrid electric vehicles (HEVs) are being explored. The first uses batteries (Bs) [2,3], the second uses a combination of internal combustion and electrical power [3,4], and the latter has an energy storage system that can be composed of ultracapacitors (UCs), batteries (Bs), and fuel cells [5,6,7]. EVs and HEVs today are considered a viable alternative since they offer an intelligent and efficient transport system without polluting emissions [8,9,10,11,12]. Companies such as Honda, BMW, Kia, and Tesla, among others, already offer electric vehicles powered by batteries for sale [1,8,13]. Recently some authors have studied the infrastructure and environmental impacts of EVs in different cities. These authors determined that the use of EVs is viable because electricity costs are much lower than the gasoline costs per km of the vehicle [10,11,12,13]. However, this type of vehicle has the problem of having less autonomy than HVs and long charging times [14]. Therefore, there are currently HEV prototypes powered by batteries (Bs) and ultracapacitors (UCs) [7,14,15,16], which feature good performance and autonomy [14,16,17,18]. A hybrid energy storage system (composed of UCs and Bs) in an HEV can recover more energy, extend battery life, and increase the driving range unlike EVs [13,14]. HEV energy consumption depends on the power rations of the components, the control strategy applied, the type of terrain, and the vehicle topology. Regarding the latter, there are few studies that explore different vehicle topologies or power configurations. These HEV powertrain topologies or configurations should be studied to analyze their influence on the performance of the vehicle from the analytical point of view [18]. Some typical configurations of the powertrain system include the basic passive parallel that does not contain power converters in its configuration and therefore no control is applied to meet the energy demand, unlike the ultracapacitor/battery (C-UC/B) configurations, battery/ultracapacitor (C-B/UC) configurations, and multiple converter (C-MC) configurations that have power converters [7,16]. However, the C-UC/B and C-B/UC configurations only have a two-way direct current to direct current (DC/DC) power converter for either the Bs or the UC and a control is needed to meet the load demand. On the other hand, a feature of the multiple converter configuration is its two bidirectional DC/DC power converters connected in parallel with the power sources (UCs and Bs). This configuration leads to control over the two power converters to meet the load demand. Another feature is that the UC voltage can be varied over a wide range, which implies that the UC is used in full capacity; in addition, the voltages of both the B pack and the UC bank can be kept below the voltage of the DC bus [16]. In this context, this work analyzes and evaluates an HEV with an energy storage system composed of Bs and UCs with a Multiple Converter configuration (C-MC), for which no analytical results have been shown using an electric model. To analyze the proposed configuration, the following methodology is used: (i) the parameters of a vehicle, powertrain, and an energy management strategy are taken from the literature; (ii) the C-MC configuration is modeled electrically; (iii) the configuration is tested in CITY II and ECE driving cycles; and (iv) finally, the performance of the proposed configuration is compared with other topologies. The results are shown in simulation, and according to the parameters, loss of energy in the converters is considered before a case study submitted to different terrain conditions; in addition, the C-MC is compared with the C-UC/B and C-B/UC topologies.

2. Methodology

The main elements that make up the powertrain of a propulsion system are energy sources (Bs and UCs), motor, and electronic power converters, among others. The arrangement of these elements in an electrical circuit and its connection is called the propulsion system configuration [3,16]. Some common powertrain configurations used in the literature for an electric vehicle powered by Bs and UCs are described below.

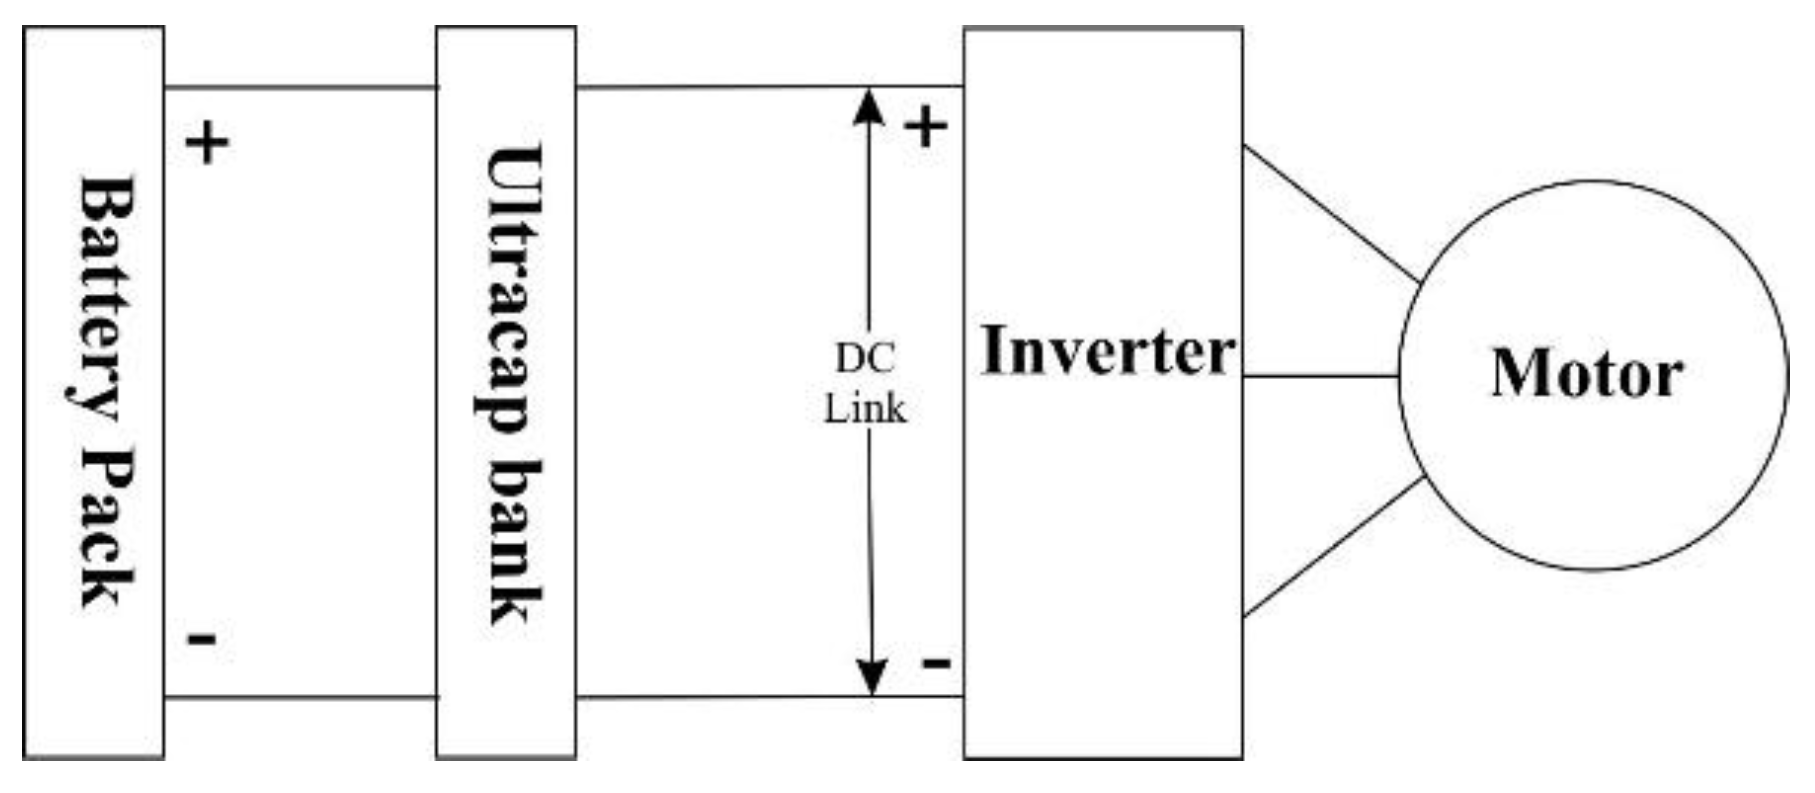
2.1. Passive Parallel Configuration

This is the simplest method of combining a battery pack (Bs) and an ultracapacitor bank (UC) because the two energy sources hybridize without the need for an electronic power converter or inverter as shown in Figure 1. In this configuration the two sources are always parallel, so the voltage of the B pack is equal to the voltage of the UC back and the bus voltage. The UC acts essentially as a low pass filter. The main problem with this topology is that it cannot effectively use the energy stored in the UC. The advantages of this configuration are the ease of implementation and the absence of control requirements or electronic power converters.

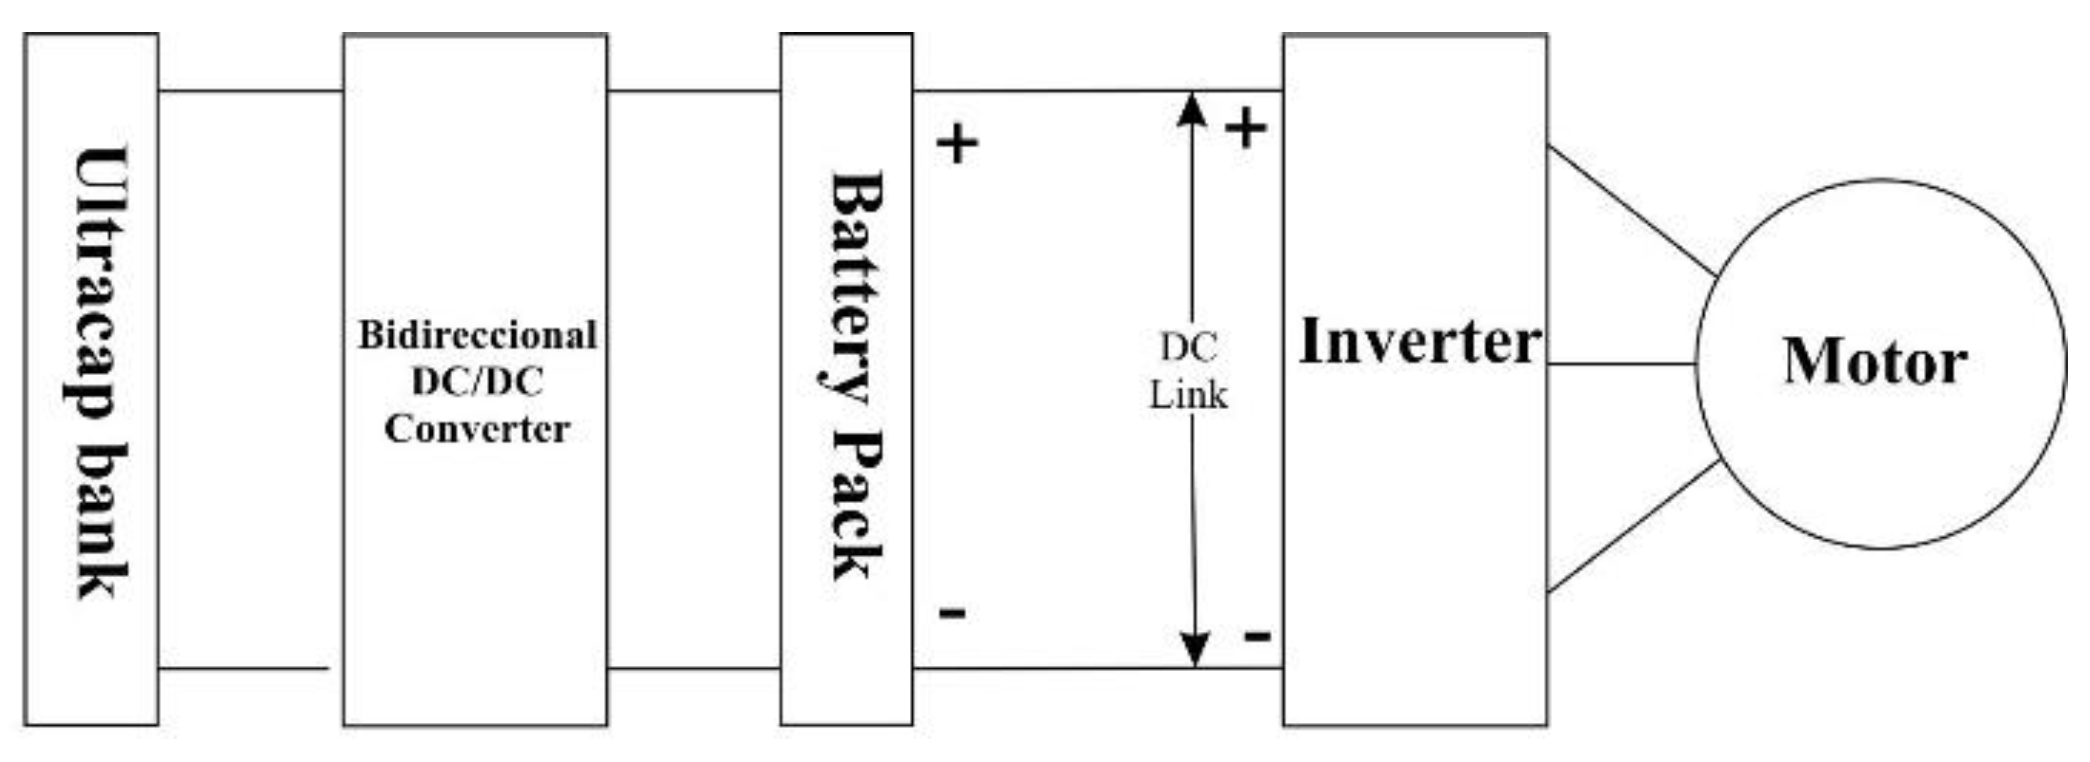
2.2. Ultracapacitor/Battery Configuration (C-UC/B)

The UC/B configuration has a UC back connected to the bus through a bidirectional DC/DC converter as shown in Figure 2. The advantage of this configuration is a wide range of UC bank voltage compared to the previous configuration. However, the bidirectional converter must be large enough to handle the power of the UC. In addition, the nominal voltage of the UC may be less than the battery voltage, which is equal to that of the direct current bus. In this configuration a control and an electronic power converter are required unlike the passive configuration.

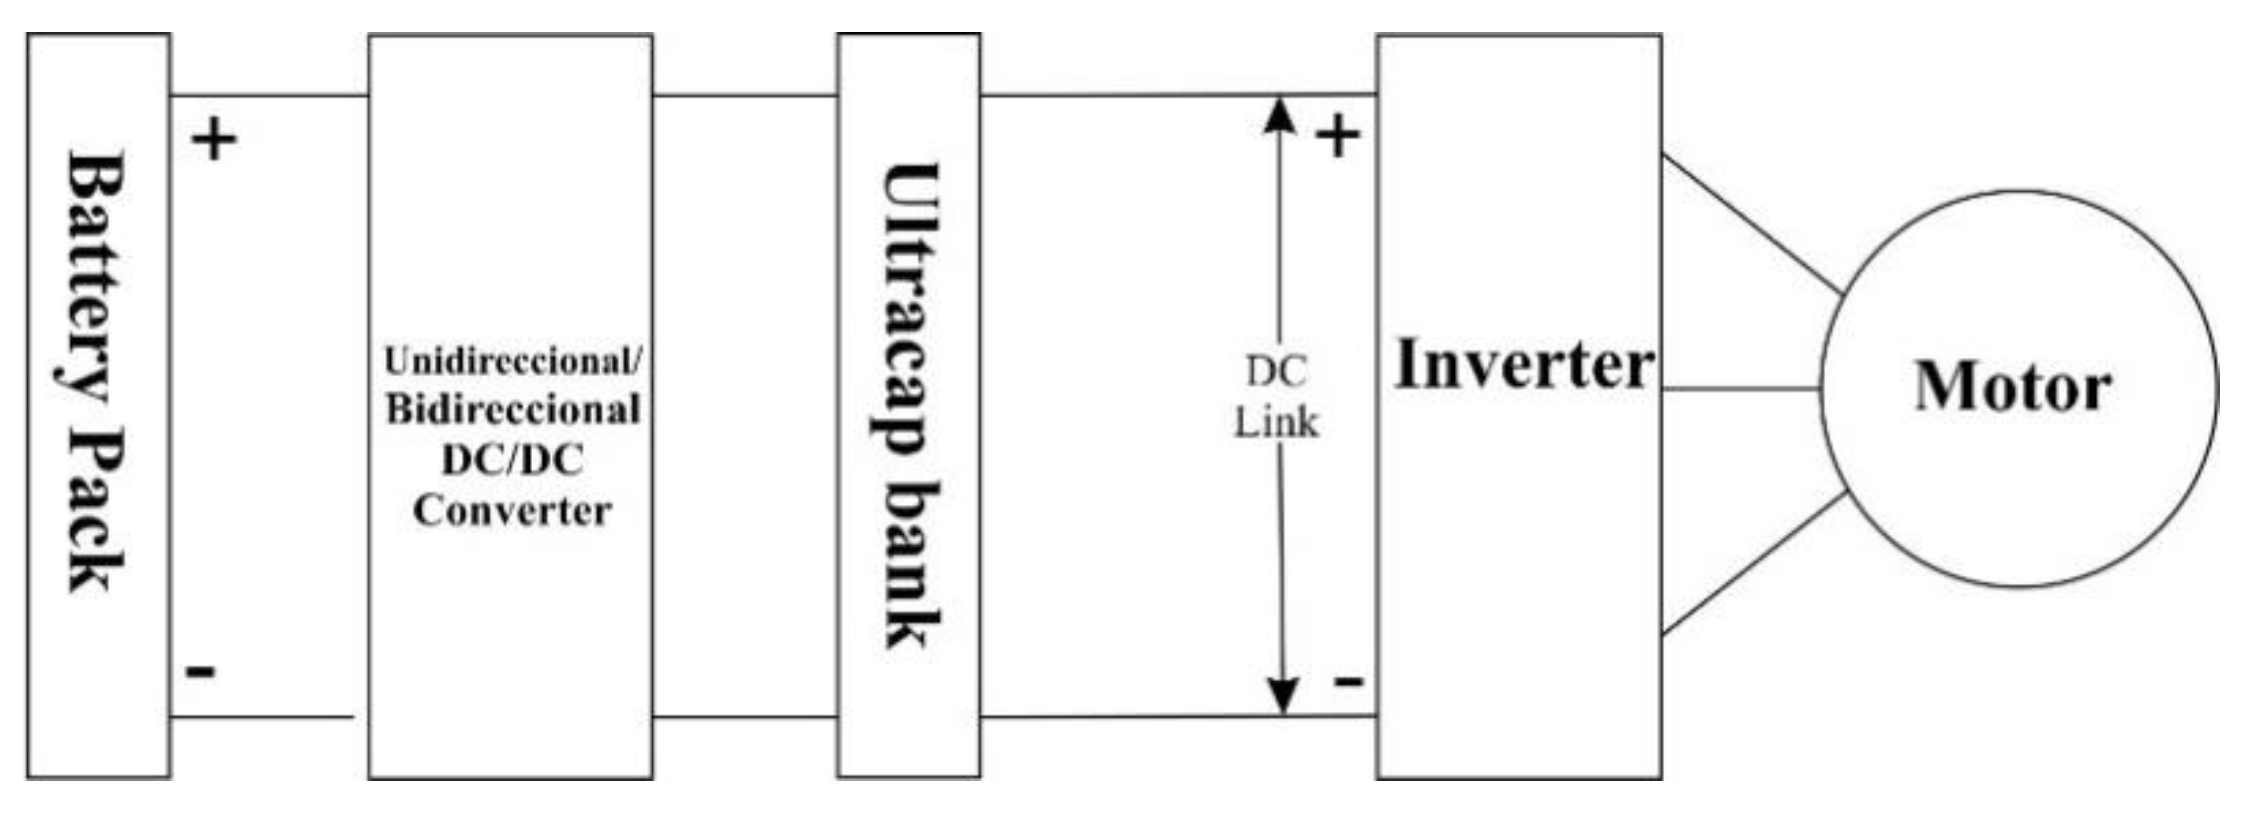
2.3. Battery/Ultracapacitor Configuration (C-B/UC)

This configuration is a variant of the previous one. In this configuration the battery voltage can be kept lower than the UC voltage. The UC is connected to the direct current link and works directly as a low pass filter. This configuration is shown in Figure 3 and, like the previous configuration, a control and an electronic power converter are required unlike the passive configuration.

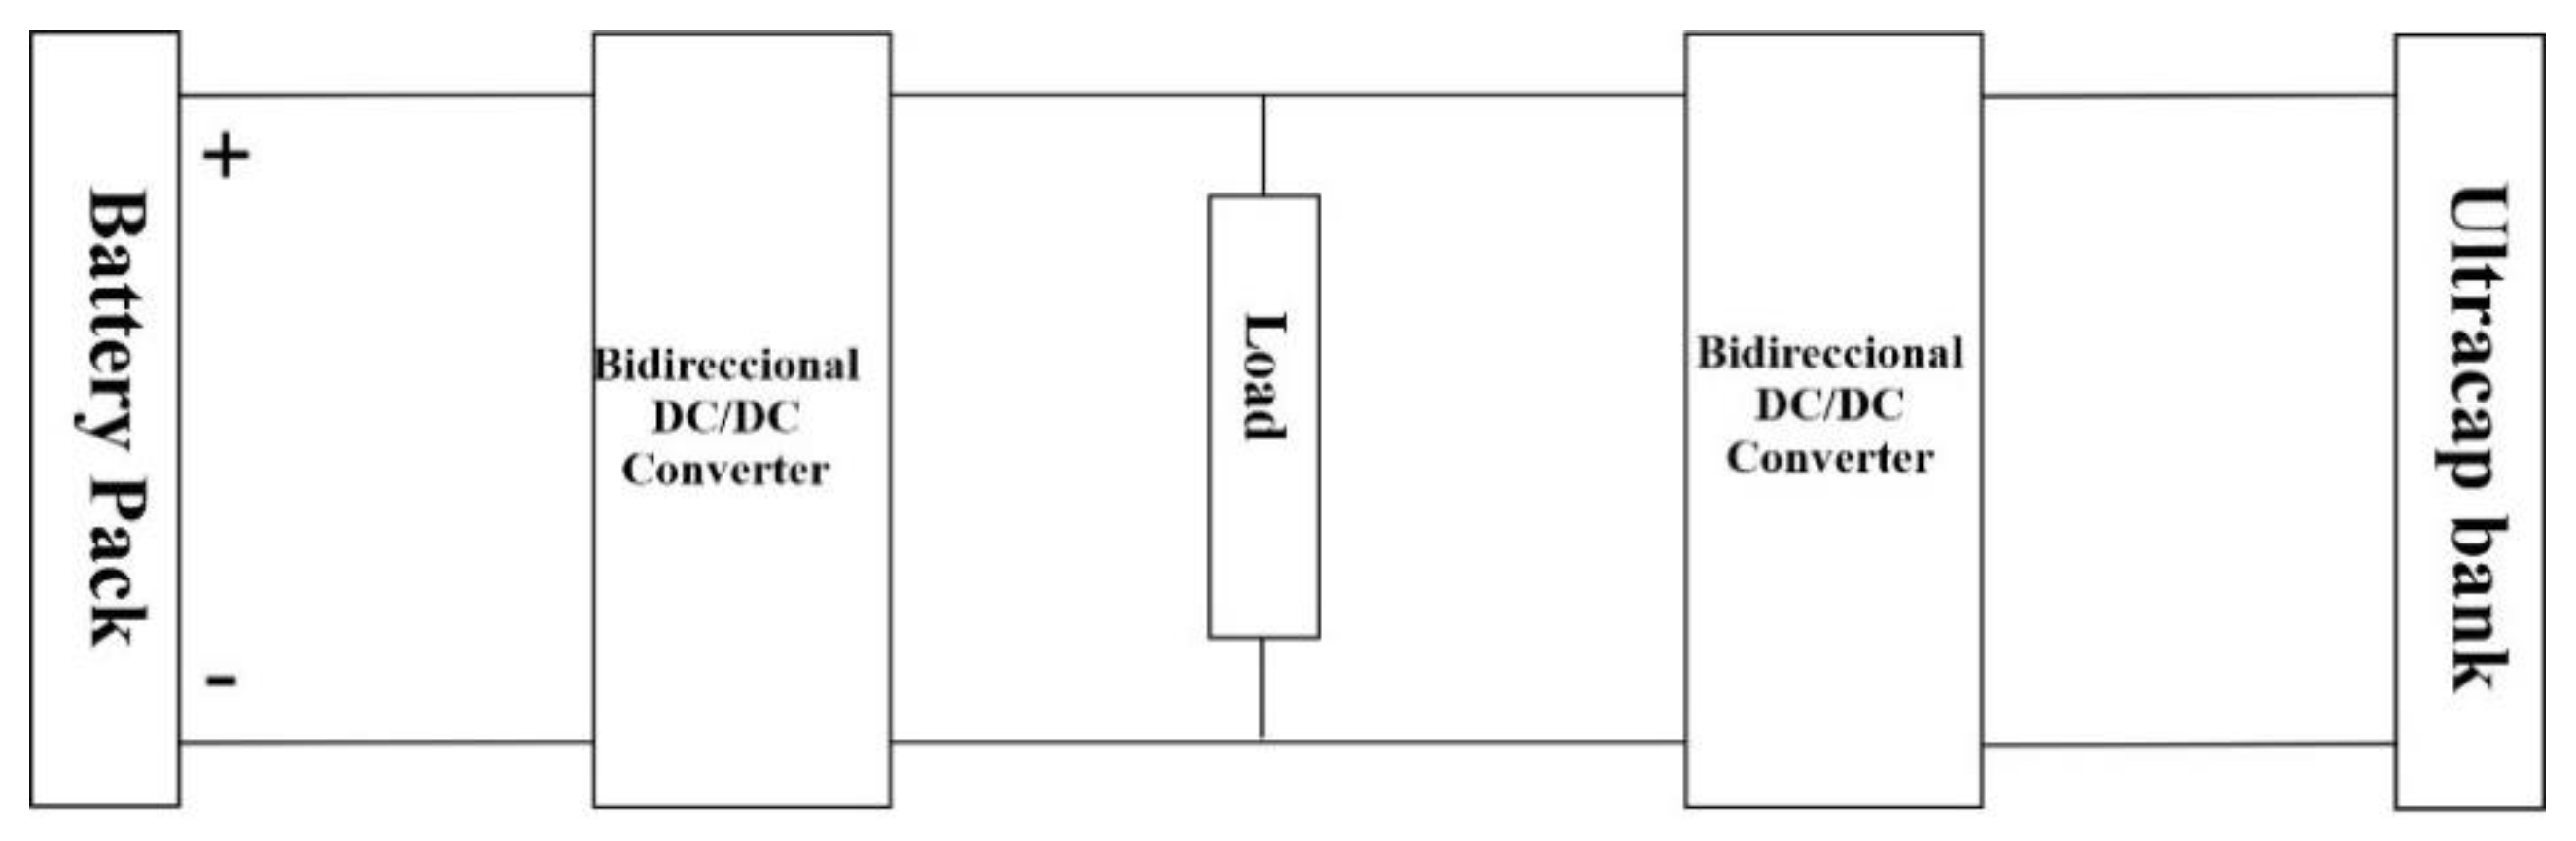
2.4. Multiple Converter Configuration (C-MC)

Figure 4 shows the diagram of the multiple converter configuration. The outputs of the two converters are the same as the direct current link voltage. A feature of the multiple converter configuration is its two bidirectional DC/DC power converters connected in parallel with the sources where the outputs of the two converters are the same as the direct current bus voltage. An advantage to this configuration is that the voltages of both the B pack and the UC bank can be kept below the direct current bus voltage unlike the above-mentioned configurations. Additionally, the UC voltage can vary over a wide range.
Regarding the study of vehicle powertrain configurations, there are few works focused on studying them in an analytical way and analyzing the influence of their configuration on HEV performance. The three configurations outlined above are described by Cao and Emadi [16] and the differences among them and the advantages of using one with regards to the other, in terms of voltage manipulation in the B pack or the UC bank through the power converters, are presented considering how to accommodate the vehicle powertrain elements. In a study by Zamora Gómez [18], the C-UC/B and the C-B/UC are analyzed using an electric model, which provides information on the dynamic behavior of the voltages, currents, and state of charge of the B pack and the UC bank. This author analyzed the effect of the configurations (C-UC/B and C-B/UC) on the powertrain for different driving cycles. The results showed that the C-UC/B configuration performs better in an electric vehicle than the C-B/UC configuration. However, this work considered ideal efficiencies for the converters (that is, 100% efficiency, which implies that there are no voltage losses) and for each driving cycle it considered a certain pack size of Bs and UCs. In real applications the efficiencies of the converters are not 100% since there are losses associated with switching, conduction, and heat generation [19]. In the case of the dimensioning of the B pack and the UC bank, it is not realistic to have a sizing of the different energy sources for each type of terrain or driving cycle; in a real vehicle the driver drives randomly on different land types such as city, urban, semi-urban, etc. This work focuses on the analysis and evaluation of an HEV with a multiple converter configuration in the powertrain. Multiple converter configuration has not been examined analytically to investigate the performance of a hybrid electric vehicle. The following section describes vehicle characteristics (case study) in conjunction with the energy storage system and the Energy Management Strategy (EMS). An energy management strategy is one that allows B and UC operating restrictions to be met in order to operate both sources safely to meet the load demand [14,17,18,20]. Energy management strategies are aimed at improving vehicle performance, taking care of battery life, and increasing autonomy. In this work the EMS is chosen from the literature since the purpose is to analyze C-MC topology in HEV performance.

2.5. Vehicle Characteristics, Powertrain, and Energy Management Strategy

A vehicle with the characteristics listed in the table below is used for the analysis of the multiple converter configuration [5]. The vehicle equations are taken from Guzzella and Antonio [3] and Morales-Morales, Cervantes, and Cano-Castillo [5] with the characteristics shown in Table 1.
Table 2 shows the parameters of the vehicle powertrain system consisting of a B pack, a UC bank, converters (C), and motor (M). Each of the parameters is detailed in the modeling section of the multiple converter configuration.
To analyze the C-MC, in addition to the powertrain and vehicle characteristics, an energy management strategy is needed to distribute power between the energy sources and the load. The EMS used in this work has the following characteristics (see Table 3): (i) the batteries have the capacity to meet the load demand; (ii) the UCs have the capacity to meet the load demand; (iii) regenerative braking is considered for recharging Bs and UCs; (iv) Bs and UCs work together when required and have the capacity to meet the load demand; (v) the battery considers a minimum and maximum state of charge; (vi) the UC considers a minimum and maximum state of charge; (vii) the B and UC consider a minimum and maximum current. The variables and parameters shown in Table 3 are described in more detail in Section 2.6.
EMS restrictions improve vehicle performance. In addition to the above, the analyzed configuration in this work was subjected to different terrain conditions: city and semi-urban. These terrain conditions were met through driving cycles or driving patterns. Different patterns represent various energy demand conditions which may arise during the trip of a vehicle. Driving patterns are speed versus time profiles under different traffic scenarios (urban, semi-urban, road); there are standard driving patterns that are used in the automotive industry to assess vehicle performance [3,21].

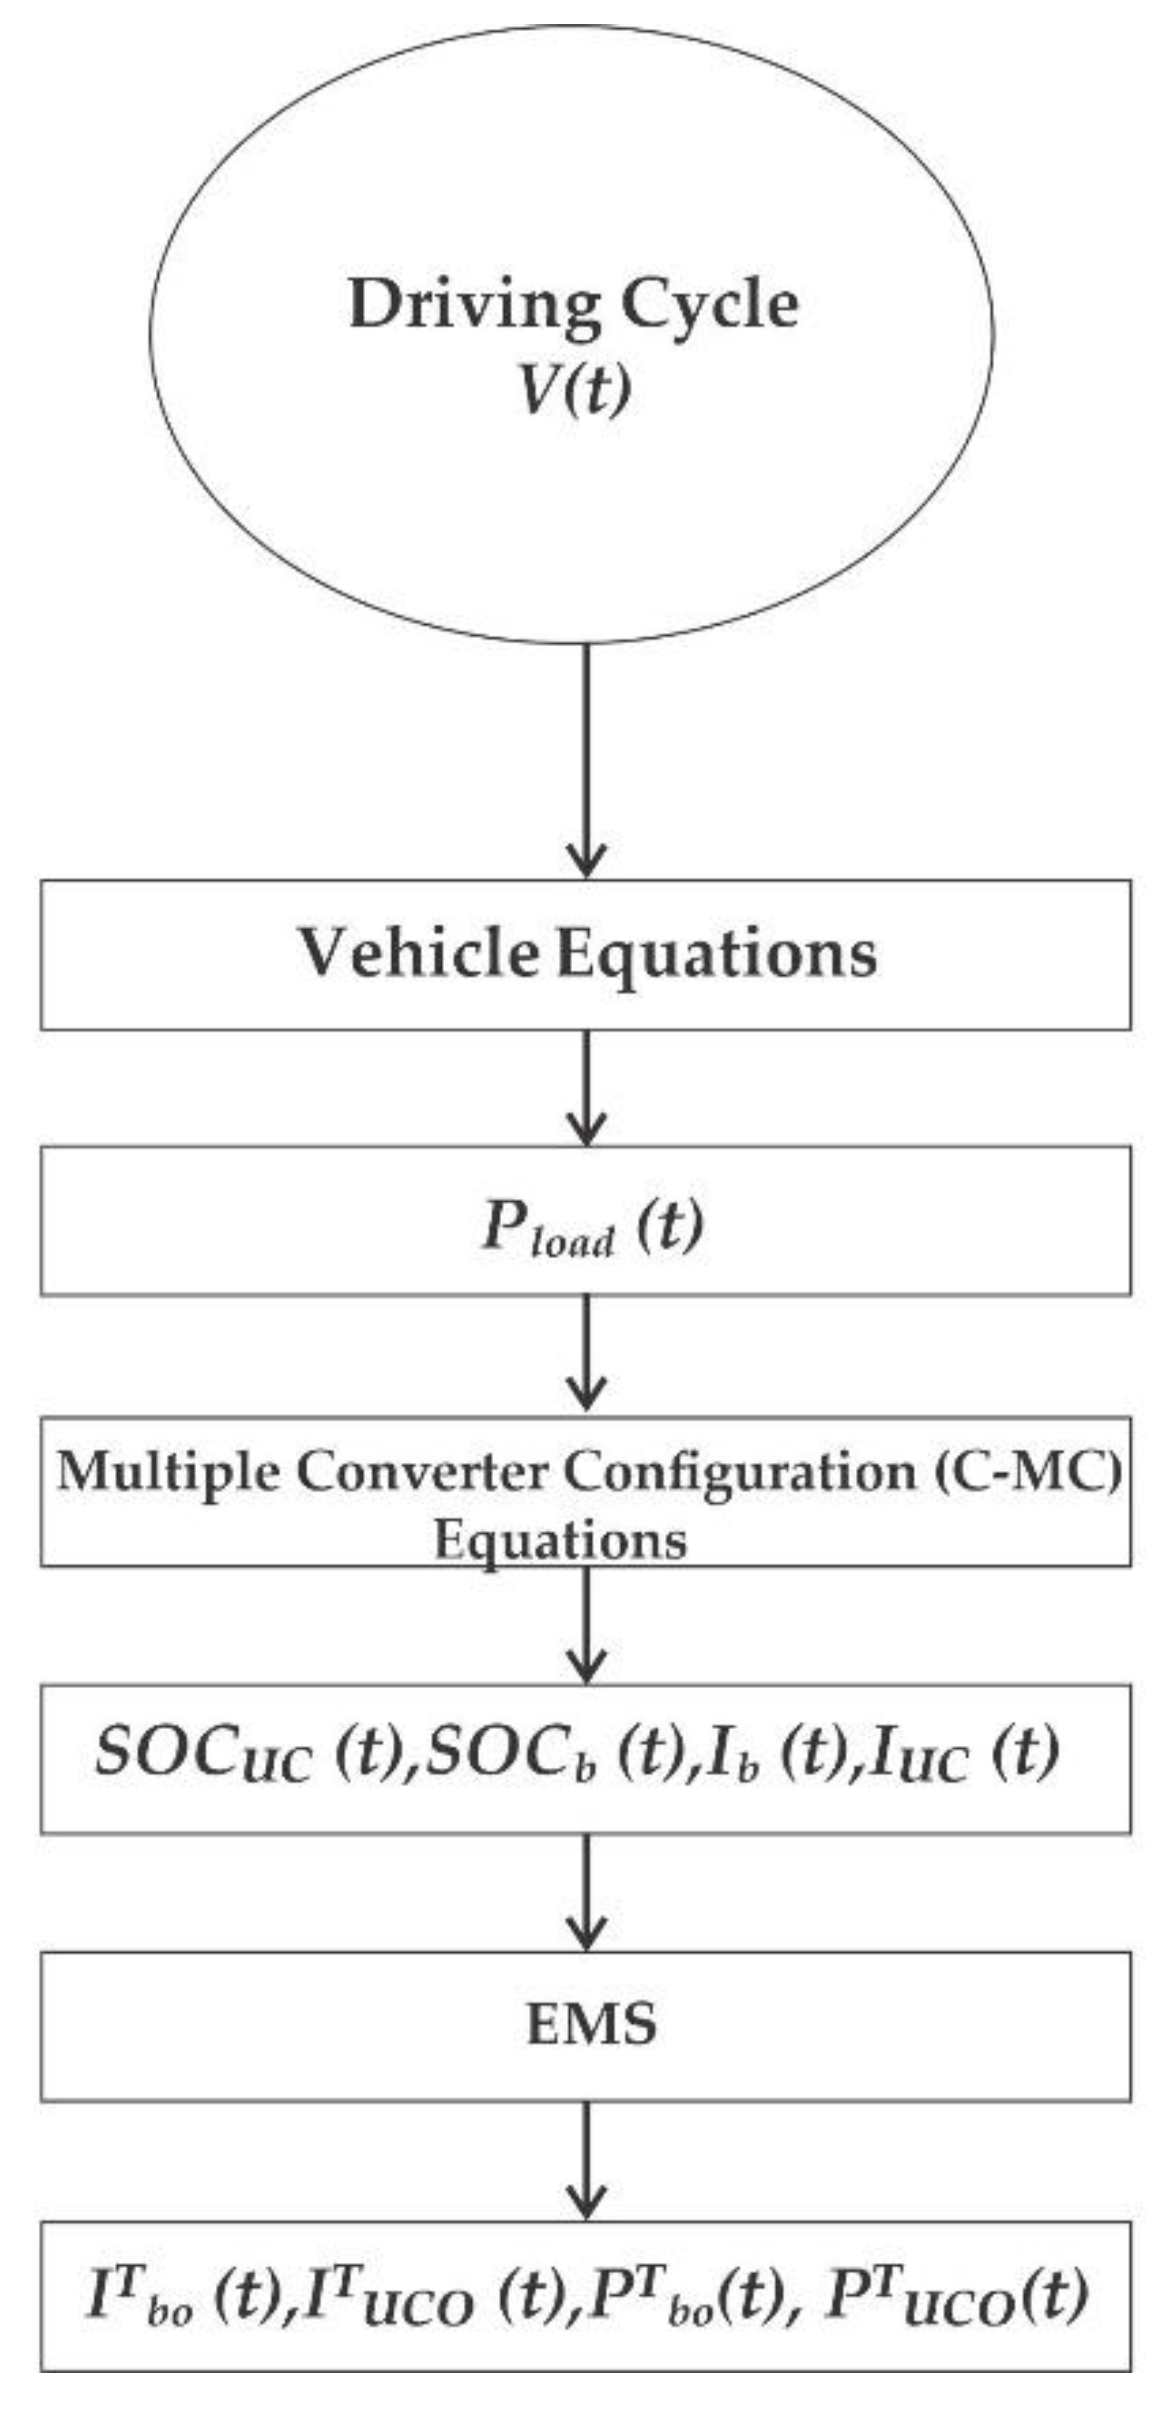
2.6. Multiple Converter Configuration Model (C-CM)

The multiple converter configuration (C-CM) shown in Figure 4 has a powertrain consisting of a B pack, two bidirectional converters (DC/DC), a UC bank, and an electric motor (M). Bidirectional converters have the function of regulating the energy of the power sources. These sources have the ability to deliver power to the load (motor) or receive power to recharge through the converters. The electric motor can act as a generator when there is regenerative braking. Regenerative braking is a vehicle braking mechanism that allows electric power to be generated from kinetic energy, usually to recharge storage devices (Bs or UCs). In the literature there are complex HEV models [12,13] and electrical models of HEVs as in a study by Heidrich et al. [10]. These electric models consider relevant components to model energy conversion phenomena. In the analytical framework, the electrical model allows data to be constituted in physically significant energy flows and therefore provides relevant information from the HEV towards the improvement of its design as set forth in this work. For the modeling of the configuration, the electric models of the battery (B), UC, motor (represented by a variable resistance), and converters, taking into account the power balance across its efficiencies, are considered. The electric models of the B and UC were taken from the literature [18,22,23]. These models offer simplicity compared to other electrical models that are complex in terms of mathematical analysis.

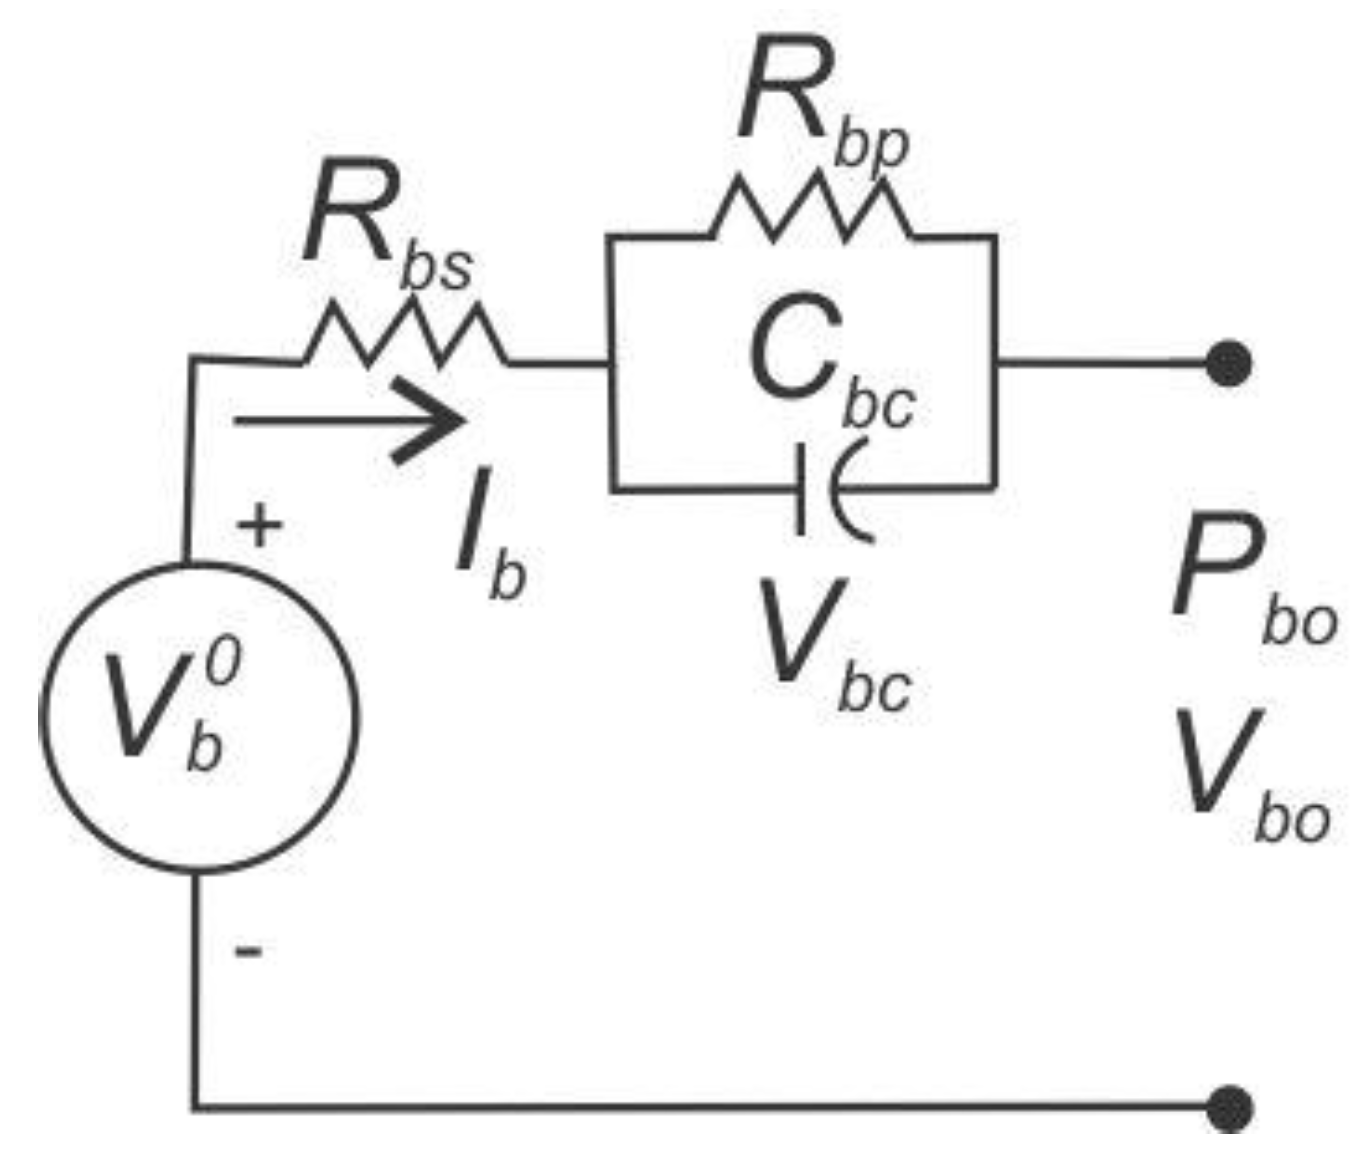
2.6.1. Battery Electrical Model

The battery is represented by a resistor–capacitor (RC) circuit as shown in Figure 5.
The battery voltage V b is defined in the following equation:
V b o = V b 0 ( t )     R b s I b ( t )     V b c ( t )
where V b o is the voltage at the battery terminals, V b 0 is the open circuit voltage of the battery and is given by V b 0 ( t ) = c 1 + c 2 S O C b ( t ) , where c 1 and c 2 are constants obtained from the specification sheet of the selected battery. The resistance R b s is the battery’s internal resistance, and C b p represents the dynamic response of the battery due to the diffusion of lithium ions. The battery current is given by I b where I b < 0 is considered for battery charging and I b > 0 is considered for battery discharge. V b c is the voltage drop in the sub-circuit R b p in parallel with C b p . The voltage dynamics between the capacitor terminals C b p are:
C b p d V b c ( t ) d t = I b ( t ) V b c ( t ) R b p
The state of charge (SOC) is expressed in the following equation:
S O C b ( t ) = S O C b ( t 0 ) t 0 t I b ( t ) C o ( t )
where C o is the battery’s nominal capacity. Equation (3) shows that the state of charge S O C b is a time-dependent variable that has an initial condition that depends on the amount of charge that is extracted or stored in the battery. Such amount of charge is calculated by integrating the current I b over time.

2.6.2. UC Electrical Model

The UC is represented by an RC circuit as shown in Figure 6:
The elements that make up a capacitor electrical model are equivalent resistors and capacitors. An internal resistance of the UC (load) and the self-discharge resistance represent the chosen model. The voltage equation at the ultracapacitor terminals V u c o is:
V u c o = V u c R u c s I u c
where C u c is the UC capacitance, R u c s is the equivalent internal resistance, I u c is the current that flows through the ultracapacitor, and V u c o is the voltage found in the ultracapacitor terminals. In this work the resistance R u c p is considered with high resistance values in such a way that it is represented by an open circuit. The voltage dynamics in the capacitor C u c are given by the following differential equation:
C u c d V u c d t = I u c
The state of charge of the UC can be determined as follows:
S O C u c = ( V u c o / V u c _ m a x ) 2
The above equation determines the UC state of charge depending on its voltage given by V u c o and the maximum UC voltage ( V u c _ m a x ).

2.6.3. DC/DC Converter

A power converter is an electronic system or equipment that aims to convert electrical energy between two different formats: continuous current from alternating current or direct current to direct current [19]. The initial converter concept can be extended to include aspects, such as efficiency, reversibility, degree of ideality, reliability, volume, or technology, to name the most important. Figure 7 shows the different parts that make up the powertrain of the multiple converter configuration as well as the electrical inputs and outputs that are involved in said system.
In an ideal converter the input power is equal to the output power; that is to say it has an efficiency of 100% ( η c o n v = 1 ) . There are no energy losses. If 100% efficiency is considered for the battery converter in this work, the output power of the converter is expressed as:
P b _ c o n v = P b o T
where P b o T is the total power delivered by the battery pack. In real life Equation (7) is not fulfilled since there are energy losses in the converter components [19]. In a real case the efficiency of a converter is less than 100%. In this case the input and output powers are related as follows:
P b _ c o n v = η b _ c o n v P b o T
where P b _ c o n v is the output power of the battery pack converters and P b o T is the total power delivered by the B pack, and η b is the efficiency of the converter connected to the batteries with 0 < η b _ c o n v < 1 . For the UC converter the output power of the converter is given by:
P u c _ c o n v = η u c _ c o n v P u c o T
where P u c _ c o n v is the output power of the ultracapacitor bank converters, P u c o T is the total power delivered by the UC bank, and η u c _ c o n v is the efficiency of the converter connected to the batteries with 0 < η b _ c o n v < 1 . Figure 2 shows that the output voltage in both converters is equal to the load voltage since they are connected in parallel, that is:
V l o a d = V b _ c o n v = V u c _ c o n v
where V b _ c o n v is the voltage that is at the output of the battery converter, V u c _ c o n v is the voltage that is at the output of the UC converter, and V l o a d is the voltage of the charge or motor.

2.7. Electrical Model of the B Pack and the UC Bank

In the powertrain you need a B pack and a UC bank to meet the vehicle charge demand; in this situation parameters n s b and n p b are established as the number of batteries in series and in parallel, and n s u c and n p u c are the number of ultracapacitors in series and in parallel, respectively.
The total power of the battery pack (Figure 7) is determined by the following expression:
P b o T = V b o T I b o T
where V b o T is the total voltage provided by the B pack and I b o T is the total current provided by the B pack. The variable V b o T is described by the following equation:
V b o T = n s b   V b 0 V b c R b s I b )
The total current of the B pack I b o T is given by the following equation:
I b o T = n p b I b
where n b p is defined as the number of batteries connected in parallel. By replacing Equation (13) in Equation (11) I b is calculated as follows:
I b = P b o T n p b V b o T
To calculate the current flowing through each of the batteries, Equation (14) is replaced by Equation (12) giving us:
I b = P o b T n p b ( n s b ( V b 0 V b c R b s I b ) )
Quadratic Equation (14) is used to calculate the values of I B :
I b = V b 0 V b c 2 R b s ( V b 0 V b c 2 R b s ) 2 P b o T n p b n s b R b s
From the previous equation it is seen that there are two values of I b ; the negative value is taken as it represents the real values of I b .
The UC bank also supplies power to the load and is calculated as:
P u c o T = V u c o T I u c o T
where I u c o T is the total current that depends on the current flowing in each ultracapacitor and V u c o T represents the voltage dynamics of the UCs and is calculated as follows:
V u c o T = n s u c   ( V u c R u c s I u c )
The total current of the UCs is calculated through the number of ultracapacitors connected in parallel and calculated as:
I u c o T = n p u c I u c
where I s u c can be calculated from the previous equation:
I u c = P u c o T n p u c V u c o T
In Equations (8) and (9), P b _ c o n v and P u c _ c o n v are the powers at the output of the converters of the B pack converters and the UC bank, and are calculated from the total power of the B pack and of the UC bank in conjunction with their respective efficiencies ( η b _ c o n v and η u c _ c o n v ). Through this, the demand for load power is determined as follows:
P l o a d = P b o T η b _ c o n v + P u c o T η u c _ c o n v
Using the previous equation, P u c T is expressed as follows:
P u c o T = P l o a d P b o T η b _ c o n v η u c _ c o n v
Substituting Equations (17) and (19) into (22), we get the values of I u c :
I u c = V u c 2 R u c s ( V u c 2 R u c s ) 2 P l o a d P b o T η b _ c o n v η u c _ c o n v n p u c n s u c R u c s
Note that until now the dynamic model of the converter was not necessary since the power transfer is carried out independently of the converter type. Note that in the equations of currents I b and I u c the values within the radical must be greater than zero for the values of the currents to be real numbers. This limits the number of Bs and UCs in series and parallel in the powertrain depending on the maximum power of both energy sources and load demand.
In Table 3, P u c _ c o n v 1 = η u c _ c o n v P u c _ c , where P u c _ c is the power of the UC bank and the ultracapacitor load is made with the maximum current allowed by the manufacturer as set forth in Table 2. ( I u c   m a x ) is calculated with the product given by Equation (17). P b _ c o n v 1 = η b _ c o n v P b _ a v , where P b _ a v is the average power of the cycle. P b _ c o n v 2 = η b _ c o n v P b _ c , where P b _ c is the maximum battery charge allowed by the manufacturer, which depends on the amount of regenerated power of P l o a d .

3. Results and Discussion

Two driving cycles are used: CITY II and ECE. The CITY II (city driving schedule in New York) cycle is a city driving pattern that has the characteristic of having stop-and-go traffic conditions at low speeds. This type of cycle is used for all types of vehicles, and the total distance covered in this driving cycle is 6211.5 m with a duration of 867 s. The ECE driving cycle consists of two parts where ECE part 1 represents the elementary urban cycle and ECE part 2 represents extra-urban driving cycle. Where part 1 has the characteristic of lasting 196 s and traveling 994.6 m, part 2 has a duration of 400 s and a total distance of 6955.07 m. For both parts it lasts 596 s with a distance of 7.9496 km.

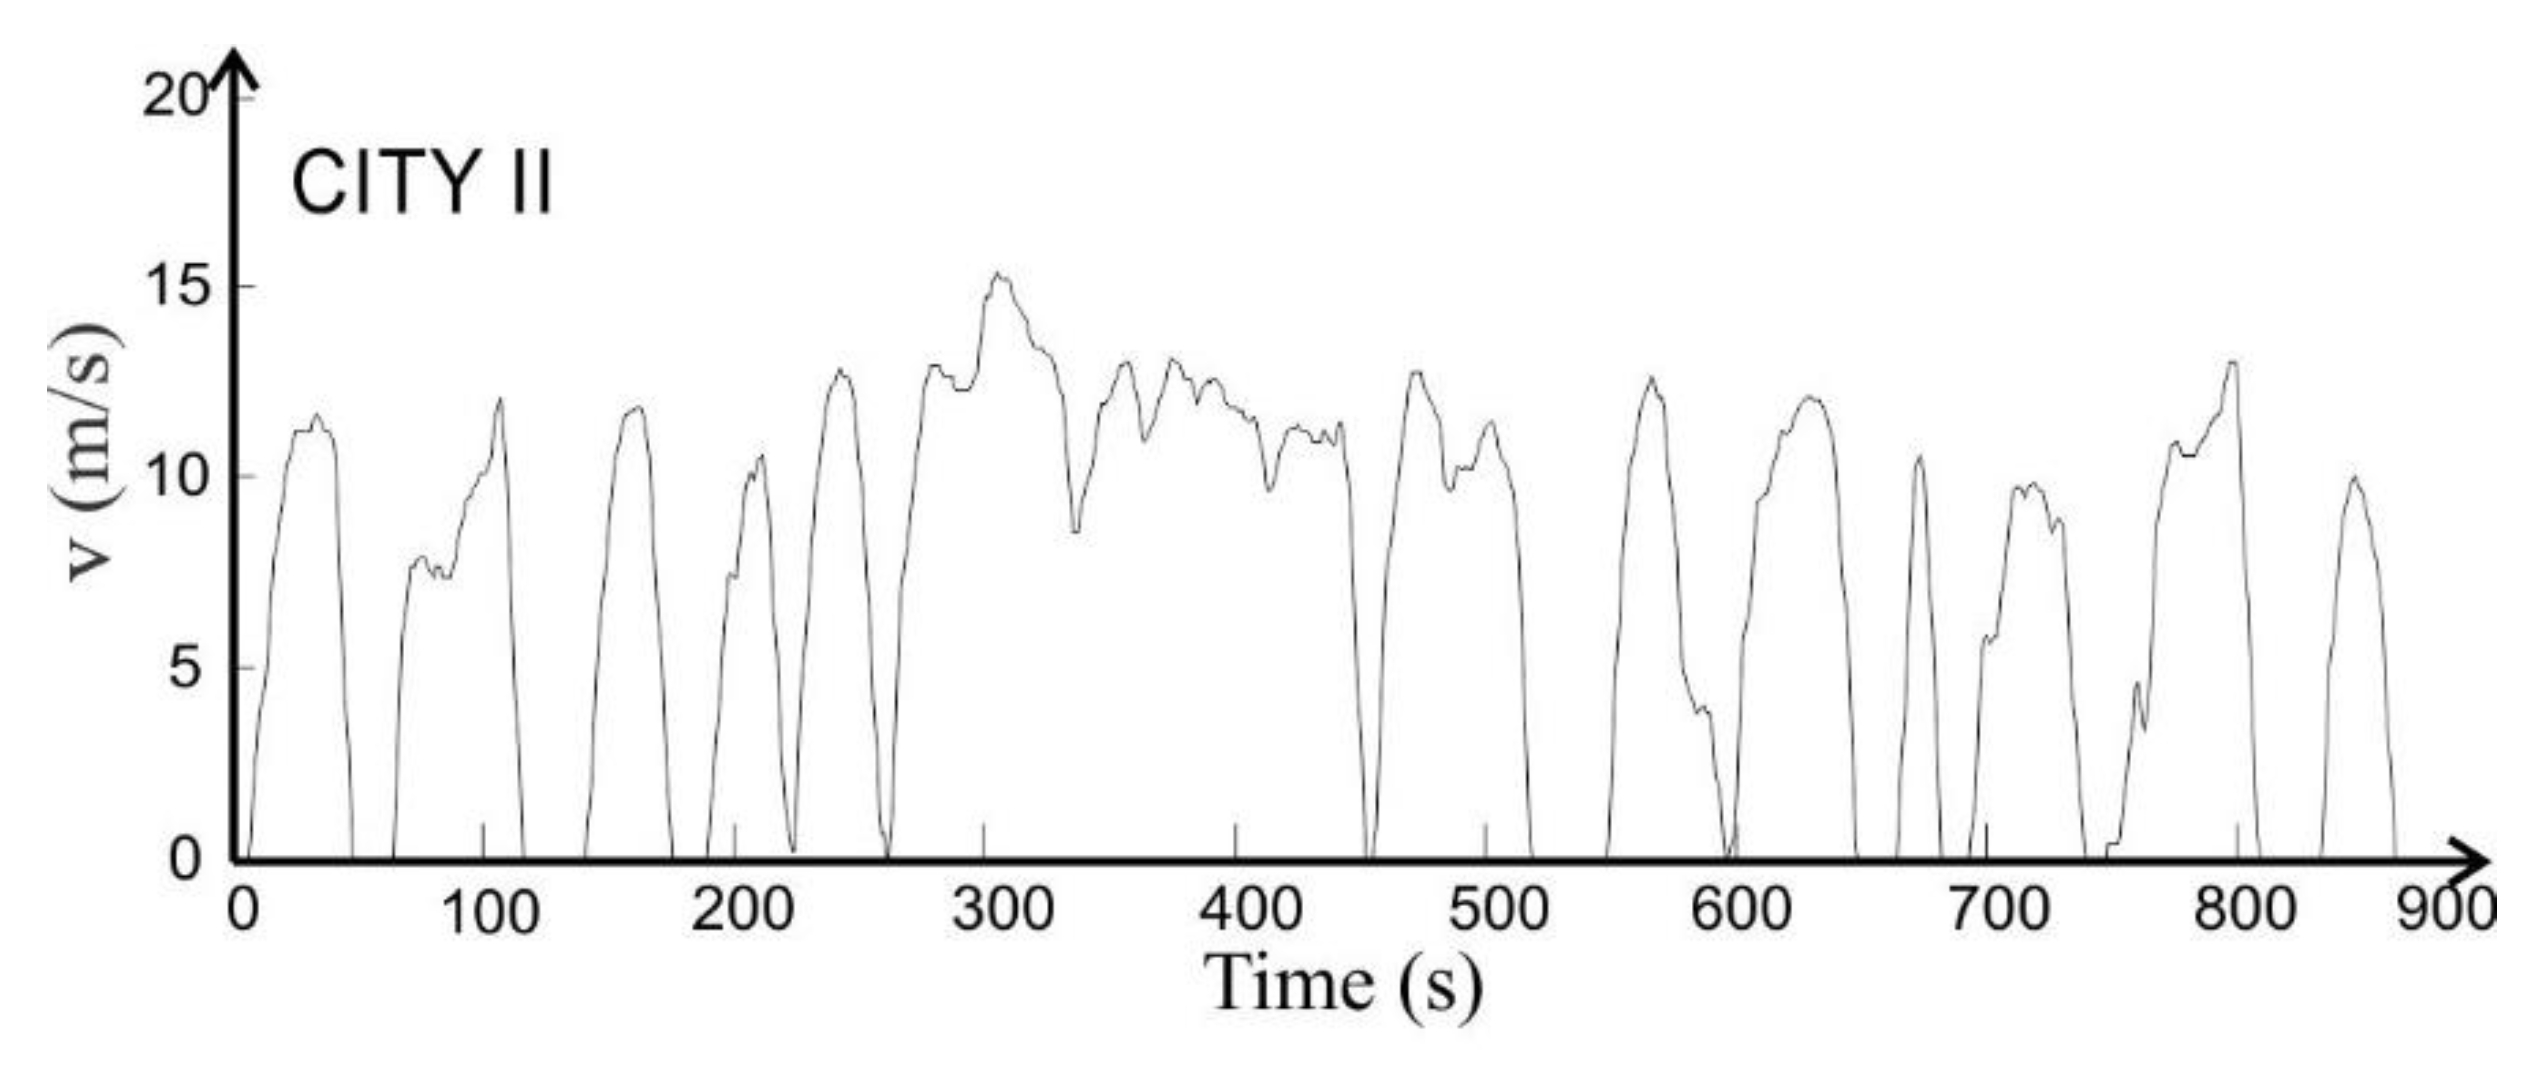
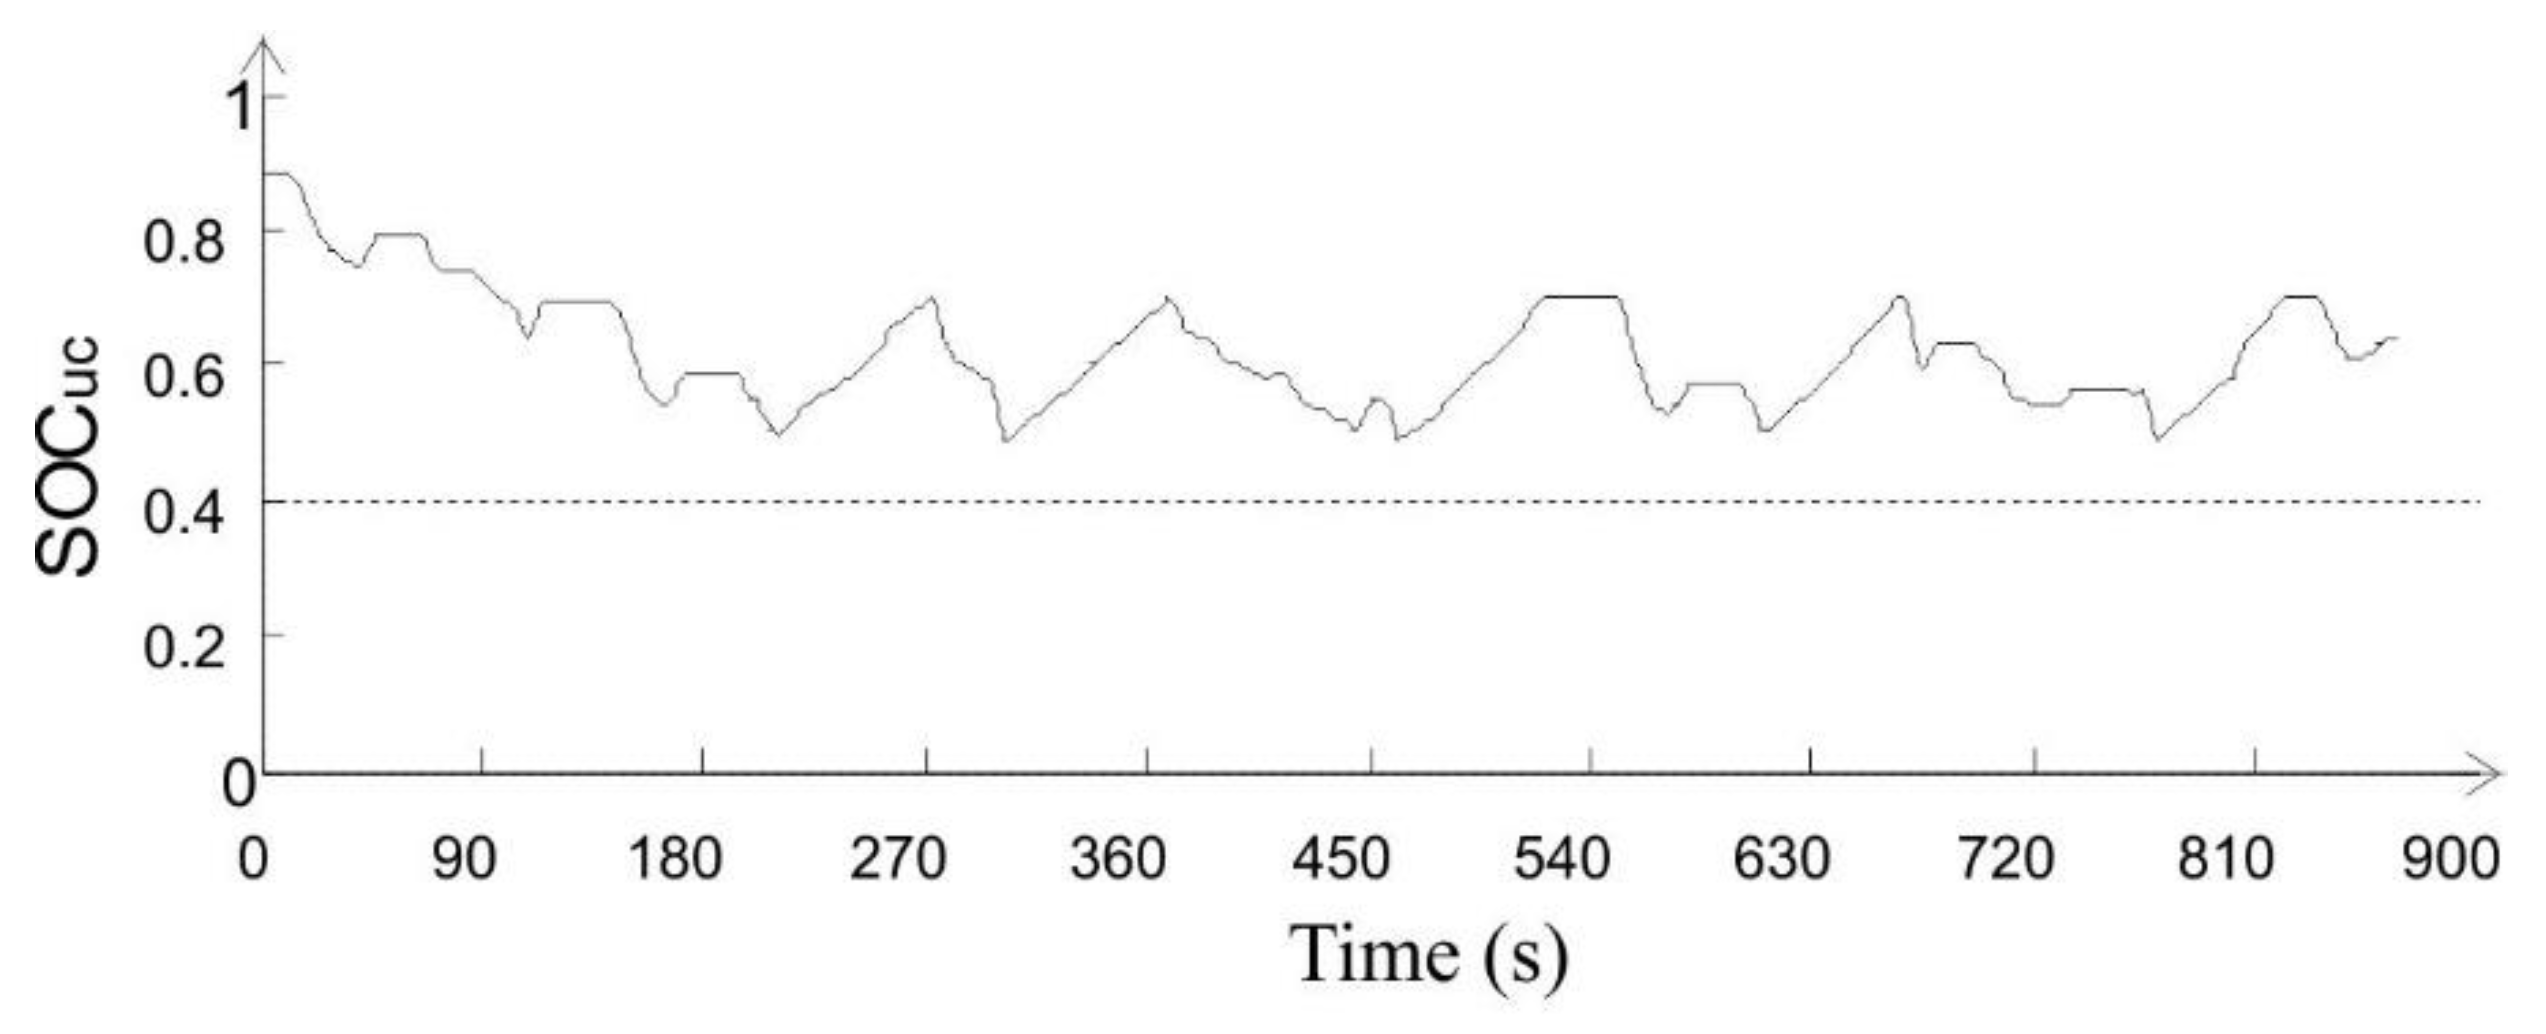
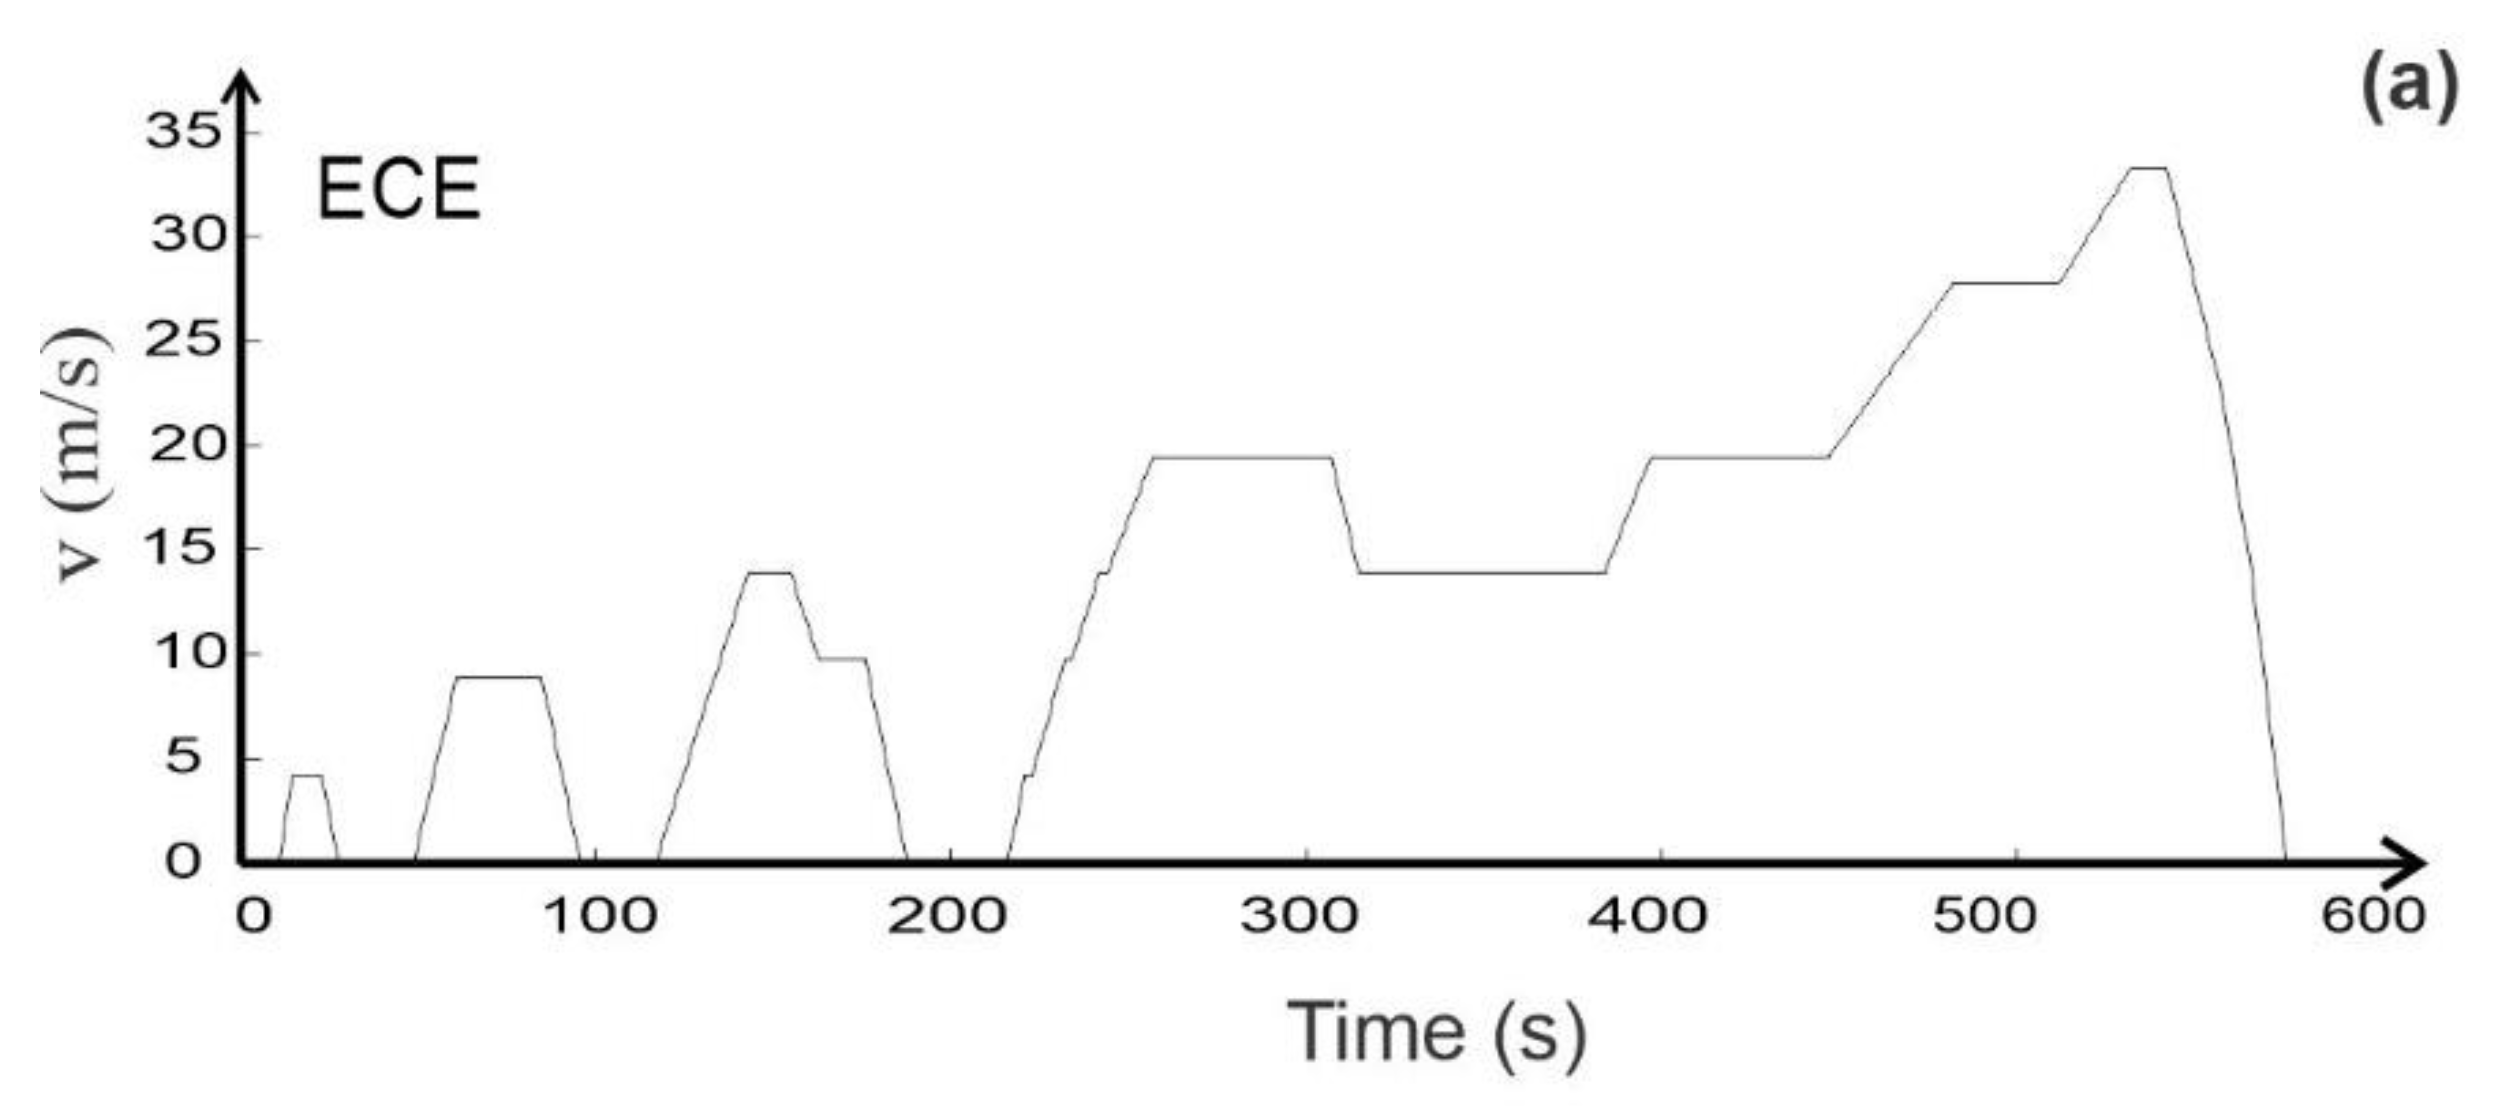
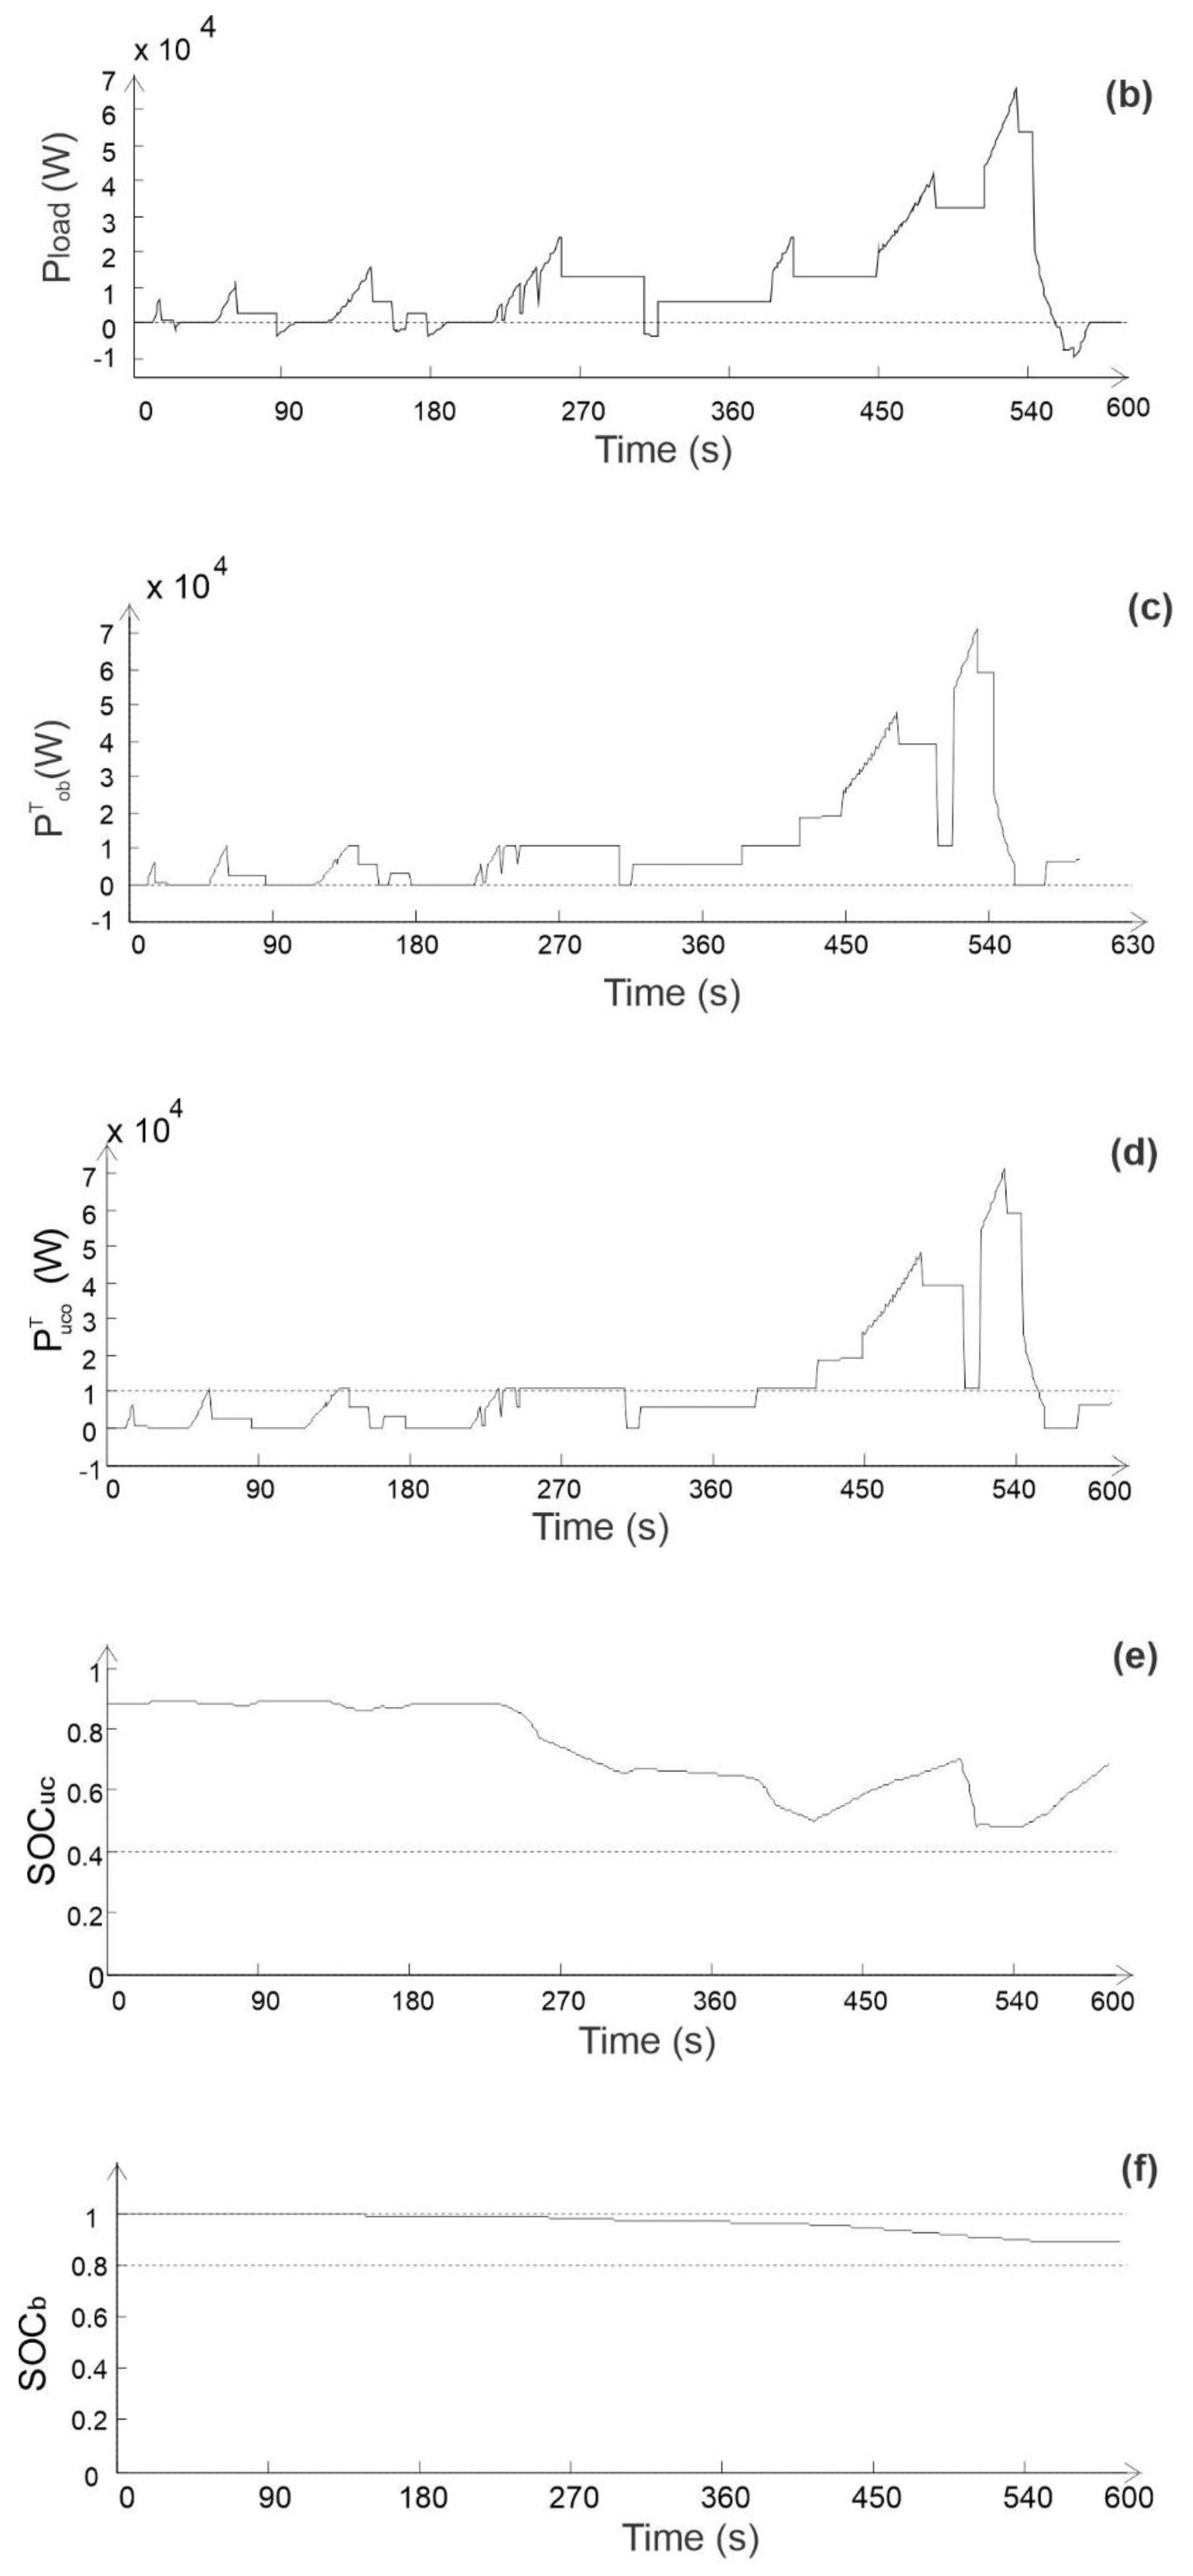
3.1. Simulation of the C-CM in the Vehicle Powertrain Under Two Terrain Conditions by Means of the CITY II and ECE Driving Cycles

Figure 8 and Figure 9 show the speed profile of the CITY driving cycle and the load power demand of the vehicle with the characteristics given in Table 1.
In the previous figures you see the dynamics of city driving with different speeds in a city reflected in the demand for intense power. Note that the P l o a d profile shows very frequent negative powers at different time intervals due to the frequent regenerative braking typical in a busy city. Positive or greater than zero powers represent the power consumption of the vehicle while negative or less than zero powers are the energy due to regenerative braking; finally, if the power is zero there is no energy consumption in the vehicle. Figure 10 and Figure 11 represent the power delivered by the B pack and UC bank.
The power delivered by the Bs and the UCs is defined by the EMS, taking into account the parameters of Table 1 and Table 2. This power distribution between the Bs and the UCs satisfies the load demand in order to operate the vehicle at the speeds given by the CITY cycle. The charge states of the B pack and the UC bank are shown in Figure 12 and Figure 13.
Figure 12 represents the load of the B pack taken at each moment of time throughout the handling cycle where the number one represents 100% charge and zero represents zero charge in the pack. Figure 13 represents the state of charge of the UC bank at each instant of time throughout the handling cycle where the number one represents 100% charge and zero represents zero charge.
Figure 14 shows the results of the multiple converter configuration in the vehicle powertrain before an ECE driving cycle.
The description of the previous images is analogous to what is presented in Figure 8, Figure 9, Figure 10, Figure 11, Figure 12 and Figure 13 with the exception that in this case the dynamics are not as intense as in the previous case due to semi-urban terrain conditions (Figure 14a) also reflected in the power profile (Figure 14b).
Figure 8, Figure 9, Figure 10, Figure 11, Figure 12, Figure 13 and Figure 14 show that the power profile demanded of the city vehicle (Figure 8) has an intense dynamic compared to the ECE driving cycle (Figure 14a) because in the city, the driver accelerates and brakes more frequently than in semi-urban conditions. The above affects the P l o a d profile where very frequent negative powers are observed at different time intervals in the CITY cycle from the multiple regenerative brakes compared to the ECE where there is less regenerative braking; this results in less energy available to recharge Bs or UCs if required by EMS. In the power distribution between Bs and UCs to meet the load demand defined by the EMS, the power profile delivered by the batteries (see Figure 10 and Figure 14c) only has positive powers for both driving cycles. Therefore, the regeneration energy was not necessary since the Bs have a sufficient load (see Figure 12 and Figure 14f) and can be used to provide energy throughout the handling cycles (see Figure 8 and Figure 14a), unlike the UC power profile (see Figure 11 and Figure 14d) where clearly negative powers are reflected in the UC bank recharge (Figure 13 and Figure 14e) at different time intervals. The UC bank in both driving cycles delivers energy just like the batteries (see Figure 13 and Figure 14e); through the EMS there is recharge of the UCs through regenerative braking or by Bs in both sets of simulations for the CITY and ECE cycles. The discharge occurs when the EMS defines that the UCs deliver power to the motor, and this happens when there is demand reflected in the positive power and the operating restrictions in the EMS are satisfied to make this happen. In both driving cycles the battery acts as the main source and the regenerative braking has no influence on the recharging of the batteries compared to the UCs which are recharged by said brakes or batteries.
Finally, it is observed that the studied configuration behaves differently depending on the terrain conditions to which the vehicle is subjected to, reflected in the state of charge of the UC bank and B pack. In the ECE cycle in the studied configuration, more energy is extracted from the B pack than in the CITY II cycle reflected in the state of charge at the end of the cycle (SOCb_ECE = 88% and SOCb_CITY = 92%). However, the state of charge of the UC bank is higher in the ECE cycle than the CITY, which implies that the UC bank is more charged in semi-urban conditions than in the city. In both cycles the configuration studied satisfies the load demand. However, these results do not clarify whether the studied configuration influences the performance of the vehicle since in both cases the load demand is satisfied. To shed more light on this question it is necessary to compare it with other configurations under the same conditions. Therefore, two tests are proposed: (i) compare the configuration studied against other typical configurations of a vehicle and (ii) calculate the autonomy of the configuration studied versus other configurations. In both tests, city (CITY cycle) and semi-urban (ECE cycle) terrain conditions are considered.

3.2. Multiple Converter Configuration Versus Typical Configurations

This section analyzes the performance of the multiple converter configuration (C-MC) against typical configurations: battery-ultracapacitor configuration (C-B/UC) and ultracapacitor-battery configuration (C-UC/B). The simulation results of the C-MC against the CB/UC and C-UC/B are shown in Table 4. In the comparison of configurations, Δ S O C b is taken into account, which represents the difference between the initial and end state of the battery S O C b when the driving cycle concludes. The difference between the initial and final state of the S O C u c of the UCs at the end of the driving cycle is represented by Δ S O C u c . Information on the energy delivered by the batteries ( E b ) and UCs during the driving cycle for each configuration ( E u c ) is also presented.
Table 4 shows that Δ S O C b and E b remain the same for all configurations before the CITY II driving cycle, that is, in this cycle the same amount of energy is extracted from the batteries and therefore the state of charge of the batteries is the same at the end of the cycle in all configurations (CB/UC and C-UC/B). Table 4 shows that in the CITY II cycle the Δ S O C u c in the C-MC is greater than that of other configurations, which means that the state of charge of the ultracapacitors at the end of the cycle is lower compared to that of other configurations. This is reflected in energy consumption where it is observed that E u c in C-MC is greater than in the other configurations. In the ECE driving cycle, Δ S O C b of the MC configuration is slightly higher compared to that of the other configurations. The result above means that the battery pack at the end of the C-MC cycle is less charged than the other configurations although the difference is not very significant. The above is reflected in E b where the amount of energy consumed is greater compared to the other configurations. In the case of the ECE cycle, the C-MC shows a Δ S O C u c greater than C-B/UC and C-UC/B which means that the energy consumed throughout the cycle is less than the energy consumed in the other configurations.
In summary, in the CITY II scenario, all the configurations (taking into account that the battery acts as the main power source) present the same energy consumption. In this particular case, any configuration is adequate to meet the need for power demand in a city. In the scenario with ECE, the C-UC/B shows less energy consumption compared to the C-B/UC and C-CM. However, in this case the variations in energy consumption between the configurations are not very significant, so you are free to choose any configuration. However, for both scenarios the C-MC has the advantage of having two converters, which allow better control of energy flow for both energy sources unlike the other configurations.

3.3. Autonomy of the Multiple Converter Configuration Versus Typical Configurations

This section analyzes the autonomy of the multiple converter configuration (C-MC) against typical configurations (C-B/UC, C-UC/B). The multiple converter configuration simulation results against the configurations are shown in Table 5. The following table shows the autonomy of the different configurations before different driving cycles by discharging the batteries at their minimum charge state.
The above table shows that C-UC/B has greater autonomy in both scenarios (with CITY II and ECE cycles) compared to C-MC and C-B/UC. The C-MC has a better autonomy of the HEV unlike the C-B/UC before the CITY II management cycle, although the difference is not significant. Despite the above, the C-MC before the ECE cycle has less autonomy than that of the other configurations. In the scenario of vehicle autonomy analysis, it is clear that the C-MC configuration has lower performance compared to the other configurations before the two driving cycles. In this sense between the two remaining configurations (C-MC and C-B/UC) with a single converter, the C-B/UC configuration has better performance compared to C-B/UC in the same scenarios. Despite the results presented in this work directed towards the C-MC, it has the advantage of having a better energy flow due to the two converters, thus improving the safety of the vehicle.
The power demand P_load is calculated using the methods of Morales-Morales and colleagues [5] through vehicle equations [3,5] with the characteristics shown in Table 1. All equations were programmed in MATLAB. Figure 15 shows the flow chart how the results were calculated in this work.

4. Conclusions

In this paper we analyzed the multiple converter configuration of a hybrid electric vehicle powertrain. Said powertrain configuration was modeled using electrical elements. In the C-CM model it was observed that there are limitations in the choice of the number of Bs and UCs in the powertrain depending on the maximum power of both sources of energy and load demand of the vehicle (see Equations (16) and (23)). The model was simulated in a vehicle study case and submitted to two terrain conditions (CITY and ECE). In the results it was observed that the variables of interest of the C-CM before a case study behave differently depending on the terrain conditions to which the vehicle is subjected, mainly reflected in the state of charge of the UC bank and B pack. In the ECE cycle, in the C-CM, more energy is extracted from the B pack than in the CITY II cycle, taking into account the state of charge at the end of the cycle (SOCb_ECE = 88% and SOCb_CITY = 92%). However, the state of charge of the UC bank is higher in the ECE cycle than the CITY, which implies that the UC bank is more charged in semi-urban conditions than in the city. The HEV with C-CM was also evaluated against the C-B/UC and C-UC/B configurations regarding the energy delivered by the batteries and the state of charge of the sources. All these results were obtained in the same scenario (ECE and CITY II management cycles). In summary, it was observed that in the scenario with CITY II all the configurations have the same energy consumption reflected in the state of charge of the B pack (96%). In this particular case it is thought that any configuration would be adequate to meet the power demand in a city. In the scenario with ECE, the C-UC/B has less energy consumption compared to the C-B/UC and C-CM (E_b (J) = 5.5394 × 10 6 J). However, in this case the variations in energy consumption between the configurations are not very significant, so you are free to choose any configuration. In addition to the above, the autonomy of the C-CM versus C-UC/B and C-B/UC was also determined and compared. In the scenario of the HEV autonomy analysis, it is evident that C-MC shows lower performance (77,285 km in CITY and 74.44 km in ECE) compared to the other configurations due to the two driving cycles. In this sense, between the two remaining configurations (C-UC/B and C-B/UC) with a single converter the C-B/UC configuration has better performance compared to C-B/UC in the same scenarios. However, in the case of CITY, the difference between the autonomies of the C-CM (77.285 km) and C-B/UC (77,357 km) configurations is not very significant, so any of the configurations can be chosen. In both scenarios (CITY and ECE) the C-UC/B configuration presents better autonomy. Despite the results presented in this work directed towards the C-MC, it has the advantage of having better control of energy flow due to the two converters that it has, thus improving the safety of the HEV. Finally, throughout this work it was shown that the choice of the propulsion system configuration must be taken into account because it influences the performance of the vehicle independently of the types of terrain, EMS chosen, as well as sizing of the powertrain to which the vehicle is subjected.

Author Contributions

Conceptualization, I.C.-C., M.A.R.-C., and H.B.S.; resources and materials, M.A.R.-C., J.M.-M., V.A.R.H., and P.C.-A.; writing—original draft preparation, P.C.-A., and V.A.R.H.; writing and analysis, P.C.-A. and J.M.-M.; writing—review and editing, P.C.-A. and J.M.-M. All authors discussed the results and contributed to the final manuscript. All authors have read and agreed to the published version of the manuscript.

Funding

This research received no external funding.

Conflicts of Interest

The authors declare no conflicts of interest.

References

  1. Talluri, G.; Grasso, F.; Chiaramonti, D. Is Deployment of Charging Station the Barrier to Electric Vehicle Fleet Development in EU Urban Areas? An Analytical Assessment Model for Large Scale Municipality-Level EV Charging Infrastructures. Appl. Sci. 2019, 9, 4704. [Google Scholar] [CrossRef] [Green Version]
  2. Cao, Y. Small-Signal Modeling and Analysis for a Wirelessly Distributed and Enabled Battery Energy Storage System of Electric Vehicles. Appl. Sci. 2019, 9, 4249. [Google Scholar] [CrossRef] [Green Version]
  3. Guzzella, L.; Antonio, S. Vehicle Propulsion System: Introduction to Modelling and Optimization; Springer: Berlin/Heidelberg, Germany; New York, NY, USA, 2007. [Google Scholar]
  4. Wang, Z.; Cai, Y.; Zeng, Y.; Yu, J. Multi-Objective Optimization for Plug-In 4WD Hybrid Electric Vehicle Powertrain. Appl. Sci. 2019, 9, 4068. [Google Scholar] [CrossRef] [Green Version]
  5. Morales-Morales, J.; Cervantes, I.; Cano-Castillo, U. On the Design of Robust Energy Management Strategies for FCHEV. IEEE Trans. Veh. Technol. 2015, 64, 1716–1728. [Google Scholar] [CrossRef]
  6. Manoharan, Y.; Hosseini, S.E.; Butler, B.; Alzhahrani, H.; Senior, B.T.F.; Ashuri, T.; Krohn, J. Hydrogen Fuel Cell Vehicles; Current Status and Future Prospect. Appl. Sci. 2019, 9, 2296. [Google Scholar] [CrossRef] [Green Version]
  7. Hu, J.; Jiang, X.; Jia, M.; Zheng, Y. Energy Management Strategy for the Hybrid Energy Storage System of Pure Electric Vehicle Considering Traffic Information. Appl. Sci. 2018, 8, 1266. [Google Scholar] [CrossRef] [Green Version]
  8. Kumar, M.S.; Revankar, S.T. Development scheme and key technology of an electric vehicle: An overview. Renew. Sustain. Energy Rev. 2017, 70, 1266–1285. [Google Scholar] [CrossRef]
  9. Híbridos y Eléctricos. Available online: http://www.hibridosyelectricos.com/estaticas/catalogo-de-vehiculos-hibridos-y-electricos (accessed on 5 March 2018).
  10. Heidrich, O.; Hill, G.A.; Neaimeh, M.; Huebner, Y.; Blythe, P.T.; Dawson, R.J. How do cities support electric vehicles and what difference does it make? Technol. Forecast. Soc. Chang. 2017, 123, 17–23. [Google Scholar] [CrossRef]
  11. Salisbury, M.; Toor, W. How and why leading utilities are embracing electric vehicles. Electr. J. 2016, 29, 22–27. [Google Scholar] [CrossRef]
  12. Moriarty, P.; Wang, S.J. Can Electric Vehicles Deliver Energy and Carbon Reductions? Energy Proc. 2017, 105, 2983–2988. [Google Scholar] [CrossRef] [Green Version]
  13. Du, J.; Ouyang, M.; Chen, J. Prospects for Chinese electric vehicle technologies in 2016–2020: Ambition and rationality. Energy 2017, 120, 584–596. [Google Scholar] [CrossRef]
  14. Armenta, J.; Núñez, C.; Visairo, N.; Lázaro, I. An advanced energy management system for controlling the ultracapacitor discharge and improving the electric vehicle range. J. Power Sour. 2015, 284, 452–458. [Google Scholar] [CrossRef]
  15. Cao, J.; Cao, B.; Bai, Z.; Chen, W. Energy-Regenerative Fuzzy Sliding Mode Controller Design for Ultracapacitor-Battery Hybrid Power of Electric Vehicle. In Proceedings of the 2007 International Conference on Mechatronics and Automation, Harbin, China, 5–8 August 2007; pp. 1570–1575. [Google Scholar] [CrossRef]
  16. Cao, J.; Emadi, A. A New Battery/UltraCapacitor Hybrid Energy Storage System for Electric, Hybrid, and Plug-In Hybrid Electric Vehicles. IEEE Trans. Power Electron. 2012, 27, 122–132. [Google Scholar] [CrossRef]
  17. Rosario, L.; Luk, P.C.K. Applying Management Methodology to Electric Vehicles with Multiple Energy Storage Systems. In Proceedings of the 2007 International Conference on Machine Learning and Cybernetics, Hong Kong, China, 19–22 August 2007; Volume 7, pp. 4223–4230. [Google Scholar] [CrossRef]
  18. Zamora Gómez, G.I. Efecto de la topología del tren de potencia en la vida de las baterías. Master’s Thesis, Instituto Potosino de Investigación Cientifica y Tecnologica, San Luis Potosí México, 5 January 2015. Available online: http://hdl.handle.net/11627/2852 (accessed on 10 May 2016).
  19. Rashid, M.H. Power Electronics—Devices, Circuits and Applications; Pearson Publishing: New York, NY, USA, 2014; ISBN-10 0133125904, ISBN-13 9780133125900. [Google Scholar]
  20. Galdi, V.; Piccolo, A.; Siano, P. A Fuzzy Based Safe Power Management Algorithm for Energy Storage Systems in Electric Vehicles. In Proceedings of the IEEE Vehicle Power and Propulsion Conference, Windsor, UK, 6–8 September 2006; pp. 1–6. [Google Scholar] [CrossRef]
  21. Barlow, T.; Latham, S.; Mccrae, I.; Boulter, P. A Reference Book of Driving Cycles for Use in the Measurement of Road Vehicle Emissions; Version 3; Automobiles, IHS: London, UK, 2009; p. 276. [Google Scholar]
  22. Einhorn, M.; Kral, C.; Fleig, J. Comparison, Selection, and Parameterization of Electrical Battery Models for Automotive Applications. IEEE Trans. Power Electron. 2013, 28, 1429–1437. [Google Scholar] [CrossRef]
  23. Nelms, R.M.; Cahela, D.R.; Tatarchuk, B.J. Modeling double-layer capacitor behavior using ladder circuits. IEEE Trans. Aerosp. Electron. Syst. 2003, 39, 430–438. [Google Scholar] [CrossRef]
Figure 1. Basic passive parallel configuration [7]. DC: direct current.
Applsci 10 01074 g001
Figure 2. Ultracapacitor/battery configuration [7]. DC/DC: direct current to direct current.
Applsci 10 01074 g002
Figure 3. Battery/ultracapacitor configuration [7].
Applsci 10 01074 g003
Figure 4. Multiple converter configuration (C-MC) [7].
Applsci 10 01074 g004
Figure 5. Battery electrical model.
Applsci 10 01074 g005
Figure 6. UC electrical model.
Applsci 10 01074 g006
Figure 7. Multiple converter configuration diagram.
Applsci 10 01074 g007
Figure 8. Speed profile of the CITY driving cycle.
Applsci 10 01074 g008
Figure 9. Vehicle load power profile.
Applsci 10 01074 g009
Figure 10. Battery pack power.
Applsci 10 01074 g010
Figure 11. UC bank power.
Applsci 10 01074 g011
Figure 12. Battery (B) pack state of charge.
Applsci 10 01074 g012
Figure 13. UC bank state of charge.
Applsci 10 01074 g013
Figure 14. Simulations of the multiple converter configuration in the face of ECE driving cycles. (a) Speed profile of the ECE driving cycle; (b) vehicle load power profile; (c) battery pack power; (d) UC bank power; (e) UC bank state of charge; (f) Battery (B) pack state of charge.
Applsci 10 01074 g014aApplsci 10 01074 g014b
Figure 15. Flowchart to obtain the presented results.
Applsci 10 01074 g015
Table 1. Vehicle parameters.
ParametersValue
Air density1.18 K g m 3
Rolling resistance coefficient0.014
Transmission ratio3
Crag coefficient0.5
Frontal area3.225 m 2
Gravity9.8 m s 2
Tire radius0.2651 m
Table 2. Powertrain parameters.
Battery: Valence Model U1–12xp UC: BMOD0165–Maxwell Model
R b s = 2.2   m Ω S O C b   m a x = 1 S O C u c   m a x = 1 V n o m = 48   V
R b p = 2.5   m Ω I b   m i n = 80 A I u c   m i n = 130 A R u c s = 6.3   m Ω
C b c = 20 kF I b   m a x = 80 A I u c   m a x = 130 A C u c = 165 F
S O C b   m i n = 0.2 I b c = 20 A I b c = 20 A S O C u c   m i n = 0.5
c 1 = 10 c 2 = 3 V m a x u = 51 V n p u c = 4
V n o m = 12.8V n p b = 5 n s u c = 2 S O C u c (to) = 0.8858
n s b = 5 P b _ c = 3024 W
Load: Curtis Motor 1236-6501 (72 V, 550 A)
V l o a d = V m o t o r = 96 V
Converter
η b _ c o n v = η u c _ c o n v = 0.9
V b _ c o n v = V u c _ c o n v = 96 V
Note: UC: ultracapacitor.
Table 3. Energy management strategy.
ConditionsPower Delivered by the Battery ConverterPower Delivered by the UC Converter
P l o a d = 0   S O C b > S O C b _ m i n
S O C u c > S O C u c _ m i n
P b _ c o n v = 0 P u c _ c o n v = 0
P l o a d > 0   S O C b S O C b _ m i n
S O C u c < S O C u c _ m i n
P b _ c o n v = P l o a d P u c _ c o n v P u c _ c o n v = P u c _ c o n v 1
P l o a d > 0   S O C b S O C b _ m i n
S O C u c S O C u c _ m i n
P b _ c o n v = min ( P b _ c o n v 1 , P l o a d ) P u c _ c o n v = P l o a d P b _ c o n v
P l o a d < 0   S O C b S O C b _ m i n
S O C u c < S O C u c _ m i n
P b _ c o n v = 0 P u c _ c o n v = P l o a d
P l o a d < 0   S O C b < S O C b _ m i n
S O C u c < S O C u c _ m i n
P b _ c o n v = max ( P b _ c o n v 2 , P l o a d ) P u c _ c o n v = P l o a d P b _ c o n v
P l o a d > 0   S O C b < S O C b _ m i n
S O C u c < S O C u c _ m i n
P b _ c o n v = 0 P u c _ c o n v = 0
P l o a d > 0   S O C b < S O C b _ m i n
S O C u c S O C u c _ m i n
P b _ c o n v = 0 P u c _ c o n v = P l o a d
I b > I b _ m a x I b = I b _ m a x -
I b < I b _ m i n I b = I b _ m i n -
I u c > I u c _ m a x - I u c = I u c _ m a x
I u c < I u c _ m i n - I u c = I u c _ m i n
Table 4. Comparison of different configurations before different driving cycles.
CITY Driving Cycle
C-MCC-B/UCC-UC/B
E b ( J ) 1.4289 × 10 6 1.4289 × 10 6 1.4289 × 10 6
E u c ( J ) 1.5266 × 10 6 1.3740 × 10 6 1.3679 × 10 6
Δ S O C b 0.03070.03070.0307
Δ S O C u c 0.31650.25630.2552
ECE Driving Cycle
C-MCC-B/UCC-UC/B
E b ( J ) 6.8254 × 10 6 5.9617 × 10 6 5.5394 × 10 6
E u c ( J ) 3.0364 × 10 5 1.0506 × 10 6 9.7406 × 10 5
Δ S O C b 0.11380.09990.0927
Δ S O C u c 0.19790.19470.1826
Table 5. Autonomy of the different configurations before driving cycles.
AutonomyC-MCC-B/UCC-UC/B
CITY II cycle (km)77.28577.35786.159
ECE cycle (km)74.4485.90088.151
Note: C-MC: multiple converter configuration; C-B/UC: battery/ultracapacitor configurations; C-UC/B: ultracapacitor/battery configurations.

