1. Introduction
The beginning of the digital era has exponentially increased the amount of data generated. The new data analytic techniques have received special attention in the research from the industrial and academic sectors [
1]. The data sources that have emerged in the past years have allowed better characterization of student behavior.
The use of learning management systems (LMSs) has increased in recent years, especially in universities that offer online courses where students can immerse themselves in an individual and collaborative learning experience. In higher education, the use of analytics is an active area of research. Indeed, there are many different concepts when it comes to analytics, and finding a definition that fits all profiles can be complicated [
2]. In the work by Barneveld et al. [
3], several definitions are collected according to different terms, and they proposed the following: “an overarching concept described as data-driven decision making”.
The growing interest in improving the students’ learning methods has led to the creation of different institutions specialized in exploring the role and impact of analytics in teaching and learning in the education sector. In 2011, the Society for Learning Analytics Research (SoLAR:
http://www.solaresearch.org) was founded as a non-profit interdisciplinary network of international researchers to explore the impact of big data and learning analytics in the education sector. Learning analytics in academia focuses on gathering the data generated by students during courses to manage student success, including early warning processes where the need for intervention by a teacher can be justified.
With the growth of interest in research on learning analytics, the large amount of data generated in the education sector, and the rapid development of applications and software for data collection, it is important that researchers and educators recognize the characteristics of educational data mining (EDM) and learning analytics and knowledge (LAK). These data-intensive education approaches are increasingly prominent in sectors such as government, health care, and industry [
4].
Indeed, as described in [
5], the analysis of the data generated by students from the use of online technologies can provide information on the students’ progress and the quality of the teaching and curriculum implemented. The analysis of student follow-up data has led to the emergence of new technologies around adaptive learning and recommendation systems for adaptive practice.
In [
6], Blinkstein defines multimodal learning analytics (MMLA) as “a set of techniques that can be used to collect multiple sources of data in high frequency (video, logs, audio, gestures, biosensors), synchronize and code the data, and examine learning in realistic, ecologically valid, social, mixed-media learning environments.” In this line, the work by Worsley [
7] indicates that MMLA “utilizes and triangulates among non-traditional as well as traditional forms of data in order to characterize or model student learning in complex learning environments”.
We believe that cloud computing instruction can benefit from the automated compilation of learning analytics, which can then be coupled to additional analytics obtained from LMSs to provide further insights. With this aim, this paper focuses on capturing and analyzing learning analytics gathered from a fee-paying online course in cloud computing with Amazon Web Services (AWS) in order to reveal data-driven insights concerning the students. These data include: (i) activity logs from their interaction with multiple cloud services to determine the students’ percentage of progress for each hands-on session and (ii) results of the self-assessment tests that students can optionally take after each module. To gather data from the hands-on lab activities carried out by the students, we introduced a distributed serverless platform to collect and process the logs from AWS CloudTrail, a service that registers the accesses to the AWS services performed by the students. We then translated these data into meaningful activity traces in order to determine the progress percentage for each student in each education activity performed in the cloud.
Several studies are available in the literature concerning how students behave in freely available online courses, such as MOOCs (Massive Open Online Courses) [
8,
9]. However, fewer studies focus on online fee-paying courses. In these courses, the expectation of dedication of participants has been previously measured to be significantly different compared to freely available MOOCs, as indicated in the work by Cross et al. [
10], which found out a statistically significant difference between the anticipated time commitments of fee-paying students and no-fee learners. In addition, the completion rate among fee-paying students for online courses is typically higher compared to students that do not pay a fee, as reported in the work by Koller et al. [
11]. This contribution analyzes the data gathered by means of a platform designed from a fee-paying online course with a significant population (
). We postulate that the analysis of these data for a cohort of students can aid in the identification of improvements in the course design in order to reduce the dropout rate. We also aim to better characterize the students’ behavior when carrying out the hands-on activities in the cloud.
After the introduction, the reminder of the paper is structured as follows. First,
Section 2 introduces the related work in the area. Next,
Section 3 describes the educational data analytics that are gathered from the students, together with the cloud-based tools designed. Later,
Section 4 analyzes the aforementioned data to obtain further insights from the students taking the course, including a gender analysis. Finally,
Section 5 summarizes the main achievements of the paper and describes future work.
2. Related Work
Learning analytics can greatly help researchers understand and optimize learning by collecting relevant traces of users and using them for personal improvement [
12]. However, for the large amount of data that can be generated, it is important to consider the way in which they are presented for both students and teachers. A study by Charleer et al. [
13] exposed that the “zoom + context” technique together with the use of technologies can be applied for data analysis to help teachers and students deal with large amounts of data.
Previous studies used different sources to produce data, such as click-stream, eye tracking, electroencephalography (EEG), or gesture tracking using sensors and video, to extract and select the characteristics associated with the acquisition of skills; with this, the path to the design of the system is proposed: better learning support through physiological detection [
6,
14]. Indeed, MMLA captures, integrates, and analyzes the traces of learning available through various sensors and data collection technologies. The multimodal data sets obtained through these techniques can provide new ideas and opportunities to investigate more complex learning processes and environments [
15].
The work by Ochoa et al. [
16] references the main challenges of multimodal data collection and includes methodologies, techniques, and tools in order to capture, process, and analyze multimodal learning traces. For smart classrooms, the work by Aguilar et al. [
17] identifies learning analytics tasks as a set of tools used to collect and analyze data from these classrooms, thus studying the impact on ambient intelligence (AmI) in education.
The adoption of learning analytics by online courses is exemplified by works such as that of Lu et al. [
18], who created a tool to produce monthly reports to highlight at-risk students that required a timely intervention to prevent dropping out of MOOCs related to programming. This improved students’ learning and increased the engagement in the course. The work by Drachsler et al. [
19] discusses the interaction between MOOCs and learning analytics by introducing a conceptual framework (MOLAC) that focuses on key areas required to be enabled, such as data-sharing facilities across institutions and standardized evaluation approaches. Indeed, the work by Ruipérez-Valiente et al. [
20] introduced a learning analytics tool implemented for Open edX, called ANALYSE, which provides useful visualizations for teachers’ feedback backed by pedagogical foundations. The work by Er et al. [
21] uses learning analytics to design a predictive analytics solution to involve instructors in the design process of an MOOC. Finally, the work by Tabaa and Medouri [
22] focuses on creating a learning analytics system for massive open online courses based on big data techniques, such as Hadoop, in order to target “at-risk” students.
However, there are few works in the literature that support learning analytics by means of cloud computing techniques. For example, the work by Shorfuzzaman et al. [
23] presents a cloud based mobile learning framework that uses a Big Data analytics technique to extract values from mobile learners’ data. The proposed big learning data analytic model uses cloud computing to provide scalable computing and data storage resources. The work by Klašnja-Milićević et al. [
24] identified the importance of Big Data in performing efficient processing of learning analytics, and an abstract architecture framework was envisioned that involves the usage of cloud computing.
There exist some commercial platforms that can ingest logs coming from CloudTrail in order to achieve further visibility of the activity taking place in an AWS account. This is the case of Loggly [
25], a unified logging system that can produce enhanced dashboards from the processed data. However, exploiting this information to produce learning analytics in order to achieve additional insights into the degree of performance of students doing the cloud-based activities is the key point of our contribution.
From the analysis of the state of the art, we can notice that one of the fundamental challenges is to characterize, using the data obtained through different techniques, the population of students who take the courses. To achieve this goal, the main contribution to the state of the art of this work lies in the automated compilation of learning analytics from hands-on activities in AWS via a cloud-based architecture and the subsequent analysis of said data together with the academic results from the LMS for students from an online course on cloud computing with Amazon Web Services. The analysis provides further insights in order to steer the course design in light of the activities carried out by students during the time frame allocated to its completion.
3. Educational Data Analytics
The online course in cloud computing with Amazon Web Services (CursoCloudAWS (in Spanish):
https://www.grycap.upv.es/cursocloudaws) was the first Spanish-speaking online course on AWS offered worldwide, and has trained more than 1000 students from 10 countries (mainly Spain and Latin America) since 2013. It is a fully online self-paced experience that involves multiple learning materials, such as video lessons, hands-on lab guides, remote virtual labs for student to self-deploy their own virtual infrastructures, and self-assessment tools, as described in the work by Moltó et al. [
26]. It cannot be considered an MOOC, since it is not offered for free, but it shares many of the features of these courses with respect to the challenges of online instruction.
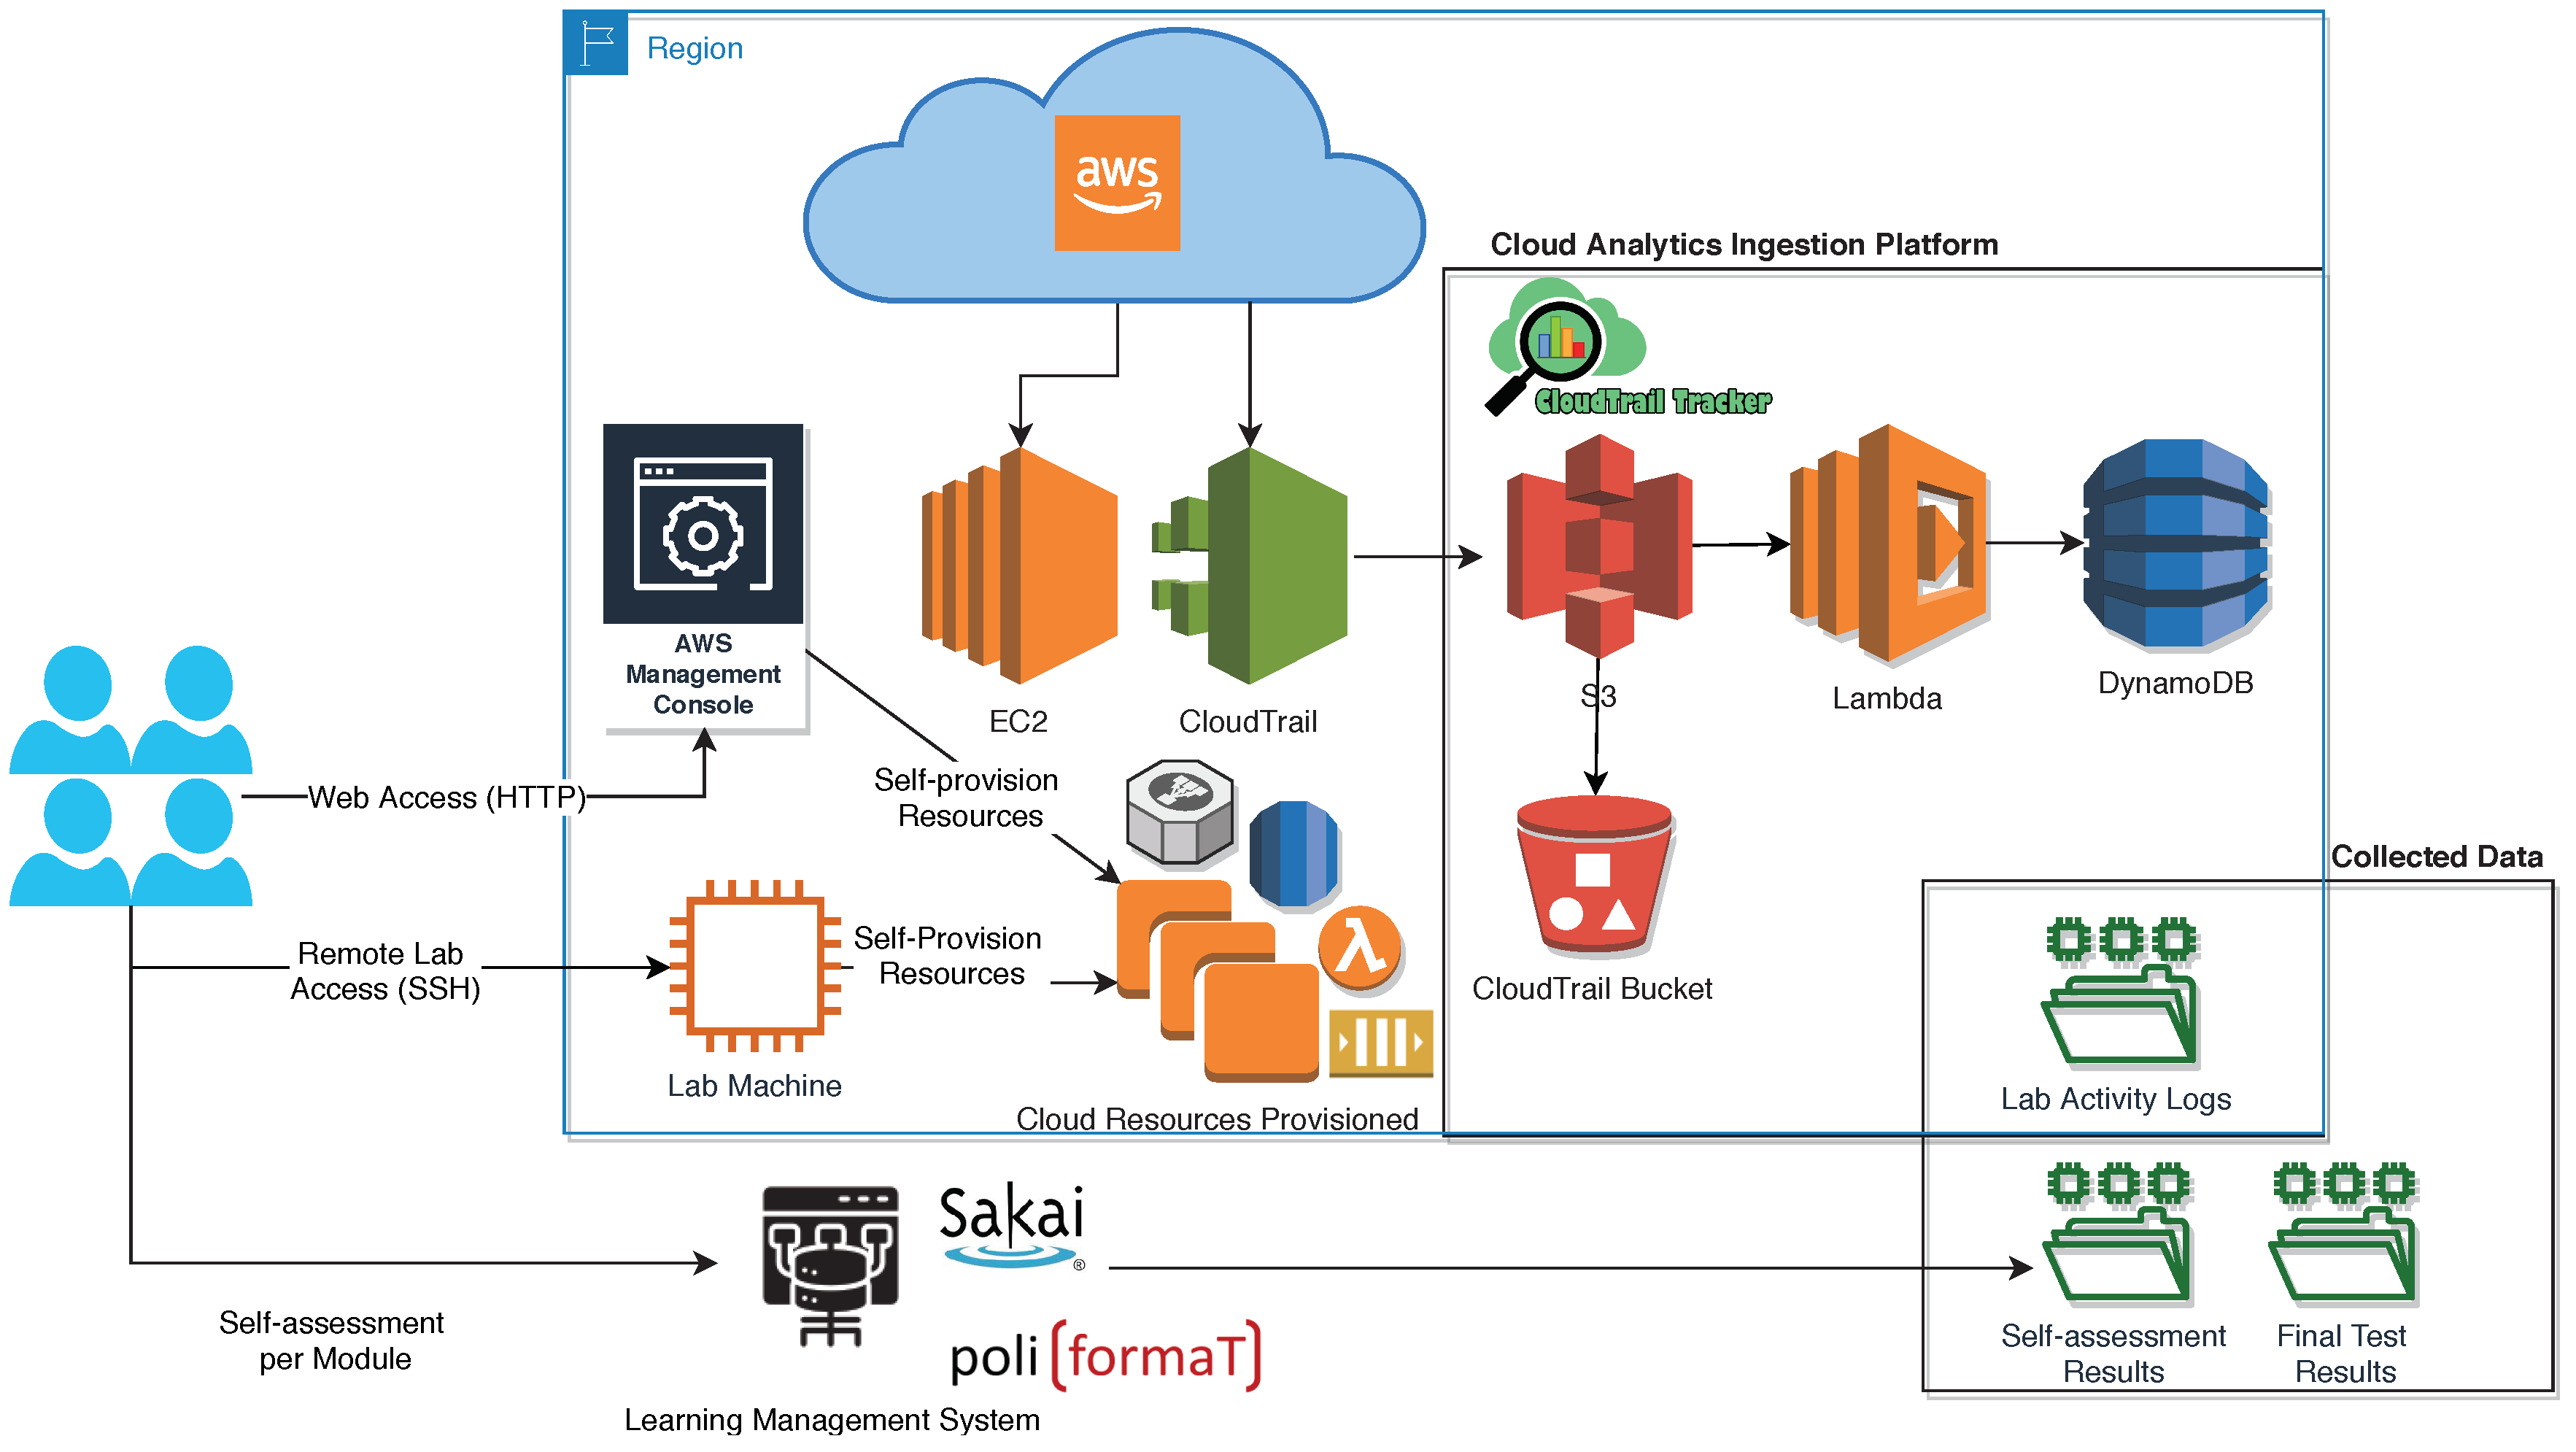
Figure 1 shows the different types of data collected from a student during the course. Students are provided with user credentials with limited privileges linked to the teacher’s AWS account. A Lab Machine configured with multiple Linux user accounts is automatically deployed in AWS for students to carry out the hands-on labs defined in the course. This machine is automatically deployed and configured for each academic course using the Infrastructure Manager (IM) (Infrastructure Manager (IM):
https://www.grycap.upv.es/im) [
27], as described in the work by Segrelles et al. [
28].
Once the students start using the cloud services, AWS CloudTrail [
29] periodically delivers activity logs of the services used into a permanent storage bucket in Amazon S3 [
30]. These data are automatically collected, parsed, and ingested by the CloudTrail-Tracker (CloudTrail-Tracker:
https://www.grycap.upv.es/cloudtrail-tracker), an open-source platform that provides a graphical dashboard for teachers to visualize progress across multiple lab activities for each student, as described in the work by Naranjo et al. [
31]. For the sake of completeness, a summary of the role of CloudTrail-Tracker is included in
Section 3.1.
After each module, students are encouraged to undertake an optional self-assessment test in order to determine their level of knowledge with respect to both the theoretical and practical concepts studied in each module. These tests are implemented in PoliformaT, the Sakai-based learning management system (LMS) used at the Universitat Politècnica de València in Spain. In addition, after each module, the student is asked to provide feedback on the level of satisfaction with respect to the corresponding hands-on lab activities performed. This way, we can match the perception of the student with respect to the actual development of activities within the cloud platform, though this study is outside the scope of this paper.
3.1. Gathering and Processing Activity Logs for Students in the Cloud
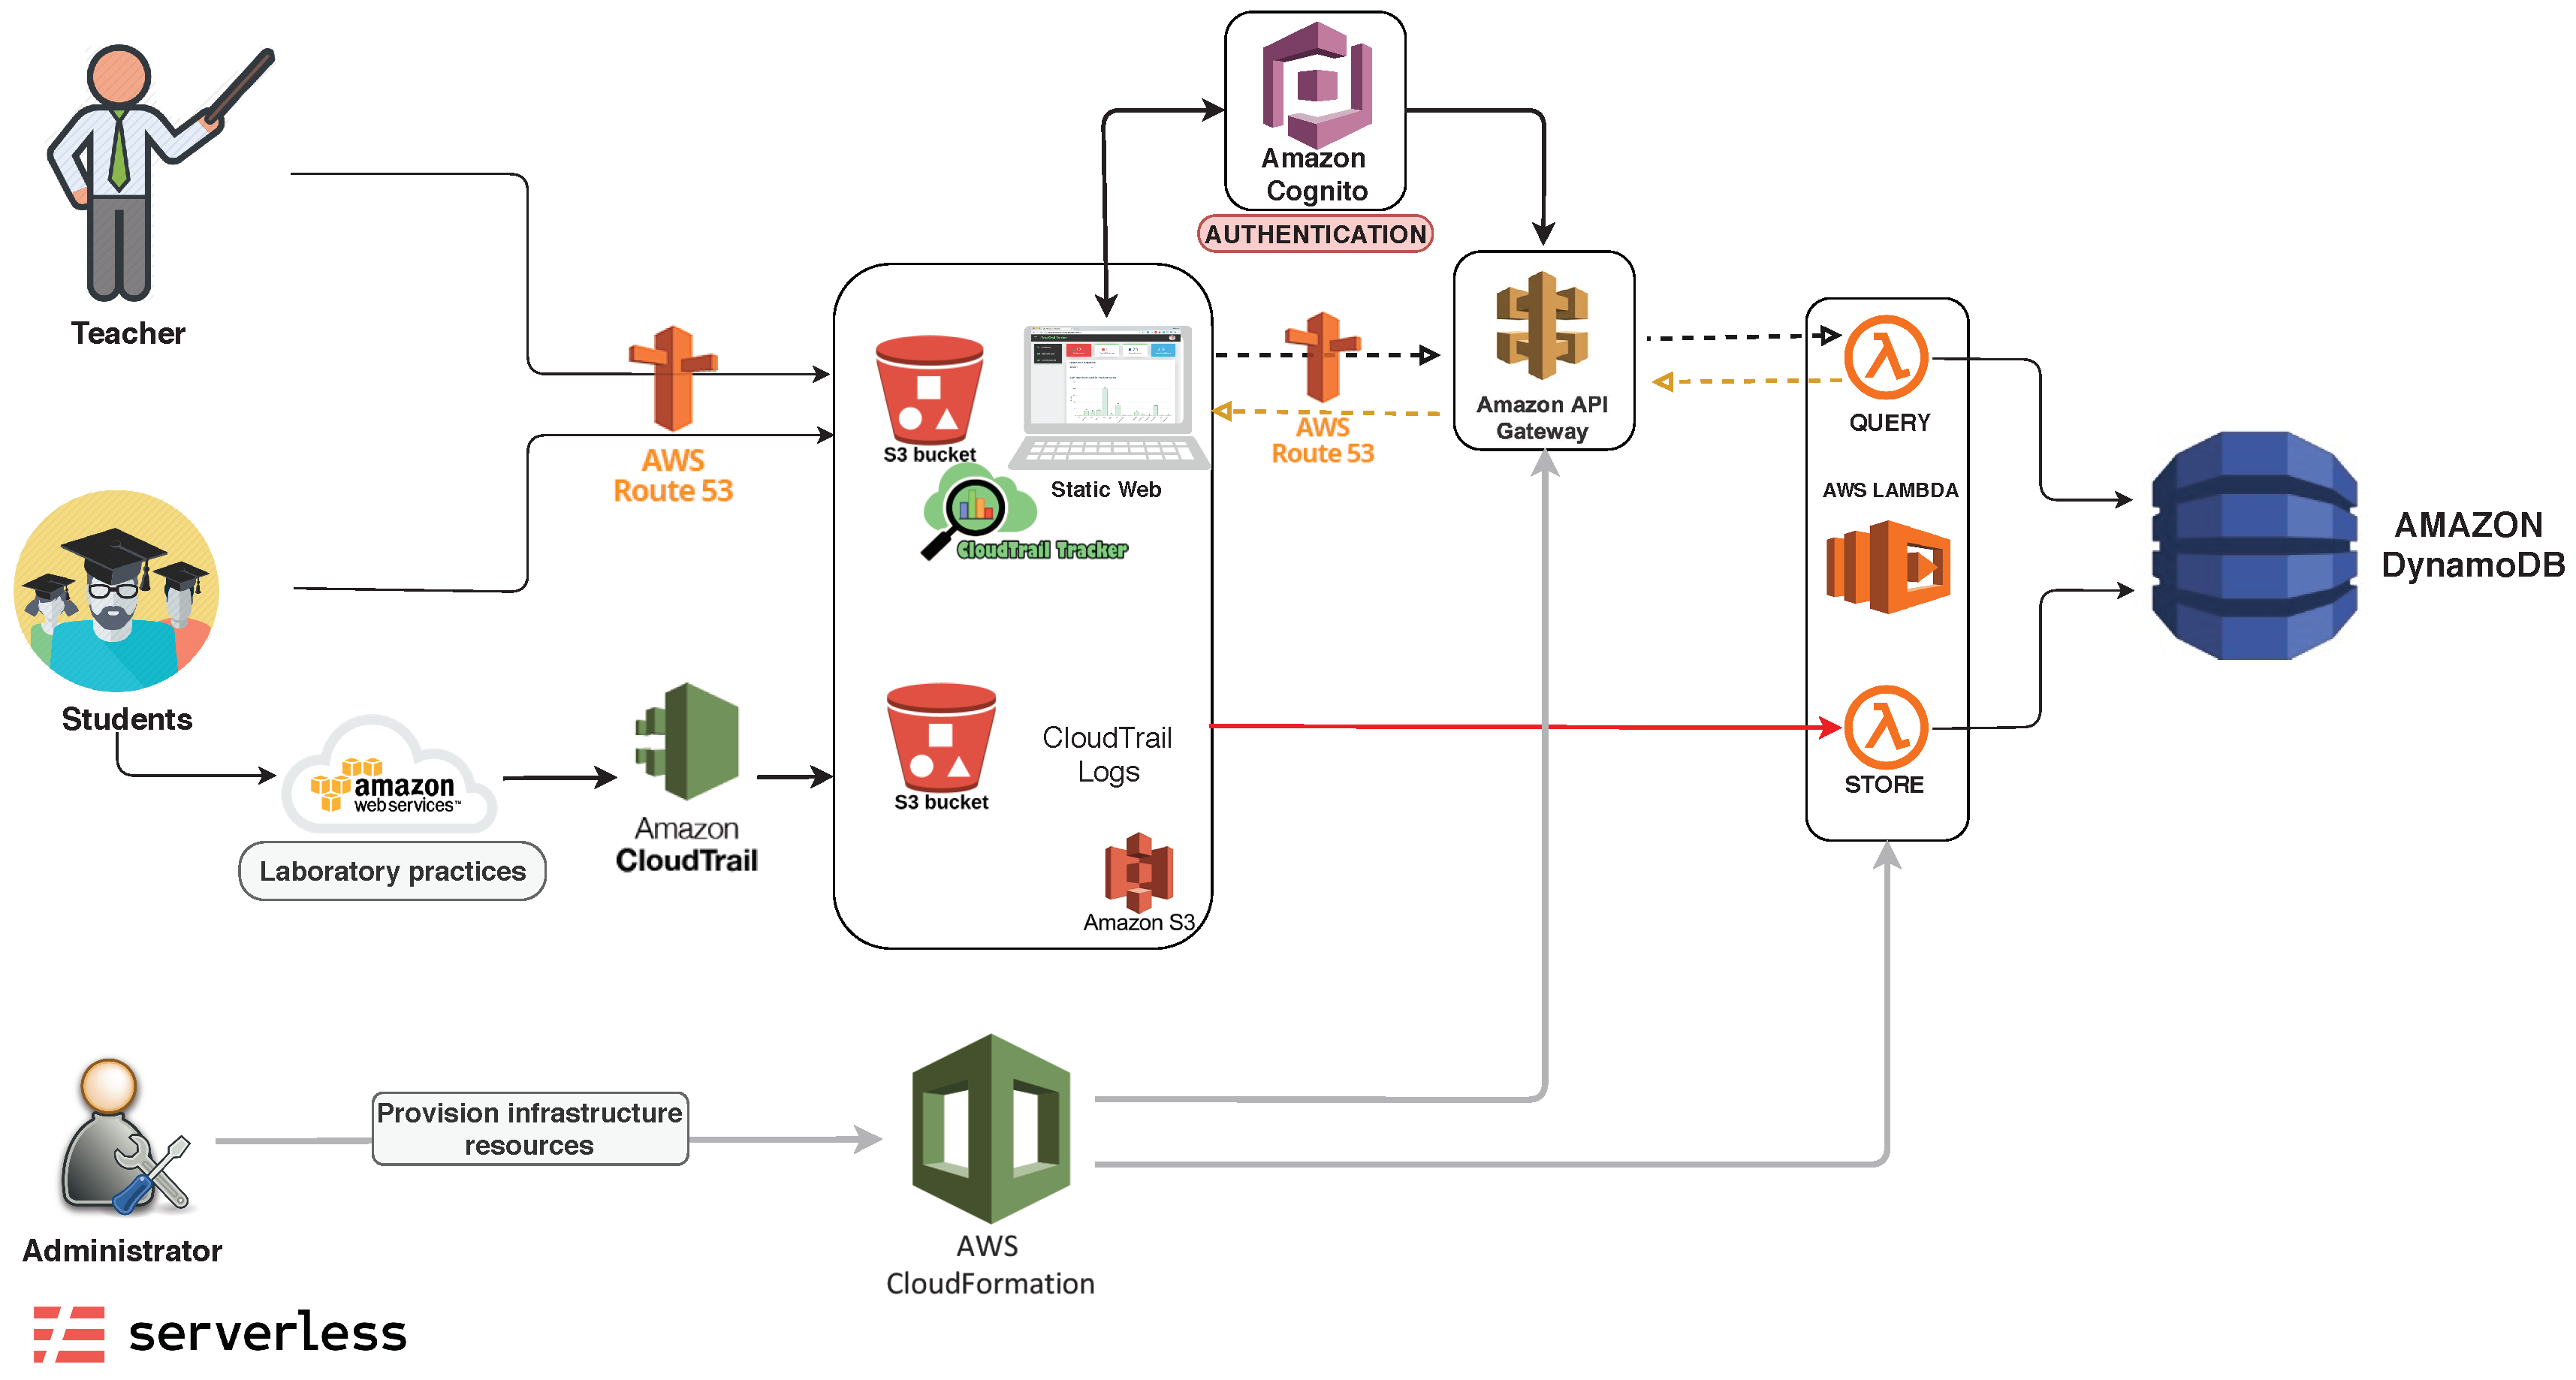
Figure 2 describes the architecture of the platform created in order to automatically process the activity logs that trace the actions performed by the students in AWS while carrying out the lab activities.
The platform is defined as a completely serverless application, where the cloud provider manages the capacity allocation for the underlying services employed [
32]. The activity logs of the students performing the lab sessions are automatically generated by AWS CloudTrail and delivered up to 15 min after the actions are carried out. These are compressed JSON files that include records about each time an API (Application Programming Interface) is invoked, that is, every time a user performs an action with an AWS service that is supported by CloudTrail. Each record contains valuable information that includes:
WHO. The AWS IAM (identity and access management) user—in our case, the student—that made the action.
WHAT. The specific action performed, that is, the API call invoked for each AWS service.
WHEN. The timestamp that indicates when the action was carried out.
WHERE. The client tool used to perform the action, typically a web browser or a command-line tool.
These logs are automatically uploaded as files to an Amazon S3 bucket, which triggers the execution of a Lambda function (Store) responsible for storing the events (actions carried out by the student) in a NoSQL table in AWS DynamoDB. In order to minimize the amount of information stored in the database, actions that do not modify the infrastructure are discarded. Only those actions that involve creating or modifying a resource in AWS are logged, as required in the hands-on activities proposed. A REST API to query this information is created via the API Gateway, which, upon a request, triggers a Lambda function (Query) responsible for querying the DynamoDB table and formatting the results in JSON.
The application has a web-based graphical front end coded as a Vue.js application that is compiled into a static website (only HTML, CSS, and JavaScript), which is hosted in an Amazon S3 bucket and exposed via a custom DNS (domain name service) entry through Amazon Route 53. The web application, running in the user’s browser, relies on Amazon Cognito to perform user authentication via the user’s credentials. This is also employed to obtain valid access tokens to query the REST API to provide programmatic access to the collected data.
This application architecture has been fully released as an open-source platform to gather activity logs, which can be exploited as a learning dashboard aimed at self-regulation of students, as demonstrated in the work by Naranjo et al. [
31]. This work analyzes the insights obtained from the course-related data collected through both CloudTrail-Tracker and the LMS.
3.2. Statistical Variables Defined
The following variables are defined:
CTOCA, which represents the mark obtained in the final timed exam that students undertake. They need to achieve a mark greater than or equal to 5 in order to obtain the certificate of achievement. These data are collected from the LMS.
CTAM1 through CTAM7, which indicate the results of the optional self-assessment test carried out by the student after each one of the seven modules, ranging from 0 to 10. This value may be absent for students that did not perform the test. These data are collected from the LMS. The variable CTAMT is the average of the seven aforementioned variables, where 0 is assigned for a non-taken self-assessment test for the corresponding module.
PL_X where X = EC2, EC2_S3, RDS, APP, CF, VPC, and
LAMBDA_SQS, which indicate the percentage of progress of a student in each lab activity for each student (in order of appearance during the course). These data are collected by CloudTrail-Tracker. The variable PL_TOTAL is the average of the seven aforementioned variables, where 0 is assigned for a lab activity not carried out by the student.
For the sake of completeness, a brief summary of the lab activities is included:
PL_EC2: Students deploy and configure virtual machines (VMs) with different operating systems using Amazon EC2.
PL_EC2_S3: Students create fleets of VMs that can grow and shrink depending on the workload being processed. They also interact with Amazon S3 to perform object storage for the management of files.
PL_RDS: Students use Amazon RDS to manage the lifecycle of relational database management systems (RDBMS), such as MySQL, using fault-tolerant deployment of databases.
PL_APP: Students deploy a highly available architecture to support the Wordpress blogging platform by replicating and distributing the internal components required.
PL_CF: Students use Amazon CloudFormation to deploy complete application architectures described in template files using an Infrastructure as Code (IaC) approach.
PL_VPC: Students create isolated networking sections in AWS to better increase the security of the deployed applications by using Amazon VPC (Virtual Private Cloud).
PL_LAMBDA_SQS: Students create serverless event-driven applications to process files using queue services such as Amazon SQS and Functions as Service (FaaS) approaches via AWS Lambda.
It is important to point out that these are not the only lab activities carried out throughout the course, but those from which automated metrics can be obtained via CloudTrail-Tracker. However, these lab activities are spread across the course and, therefore, represent a good proxy for the amount of work carried out by the students when performing their practical educational activities in AWS.
4. Insights from Data Analytics
This section analyzes the data gathered across three academic courses (from 2016/2017 to 2018/2019) from an initial population of 427 students (380 males and 47 females) that took the online course in cloud computing with Amazon Web Services (101 students in 2018/2019, 160 students in 2017/2018, and 166 students in 2016/2017). The students were mainly from Spain, with some students from Latin America. The full raw data to reproduce the statistical results are available as a publicly available Google Spreadsheet (
https://bit.ly/as-cloudylitics).
4.1. Statistical Overview
First, we focus on the aggregated statistics of the students. With this aim,
Table 1 shows the number of students (
COUNT) that undertook the voluntary assessment test for each one of the seven modules of the course, together with the average mark on a 0–10 scale (
AVG) and the standard deviation (
STD). The same information is obtained for the final timed test (
CTOCA). The last line (
DROP) indicates the percentage of students that did not take the corresponding test with respect to the total population of students.
The results indicate that of the students took the final test, obtaining an average grade of with a standard deviation of 1.05. The dropout rate of students with respect to the voluntary tests starts at 9.6%, which stands for the percentage of students that did not take the test after module 1, and increases throughout the different modules, up to a total 46.1% of students that did not take the test in module 7. Notice, though, that the dropout rate of students that did not perform the final test goes down to 24.8%, since students do not typically want to miss the opportunity to achieve the final course completion certificate.
The rationale underlying this behavior may be two-fold. On the one hand, the students may be facing difficulties with keeping up with the amount of material of the course. Even if the course is self-paced, where students are provided with all of the material and the cloud environment required to perform all the activities at their own speed, a tentative schedule is suggested, though not enforced. The length of the course, which is planned for a four-month period (120 days), may impact the dropout rate of the students. Previous studies on attrition in online learning, such as the one carried out by Diaz and Cartnal [
33], indicated that shorter term length was a key variable affecting student attrition, since many students argue that time requirements represent a barrier to enroll in an online course.
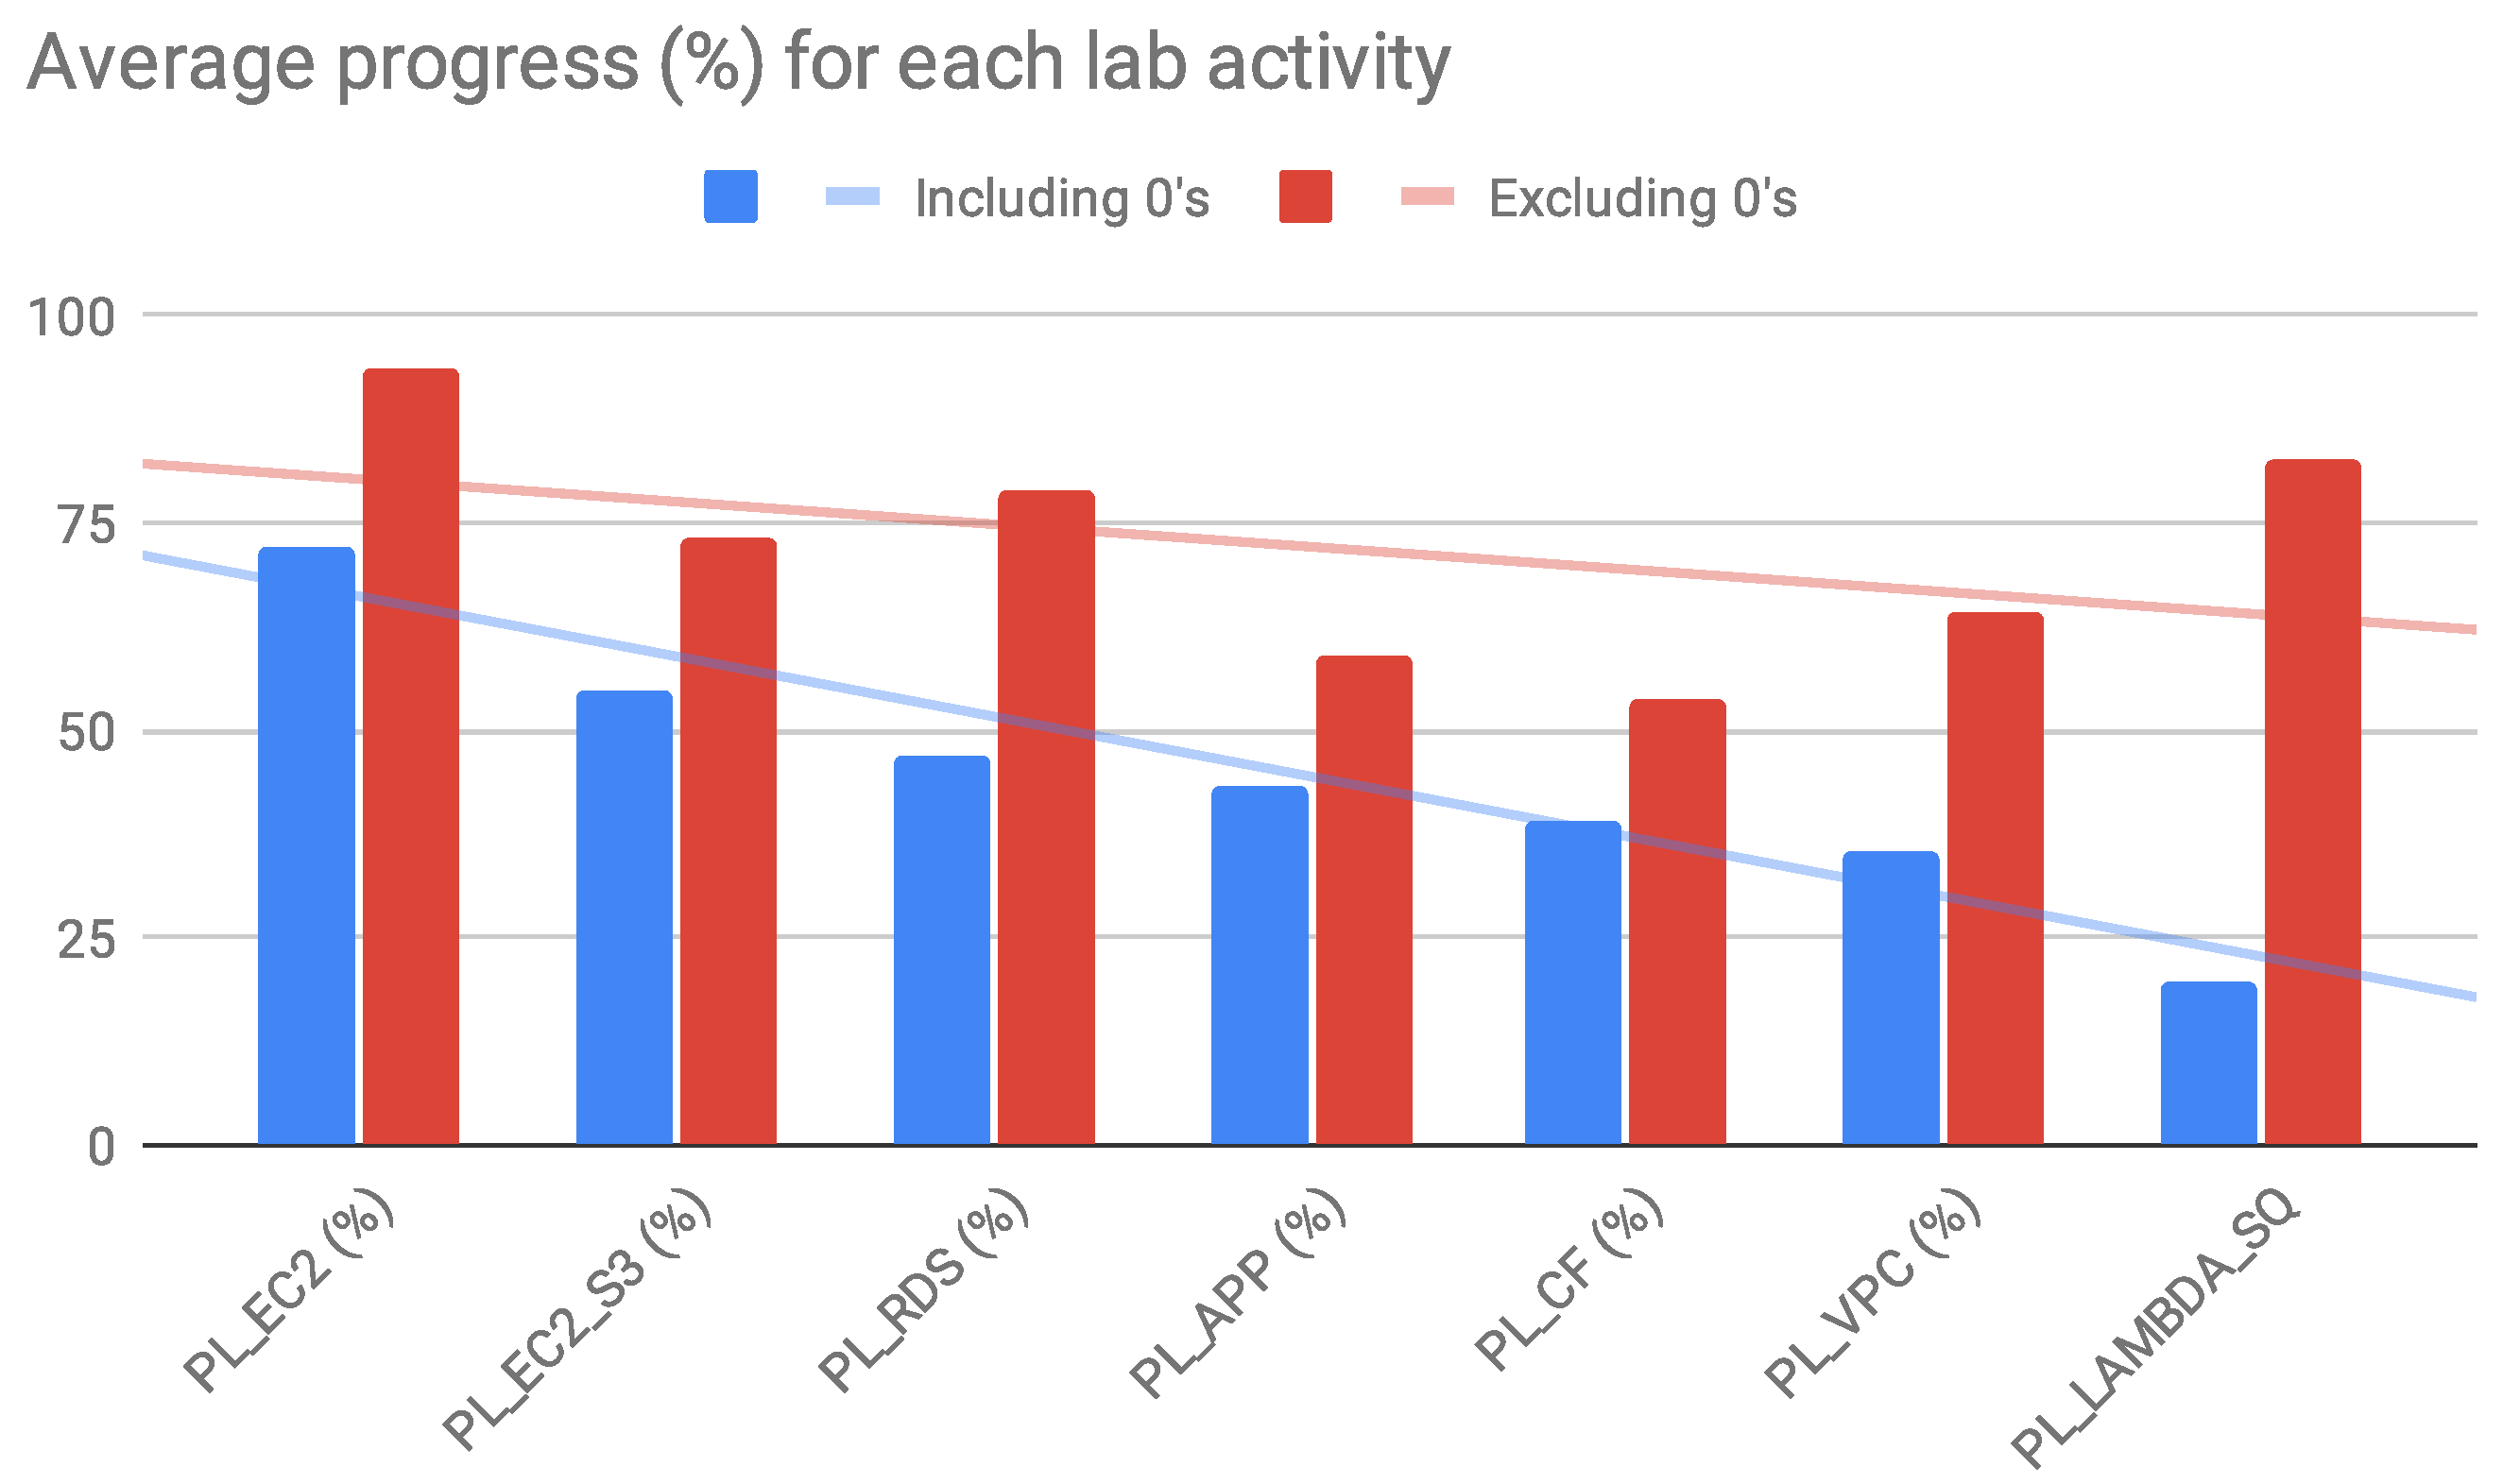
Table 2 shows statistics of the percentage progress of students with respect to each lab activity in the cloud, visually depicted in
Figure 3. Notice that we provide average values that both include students that did not perform a specific lab activity (i.e., the percentage of progress is 0) and exclude them in order to focus, in this latter case, on students that carried out the lab activities. Indeed, as the course develops, the average percentage of progress for each lab activity decreases. The difference between the blue and red bars increases more towards the end of the course. This means that fewer people carry out these lab activities towards the end of the course, but those who do achieve a good percentage of progress and almost fulfill all the activities within each lab activity in the cloud. Note also the decrease in the number of students for certain lab activities (e.g.,
value for
), showing the preference of students for the other lab activities.
Notice that this information could not have been gathered and analyzed without using CloudTrail-Tracker, thus highlighting the benefits of collecting educational analytics for cloud instruction using cloud techniques as well. The results indicate a similar behavior when compared to those obtained when carrying out the theoretical activities. However, the drop rate is substantially increased for the latest lab activities. This indicates that students may be facing difficulties in dedicating the required amount of time to perform all the activities and, therefore, they prioritize the theoretical activities that would increase their chances of passing the final test.
4.2. Gender Analysis: An Statistical Approach
Unfortunately, gender inequality in STEM subjects (science, technology, engineering, and mathematics) is a reality in universities around the world, as reported in the UNESCO (United Nations Educational, Scientific and Cultural Organization) report [
34], which indicates that only 35% of students registered in STEM studies and 28% of researchers are women. We wanted to contribute with this work to the elimination of gender stereotypes and prejudices that compromise the quality of the students’ learning experience and limit their educational options [
35].
With this aim, three statistical studies were carried out to compare the populations of women and men. To determine if the distributions are normal, the Kolmogorov–Smirnov (K-S) test was used, since the number of values in the distributions was greater than 30 [
36]. Because the results point to non-normal distributions, the Mann–Whitney U [
37] non-parametric test was used to compare two distributions, and the Kruskal–Wallis (K-W) one-way analysis of variance (ANOVA) [
38] was used to compare more than two distributions using IBM SPSS [
39].
Female advantage in school marks is a common finding in education research, as indicated in the meta-analysis work by Voyer et al. [
40]. Therefore, the target of the first statistical study was to compare the final test results between women and men. The study included 321 students (10.59% women and 89.41% men) who achieved a final grade (variable
) and excluded 106 students (12.26% women and 87.74% men) who had not taken the final test. The K-S test shown in
Table 3 indicates that the distribution of men is not normal (p(K-S) < 0.05). Therefore, the Mann–Whitney U test was performed (p(U-M-W) = 0.460), retaining the null hypothesis (the distribution of
is the same between genders), and thus concluding that there are no significant differences in the final grades between genders.
The second study included 386 students (10.36% women and 89.64% men) who had performed the self-assessment tests (variable
CTAMT), and it excluded 41 students (17.07% women and 82.93% men) because they had not taken these optional tests. The K-S test shown in
Table 4 indicates that both distributions are not normal (p(K-S) < 0.05). Therefore, the U-M-W test was performed (p(U-M-W) = 0.025), rejecting the null hypothesis (the distribution of
is the same between the categories of gender). This allows the conclusion that that there are statistically significant differences between women and men with respect to the results of the optional self-assessment tests. The rationale behind these results requires further analysis. Previous works by Ellemers et al. [
41] revealed no gender differences in work commitment from a population of doctoral students in the Netherlands as they attempted to find possible explanations for the underrepresentation of women among university faculty. However, few studies are available to contrast the results in terms of commitment to a course between genders. For example, in the work by Sheard et al. [
42], female students successfully surpassed male studies in the academic evaluation criteria and reported higher mean scores on commitment compared to their male counterparts.
As shown in
Figure 3, the percentage of progress decreases as the course progresses through the different lab activities. The results of
Table 5 indicate significant differences (p(K-W) < 0.05) between the first lab activity (
PL_EC2) and the following ones with respect to the degree of progress. This can be motivated by the relinquishment associated with students with low involvement and commitment, who usually drop out in the first sessions or activities. In the third and fourth lab activities, there are no significant differences in the progress with respect to the subsequent lab activities, probably because the least motivated students had already left the course in the first activity. Finally, there are always significant differences with respect to the last lab activity (
PL_LAMBDA), which is carried out at the end of the course, and many students fail to reach that point in the course. This again stresses the need to further allocate time extensions to the course design or split it into two courses.
The third and last statistical study aims to compare the degree of progress in the lab activities planned in the course. This study included 427 students (11% women and 89% men) who had carried out lab activities and, therefore, had an average percentage of progress identified in the variable
. The K-S test shown in
Table 6 indicates that the male distribution is not normal (p (K-S) < 0.05). Therefore, the U-M-W test was performed (p(U-M-W) = 0.872), retaining the null hypothesis, and thus allowing the conclusion that there are not significant differences between women and men.
5. Conclusions and Future Work
This paper has focused on collecting learning analytics from an online course on cloud computing. The ability to automatically track the progress of the students across the course has enabled the identification of higher dropout rates in the lab activities towards the end of the course. This corroborates the results from other authors on the impact of the length of the course on attrition. In addition, the results of the gender analysis showed similar academic results between genders, but increased commitment from women. The dataset has been made available to reproduce the results of the paper.
To enable this analysis, a cloud-based architecture for automated data ingestion from the activity logs of the students in AWS has been used. This has allowed transformation of the logs into meaningful learning analytics related to the degree of completion for the main hands-on lab activities in the course. By adopting a serverless computing strategy, the platform can operate at zero cost under the free tier of the involved services (mainly AWS Lambda, API Gateway, and Amazon DynamoDB).
The ability to systematically monitor how students behave in the course paves the way for rethinking the strategy of how a course is offered for subsequent editions. This is specially important for online instruction in which other sources of information from students are available apart from the educational trails that students leave during their learning procedure. This can be used for teachers to automatically capture them in order to extract information from the data.
The platform introduced here automatically obtains the percentage of progress for each student in each hands-on activity. Without such a platform, the instructor has no perception of how the students are progressing through their activities. In addition, this is entirely achieved without any active involvement by the students, who are passively monitored; therefore, they do not need to spend additional time producing an activity report to justify that they carried out the lab activities.
Future work includes further evolving the CloudTrail-Tracker with predictive modules in order to anticipate the dropping out of students and to alert professors to introduce corrective countermeasures, such as extending the allocated timeframe for accessing the course or unblocking additional material in order to minimize the knowledge gap required to undertake the latest course modules.


