Article

Correlating Natural, Dry, and Saturated Ultrasonic Pulse Velocities with the Mechanical Properties of Rock for Various Sample Diameters

Geology Department, College of Science, United Arab Emirates University, Al Ain P.O. Box 15551, UAE
*
Author to whom correspondence should be addressed.
Appl. Sci. 2020, 10(24), 9134; https://doi.org/10.3390/app10249134
Submission received: 26 October 2020 / Revised: 25 November 2020 / Accepted: 26 November 2020 / Published: 21 December 2020

Abstract

:

Featured Application

The ultrasonic pulse velocity test is a widely used, inexpensive, nondestructive, and modest test to define the dynamic properties of rocks in various geotechnical and mining engineering applications as well as in gas and oil explorations under various environmental conditions.

Abstract

P-wave velocity is employed in various fields of engineering to estimate the mechanical properties of rock, as its measurement is reliable, convenient, rapid, nondestructive, and economical. The present study aimed to (i) correlate natural, dry, and saturated P-wave velocities with the mechanical properties of limestone and (ii) investigate how the ultrasonic P-wave velocities and mechanical properties of limestone are affected by the sample diameter. This study reveals that P-wave velocities under different environmental conditions can be correlated with the mechanical properties of limestone. Further, the R-value variations with different P-wave velocities for a given sample diameter are (i) negligible in terms of the uniaxial compressive strength (UCS) excluding 63.2 mm, (ii) limited for the diametrical point load index (PLID) except for 53.9 mm, (iii) perceived in case of the axial point load index (PLIA) for 47.7 mm, (iv) observed for the indirect tensile strength (ITS), but generally insignificant, and (v) detected in terms of Schmidt hammer value (SHV) except for 47.7 mm.

1. Introduction

The ultrasonic pulse velocity (UPV) test is a convenient, rapid, and low-cost method for evaluating rock samples under different environmental conditions, both in the laboratory and in situ using portable equipment. Due to its nondestructive nature, simplicity, and reliability, the UPV test has been broadly accepted and used in several disciplines, such as civil engineering, mining, and geo-engineering. Several researchers have utilized this test to investigate a variety of phenomena and parameters, including microstructural material properties, grouting assessment, the efficiency of different applications, deformation, stress, weathering degrees in rock mass, detection of rock material variations, characterization of rock and rock mass, fracture zone extensions around underground openings, and the thermal conductivity of rocks [1,2,3,4,5,6,7,8,9,10,11,12]. Furthermore, ultrasonic propagation in fractured rock, geotechnical characterization of monument and building stones, and the relationships between the UPV and rock properties have been intensively studied and reported by various researchers [13,14,15,16,17,18,19,20,21,22,23,24,25,26,27,28,29,30,31,32,33,34,35,36]. These studies have established correlations between the UPV and rock properties for various types of rocks.
Rock seismic properties are greatly influenced by shape and grain size, rock type, porosity, density, pore water, anisotropy, temperature, clay content, confining pressure, weathering and alteration zones, bedding planes, joint properties (e.g., roughness), water, filling material, and strike and dip directions and angles [26,27,37]. The mechanical properties of rock must be defined under various environmental conditions for the planning and design of any civil, mining, or geotechnical application. Such works require great attention in sample preparation and testing, and test results must be reported within an acceptable accuracy level. The UPV test, which is a reliable and convenient technique, can be applied under various environmental conditions to predict the mechanical features of rock based on correlations. In addition, the expected effects of sample diameter on the ultrasonic P-wave velocity (Vp) and mechanical features of limestone can be investigated by using various sample diameters.
In the literature, few studies have directly correlated natural (Vnp), dry (Vdp), and saturated (Vsp) ultrasonic P-wave velocities with the mechanical properties of rocks with various sample diameters. Kahraman [37] investigated the predictability of wet-rock Vp based on the dry-rock Vp on 41 various rock types. He reported that the wet-rock Vp can be assessed from the dry-rock Vp using derived equations. Karaman et al. [38] evaluated the possible influence of sample length on P-wave velocities for 200 dry and saturated core specimens of volcanic rocks and limestones. The authors found that the sample length strongly affected the P-wave velocities; moreover, they developed a method to determine the threshold specimen length of the studied rocks as 109 mm for limestones. Ercikdi et al. [39] examined the effect of core size on the dry and saturated UPV of limestone samples. They reported that the reduction in Vp and uniaxial compressive strength (UCS) might depend on the weakening of solid/solid interfaces between grains and variations in the chemical and mineralogical composition of limestone. A core length of 75 mm was found to be ideal for dry and saturated UPV tests. Chawre [40] conducted a correlative study on pulse wave velocities and quartz–mica schist properties. She noted that the physicomechanical properties of rocks may be associated with ultrasonic P- and S-wave velocities and suggested that proposed empirical equations be validated for a rock type from a project site before being used in designing and planning goals. Kumar et al. [41] assessed the geotechnical features of rocks in coalfields under dry, semi-saturated, and saturated environments using ultrasonic S- and P-wave measurements. Their study showed a strong correlation, which was verified by the coefficient values for correlations between the P-wave velocity and other geotechnical parameters under dry conditions compared with semi-saturated and saturated conditions. Gonzales et al. [42] reported on an analytical model to predict the UCS from Vp, density, and porosity for 13 saturated limestone specimens. They found that a multi-exponent model was appropriate for predicting the UCS and demonstrated that the UCS depends on Vp. However, a detailed study, which correlates natural, dry, and saturated P-wave velocities with the mechanical properties of rock, and investigates how the ultrasonic P-wave velocities and mechanical properties of rock are affected by the sample diameter, was missing in the field.
In the present paper, we aimed to correlate the natural (Vnp), dry (Vdp), and saturated (Vsp) P-wave velocities with mechanical features such as the UCS, the axial and diametrical point load indices (PLI-Point Load Index, PLIA and PLID), indirect tensile strength (ITS), and Schmidt hammer value (SHV) of limestone. Furthermore, we examined how the P-wave velocities and mechanical properties of limestone are affected by the sample diameter.

2. Materials and Methods

All rock blocks were collected from the outcrops of sedimentary rock sequences of limestone, Dammam Formation, Middle to Late Eocene, aged 49–34 Myr, at Jabel Hafit Mountain in Al Ain City. Each rock block was prudently inspected for macroscopic flaws such as fractures, cracks, bedding planes, and alteration zones in order to attain standard testing samples for laboratory studies. As the UPV is greatly affected by nonhomogeneous and anisotropic features of testing samples, this task is critical for rock block assortments. All rock blocks were kept under the laboratory condition (around 25 ± 1 °C) until sample preparation and testing.
To avoid natural occurrence effects, all test samples were inspected prior to testing to ensure that they were free of any macroscopic or visible defects such as fractures or cracks. For the UPV test, core samples with diameters of 24.9, 38.1, 47.7, 53.9 (NX size), and 63.2 mm and various lengths ranging from 78.9 to 108.3 mm were acquired from the selected rock blocks perpendicular to bedding plane using a core drill and trimming machine. For good coupling, both end surfaces of each core sample were smoothed for standard testing, and the diameter and length of all core samples were measured and recorded. A total of 190 P-wave velocity tests were performed on the prepared core samples, with 39 24.9-mm-diameter samples, 36 38.1-mm-diameter samples, 29 47.7-mm-diameter samples, 63 53.9-mm-diameter samples, and 23 63.2-mm-diameter samples.
An accurate P-wave measurement requires perfect matching between the transducers and the end surfaces of the test samples, which enables good coupling. The UPV tests were conducted on the core samples using a Pundit Lab (Proceq, PL02-002-0276 B0) pulse generator unit with two transducers (54 kHz, 38.6 mm diameter). Each sample was evaluated under different environmental conditions, i.e., natural, dry, and saturated conditions, according to the American Society for Testing Materials (ASTM) standard [43]. To define the natural P-wave velocities, Vnp, 190 samples were tested under the assumption of in situ conditions. The dry P-wave velocities, Vdp, of the samples were measured after the samples were dried in an oven for 12–16 h at 105 °C; subsequently, all samples were cooled under laboratory conditions for approximately 48 h. For the saturated P-wave velocity, Vsp, the samples were saturated with distilled water for 48–50 h by soaking them in distilled water tank prior to P-wave velocity measurements.
As UPV tests are nondestructive, all samples used for UPV tests were further evaluated to determine the mechanical properties of limestone after being maintained under laboratory conditions for approximately 2 weeks. In total, 87 UCS, 50 PLIA, 45 PLID, 102 ITS, and 190 SHV tests were performed following the suggested ASTM standards [44,45,46,47], (see Table 1, second column).

3. Results and Discussion

Linear regression analyses were performed to assess the relationships between the ultrasonic P-wave velocities (Vnp, Vdp, and Vsp) and mechanical properties (UCS, PLIA, PLID, ITS, and SHV) of the limestone samples. The numbers and diameters of the rock samples for each test are given in Table 1. The best-fit line equation and the correlation coefficient, R, were also obtained, as displayed in Table 1.
In Figure 1, Figure 2, Figure 3, Figure 4 and Figure 5, the best-fit lines for each data set are shown. In all cases, linear regression was considered as the foremost representative for the best-fit relationships. The P-wave velocity values were highly scattered with respect to all mechanical properties of limestone, as shown in Figure 1, Figure 2, Figure 3, Figure 4 and Figure 5. This trend could be due to the anisotropic and nonhomogeneous nature of the rock samples and the influence of the sample diameter.
The relationships between the UCS and Vnp, Vdp, and Vsp for various sample diameters are displayed in Figure 1a–c. The correlation coefficient values have a range of 0.04–0.95 (Table 1). The maximum R-value was 0.95, indicating a strong correlation between the UCS and Vnp for a rock sample diameter of 63.2 mm. In contrast, no correlation was observed for Vdp at the same diameter. This result was unexpected and may be due to either invisible natural features of the tested samples or human error during the experiments. In addition, the International Society for Rock Mechanics (ISRM) [48] standard states that the specimen diameter for the UCS test should not be less than the NX core size (approximately 54 mm). Therefore, the 53.9-mm sample diameter could be considered to provide the best correlation between the P-wave velocities and UCS.
Figure 2a–c displays the relationships between PLID and Vnp, Vdp, and Vsp for different sample diameters. The R-values ranged from moderate to strong (0.58–0.98) (Table 1). In general, the correlations between PLID and the P-wave velocities were relatively strong. The maximum R-value was observed for PLID and Vsp at a sample diameter of 38.1 mm.
The values of PLIA are plotted as a function of Vnp, Vdp, and Vsp for various sample diameters in Figure 3a–c. The correlations between PLIA and the P-wave velocities exhibit strong variations, ranging from negative to positive (weak to strong) with R-values of −0.29 to 0.92 (Table 1). The maximum and minimum correlation coefficient (R) values were acquired for Vnp and Vsp at sample diameters of 47.7 and 63.2 mm, respectively.
For different sample diameters, the relationships between the ITS and Vnp, Vdp, and Vsp are presented in Figure 4a–c. Except for the 24.9-mm diameter samples, the R-values indicated moderate to strong correlations, with a range of 0.62–0.83 (Table 1). The minimum and maximum R-values were observed for Vsp and the Vnp at sample diameters of 24.9 and 63.2 mm, respectively.
Figure 5a–c illustrates the relationships between the SHV and Vnp, Vdp, and Vsp for various sample diameters. The R-values exhibited weak to strong correlations, ranging from 0.34 to 0.71 (Table 1). The maximum and minimum correlation values (R) were obtained for Vnp and Vdp at sample diameters of 63.2 and 47.7 mm, respectively.
The previous researchers commonly focused on correlations between the UPV and rock properties, mechanical and physical, for various types of rocks [13,14,15,16,17,18,19,20,21,22,23,24,25,26,27,28,29,30,31,32,33,34,35,36]. Only few researchers investigated the predictability of wet-rock Vp based on the dry-rock Vp, correlated the physicomechanical properties of rocks with ultrasonic P- and S-wave velocities, assessed some geotechnical parameters under various environmental conditions using ultrasonic S- and P-wave measurements, and suggested a multi-exponent model to predict the UCS for various rock types [37,40,41,42]. Moreover, limited researchers studied the effects of sample length on P-wave velocities of dry and saturated core samples. They reported that the sample length strongly affected the P-wave velocities and suggested 75 or 109 mm as the ideal or the threshold specimen length of core specimen for limestones. The variation in the suggested sample length and the threshold could be due to sample origin, chemical characterization, texture, etc., since samples were collected from different locations [38,39].
In the present study, beside the correlation of the natural, dry, and saturated P-wave velocities with the mechanical properties of limestone, the effects of sample diameter on the ultrasonic P-wave velocities and mechanical properties of limestone, which were not addressed before in literature, were studied in detail. There are no similarities in terms of the main concept of this study with the previous investigations. As it was used in some previous studies, limestone was selected as a rock material for the UPV tests under various environmental conditions and mechanical tests due to availability and accessibility in the study area. Nevertheless, the study provides a new perspective especially on how the ultrasonic P-wave velocities and mechanical properties of limestone are affected by the core sample diameter.

4. Conclusions

In this study, P-wave velocities under natural, dry, and saturated conditions, as well as the UCS, PLIA and PLID, the ITS, and the SHV, were measured for 190 limestone core samples with various sample dimensions. The P-wave velocities and the mechanical properties of limestone samples with various diameters were correlated by means of linear regression analyses, and the equation of the best-fit line and the correlation coefficient, R, were determined and interpreted. Furthermore, we investigated the effect of the sample diameter on the P-wave velocities and mechanical features of limestone. Based on the test results, the following conclusions were attained:
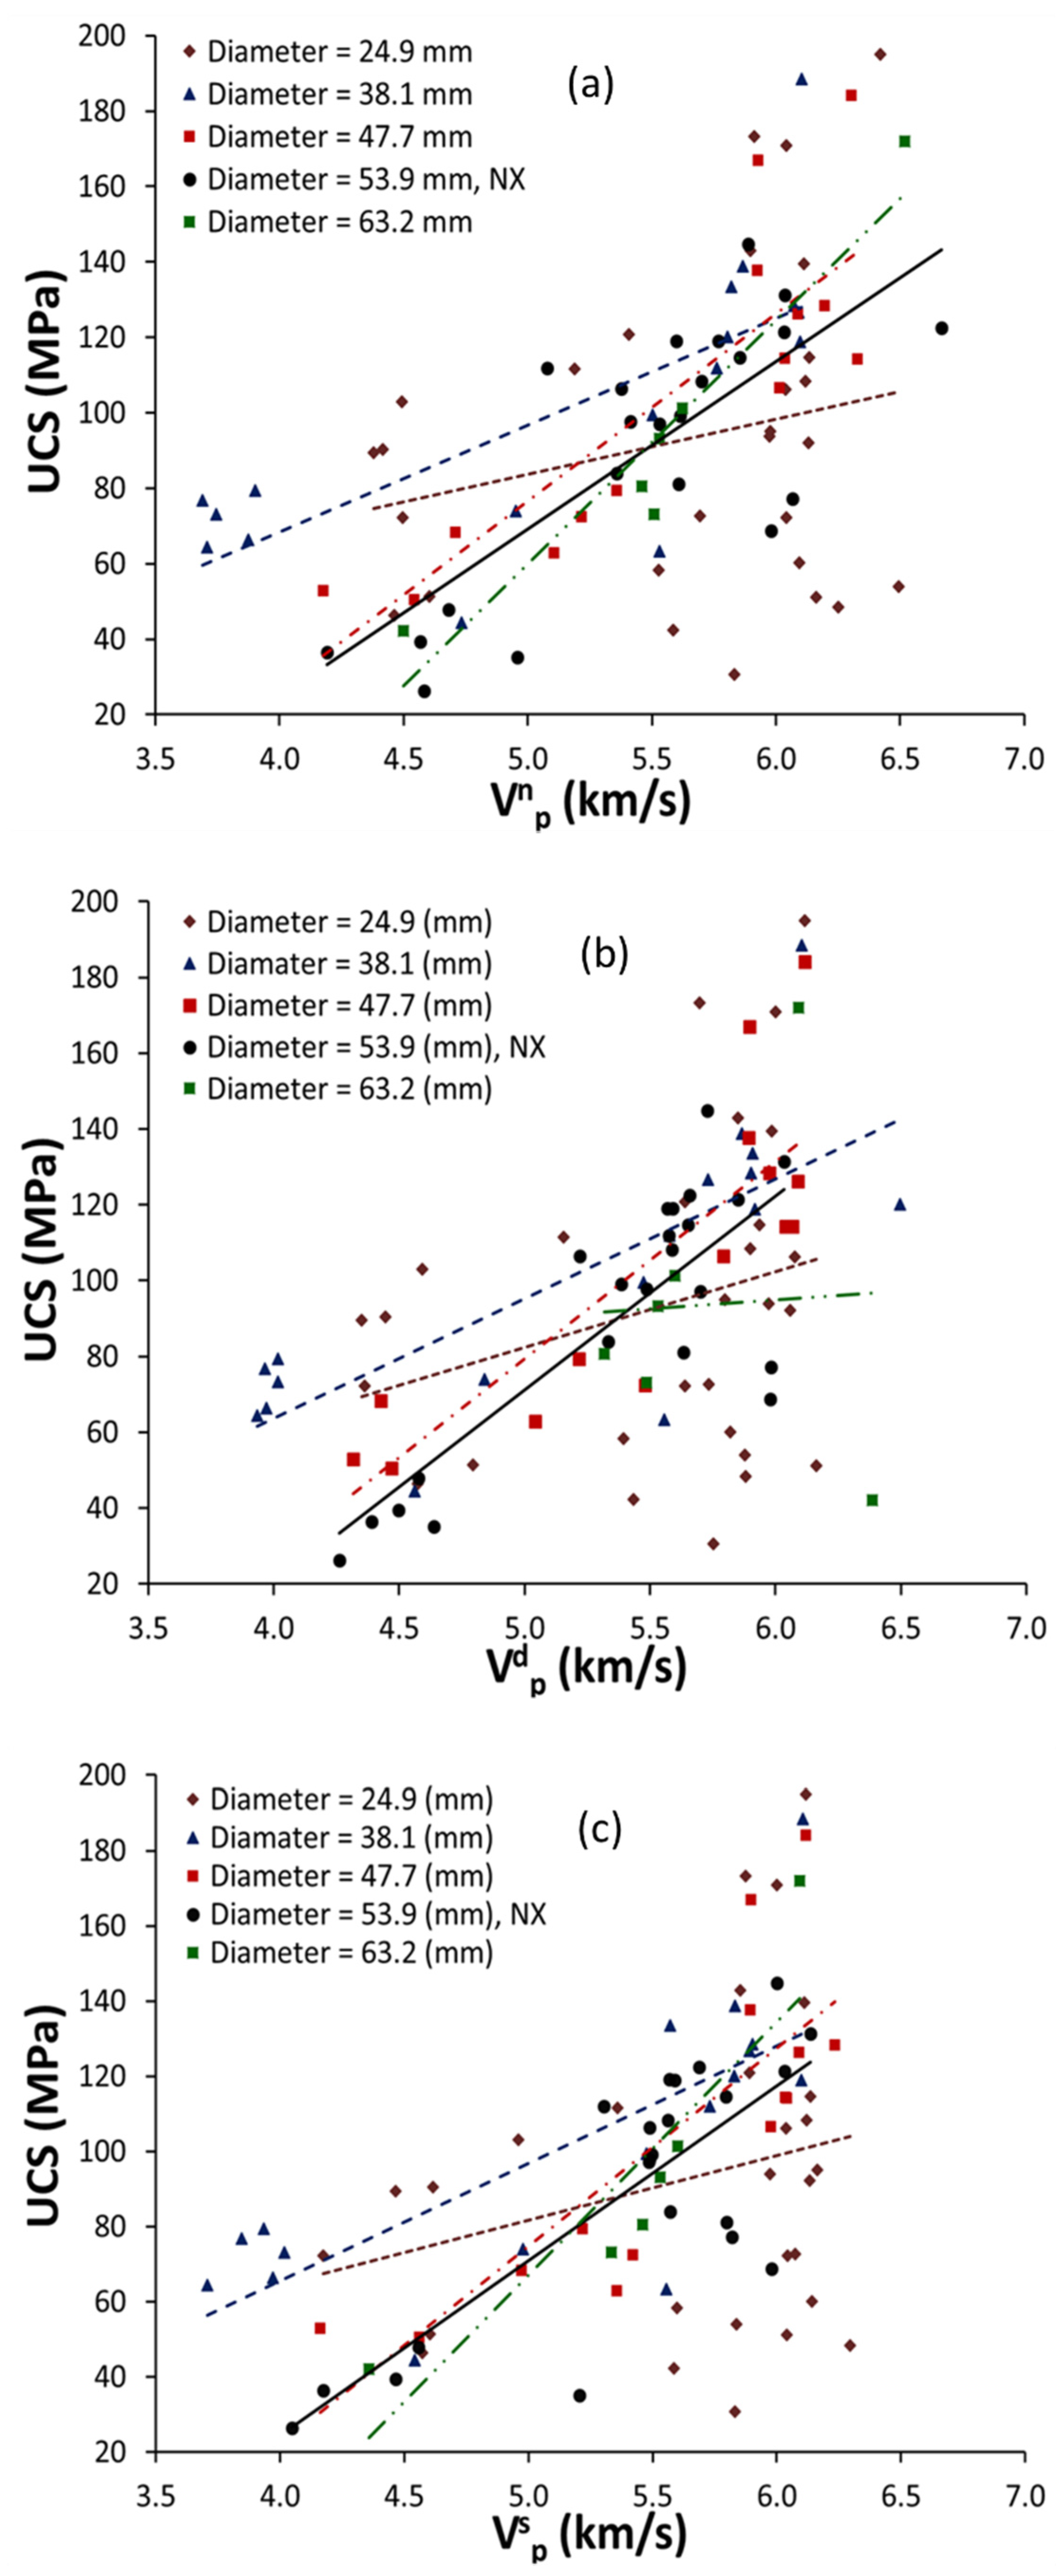
  • In general, a notable increasing trend of R-values for the UCS and P-wave velocities of limestone was observed with increasing sample diameter, with the exception of a correlation coefficient value of 0.04 for Vdp and the 63.2-mm sample diameter. This result indicates that the UCS and P-wave velocities are affected by the sample diameter. Moreover, the variations in R-values with different P-wave velocities were negligible for a given sample diameter excluding 63.2-mm.
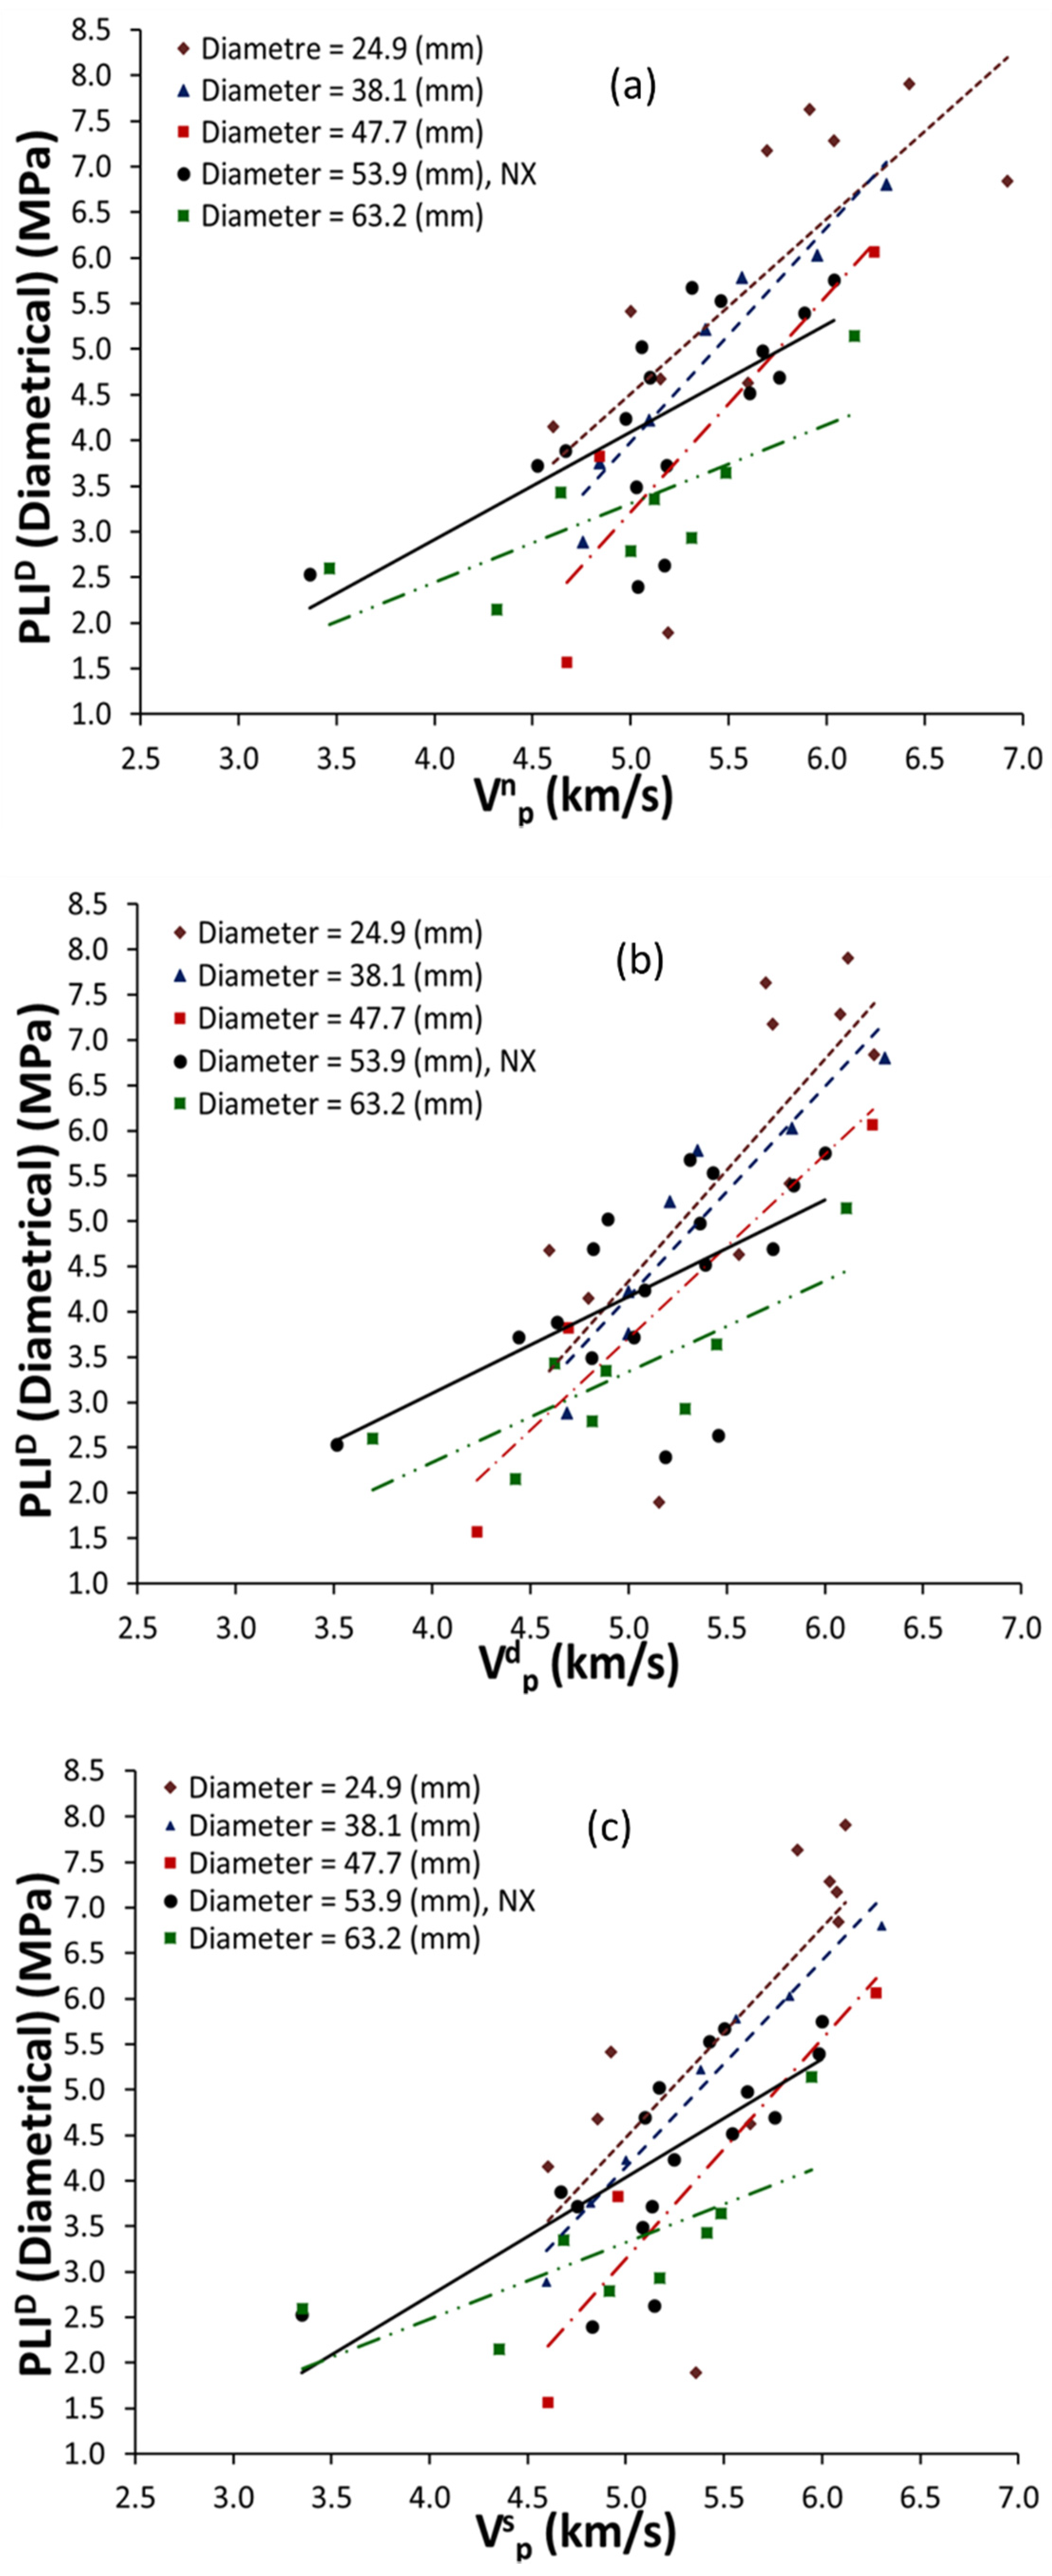
  • The R-values for the PLID and P-wave velocities of limestone showed fluctuations for various sample diameters. Nevertheless, an effect of sample diameter on the P-wave velocity and PLID was still visible. Furthermore, the variations in R-values for different P-wave velocities at a constant diameter were limited, except for the NX sample diameter.
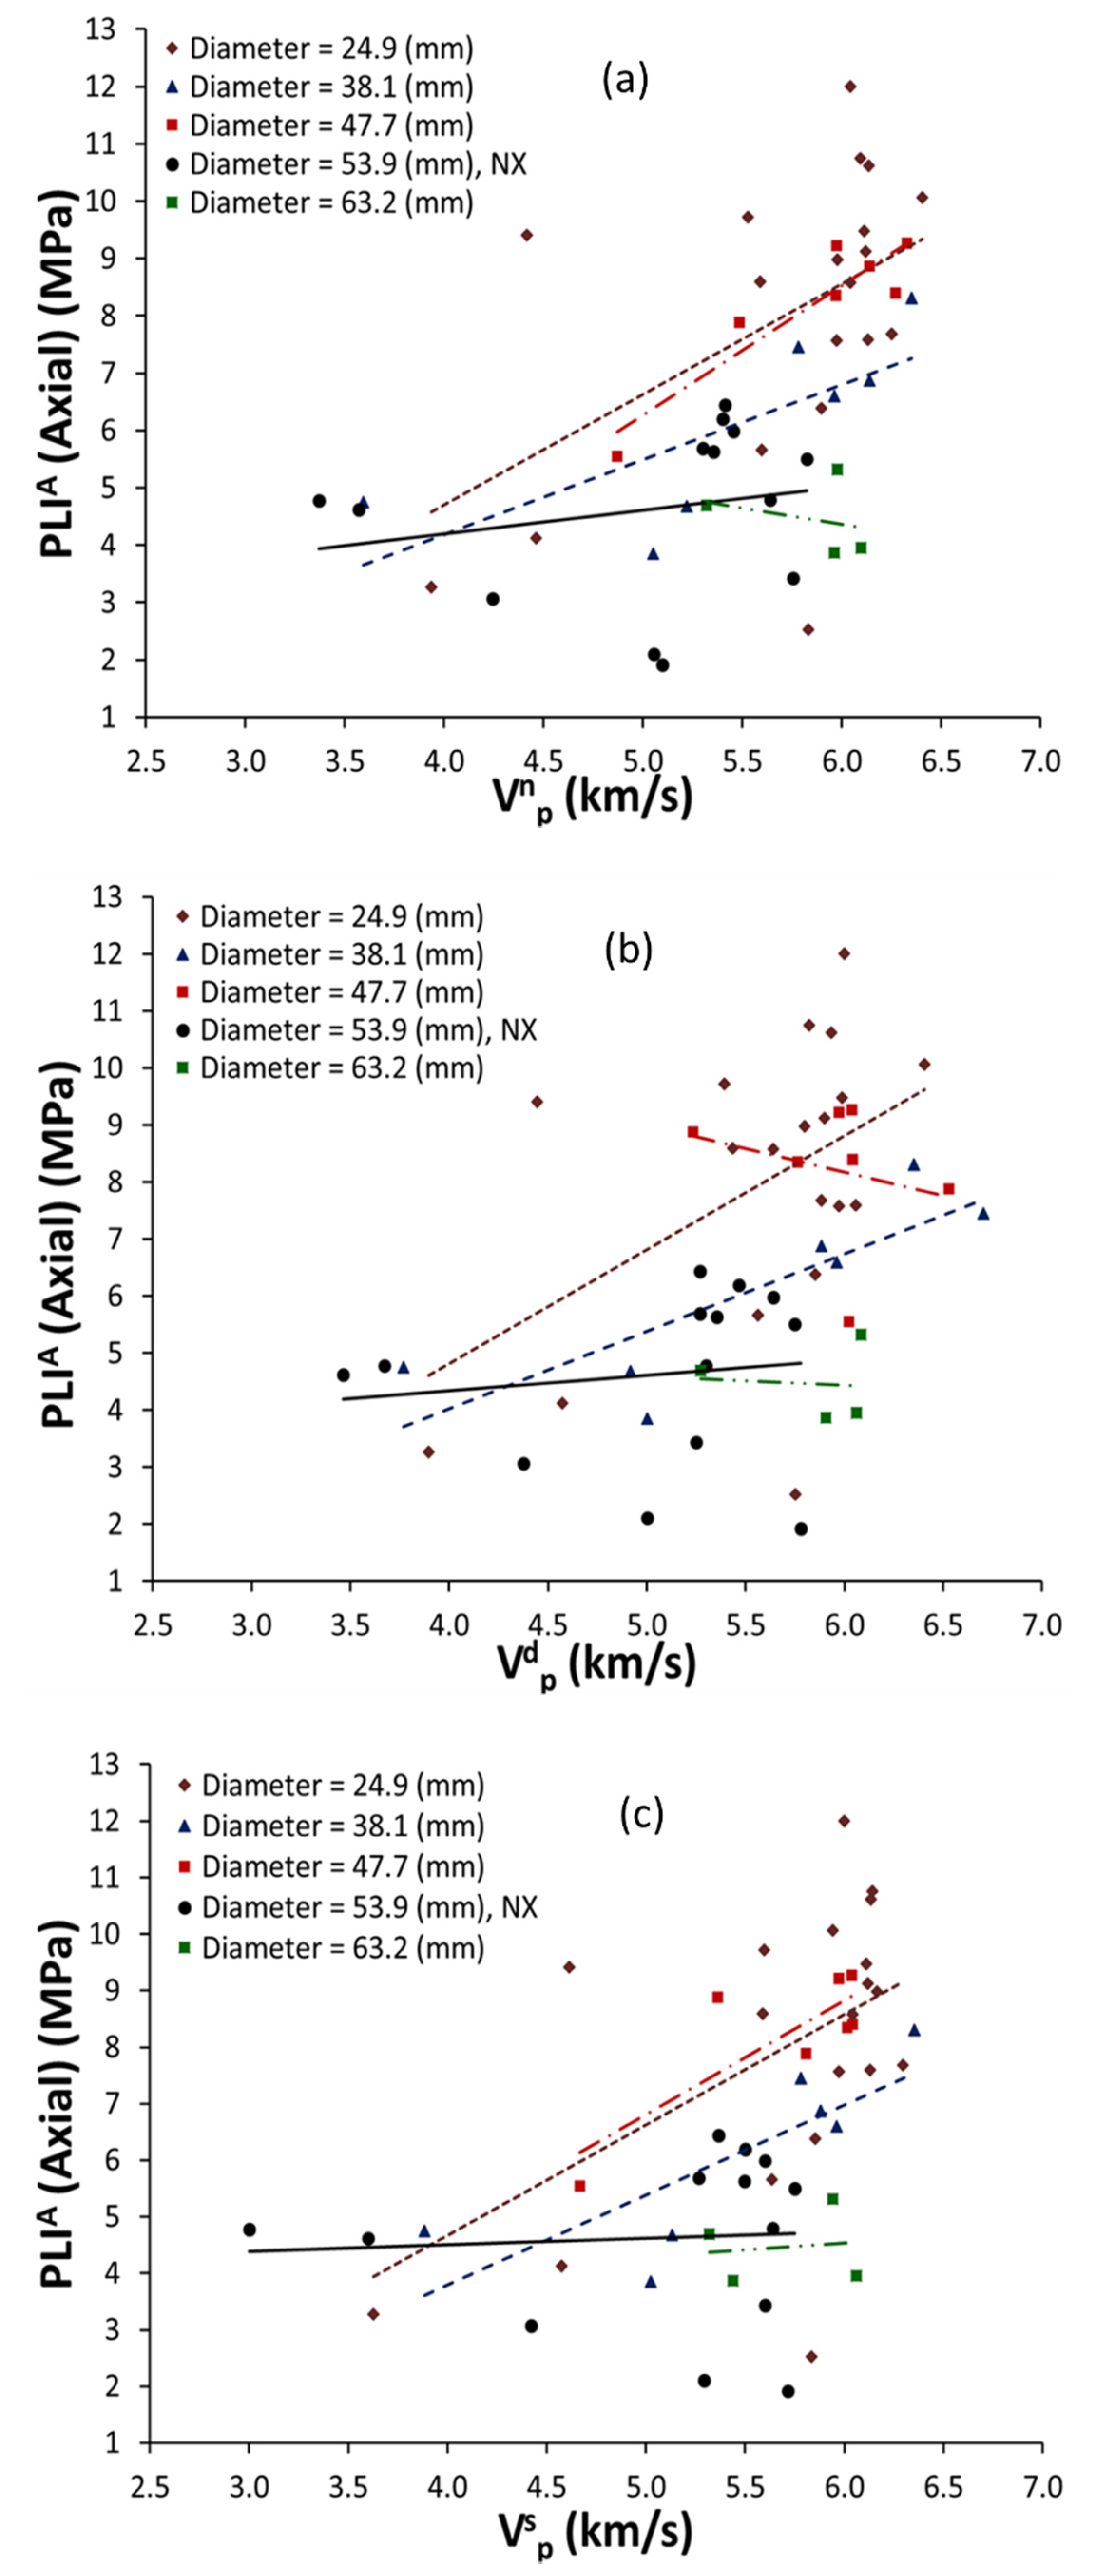
  • Due to data fluctuations, there was no specific trend in R-value for the PLIA and P-wave velocities of limestone for different sample diameters. Thus, it was difficult to interpret the direct influence of specimen diameter on the P-wave velocity and PLIA. Moreover, variations in R-values for different P-wave velocities at a given diameter were observed, particularly for a sample diameter of 47.7 mm.
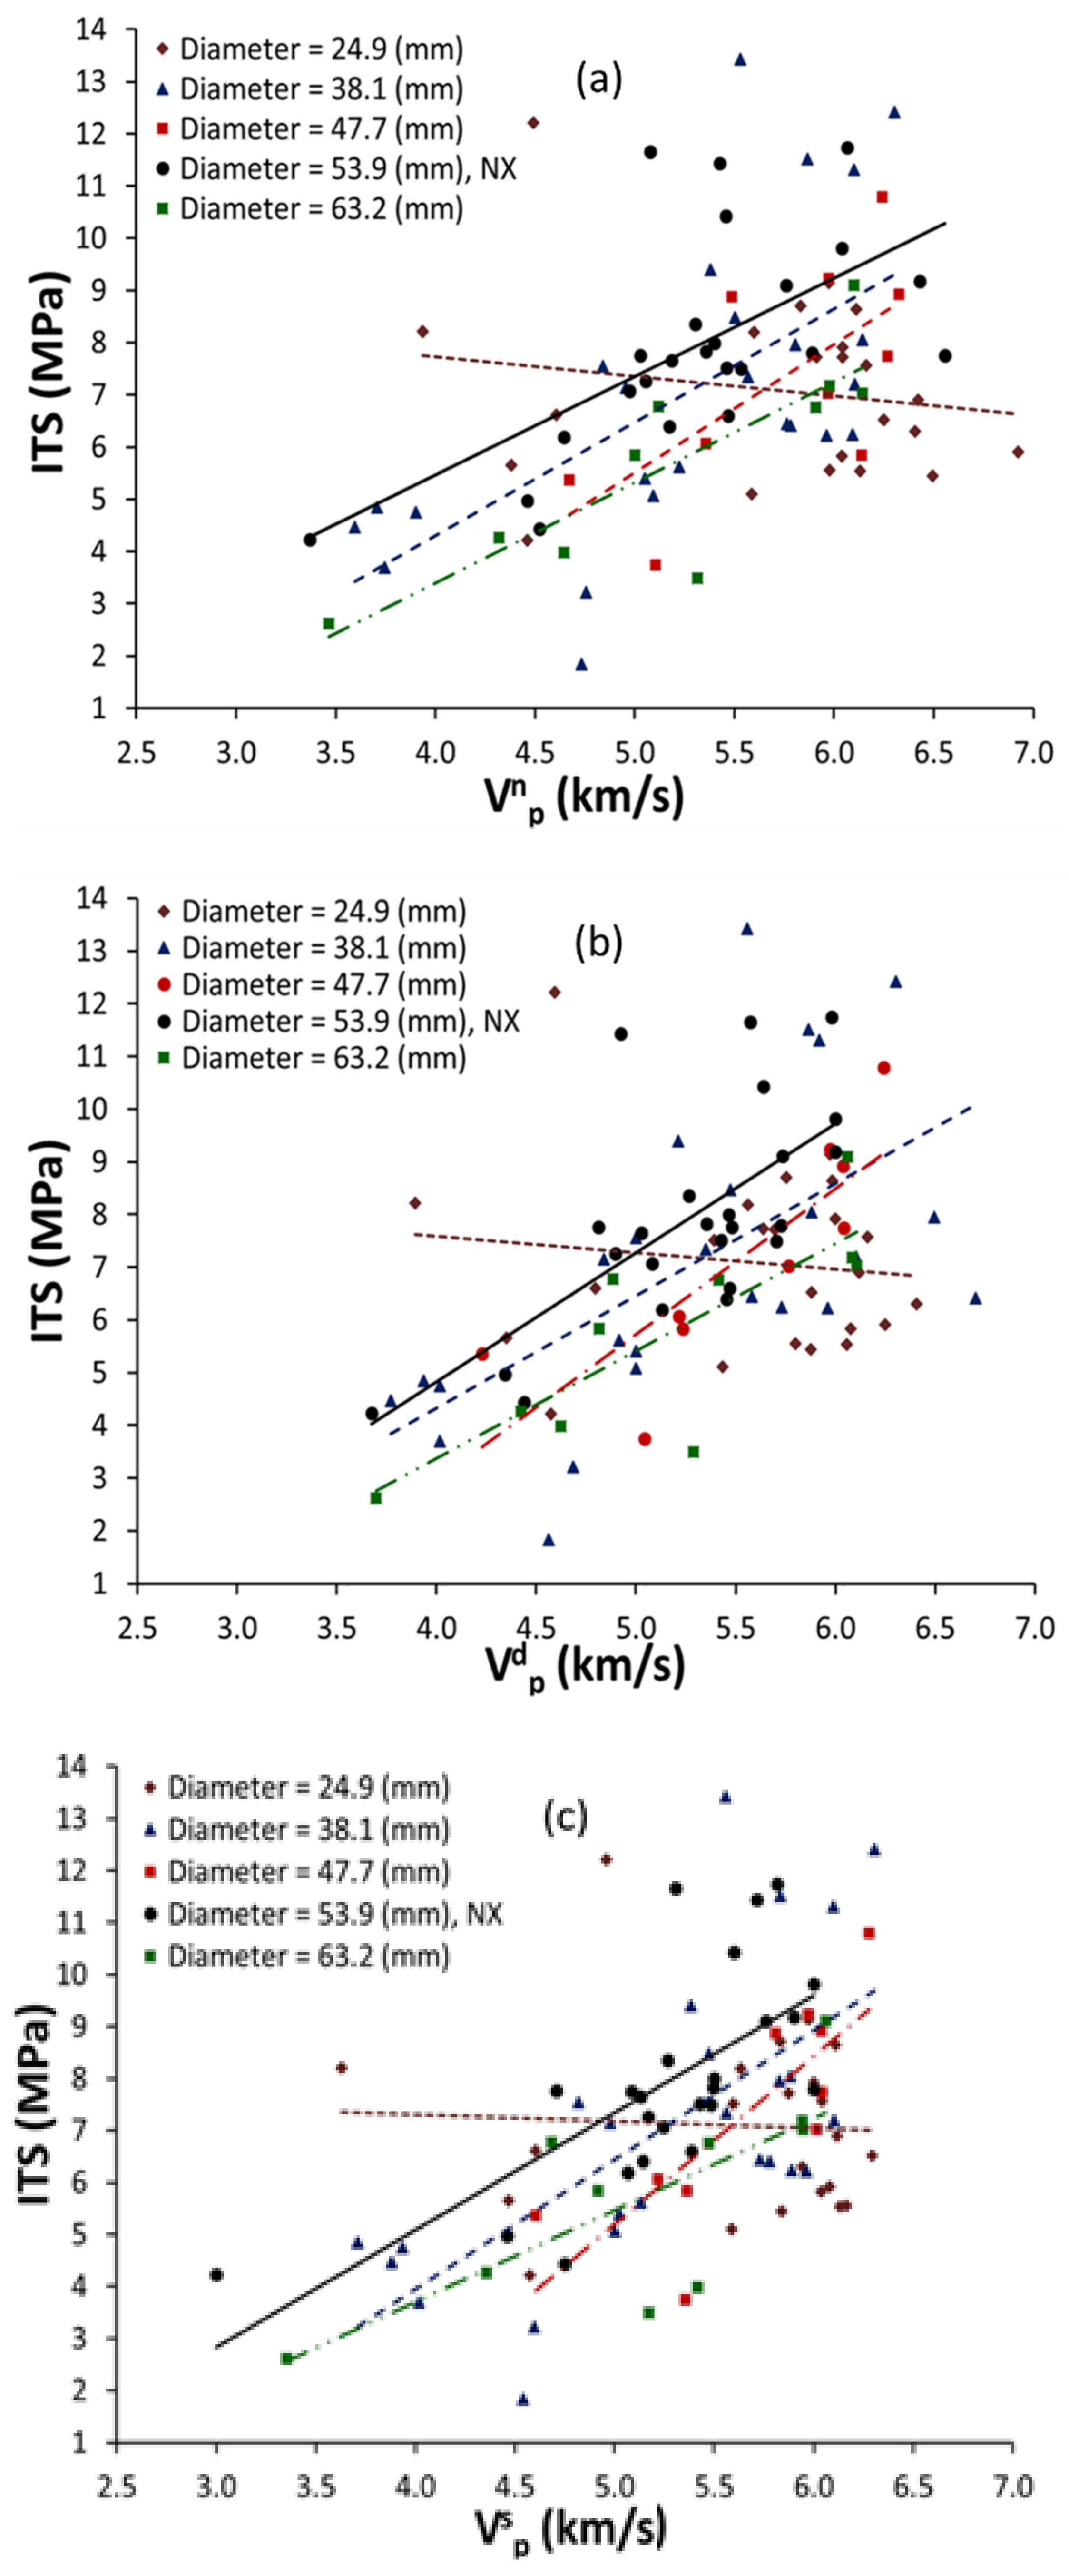
  • There was a notable trend in correlation coefficient values, R, for the ITS and P-wave velocities of limestone for various sample diameters, except for the 24.9-mm sample diameter. Thus, an influence of specimen diameter on the P-wave velocity and ITS was observed. In addition, variations in R-values for different P-wave velocities at a constant diameter were observed, but were generally insignificant.
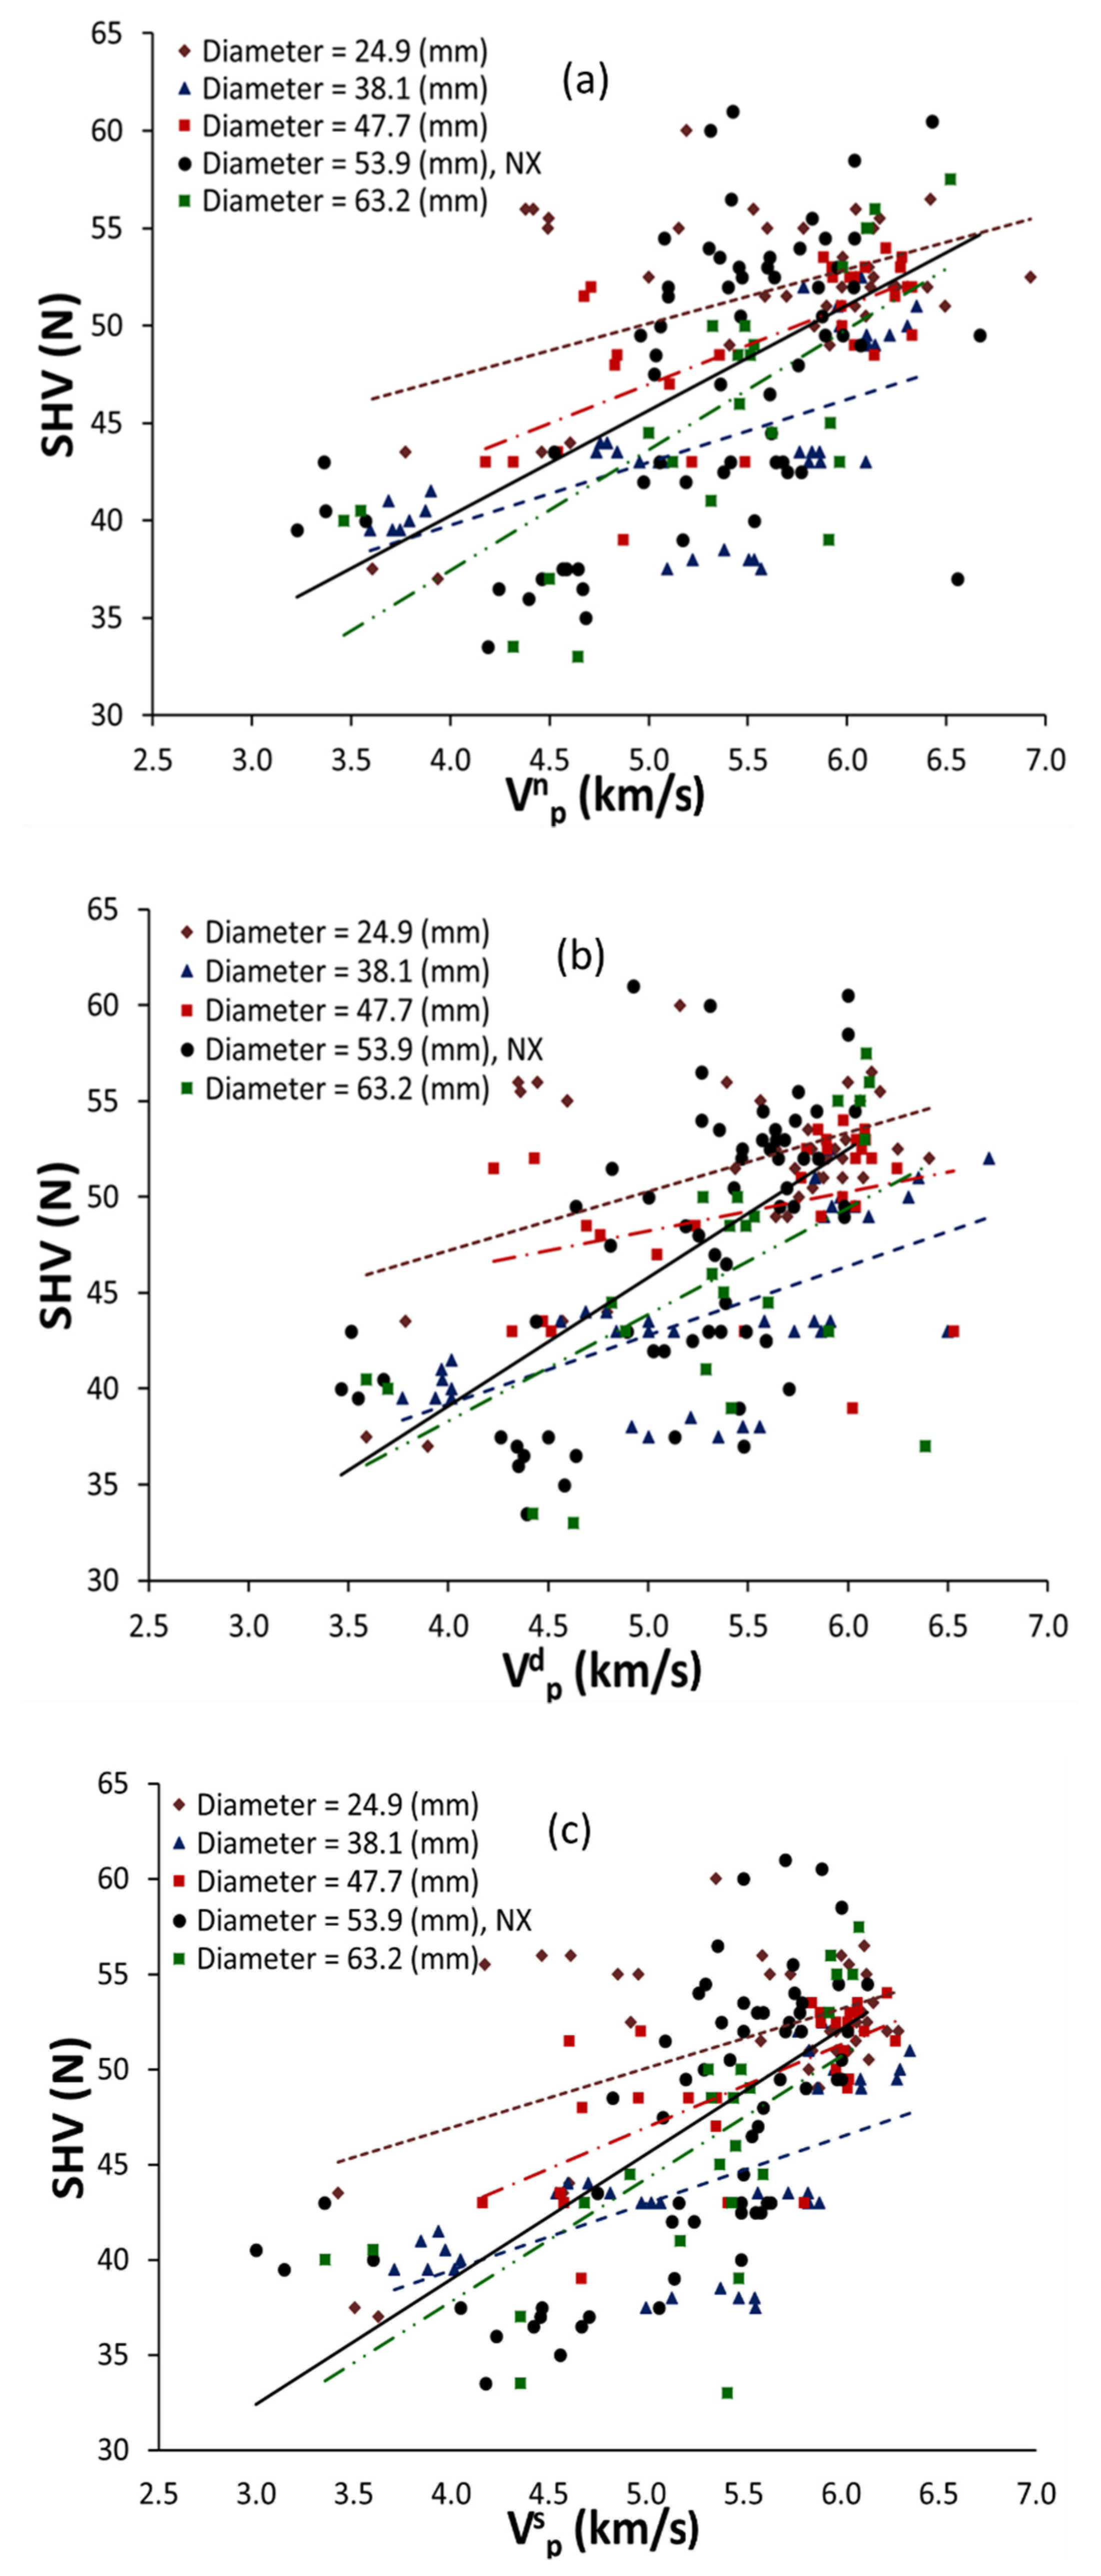
  • An increasing trend of P-values for the SHV and P-wave velocities of limestone for different sample diameters was observed. Accordingly, the SHV and P-wave velocity were visibly affected by the sample diameter. Furthermore, variations in R-values for different P-wave velocities at a constant diameter were observed, except for the 47.7-mm-diameter samples.

Author Contributions

Conceptualization, methodology, investigation, data acquisition, validation, supervision, writing—original draft, writing—review and editing, H.A. and investigation, data acquisition, validation, S.P. Both authors have read and agreed to the published version of the manuscript.

Funding

This study was financially supported in part by the United Arab Emirates University, Research Affairs under a SURE 2016 grant.

Acknowledgments

The laboratory work was conducted at the Environmental and Engineering Laboratory at the Department of Geosciences, the United Arab Emirates University. The authors would like to thank the United Arab Emirates University, Research Affairs, for their generous support and encouragement.

Conflicts of Interest

The authors declare no conflict of interest.

References

  1. Knill, T.L. The application of seismic methods in the prediction of grout take in rock. In Proceedings of the Conference on In Ditu Investigation in Soils and Rocks, London, UK, 13–15 May 1969; British Geotechnical Society: London, UK, 1970; pp. 93–100. [Google Scholar]
  2. Turk, N.; Dearman, W.R. Assessment of grouting efficiency in a rock mass in terms of seismic velocities. Bull. Int. Assoc. Eng. Geol. 1987, 36, 101–108. [Google Scholar] [CrossRef]
  3. Price, D.G.; Malone, A.W.; Knill, T.L. The application of seismic methods in the design of rock bolt system. In Proceedings of the First International Congress, Paris, France, 8–11 September 1970; International Association of Engineering Geology: Paris, France, 1970; Volume 2, pp. 740–752. [Google Scholar]
  4. Young, R.P.; Hill, T.T.; Bryan, I.R.; Middleton, R. Seismic spectroscopy in fracture characterization. Quart. J. Eng. Geol. 1985, 18, 459–479. [Google Scholar] [CrossRef]
  5. Onodera, T.F. Dynamic investigation of foundation rocks, in situ. In Proceedings of the 5th US Symposium on Rock Mechanics; Pergamon Press: New York, NY, USA, 1963; pp. 517–533. [Google Scholar]
  6. Gladwin, M.T. Ultrasonic stress monitoring in underground mining. Int. J. Rock Mech. Min. Sci. 1982, 19, 221–228. [Google Scholar] [CrossRef]
  7. Karpuz, C.; Pasamehmetoglu, A.G. Field characterization of weathered Ankara andesites. Eng. Geol. 1997, 46, 1–17. [Google Scholar] [CrossRef]
  8. Dearman, W.R.; Turk, N.; Irfan, Y.; Rowshanei, H. Detection of rock material variation by sonic velocity zoning. Bull. Int. Assoc. Eng. Geol. 1987, 35, 3–8. [Google Scholar] [CrossRef]
  9. Turk, N.; Dearman, W.R. A suggested approach to rock characterization in terms of seismic velocities. In Proceedings of the 27th US Symposium on Rock Mechanics, Tuscaloosa, AL, USA, 23–25 June 1986; Society of Mining Engineers, American Rock Mechanics Association: Alexandria, VA, USA, 1986; pp. 168–175. [Google Scholar]
  10. Boadu, F.K. Fractured rock mass characterization parameters and seismic properties: Analytical studies. J. Appl. Geophys. 1997, 36, 1–19. [Google Scholar] [CrossRef]
  11. Hudson, J.A.; Jones, E.T.W.; New, B.M. P-wave velocity measurement in a machine bored chalk tunnel. Q. J. Eng. Geol. 1980, 13, 33–43. [Google Scholar] [CrossRef]
  12. Ozkahraman, H.T.; Selver, R.; Isik, E.C. Determination of the thermal conductivity of rock from P-wave velocity. Int. J. Rock Mech. Min. Sci. 2004, 41, 703–708. [Google Scholar] [CrossRef]
  13. Kahraman, S.; Soylemez, M.; Fener, M. Determination of fracture depth of rock blocks from p-wave velocity. Bull. Eng. Geol. Env. 2008, 67, 11–16. [Google Scholar] [CrossRef]
  14. O’Connel, R.J.; Budiansky, B. Seismic velocities in dry and saturated cracked rock. J. Geophys. Res. 1974, 79, 5412–5426. [Google Scholar] [CrossRef]
  15. Hudson, J.A. Wave speed and attenuation of elastic waves in material containing cracks. Geophys. J. R. Astr. Soc. 1981, 64, 133–150. [Google Scholar] [CrossRef]
  16. King, M.S.; Chaudhry, N.A.; Shakeel, A. Experimental ultrasonic velocities and permeability for sandstones with aligned cracks. Int. J. Rock Mech. Min. Sci. 1995, 32, 155–163. [Google Scholar] [CrossRef]
  17. Watanabe, T.; Sassa, K. Velocity and amplitude of P-waves transmitted through fractured zones composed of multiple thin low-velocity layers. Int. J. Rock Mech. Min. Sci. 1995, 32, 313–324. [Google Scholar] [CrossRef]
  18. Kahraman, S. A correlation between P-wave velocity, number of joints and Schmidt hammer rebound number. Int. J. Rock Mech. Min. Sci. 2001, 38, 729–733. [Google Scholar] [CrossRef]
  19. Kahraman, S. The effects of fracture roughness on P-wave velocity. Eng. Geol. 2002, 63, 347–350. [Google Scholar] [CrossRef]
  20. Grossi, D.; Del Lama, E.A. Ultrasound technique to assess the physical conditions of the Monument to Ramos de Azevedo, city of Sao Paulo, Brazil. Rem Rev. Esc. Minas Online 2015, 68, 171–176. [Google Scholar] [CrossRef] [Green Version]
  21. Bozdag, A.; Ince, I.; Bozdag, A.; Hatir, M.E.; Tosunlar, M.B.; Korkanc, M. An assessment of deterioration in cultural heritage: The unique case of Eflatunpınar Hittite Water Monument in Konya, Turkey. Bull. Eng. Geol. Environ. 2020, 79, 1185–1197. [Google Scholar] [CrossRef]
  22. Pappalardo, G.; Mineo, S.; Monaco, C. Geotechnical characterization of limestone employed for the reconstruction of a UNESCO world heritage Baroque Monument in southeastern Sicily (Italy). Eng. Geol. 2016, 212, 86–97. [Google Scholar] [CrossRef]
  23. Vasconcelos, G.; Lourenco, P.B.; Alves, C.A.S.; Pamplona, J. Ultrasonic evaluation of the physical and mechanical properties of granites. Ultrasonics 2008, 48, 453–466. [Google Scholar] [CrossRef] [Green Version]
  24. Hatir, M.E.; Korkac, M.; Basar, M.E. Evaluating the deterioration effects of building stones using NDT: The Kucukkoy Church, Cappadocia Region, central Turkey. Bull. Eng. Geol. Environ. 2019, 78, 3465–3478. [Google Scholar] [CrossRef]
  25. Yasar, E.; Erdogan, Y. Correlating sound velocity with density, compressive strength and Young’s modulus of carbonate rocks. Int. J. Rock Mech. Min. Sci. 2004, 41, 871–875. [Google Scholar] [CrossRef]
  26. Kahraman, S.; Yeken, T. Determination of physical properties of carbonate rocks from P-wave velocity. Bull. Eng. Geol. Environ. 2009, 67, 277–281. [Google Scholar] [CrossRef]
  27. Khandelwal, M.; Ranjith, P.G. Correlating index properties of rocks with P-wave measurements. J. Appl. Geophys. 2010, 71, 1–5. [Google Scholar] [CrossRef]
  28. Sarkar, K.; Vishal, V.; Singh, T.N. An empirical correlation of index geomechanical parameters with the compressional wave velocity. Geotech. Geol. Eng. 2012, 30, 469–479. [Google Scholar] [CrossRef]
  29. Karakul, H.; Ulusay, R. Empirical correlations for predicting strength properties of rocks from P-wave velocity under different degree of saturation. Rock Mech. Rock Eng. 2013, 46, 981–999. [Google Scholar] [CrossRef]
  30. Karakus, A.; Akatay, M. Determination of basic physical and mechanical properties of basaltic rocks from P-wave velocity. Nondestruct. Test. Eval. 2013, 28, 342–353. [Google Scholar] [CrossRef]
  31. Kurtulus, C.; Sertcelik, F.; Sertcelik, I. Correlating physico-mechanical properties of intact rocks with P-wave velocity. Acta Geod. Geophys. 2016, 51, 575–582. [Google Scholar] [CrossRef] [Green Version]
  32. Jamshidi, A.; Zamanian, H.; Sahamieh, R.Z. The effect of density and porosity on the correlation between uniaxial compressive strength and P-wave velocity. Rock Mech. Rock Eng. 2018, 51, 1279–1286. [Google Scholar] [CrossRef]
  33. Aldeeky, H.; Al Hattamleh, O. Prediction of engineering properties of basalt rock in Jordan using ultrasonic pulse velocity test. Geotech. Geol. Eng. 2018, 36, 3511–3525. [Google Scholar] [CrossRef]
  34. Wen, L.; Luo, Z.Q.; Yang, S.J.; Qin, Y.G.; Wang, W. Correlation of geo-mechanics parameters with uniaxial compressive strength and P-wave velocity on dolomitic limestone using a statistical method. Geotech. Geol. Eng. 2019, 37, 1079–1094. [Google Scholar] [CrossRef]
  35. Garia, S.; Pal, A.K.; Ravi, K.; Nair, A.M. A comprehensive analysis on the relationships between elastic wave velocities and petrophysical properties of sedimentary rocks based on laboratory measurements. J. Pet. Explor. Prod. Technol. 2019, 9, 1869–1881. [Google Scholar] [CrossRef] [Green Version]
  36. Gomez-Heras, M.; Benavente, D.; Pla, C.; Martinez-Martinez, J.; Fort, R.; Brotons, V. Ultrasonic pulse velocity as a way of improving uniaxial compressive strength estimations from Leeb hardness measurements. Constr. Build. Mater. 2020, 261, 119996. [Google Scholar] [CrossRef]
  37. Kahraman, S. The correlations between the saturated and dry P-wave velocity of rocks. Ultrasonics 2007, 46, 341–348. [Google Scholar] [CrossRef] [PubMed]
  38. Karaman, K.; Kaya, A.; Kesimal, A. Effect of the specimen length on ultrasonic P-wave velocity in some volcanic rocks and limestones. J. Afr. Earth Sci. 2015, 112, 142–149. [Google Scholar] [CrossRef]
  39. Ercikdi, B.; Karaman, K.; Cihangir, F.; Yilmaz, T.; Aliyazicioglu, S.; Kesimal, A. Core size effect on the dry and saturated ultrasonic pulse velocity of limestone samples. Ultrasonics 2016, 72, 143–149. [Google Scholar] [CrossRef]
  40. Chawre, B. Correlations between ultrasonic P-wave velocities and rock properties of quartz-mica schist. J. Rock Mech. Geotech. Eng. 2018, 10, 594–602. [Google Scholar] [CrossRef]
  41. Kumar, S.; Mishra, A.K.; Choudhary, B.S. P and S wave velocity of rock in Jharia coalfield region for assessment of its geotechnical properties in dry, semi-saturated and saturated conditions. Ann. Chim. Sci. Matériaux. 2018, 41, 209–223. [Google Scholar] [CrossRef]
  42. Gonzalez, J.; Saldafia, M.; Arzua, J. Analytical model for predicting the UCS from P-wave velocity, density, and porosity on saturated limestone. Appl. Sci. Eng. 2019, 9, 5265. [Google Scholar] [CrossRef] [Green Version]
  43. ASTM. ASTM D2845-08, Standard Test Method for Laboratory Determination of Pulse Velocities and Ultrasonic Elastic Constants of Rock (Withdrawn 2017); ASTM International: West Conshohocken, PA, USA, 2008. [Google Scholar]
  44. ASTM. ASTM D2938-95, Standard Test Method for Unconfined Compressive Strength of Intact Rock Core Specimens; ASTM International: West Conshohocken, PA, USA, 1995. [Google Scholar]
  45. ASTM. ASTM D5731-02, Standard Test Method for Determination of the Point Load Strength Index of Intact Rock; ASTM International: West Conshohocken, PA, USA, 2002. [Google Scholar]
  46. ASTM. ASTM D3967-95a, Standard Test Method for Splitting Tensile Strength of Intact Rock Core Specimens; ASTM International: West Conshohocken, PA, USA, 2001. [Google Scholar]
  47. ASTM. ASTM D5873-95, Standard Test Method for Determination of Rock Hardness by Rebound Hammer Method; ASTM International: West Conshohocken, PA, USA, 1995. [Google Scholar]
  48. ISRM. ISRM suggested methods, rock characterization testing and monitoring. In International Society of Rock Mechanics. Commission on Testing Methods; Brown, E.T., Ed.; Pergamon Press: Oxford, UK, 1981; pp. 113–114. [Google Scholar]
Figure 1. Variation in uniaxial compressive strength (UCS) values. UCS plotted as a function of (a) Vnp, (b) Vdp, and (c) Vsp for different sample diameters.
Applsci 10 09134 g001
Figure 2. Variation in PLID values. PLID plotted as a function of (a) Vnp, (b) Vdp, and (c) Vsp for different sample diameters.
Applsci 10 09134 g002
Figure 3. Variation in PLIA values. PLIA plotted as a function of (a) Vnp, (b) Vdp, and (c) Vsp for different sample diameters.
Applsci 10 09134 g003
Figure 4. Variation in indirect tensile strength (ITS) values. ITS plotted as a function of (a) Vnp, (b) Vdp, and (c) Vsp for different sample diameters.
Applsci 10 09134 g004
Figure 5. Variation in Schmidt hammer value (SHV). SHV plotted as a function (a) Vnp, (b) Vdp, and (c) Vsp for different sample diameters.
Applsci 10 09134 g005
Table 1. Representative empirical relation and correlation coefficient values of mechanical properties and natural, dry, and saturated P-wave velocities of limestone samples with various diameters.
Natural P-Wave Velocity (Vnp)Dry P-Wave Velocity (Vdp)Saturated P-Wave Velocity (Vsp)
Mechanical Property (Number of Samples)Empirical RelationR-ValueEquationR-ValueEquationR-Value
Diameter = 24.9 (mm)UCS (MPa) (28)UCS = 14.63Vnp + 10.640.23UCS = 19.98Vdp − 17.450.27UCS = 17.20Vsp − 4.30.25
PLID (MPa) (10)PLID = 1.92Vnp − 5.080.69PLID = 2.45Vdp − 7.920.71PLID = 2.32Vsp − 7.10.69
PLIA (MPa) (19)PLIA = 1.93Vnp − 30.51PLIA = 2Vdp − 3.160.49PLIA = 1.96Vsp − 3.140.52
ITS (MPa) (25)ITS = −0.38Vnp + 9.24−0.17ITS = −0.32Vdp + 8.86−0.12ITS = −0.31Vsp + 7.84−0.05
SHV (N) (39)SHV = 2.79Vnp + 36.190.48SHV = 3.07Vdp + 34.920.47SHV = 3.13Vsp + 34.430.53
Diameter = 38.1 (mm)UCS (MPa) (17)UCS = 28.37Vnp − 45.140.74UCS = 31.53Vdp − 62.40.77UCS = 31.27Vsp − 59.50.76
PLID (MPa) (7)PLID = 2.35Vnp − 7.750.97PLID = 2.33Vdp − 7.470.93PLID = 2.28Vsp − 7.240.98
PLIA (MPa) (7)PLIA = 1.31Vnp − 1.040.74PLIA = 1.36Vdp − 1.430.83PLIA = 1.6Vsp − 2.580.8
ITS (MPa) (31)ITS = 2.18Vnp − 4.40.62ITS = 2.13Vdp − 4.170.62ITS = 2.49Vsp − 60.66
SHV (N) (36)SHV = 3.23Vnp + 26.80.61SHV = 3.6Vdp + 24.80.65SHV = 3.5Vsp + 25.470.61
Diameter = 47.7 (mm)UCS (MPa) (14)UCS = 49.7Vnp −171.80.84UCS = 52Vdp − 180.730.83UCS = 52.68Vsp − 188.730.81
PLID (MPa) (3)PLID = 2.38Vnp − 8.630.91PLID = 2.036Vdp − 6.450.95PLID = 2.42Vsp − 8.940.95
PLIA (MPa) (7)PLIA = 2.26Vnp − 5.050.92PLIA = −0.83Vdp + 13.14−0.25PLIA = 2.02Vsp − 3.290.82
ITS (MPa) (11)ITS = 2.46Vnp − 6.80.65ITS = 2.77Vdp − 8.080.82ITS = 3.23Vsp − 10.930.78
SHV (N) (29)SHV = 4.02Vnp + 26.90.68SHV = 2.04Vdp + 38.040.34SHV = 4.37Vsp + 25.120.67
Diameter = 53.9 (mm), NXUCS (MPa) (22)UCS = 44.4Vnp − 1530.76UCS = 51.17Vdp − 184.720.8UCS = 46.5Vsp − 161.570.79
PLID (MPa) (17)PLID = 1.18Vnp − 1.800.67PLID = 1.07Vdp − 1.160.58PLID = 1.3Vsp − 2.460.73
PLIA (MPa) (13)PLIA = 0.41Vnp + 2.570.21PLIA = 0.27Vdp + 3.260.13PLIA = 0.11Vsp + 4.050.1
ITS (MPa) (24)ITS = 1.89Vnp − 2.080.62ITS = 2.45Vnp − 4.970.67ITS = 2.25Vsp − 3.930.69
SHV (N) (63)SHV = 5.4Vnp + 18.680.55SHV = 6.7Vdp + 12.340.6SHV = 6.57Vsp + 12.670.66
Diameter = 63.2 (mm)UCS (MPa) (6)UCS = 64.5Vnp − 2620.95UCS = 4.58Vdp + 67.460.04UCS = 67.39Vsp − 269.830.87
PLID (MPa) (8)PLID = 0.87Vnp − 2700.77PLID = 1.00Vdp − 1.670.8PLID = 0.84Vsp − 0.880.75
PLIA (MPa) (4)PLIA = −0.55Vnp + 7.7−0.29PLIA = −0.16Vdp + 5.40−0.1PLIA = 0.23Vsp + 3.140.13
ITS (MPa) (11)ITS = 1.93Vnp − 4.320.83ITS = 2.04Vdp − 4.770.81ITS = 1.77Vsp − 3.370.73
SHV (N) (23)SHV = 6.2Vnp + 12.670.71SHV = 5.55Vdp + 16.130.58SHV = 6.44Vsp + 12.050.68
Vnp, Vdp, Vsp = natural, dry and saturated P-wave velocity, UCS = uniaxial compressive strength (MPa), PLID = point load index, diametrical (MPa), PLIA = point load index, axial (MPa), ITS = indirect tensile strength (MPa), SHV = Schmidt hammer value (N).
Publisher’s Note: MDPI stays neutral with regard to jurisdictional claims in published maps and institutional affiliations.

