1. Introduction
Orthodontic treatment with fixed braces, apart from the obvious effect on the stomatognathic system (including the occlusion and periodontium), also interferes directly with the tooth tissue by chemically and mechanically bonding the orthodontic brackets to the enamel and then cleaning the adhesive residue after treatment and removing the brackets.
The pulp filling the tooth cavity is richly innervated and vascularized connective tissue that performs a number of functions responsible for the health and life of the tooth, such as nutritional, sensory, creative and restorative and defensive functions. It is believed that the interdental temperature is similar to body temperature (approximately 37 °C), although the actual temperature has not yet been measured. The in vitro tests carried out so far that involve simulating blood flow in the pulp established the pulp temperature at 33–35 °C, and the tolerance of temperature changes in the range of 25–42 °C [
1,
2,
3]. In the in vitro studies presented in the article below, the focus was on assessing the temperature within the vestibular wall of the pulp chamber bordering the dentin, which conducts heat to the chamber and directly to the pulp in vivo.
The objective of this study was to assess the pulp chamber temperature change as a function of time under the influence of the enamel cleaning procedure with silicone rubber and aluminum oxides with and without water cooling.
The tissue reacts to both low and high temperatures, and raising the temperature by 5 °C is harmful and leads to inflammation, and in extreme cases to tissue necrosis [
4]. The mechanism of action of thermal stimuli is explained by their effect on vasomotor nerves, which leads to rapid congestion or ischemia. In this way, there are disorders in the nutrition of the pulp. The congestion phase becomes inflamed, and hence the pulp becomes inflamed. An undeniable and confirmed fact is the assumption that the operating procedures used in conservative dentistry and prosthetics generate heat within the tooth and periodontium, which is a huge stress for the pulp, especially with repeated stimuli [
5]. Bonding orthodontic brackets requires the use of adhesive materials, such as composite adhesives that require polymerization, during which heat is generated and transferred to the pulp–dentin complex (endodontium) [
6]. Another aspect of orthodontic treatment during which heat is generated is the cleaning of the enamel to remove residual composite materials using the method of cutting with milling cutters or polishing with erasers mounted on a micromotor. Pulp irritation caused by the operation of dental drills depends on the number of drill revolutions, the size and material of which it is made, and the intensity and type of cooling as well as the type of polymerization lamps used to polymerize the composite materials [
2,
4,
7,
8,
9,
10,
11,
12]. So far, studies have been published investigating the dependence of pulp thermal sensitivity on dentin thickness [
13].
Teeth have poor heat transfer properties, and their overall thermal conductivity is about 0.6 Wm
−1K
−1, which protects the pulp against overheating [
14,
15].
The tooth consists of a high-hardness enamel that is attached to the dentin. Between the dentin and the enamel, there is a dentin–enamel junction (DEJ) zone that is 100–150 μm thick. The thermal conductivity of the enamel is about 0.81 Wm
−1K and the dentin is 0.48 Wm
−1K
−1, which means that heat transfer into the tooth is limited. Nevertheless, these parameters are effective in pulp protection only up to the temperature of 42 °C [
16,
17,
18].
2. Material and Methods
2.1. Teeth
The study was carried out in vitro on 32 teeth, divided into two groups of 16 teeth each. The first test group consisted of incisal teeth, and the second of premolars.
The experiment was carried out on teeth extracted for orthodontic and periodontal reasons. The exclusion criterion was defined by the following conditions: the presence of developmental defects of the enamel, i.e., hypoplasia, turbidity or discoloration, and caries or fillings on the vestibular surface. The teeth qualified for research were stored for 30 days in demineralized water with a crystal of thymol (0.1%) at room temperature. After this time, the crown of each tooth was cut in half in the sagittal plane so that the pulp chamber section could be seen. To cut the teeth, a medium-density flame-shape bur mounted on a turbine was used.
The enamel was processed with the use of a micromotor commonly mounted to a dental unit at a speed of 40,000 revolutions/min, with water cooling and then without cooling, and a pressure force of 1.0 N. For cleaning the enamel, a silicone, cup-shaped polisher with alumina crystals (OneGloss 0181 (Shofu Dental Corp, San Marcos, CA, USA)) was used. The force was measured on a test stand consisting of scales, on which the processed tooth was placed.
During the experiment, the procedure of cleaning the residual composite material from the enamel after removing the brackets was simulated, but the enamel had no composite residue on its surface. Each tooth was polished for 320 s. The procedure was performed by one examiner, systematically moving the polisher over the enamel surface so that it was not in one place for more than a second. For every tooth, a new polisher was used.
2.2. Thermal Data Collection
The acquisition of thermal images of teeth were performed using a FLIR T420sc infrared camera operating in the wavelength range of 7.5–13 µm. The resolution of captured images was 320 × 240 pixels with a thermal resolution of <0.045 K. The images were captured using a lens with a focal length (f) of 18 mm. All conditions for thermogram acquisition were designed for thermal measurements (i.e., lack of air-moving devices in the room, no windows (blinds), lack of heat and cold sources). The data acquisition and analysis were performed using the FLIR ResearchIR version 3.5 (FLIR Systems, Inc., Wilsonville, OR, USA).
A total of 128 sequences of thermal images were captured (one sequence for each tooth). Thermal images were recorded in .fcf format. Then, the image sequences were converted to binary, which enabled their export to OriginLab (OriginLab Corporation, Northampton, MA, USA) in order to fit the dynamics of temperature changes to the exponential functions.
For precise measurements of the thermal properties of teeth, it was necessary to determine their thermal emissivity properties (ρ). A hemispherical reflectometer (Surface Optics Corporation (SOC) 410 DHR; Surface Optics Corporation, San Diego, CA, USA) was used to analyze the emissivity of the studied teeth. The integrated surface reflectance at two different angles of incidence (20° and 60°) was measured for six discreet wavelength bands in the range of 0.9 µm to 12 µm. The emissivity values were calculated as:
where ε—emissivity; ρ—directional reflectance.
Directional reflectance measurements were repeated three times for each tooth.
2.3. Thermal Data Analysis
Changes in the temperature of the teeth during polishing and while cooling down were adapted to the exponential and two-exponential functions. Identification of model parameters was carried out using the Levenberg–Marquardt method for the parameter space, the scope of which was determined arbitrarily.
where:
K0—constant;
K1,
K2—amplitudes of exponential functions;
τ1,
τ2—time constant.
By investigating the impact of the polishing time on the change in tooth temperature, the
y(
t) relationships were adjusted to one- or two-potential functions, minimizing the error δ defined in the following form:
where:
T,
TS—experimental and simulated temperature;
N—number of measurements.
The best theoretical adjustment to the experimental points, estimated by the parameters K0, K1, K2, τ1 and τ2, was determined by the smallest error δ.
2.4. X-ray Computed Microtomography
Computed microtomography provides a series of two-dimensional sections of the object. Since the degree of X-ray absorption depends mainly on density, X-ray computed microtomography enables the visualization of the internal microstructure of the teeth and the identification of their density.
The v|tome|x microtomography system (General Electric, Cincinnati, OH, USA) was used in this study. Each tooth was placed on a polymer base and scanned simultaneously, with the density pattern at 130 kV. After passing through the sample, the X-radiation was converted to visible radiation using the Yttrium Aluminum Garnet (YAG): Ce scintillator, allowing the image to be recorded with a resolution of 2024 × 2024 pixels. For each tooth, 1450 scans were recorded at a total scan time of 64 min/tooth and a current of 165 μA. The distance of the sample from the matrix was set in such a way so as to obtain the maximum image resolution, i.e., the smallest possible voxel. Projections were acquired every 0.4° with a total rotation of 180°. To improve the signal-to-noise ratio, the measurements from every three acquisitions were averaged at every step of the tooth’s rotation. Thus, the determined parameters allowed us to obtain microtomograms with optimal contrast and a resolution of 20 μm. The acquisition of microtomographic scans of teeth was carried out in 8-bit grey scale in order to identify changes in the density of the analyzed objects as accurately as possible. Due to the small size of the teeth, the acquisition of microtomographic scans was carried out simultaneously for five teeth and density patterns.
2.5. Density Analysis
The tooth density was determined by comparing the density of the tested object to the density of the template. The absorption of X-rays by an object is proportional to its density. In turn, the measure of an object’s density in a microtomographic image is the grey level.
An analysis algorithm was used to examine the microtomographic data which determined how many voxels of the teeth have the same or similar Hounsfield coefficient (HC) value as the area of the pattern whose physical density is known. The equations of the curve expressing the function of calibrating HC coefficients with known values of the physical density of the template were defined. This allowed the determination of the physical density for all levels of grey scale, and those with values in the range between the values of density standards.
In the first stage, calibration curves were determined using ImageJ. The average grey scale values for the bars of the template were determined for scans from each tooth. On the basis of the histograms containing information about the pixels in the selected range, the corresponding grey scale levels were adjusted for all scans performed. In this way, pairs were created: density and level of grey scale, which allows for calibrating any area of the scan and determining its density.
2.6. Statistical Analysis
Statistics were compiled using the Statistica 13.0 software. After confirming the normality of the data distribution, the Student’s t-test for related data and Pearson’s correlation were used for analysis. Values with p < 0.05 were assumed to be statistically significant.
3. Results
The proposed methods of data acquisition and analysis allowed for the assessment of tooth temperature during the mechanical enamel cleaning procedure. The optimal procedure for cleaning the enamel should not increase the temperature of the teeth in order to avoid a critical increase in pulp tissue temperature.
Analysis of thermovision data indicated that there were clear differences in the pulp chamber temperature obtained during enamel cleaning using water cooling and without it.
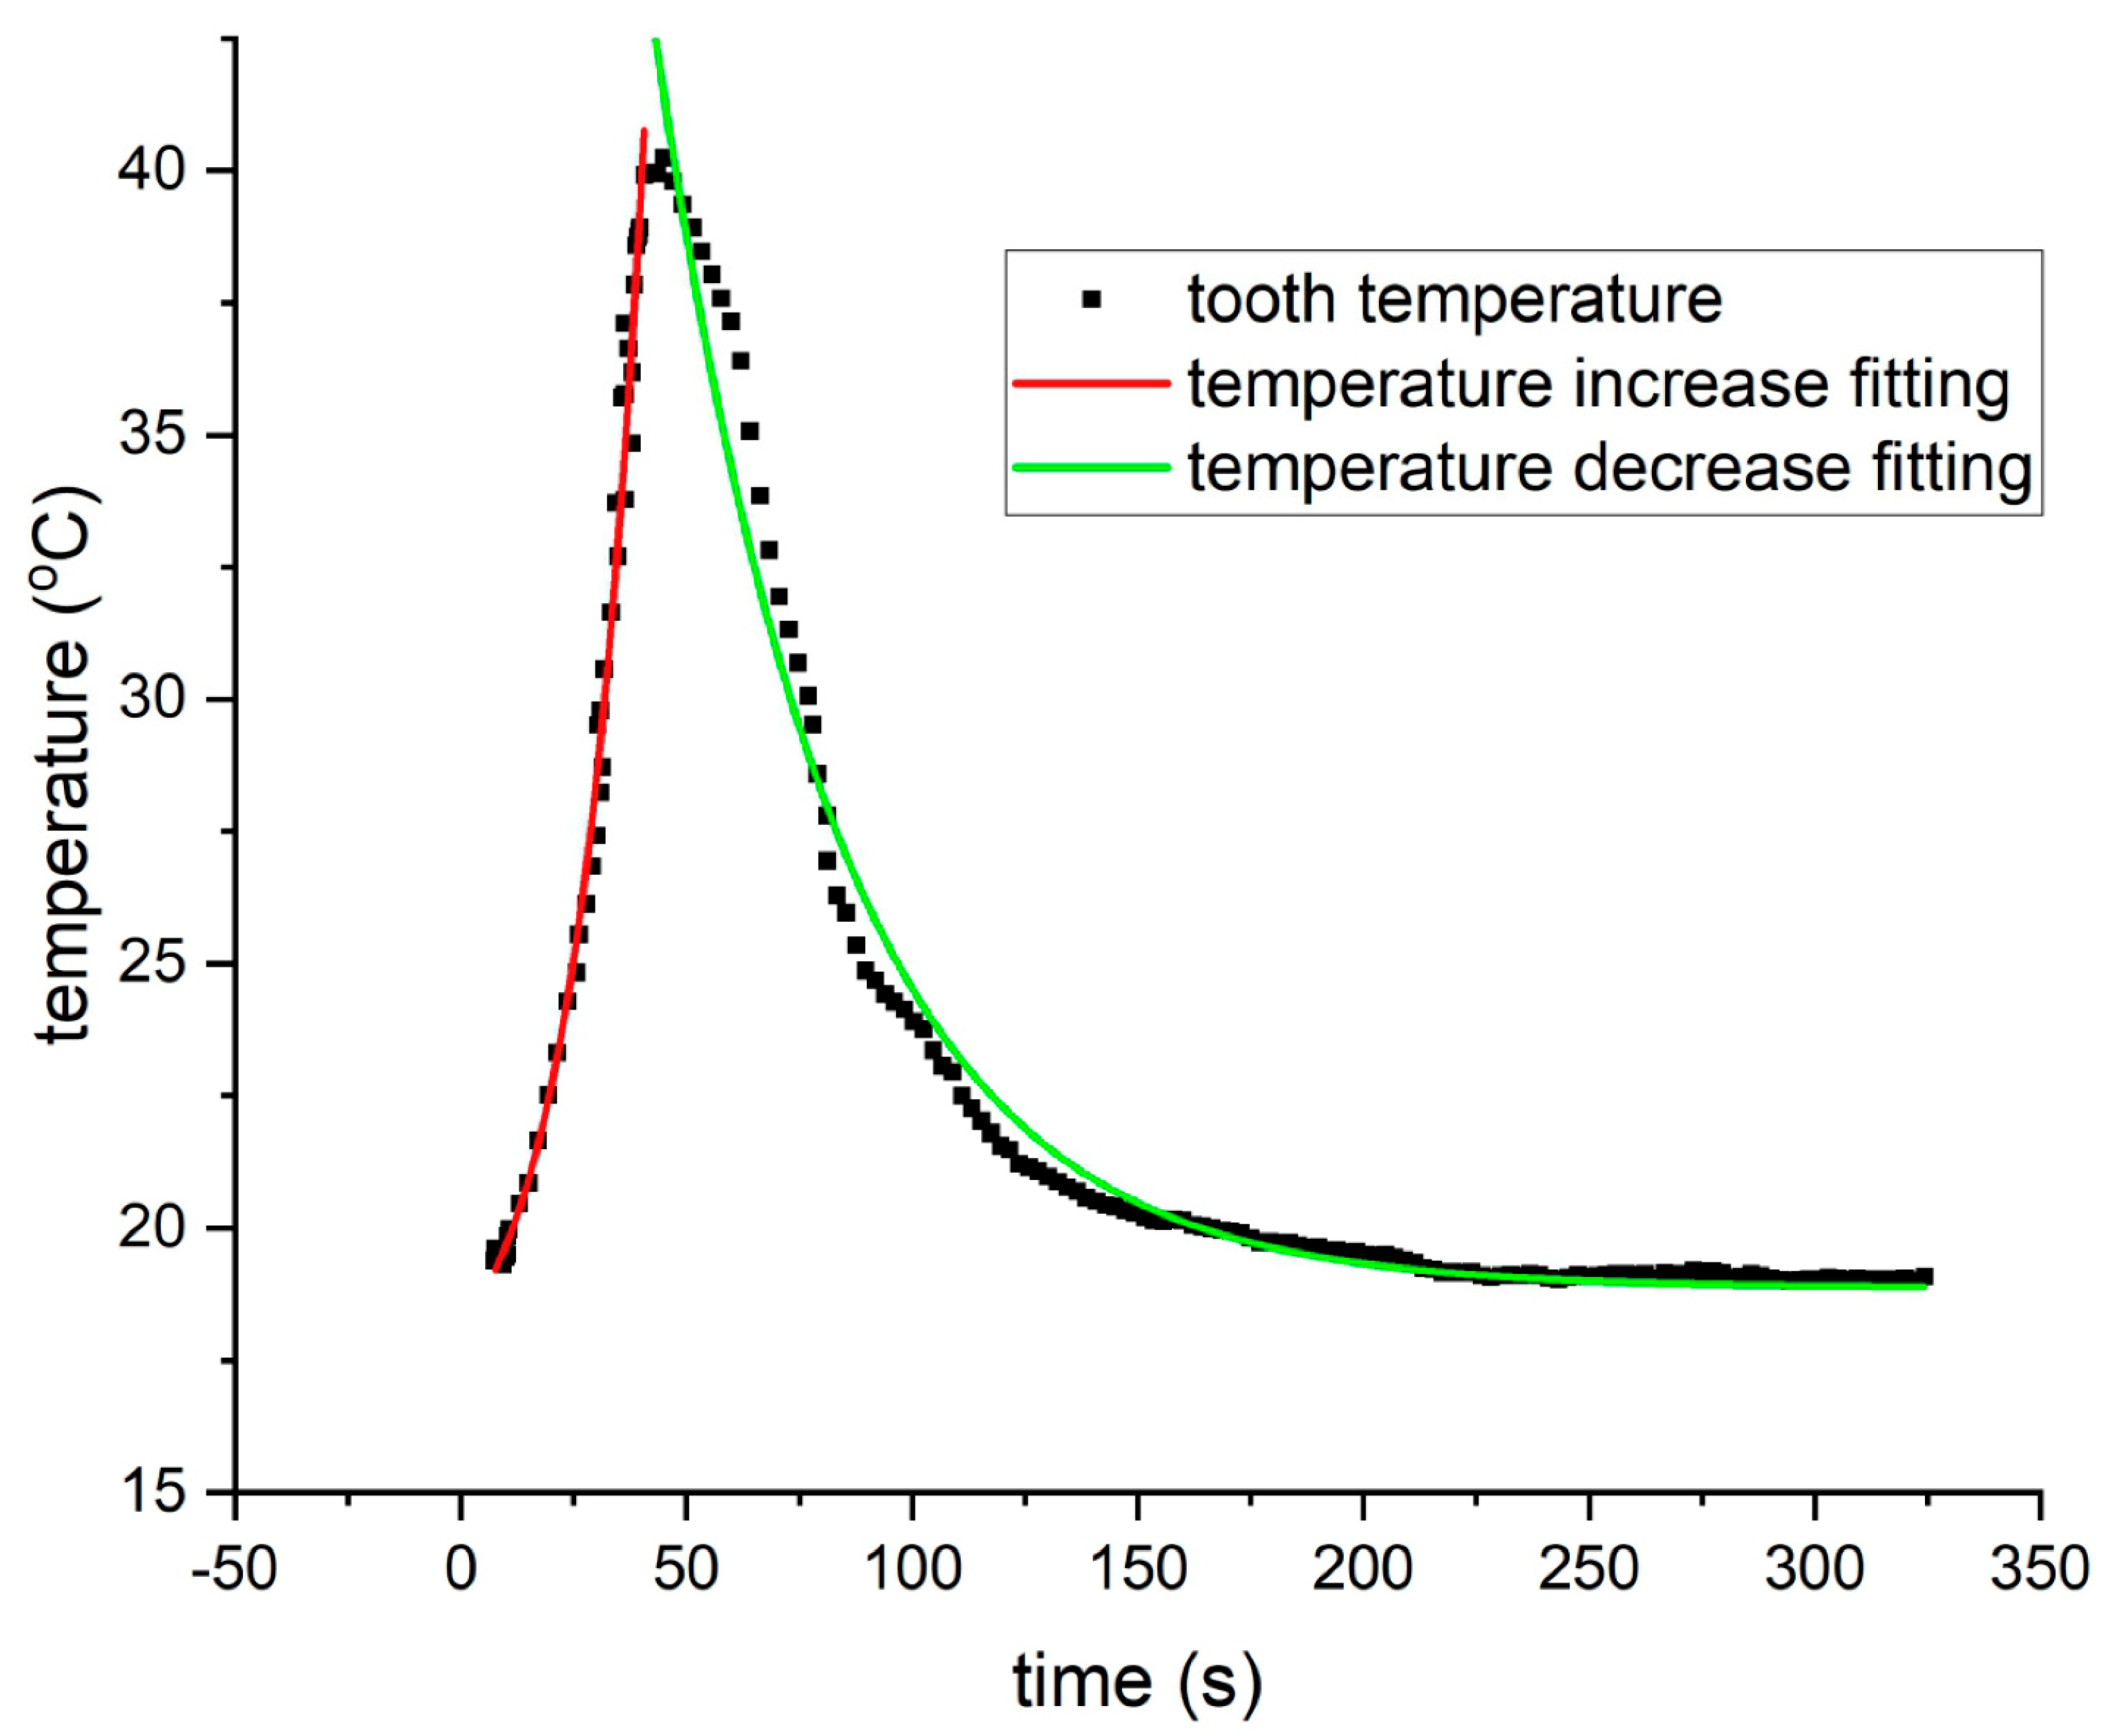
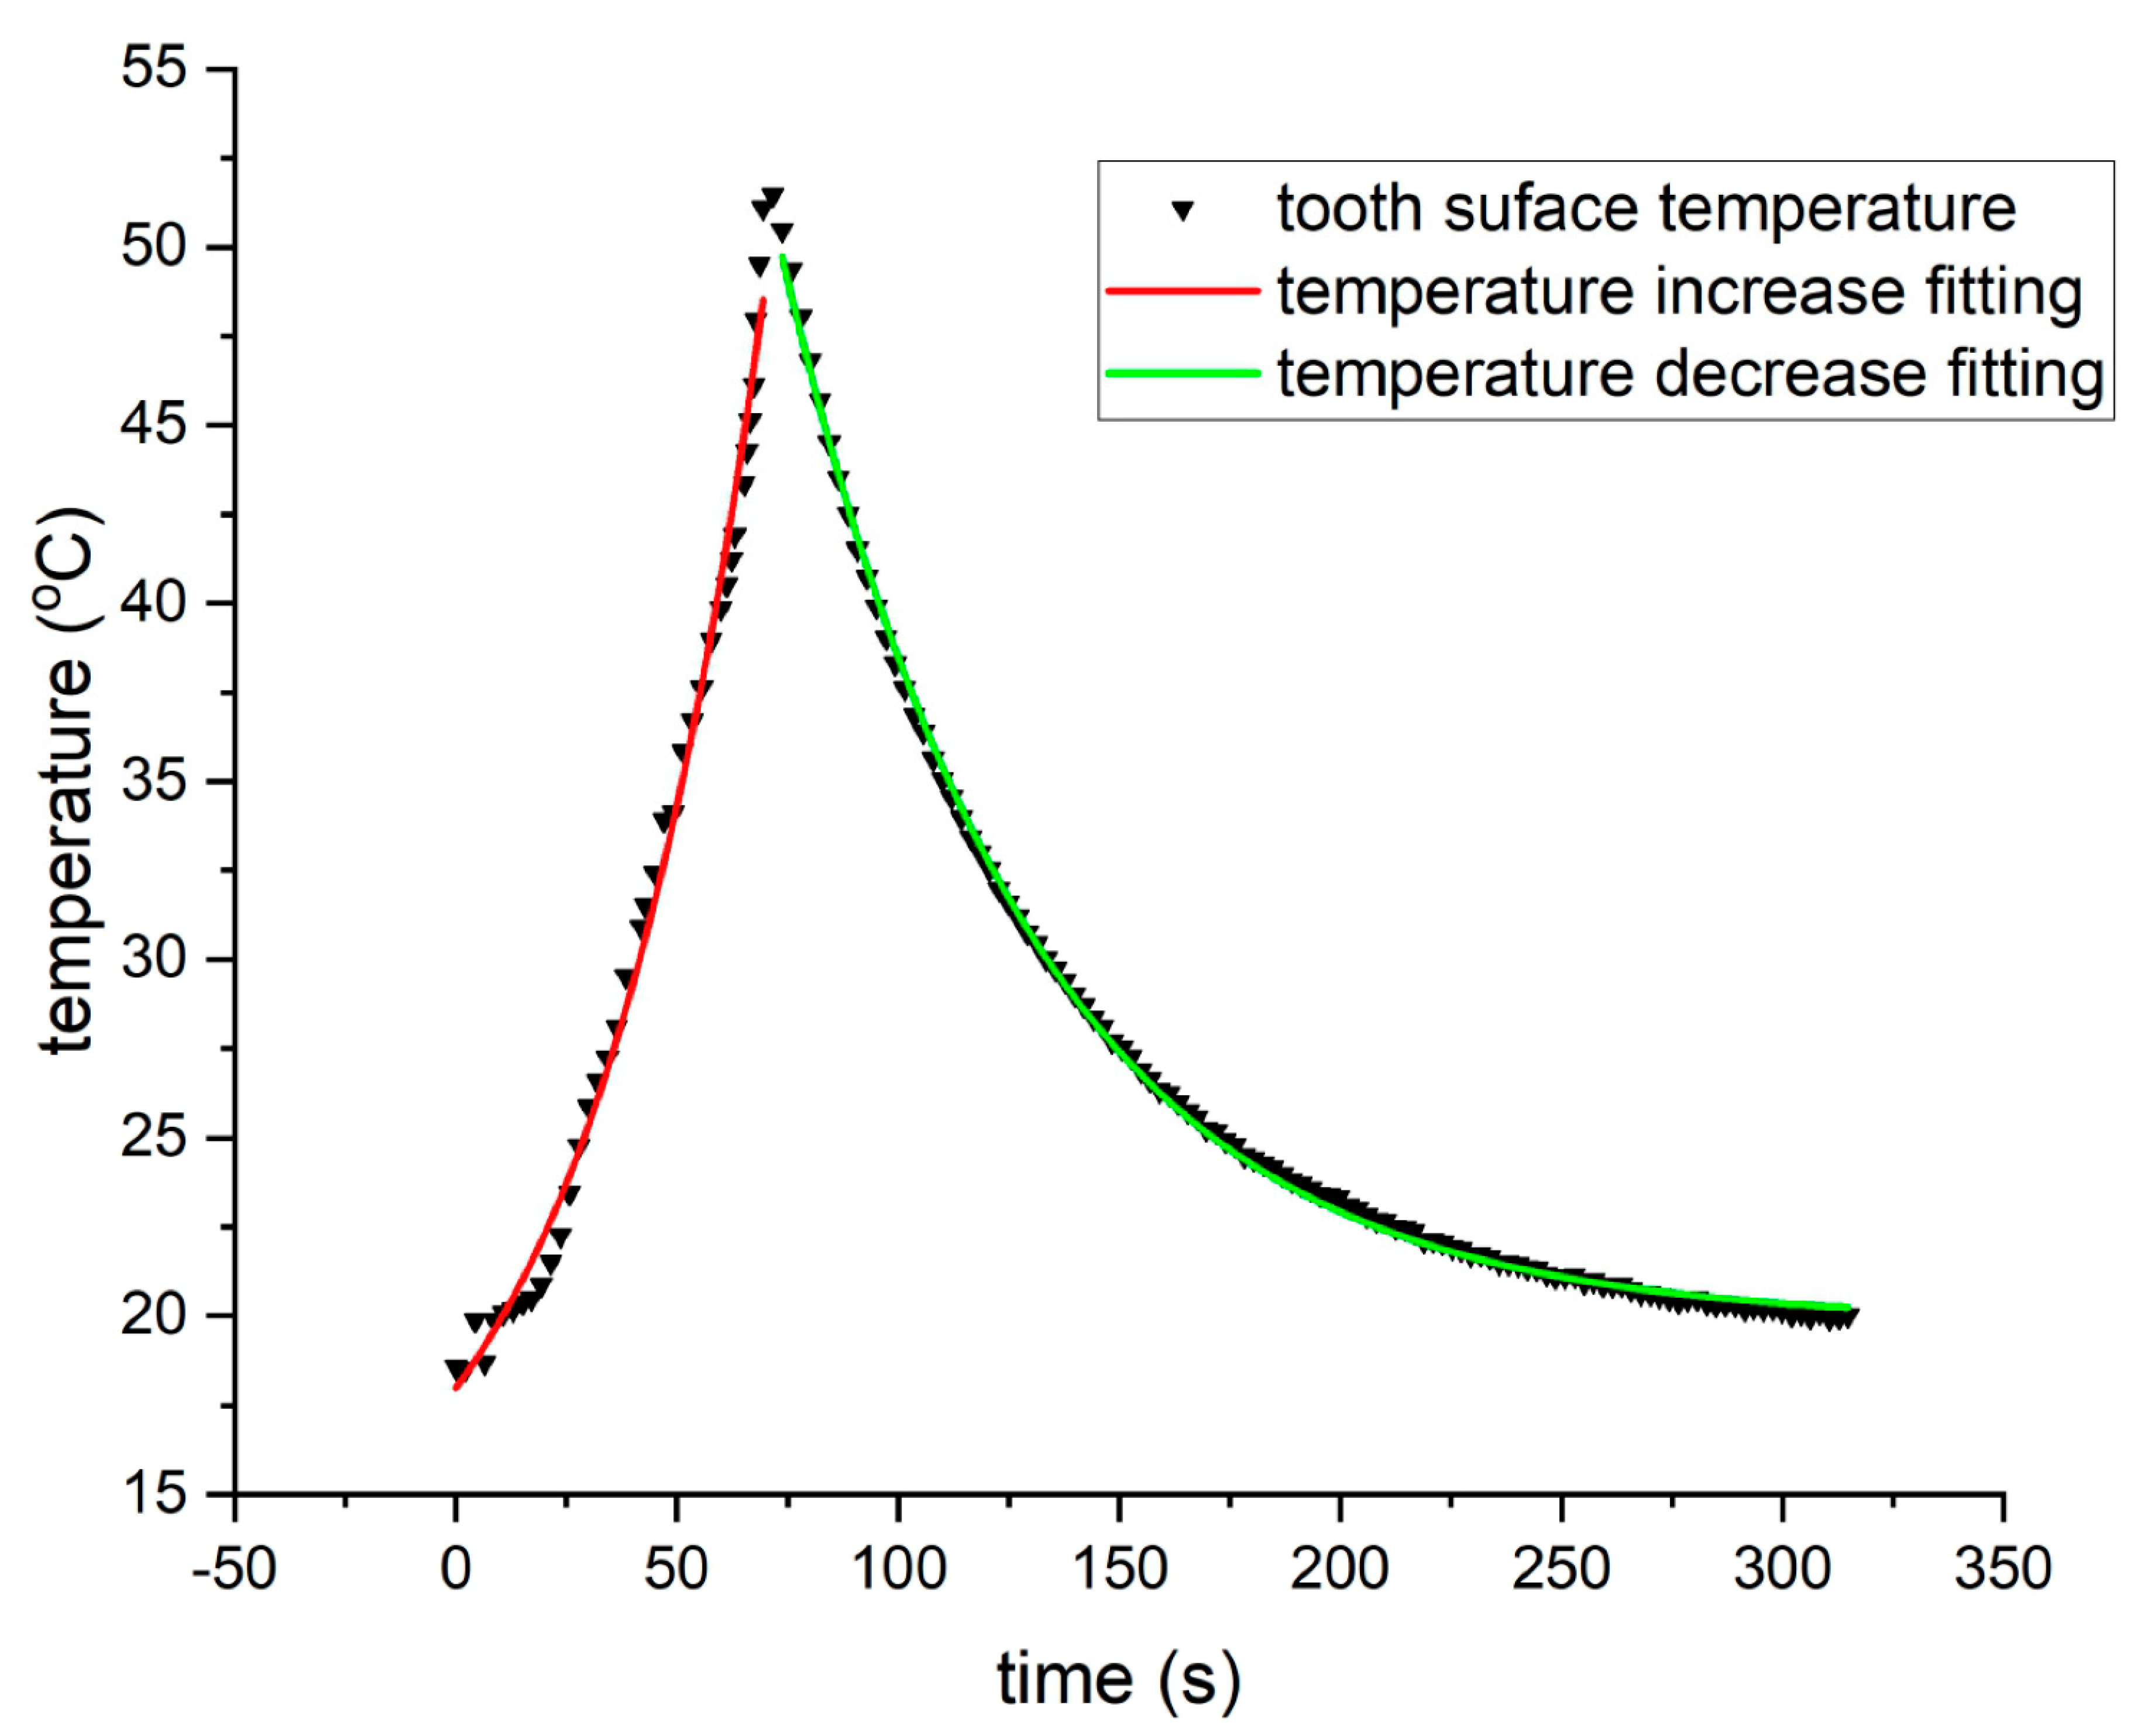
In order to determine the quantitative dynamics of tooth temperature changes under the influence of mechanical cleaning, thermographic data were fitted to exponential functions. Due to the fact that the hard tissue of teeth is made up of two components (dentin and enamel) a two-exponential model was used. However, matching to the one-exponential function did not increase the matching error, which is why further analyses were conducted with a one-exponential model.
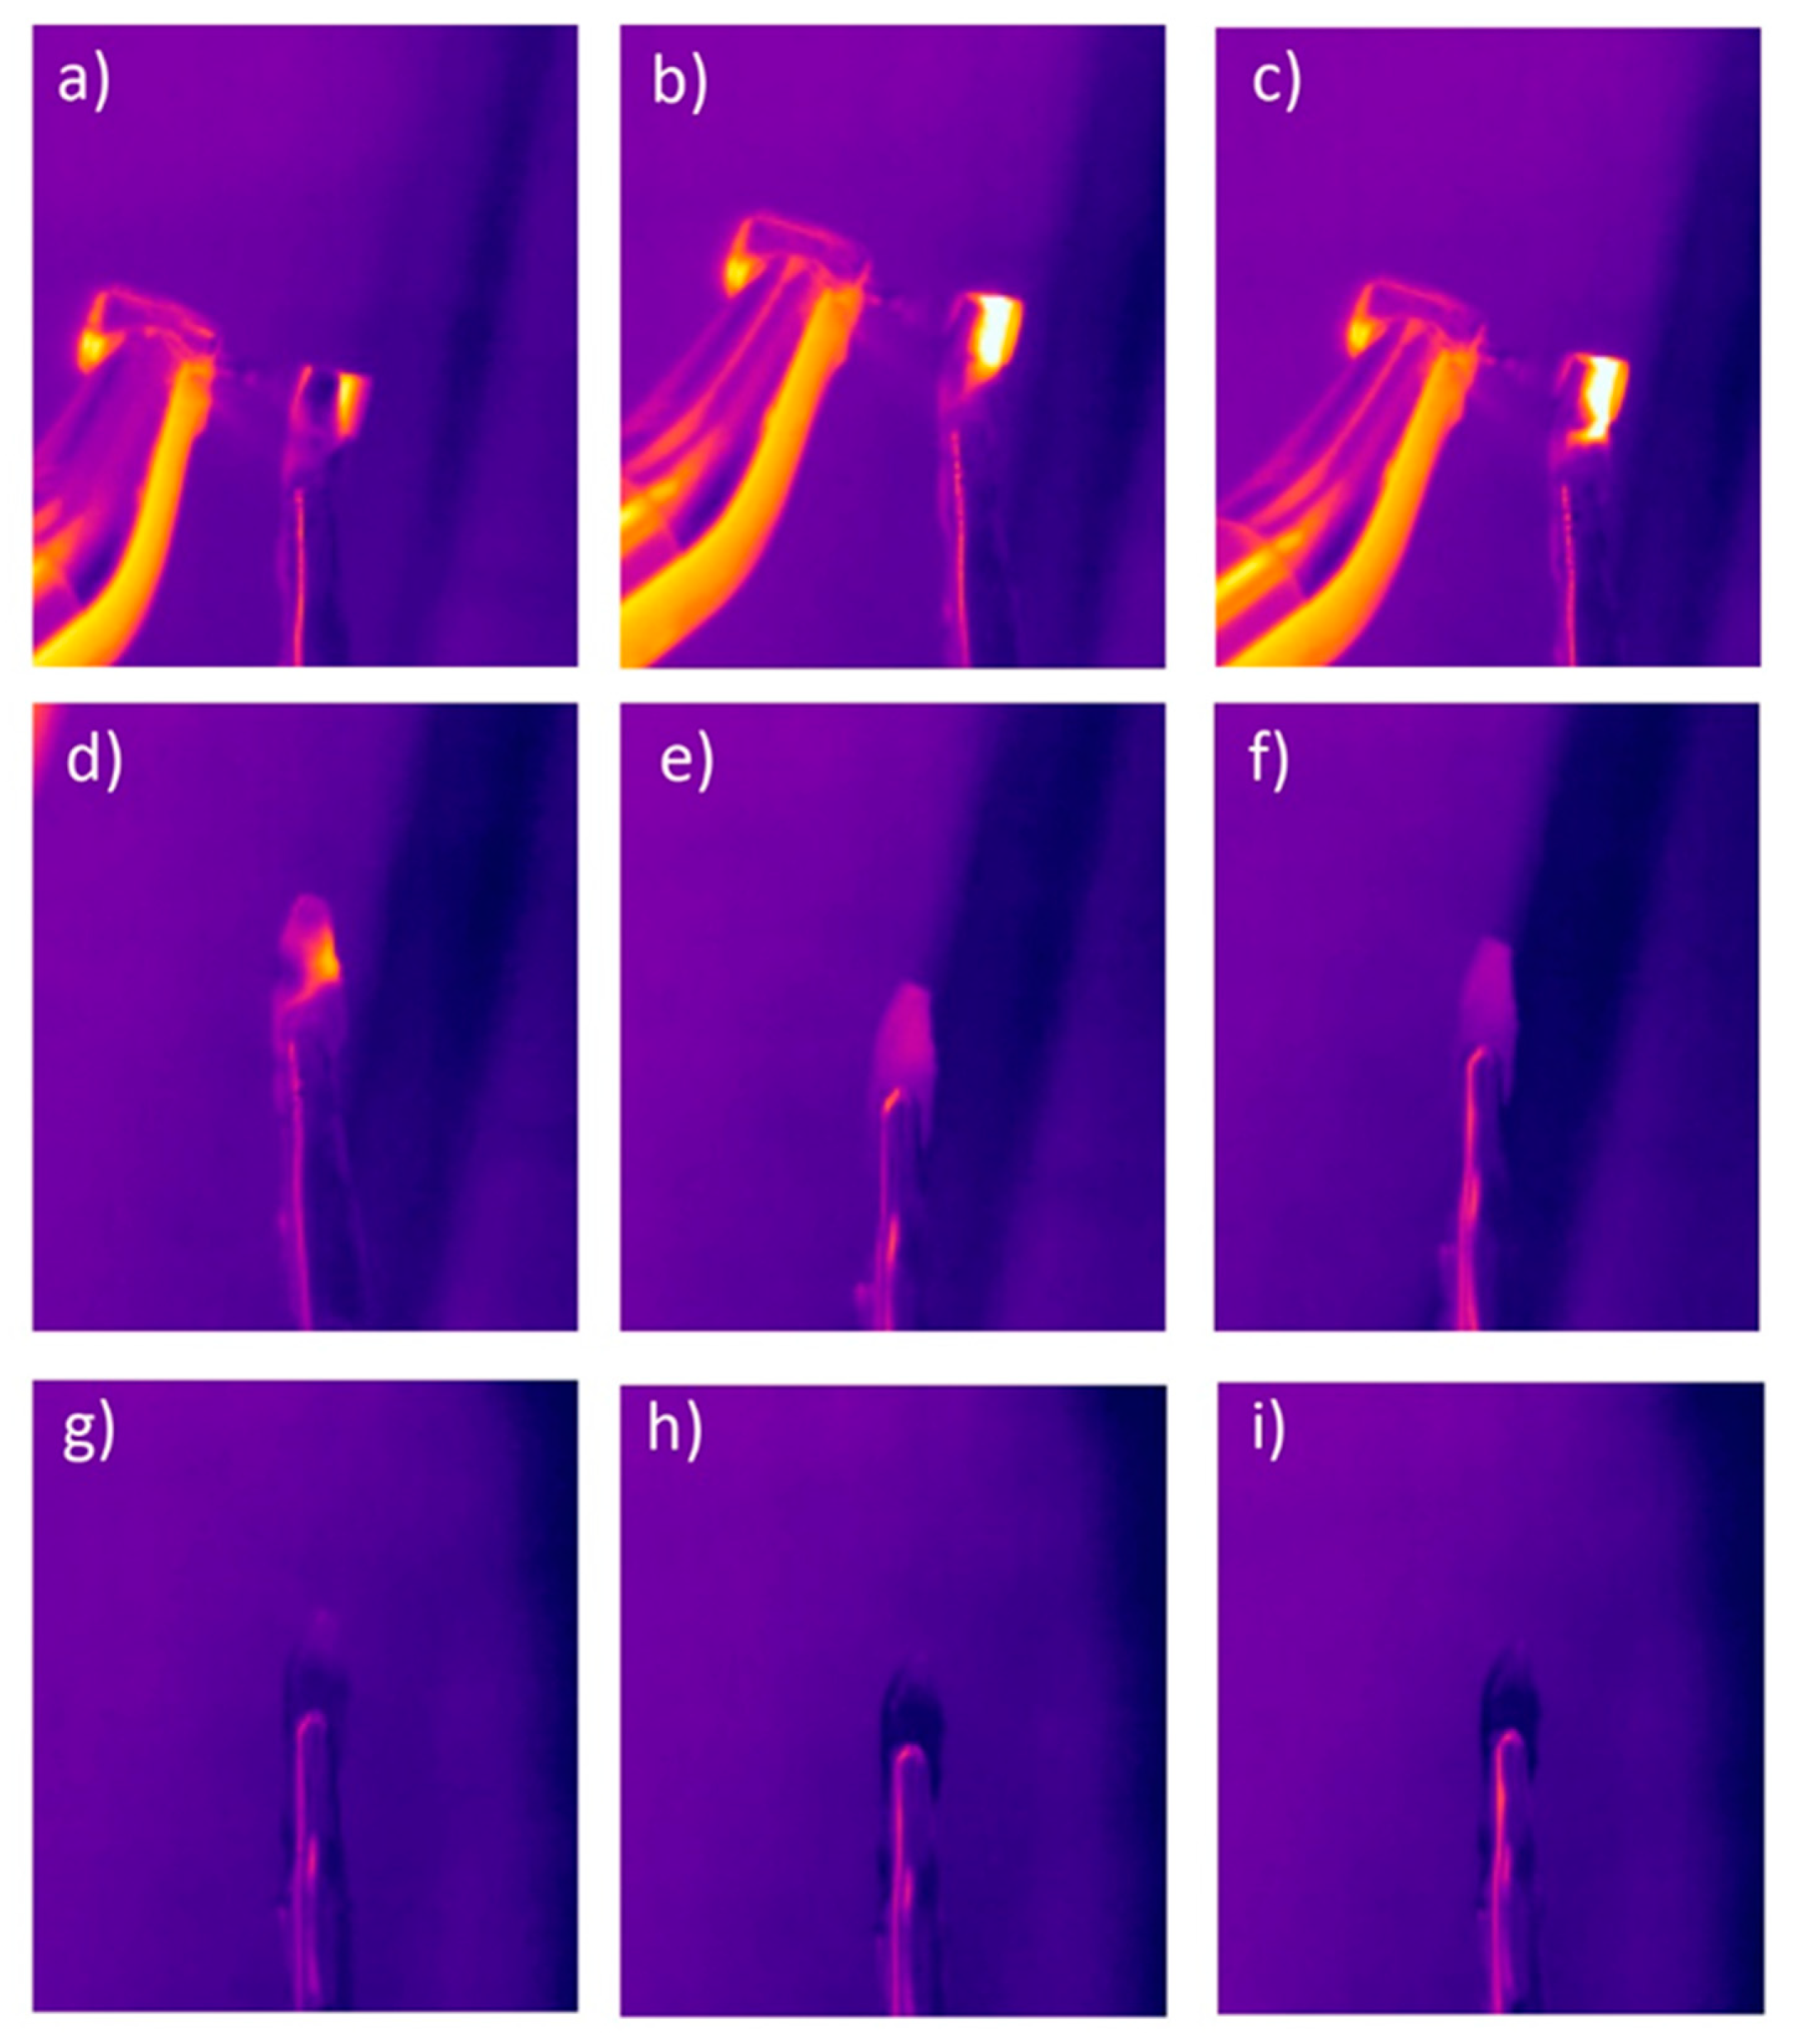
Figure 1 and
Figure 2 show examples of matching curves for tooth temperature changes during mechanical cleaning.
A clear difference was recorded in the parameters of the fitting function to the exponential model for water cooling and non-cooling treatments. These differences related to the time constant τ for the exponential function determining the dynamics of temperature rise in the polished teeth. For tooth cleaning without water cooling, the time constant τ of temperature rise is 31.29 and 33.83 for incisors and premolars, respectively (
Table 1), while for water cooling, the time constant τ is 40.65 and 43.70 (
Table 2), respectively for incisors and premolars. The obtained parameters of the adjustment function to the exponential function indicate that water cooling not only causes the obtained maximum pulp chamber temperature to be lower, but also the dynamics of temperature rise is slower.
However, a clear difference in the maximum temperature measured on the pulp–dentin border of the teeth was recorded for teeth cleaned without cooling and with water cooling. In the first case, the maximum recorded temperature was 50.11 °C in a time interval of 60 s, while in the case of water cooling, it was about 7 °C less in the same period of time.
For exponential functions describing the dynamics of temperature drop, no clear differences were recorded for the treatment procedure with water cooling and without water cooling (
Table 3 and
Table 4). In addition, no statistically significant differences in the dynamics of temperature changes were registered for different types of teeth (incisors and premolars).
It is worth emphasizing that the adaptation to the one-exponential function indicates that the teeth, despite the fact that they consist of two clearly different layers (enamel and dentin), can be treated as an object with uniform thermokinetic properties, and matching the dynamics of temperature changes to the two-exponential function does not minimize matching errors.
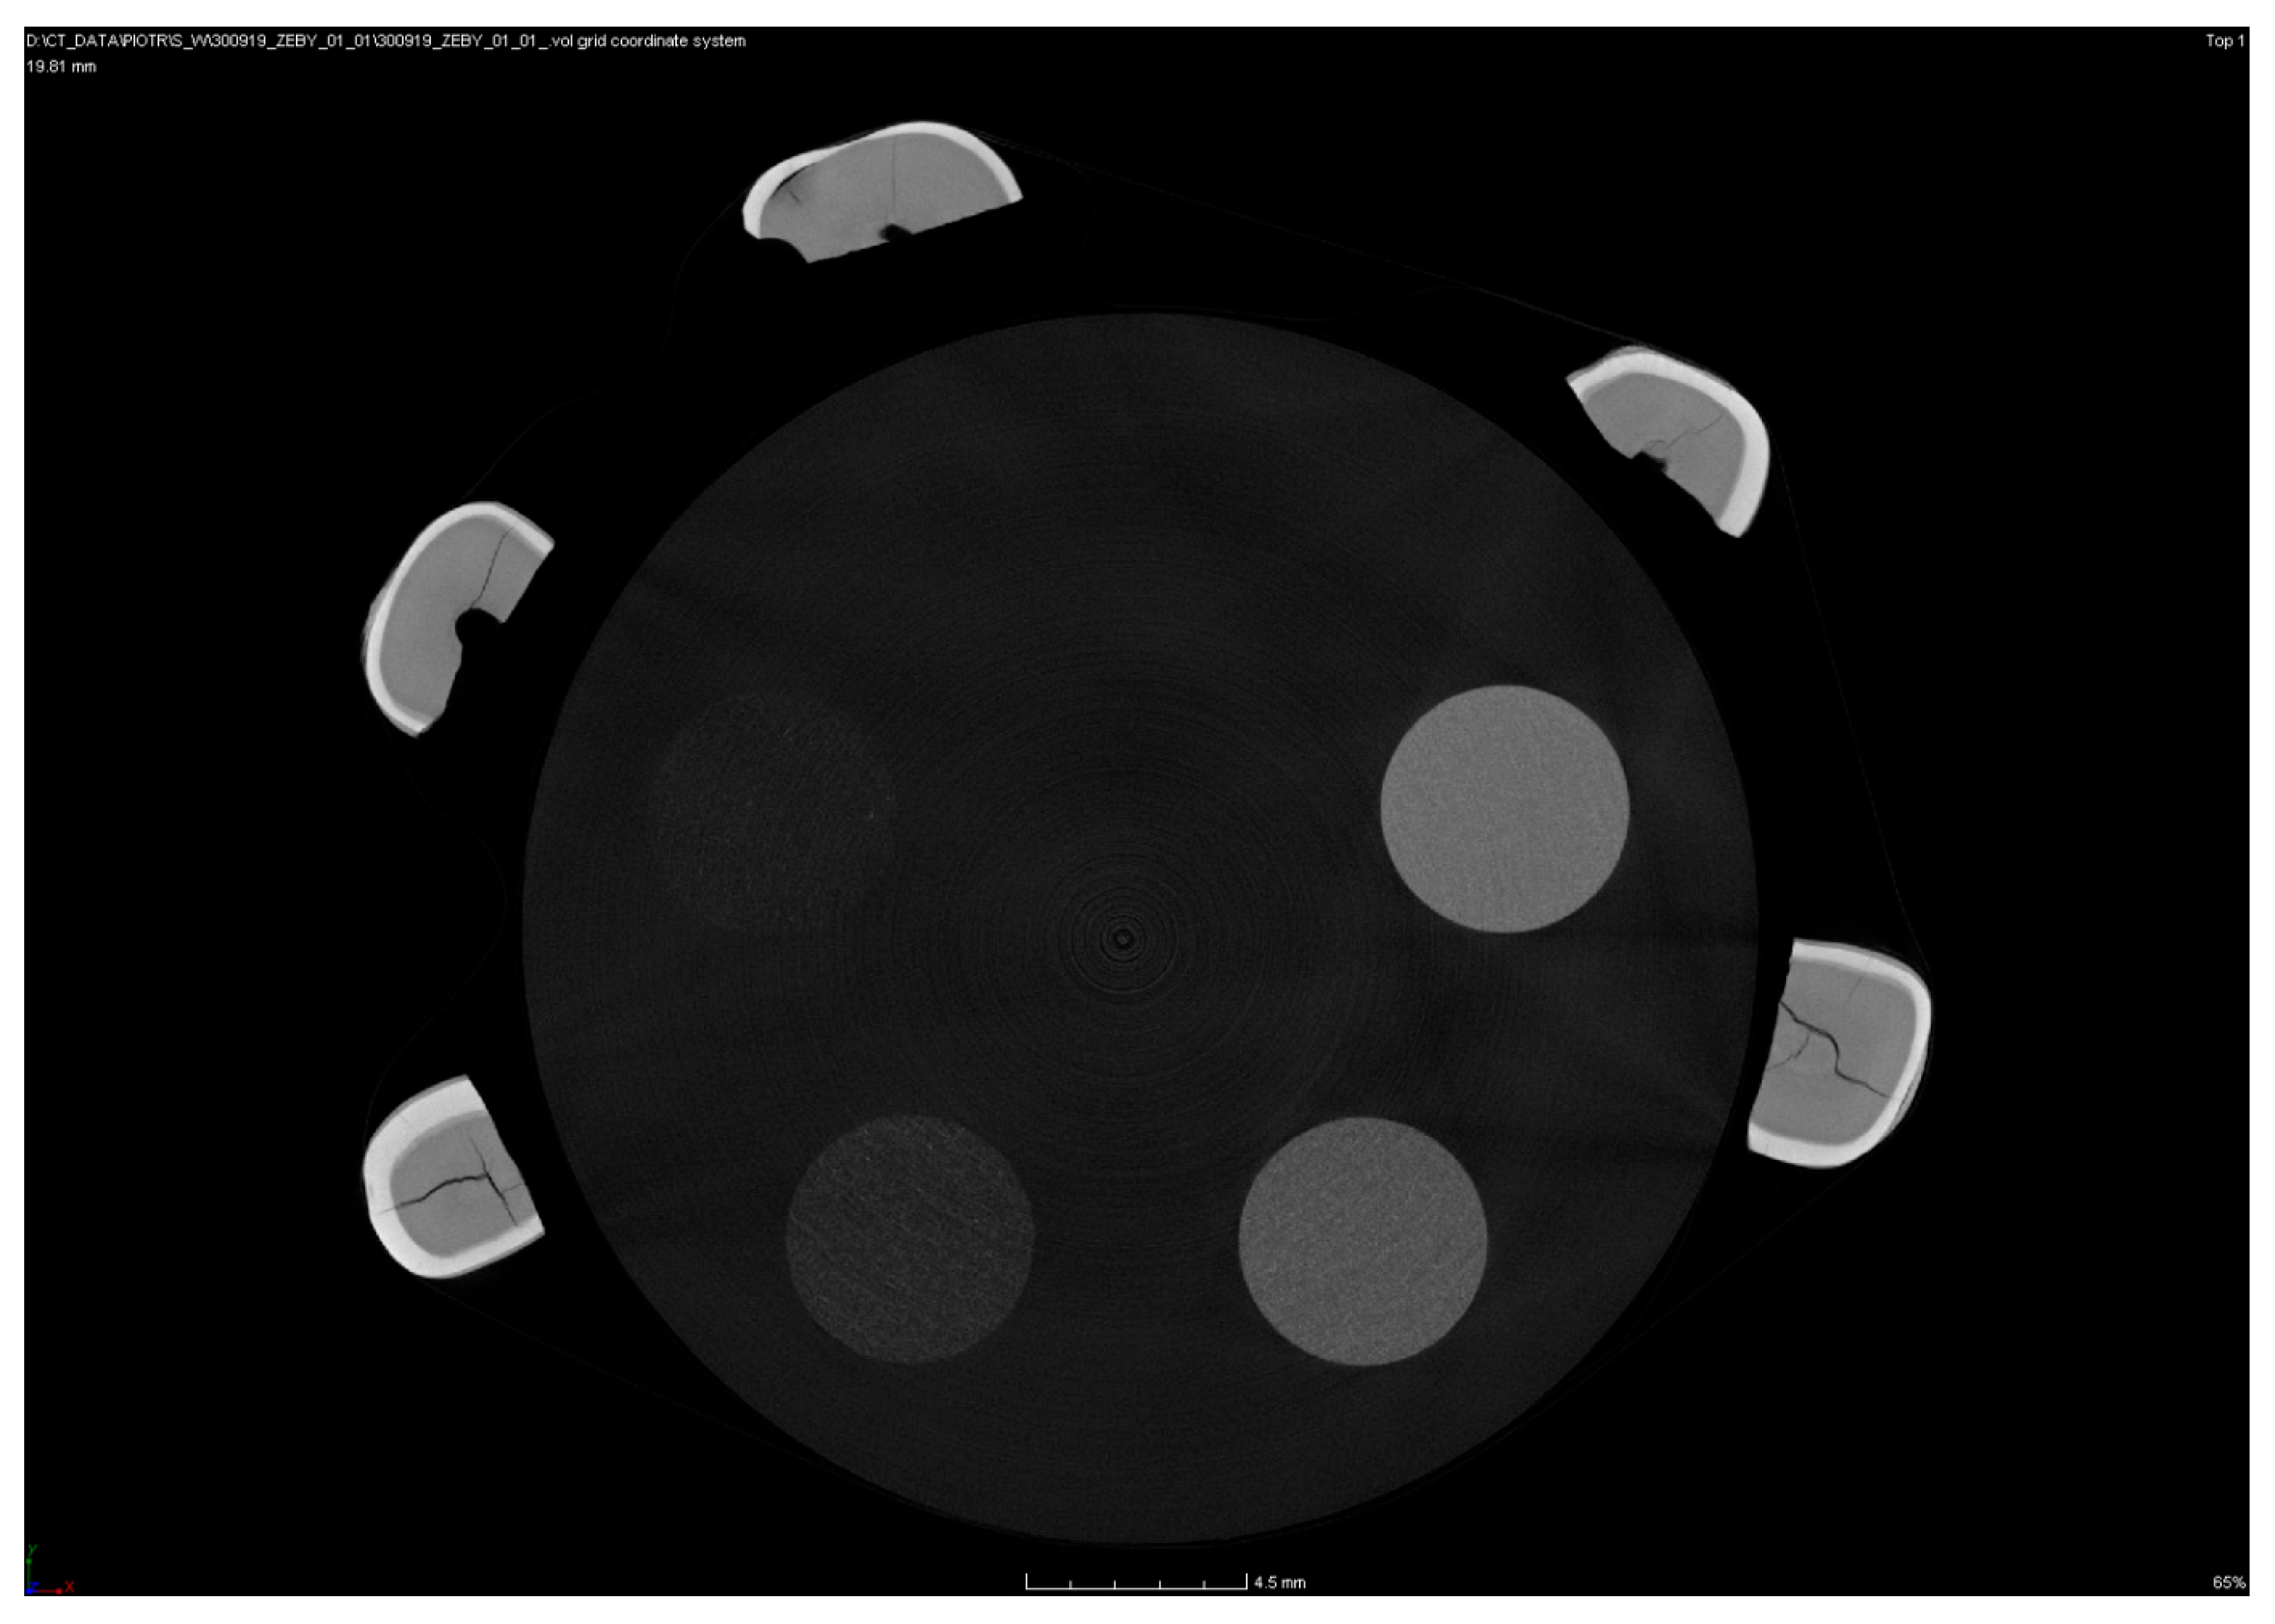
Tooth density was also examined using computer microtomography methods. The proposed method allows us to not only to determine the average density of the entire tooth, but also to determine the density in relation to its individual tissues.
In order to determine the density of individual tooth elements, their microtomographic scans were analyzed. An example of a microtomographic scan is shown in
Figure 3, which shows five premolars and a density template.
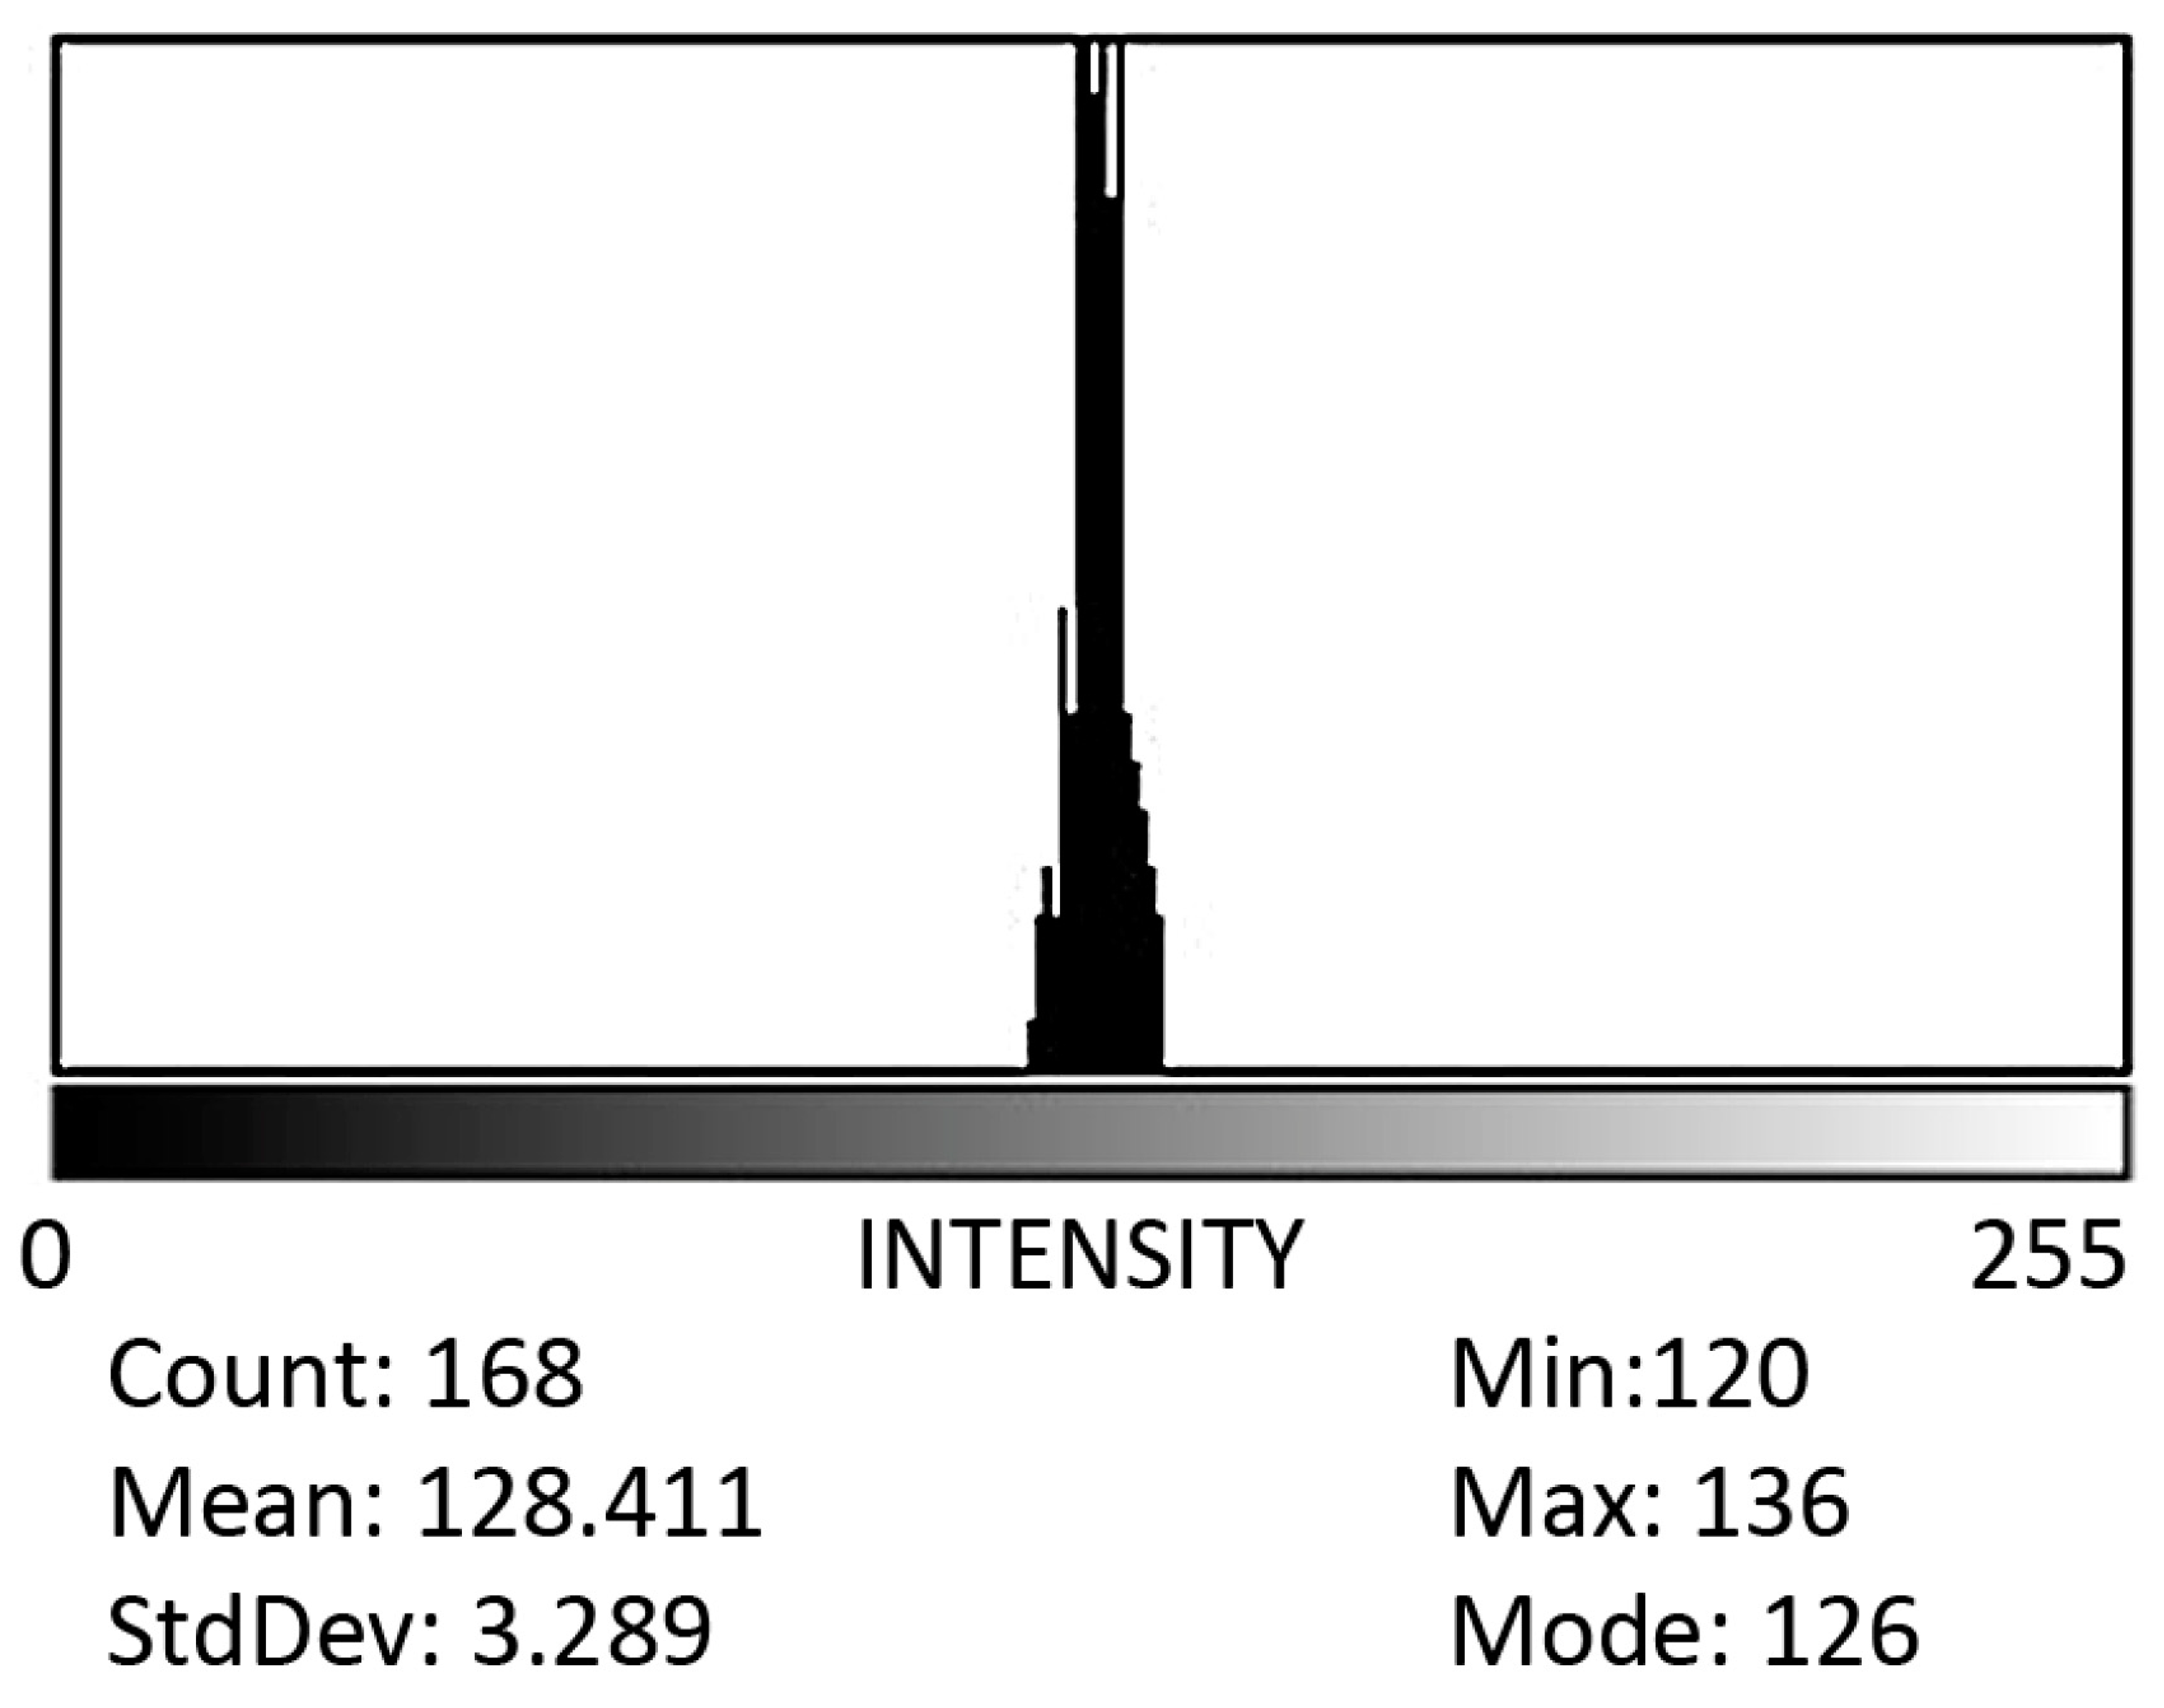
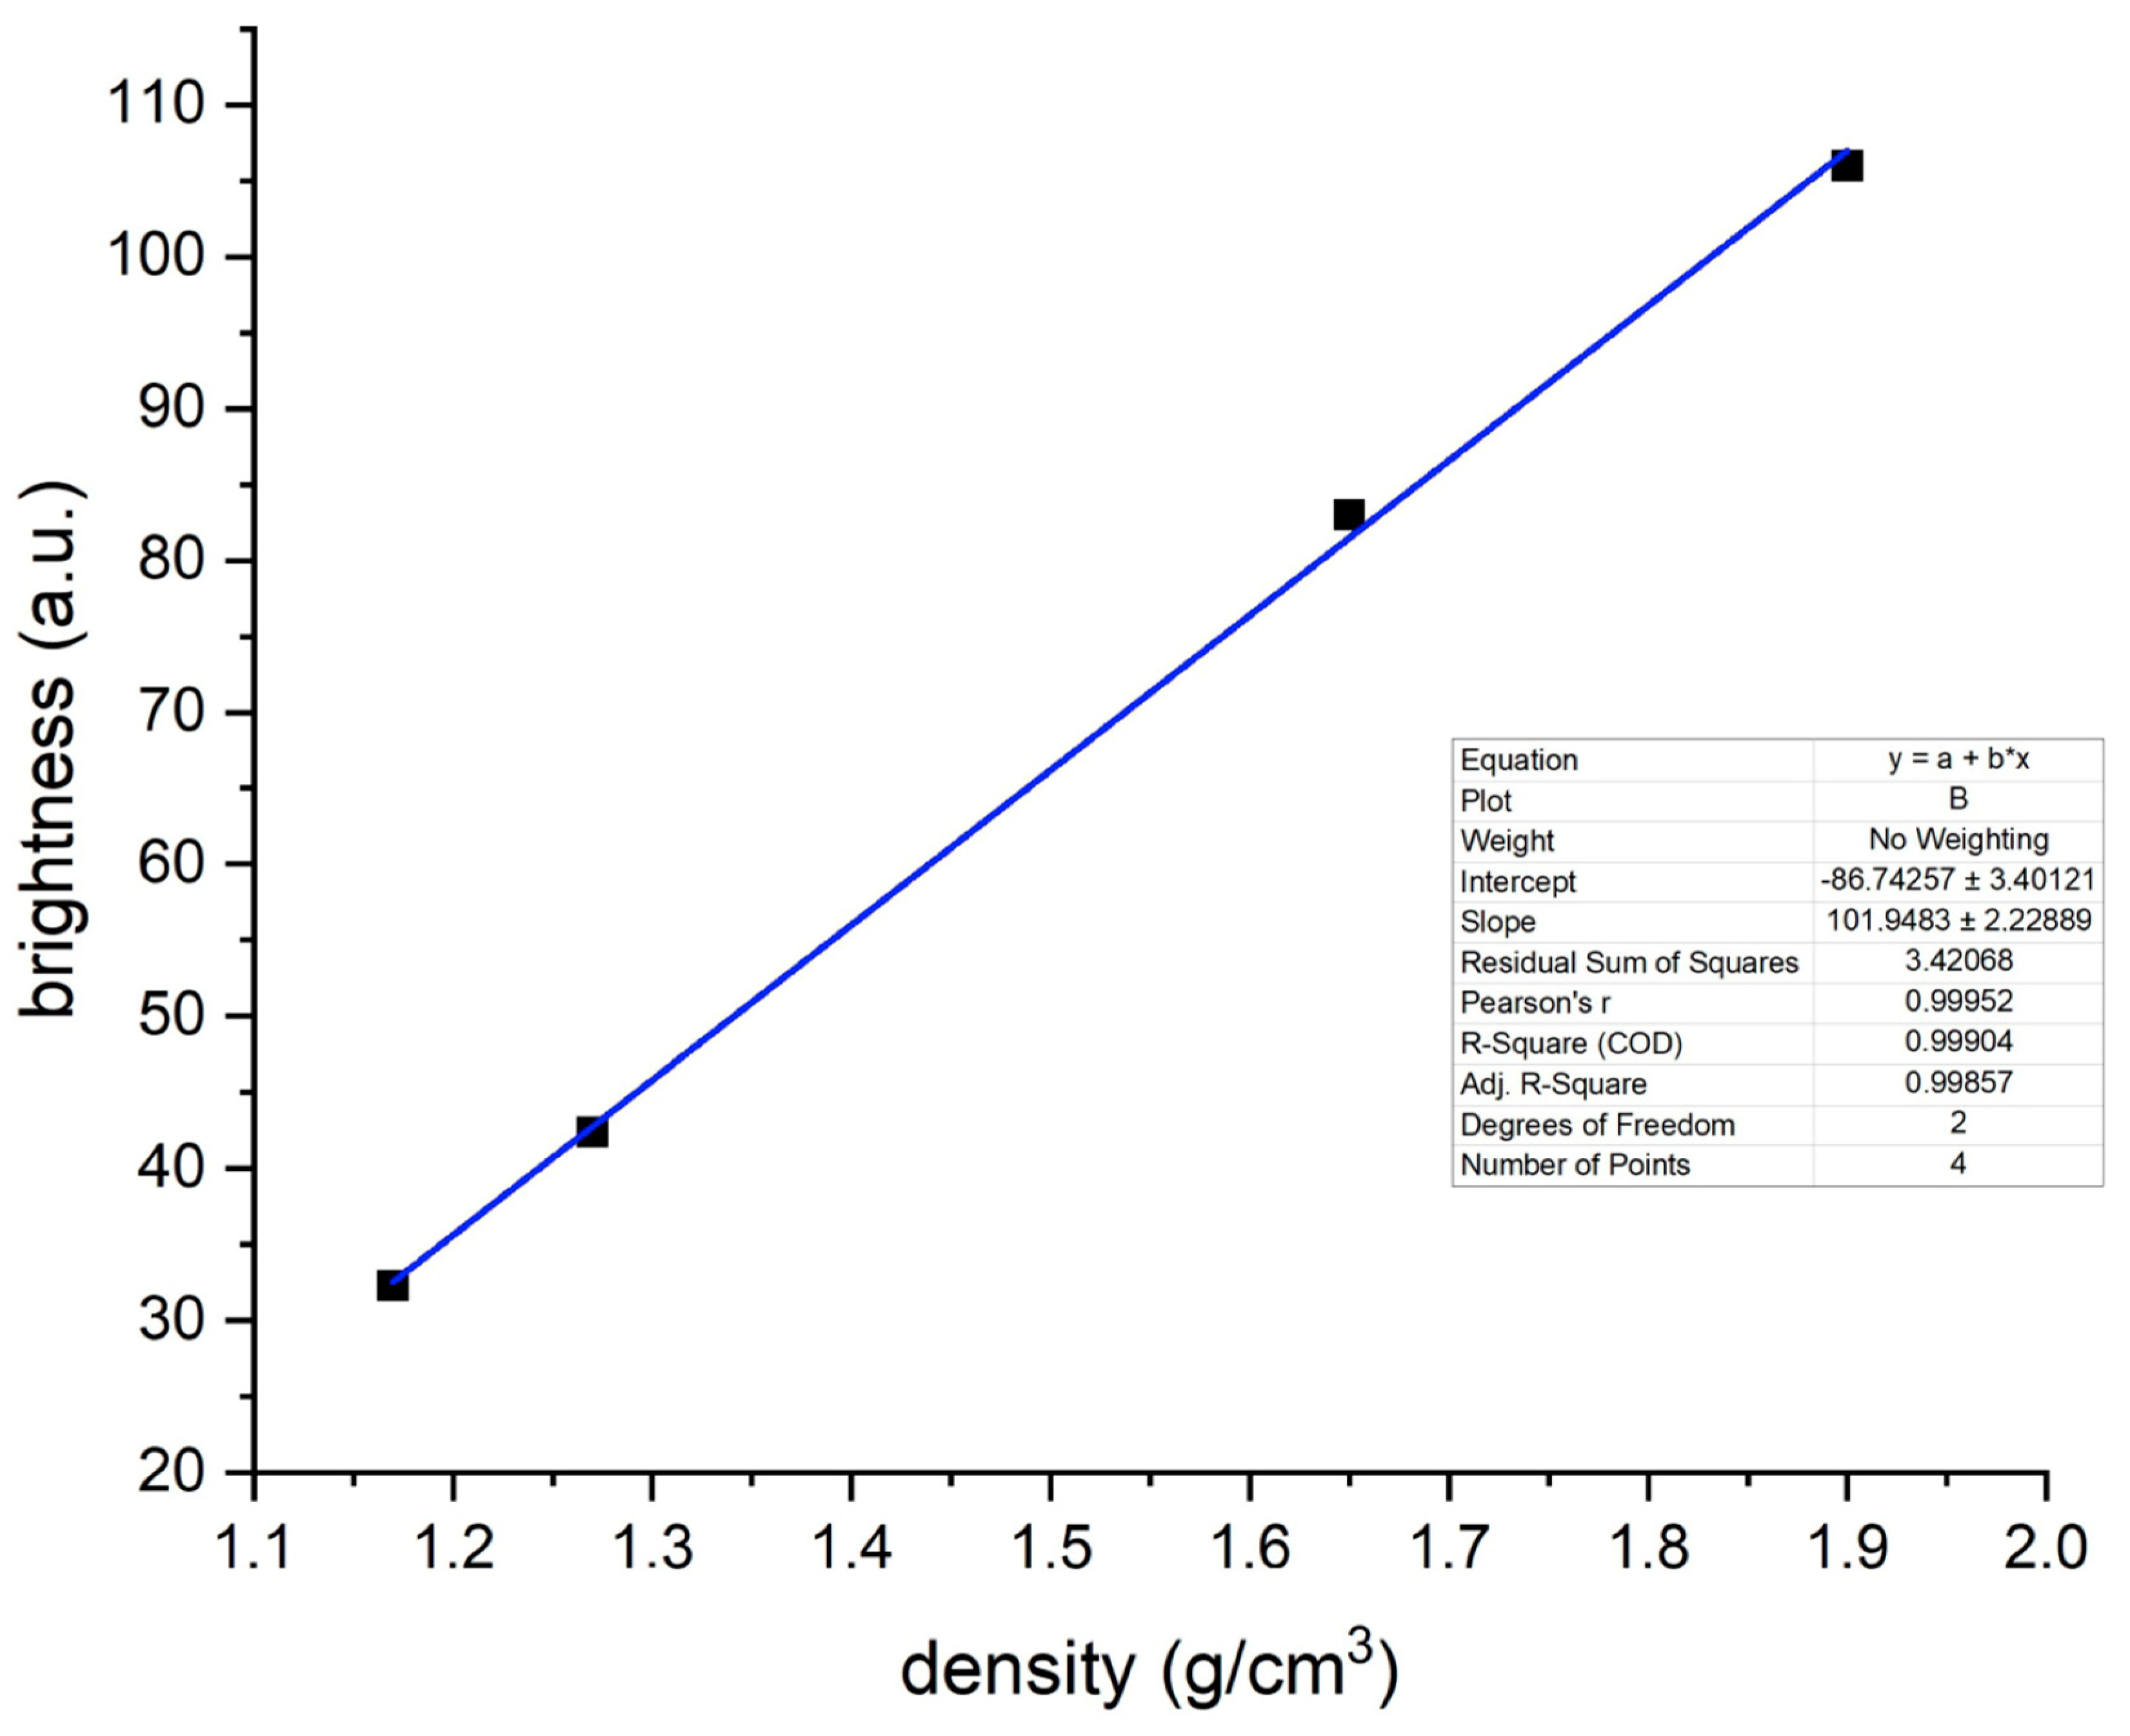
Using the interdependence between the level of grey of the microtomographic image and the density of the object, which is proportional to the greyness, areas corresponding to the defined density were determined within the template and then the average brightness of this area was determined in ImageJ. An example of a histogram is shown in
Figure 4.
Then, for each of the four elements of the calibration standard, a calibration curve was created, allowing for the determination of the density of the samples.
The average density of the dentin and enamel of premolars was 2.12 g/cm
3 and 3.58 g/cm
3, respectively (
Table 5). In turn, the density of dentin and enamel of incisors was 2.09 g/cm
3 and 3.62 g/cm
3, respectively (
Table 5).
The obtained thermokinetic results were correlated with the obtained dentin and enamel density results for premolars and incisors. It has been shown that there is no statistically significant correlation between thermokinetic parameters (time constant τ, amplitudes of exponential functions,
Figure 5).
The maximum achieved temperature of the vestibular wall of the pulp chamber during polishing was 52.34 °C without the use of water cooling, and the maximum obtained temperature of the vestibular wall of the pulp chamber during polishing was 43.15 °C using water cooling (
Figure 6).
The time after polishing at which the safe temperature of 40 °C was obtained without water cooling was 29.4 s, while for polishing with water cooling, this safe temperature was reached in 34.6 s.
There was no correlation between the obtained maximum and average temperature in the region of interest (ROI) with either enamel density or dentin density.
4. Discussion
Dental teeth cleaning is a basic procedure required in many therapeutic cases. In orthodontics, it is performed before the start of treatment with fixed braces and after the completion and removal of orthodontic brackets, after which residues of the adhesive composite remain on the enamel surface. In this in vitro experiment, however, the enamel was free of residual material to unify the results. When removing brackets, a different amount of composite material remains on the enamel, which has a direct impact on the length of the enamel cleaning procedure. The Adhesive Remnant Index (ARI) indicator analyzed in already published studies is used to assess this phenomenon [
19]. In this study, the goal was to polish the enamel of each tooth at the same time and with the same force exerted on the tooth. The proposed research methodology was aimed at quantifying the dynamics of tooth temperature changes during mechanical cleaning as part of the debonding procedure in vitro.
Thermal tests performed in vivo are highly subjective because they are completely dependent on the patient’s response to the stimulus. In general, most in vivo research methods require a subjective assessment of the effects of tissue stimulation, which reduces the objectivity of the results obtained. That is why it is so important to carry out in vitro tests [
20,
21].
Teeth polishing, when carelessly carried out, can cause not only mechanical damage to the enamel [
22,
23,
24,
25], but also irreversible changes in the pulp. The thermal impact of rotary dental tools is the result of several parameters, including the type of drill (its shape, hardness and roughness), the speed of rotation of the dental drill, pressure, exposure time, and enamel thickness [
13,
26]. It should be emphasized that as a result of the mechanical impact of the drill on the enamel, there may be a significant increase in temperature within the pulp chamber.
Generally, heat distribution can take place through radiation, convection and conduction. In the test model, the heat is distributed within the tooth tissues during the conduction process. Quantitatively, this process consists mainly of the thermal conductivity coefficient, which is about 0.6 Wm
−1K
−1 for whole teeth, 0.81 Wm
−1K for dentin, and 0.48 Wm
−1K
−1 for enamel and dentin. Between the dentin and the pulp chamber, there is a physical connection between the dentinal tubules and pulp cells with a high heat transfer coefficient (high water content), and thus heating of the dentin will directly affect the heating of the pulp chamber. Physiologically, the DCJ effectively protects the pulp up to a temperature of 42 °C, while above this temperature (which, as we have shown in this paper, is formed by polishing), the DCJ zone ceases to fulfill its protective function, which may be the cause of damage or even death of the pulp [
18].
The time after which the safe temperature of 40 °C is exceeded without water cooling was 29.4 s, while the use of water cooling increases it to 34.6 s. The time needed to clean the enamel is on average 18–40 s depending on the attachments used and the method of etching and cleaning the enamel [
27]. Considering these facts, doctors should be made aware of how much time they should devote to cleaning or polishing enamel so as not to cause an iatrogenic effect on tooth health. It is also important to limit the polishing of composite fillings, which for a satisfactory aesthetic effect often require a long polishing time with the whole set of polishers, often exceeding the polishing time considered safe several times [
28]. The enamel polishing time in the present study was designed to be longer for experimental purposes in order to see how much and how quickly the temperature changes inside the chamber and to make clinicians aware of the high risk of overheating the tooth, which consequently leads to necrosis of the pulp.
One of the factors that can significantly affect the tooth temperature obtained during thermal treatment is the thickness of the enamel. The heat conduction within the tooth depends on the thickness of the enamel because it has a significantly higher thermal conductivity coefficient. Heat transfer occurs at a lower rate in materials with low thermal conductivity than in materials with high thermal conductivity. Increased enamel thickness, which has a higher thermal conductivity coefficient, will therefore be responsible for more efficient thermal energy transport within the tooth. This coefficient is positively correlated with material density.
Importantly, the adjustment of thermokinetic functions to the experimental data on temperature changes of the incisors and premolars indicates that there are no significant differences in matching error for the one-exponential function and the two-exponential function.
Both the one- and the two-exponential model were verified because the tooth can be treated as a multi-layer (two-layer) model [
29,
30]. In this case, a theoretically better model solution should be the two-exponential function due to the fact that each layer has different thermokinetic properties. Nevertheless, in the course of the conducted research, it turned out that the fitting error for the one-exponential and two-exponential functions was comparable, and therefore it can be assumed that the tooth is a first-order thermokinetic object and the differences in the thermal response for individual layers (enamel and dentin) are small.
The literature indicates an insulating effect of thick dentin, with teeth that have small amounts of dentin being more prone to temperature increases, especially for thicknesses of 1 mm or less [
13]. In the present study, however, no correlation between the enamel and dentin density and the increase in pulp chamber temperature was found. This indicates that the tooth in relation to thermokinetic parameters can be considered as a one-component model and the conducted research showed that there is no correlation between the enamel density and the obtained thermokinetic parameters. Thus, this confirms the fact that the final effect of temperature changes will have a decisive influence on the thickness of the enamel. Subsequent studies will assess the dependence of the enamel thickness of the currently examined teeth on the increase in pulp chamber temperature, which will allow for the comparison of results with the Seelbach et al. studies [
13].
There are few studies focused on dental tissue density; tissue thickness assessment results are mainly presented instead. Neboda et al. [
31] showed that the average healthy enamel density of the first permanent molars was 2.46 g/cm
3. In our studies, assessing the density of the enamel of premolars and incisors, the tissue density averages were 3.58 g/cm
3 and 3.62 g/cm
3, respectively. The difference in the literature is probably due to the young age of the teeth examined by Neboda et al. [
31]. The teeth in our studies were removed from adult patients in whom mineralization progressed many years after eruption. Also, it is hard to compare morals with premolars and incisors.
The methodology of this research has some limitations worth mentioning. In the presented research model, it was not possible to accurately reflect the in vivo clinical conditions. A number of factors, such as the presence of saliva, the presence of oral microflora, the presence of sugars in the diet, potential drug intake etc. were not mimicked. In this study, an adhesive paste was not used, as adding to the model variables would cause significant difficulties in interpreting the obtained results. The undeniable limitation of this study is the size and heterogeneity of the study group, because teeth were extracted from patients of different ages, genders and health statuses.
A model with the use of a thermal imaging camera was used. This model enables the determination of the tissue surface temperature. On this basis, using parameters such as the heat transfer factor, it is possible to model the spread of temperature within the teeth. However, slight anatomical differences, e.g., resulting from the different thickness of the DEJ and DCJ zones, may slightly affect the obtained results. In addition, the thermal imaging camera used works in the wavelength range of 7.5–13 µm; therefore, it does not register radiation below and above this value.
5. Conclusions
A lack of water cooling causes the temperature of the pulp chamber to rise above the temperature considered safe and within the pulp adaptation range, which is about 40–42 °C.
The temperature increase of the tooth tissues under the influence of cleaning is proportional to the time that the rotating instrument is in contact with the tooth tissues. A clinically significant increase in temperature, which can damage the pulp, occurs when the cleaning procedure takes longer than 35 s.
The increase in the pulp chamber temperature is not related to the dentin and enamel density, and the decrease in the pulp chamber temperature in the water-cooled group is independent of the type of tooth, as is the temperature drop in the pulp chamber in the non-cooled group.
The increase in temperature in the pulp chamber is correlated more with the thermokinetic properties of the tissues (heat transfer factor) than with their anatomical parameters, i.e., the shape and size of the pulp chamber, because comparable results were obtained for both groups (incisors and premolars).
The rate of increase and decrease in temperature in the pulp chamber of incisors and premolars does not depend on the dentin density of both groups of teeth, although the dentin density of both groups of teeth differs significantly in favor of premolars. The enamel density is equal in both groups.

 ,
, 


