1. Introduction
Air conditioner is an important piece of equipment that makes a comfortable indoor environment and it controls output including air-temperature, -flow, -direction, and so on. In the case of a room with a person, the air conditioner’s control parameters are decided by the person’s comfort. However, in a case of multiple people, comfortable air condition may differ between people. This is because the most of the air conditioners try to make a uniform air condition in the entire room.
According to Mora and Bean [
1], “Thermal comfort is defined as “that condition of mind that expresses satisfaction with the thermal environment and is assessed by subjective evaluation” [
2]. The assessment of thermal comfort involves three dimensions: physical, physiological and psychological”. Thus, there can be multiple thermal comfort assessments in a room with different people. Many studies in the field that look at thermal comfort [
3,
4] show the variety of individual thermal comforts. For example, both of people waiting warmer and waiting cooler are observed in a condition [
3]. To provide thermal comfort to multiple people in a room, ideally an air conditioner should make non-uniform air-temperature and -flow distributions the room that satisfy thermal comfort for multiple users. However, to set the best control parameters that provide the best air-temperature and -flow distributions is an unrealistic task for manual operation because these distributions are invisible, and the relationships between control parameters of air the conditioners and these distributions are hard for a person to estimate. We therefore propose a method to estimate a set of air conditioner parameters for generating non-uniform air-temperature and -flow distributions, which should satisfy a summary of thermal comfort for multiple users.
A typical way to obtain air-temperature and -flow for a whole room is a simulation by computational fluid dynamics (CFD). To obtain a target air-temperature and -flow distribution by CFD, it is necessary to prepare a room shape model, air conditioner model, and other information that affects airflow and temperature. Then we need to iterate through a simulation by CFD and update control parameters until the simulation result is adequately close to the target condition. This approach is unsuitable for controlling air conditioners due to computationally expensive CFD iteration. We therefore propose a machine learning based approach that estimates control parameters directly.
2. Related Work
In parametric CFD analysis, generally various CFD parameters including shape, condition, flow, and so on are varied to understand the behaviour of a target. For example, Misra et al. conducted 3-D transient CFD analysis of an Earth Air Tunnel Heat Exchanger [
5]. Morover, Hill et al. summarized a number of CFD studies focused on the aerodynamics of gear windage losses [
6]. This kind of approach will be able to estimate air conditioner parameters, which can provide better air-temperature and -flow distributions in a room. However, iterative CFD simulation needs a long time for calculation time and is unsuitable for conditioning air because producing a comfortable room as soon as possible generally requires quick parameter estimation.
Whereas a parametric CFD analysis is basically an approach of forward analysis which estimate a air state from lots of parameters, an inverse analysis approach estimates parameters from an objective including an optimization of air condition. Inverse analysis based on adjoint sensitivity analysis is a typical approach to optimize an objective under the effect of airflow. A typical application of that is aerodynamic shape optimization [
7]. This kind of approach is applicable to optimizing the parameters of air conditioners. Moreover, Liu and Zhai [
8,
9] utilized inverse CFD and some sensors placed in a room to detect contaminant source. Although inverse analysis approach can obtain a local optimum parameters, it is basically faster than an approach with iteration of forward analysis. However, computational speed of inverse analysis is not enough for air conditioning in actual use.
There are some methods to reduce computational costs in inverse fluid dynamics, including a method utilizing Fast Fluid Dynamics [
10], Genetic Algorithm [
11] and so on. A machine learning based approach is effective for accelerating non-linear numerical calculation. Regarding forward simulation of CFD, there are some methods for accelerating simulation using machine learning [
12,
13,
14,
15]. Regarding inverse analysis of CFD, an approach based on machine learning is applicable. Singh et al. [
16] demonstrated machine learning approaches to inverse modeling. One of the advantages of machine learning approaches is fast calculation in the inference phase, and machine learning is also suitable for air conditioning during actual use. We therefore apply machine learning approach to an inverse estimation of air conditioner parameters that generate non-uniform air-temperature and -flow distribution for satisfying thermal comfort for multiple users.
3. Methodology
The overall flow of our method is a typical supervised learning flow. Namely, we generate a training data set using CFD simulation with various parameters and then train a model as a mapping function from the condition of the air in a room to the parameters that generate the corresponding condition.
The key issue in this approach is input data. The target environment in the simulation is 3D, which is generally quantized by elements such as voxels or meshes, and each element has some parameters including temperature, airflow volume, airflow direction and so on. Thus, the entire parameterized 3D space that is a result of CFD simulation has extremely high dimensional information. We therefore introduce a compression of the 3D parameterized air condition in a room into a 2D multi-channel image.
The input data format we designed is a two channel image that shows a 2D room map, and each channel contains the distribution of temperature and airflow volume. We assume the distributions are at a 1 m height from the floor as a representative distribution in the room because the aim of our method is users’ thermal comfort and we considered the temperature at the height of user’s head as the most effective for thermal comfort. For the purposes of this paper, we defined 1 m as the representative height by considering the head height of a seated user. Moreover we ignore the direction of airflow because the definitions of thermal comfort according to ANSI/ASHRAE Standard 55 [
2] considers Operative temperature, Air speed, Relative humidity, Metabolic rate, and Clothing level but it does not consider the direction of airflow. For example, the comfort zone is defined by following equations
where
is lower operative temperature
limit for closing insulation
,
is upper operative temperature
limit for closing insulation
,
is termal insulation of the clothing i question, and “clo” is a unit used to express the thermal insulation provided by garments and clothing ensembles. Average air speed
greater than 0.2 m/s increase the lower and upper operative temperature
limit for the comfort zone.
To apply the air temperature
T and flow volume
F to an image, we normalize them by following equations,
Figure 1 shows the examples of input image which represents airflow and temperature distributions.
We employed ResNet-50 [
17] as a model for inferring air conditioners’ control parameters. We then add full connection layer for the regression and classification of air conditioners’ parameters.
Figure 2 shows the overall pipeline of our method.
4. Experiments by Simulations
4.1. Data Set Generation
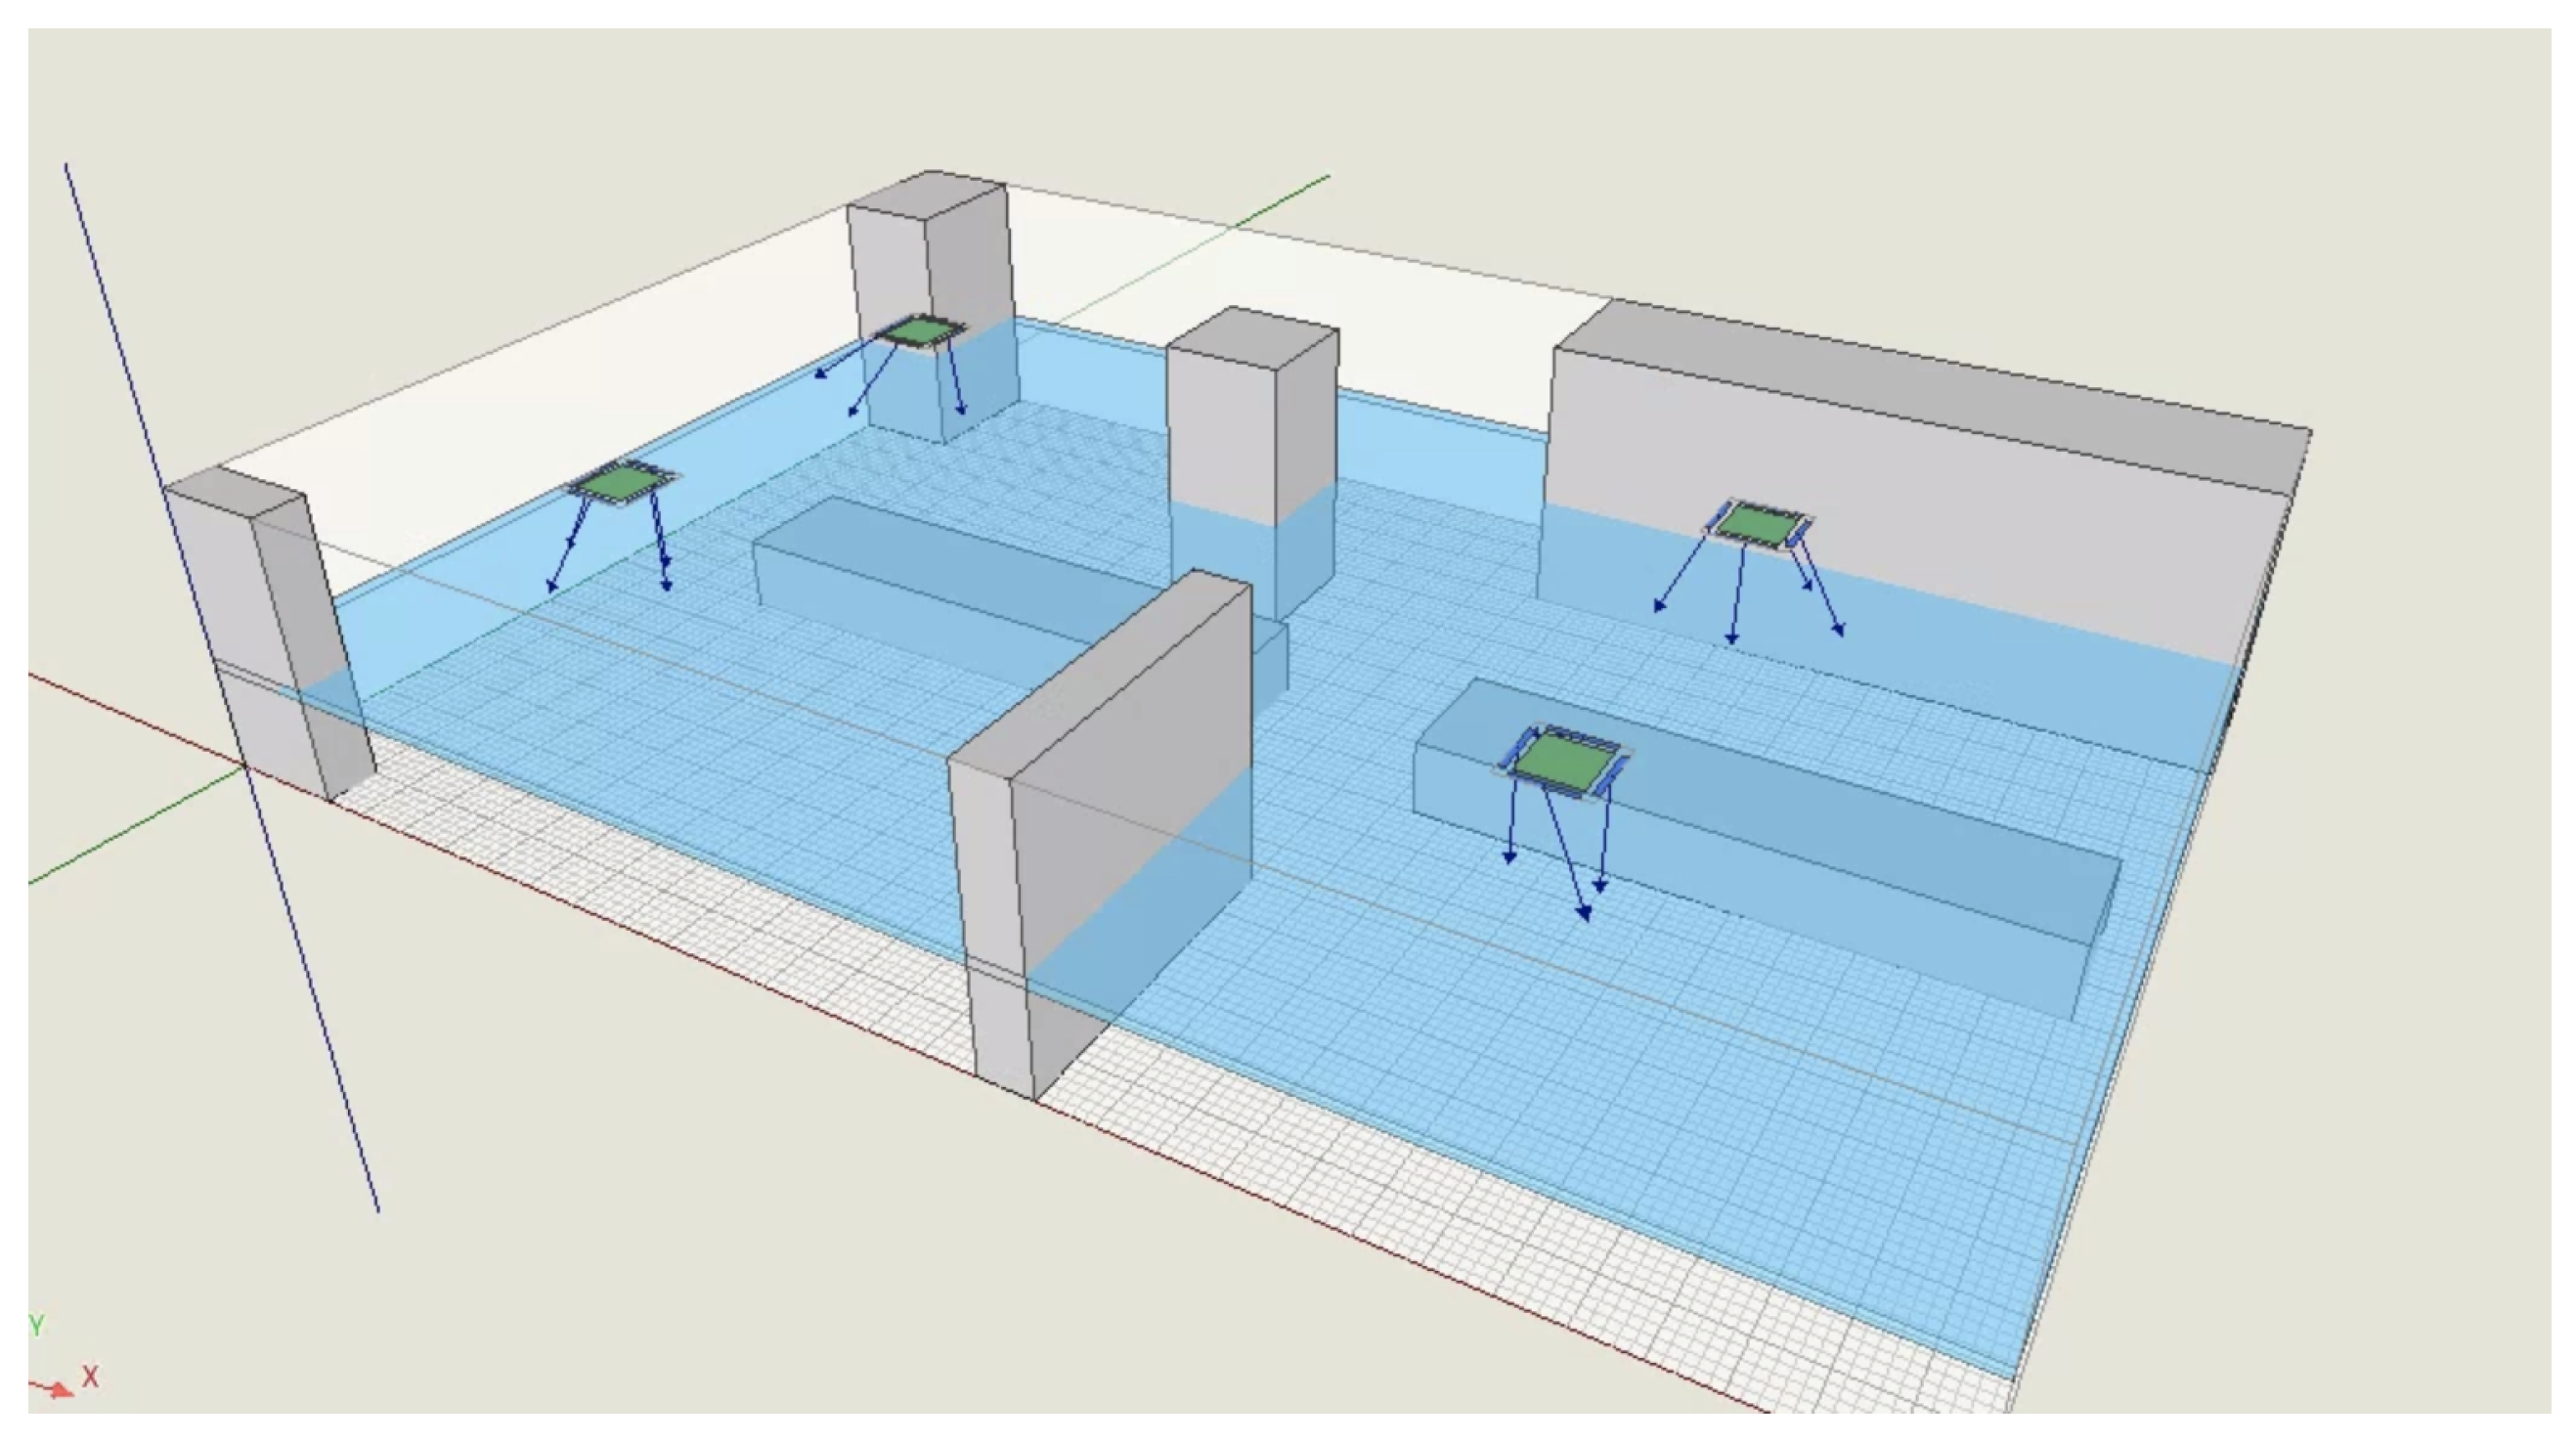
We utilized FlowDesigner (Advanced Knowledge Laboratory, Inc.), which consists of Finite Volume Method and Semi-Implicit Method for Pressure Linked Equations-Consistent algorithm, for generating data set. We evaluated our method with two room models shown in
Figure 3 and
Figure 4, where green square is air conditioner under the ceiling, blue surface is the sampling plane for input image, and gray cuboids are wall and table.
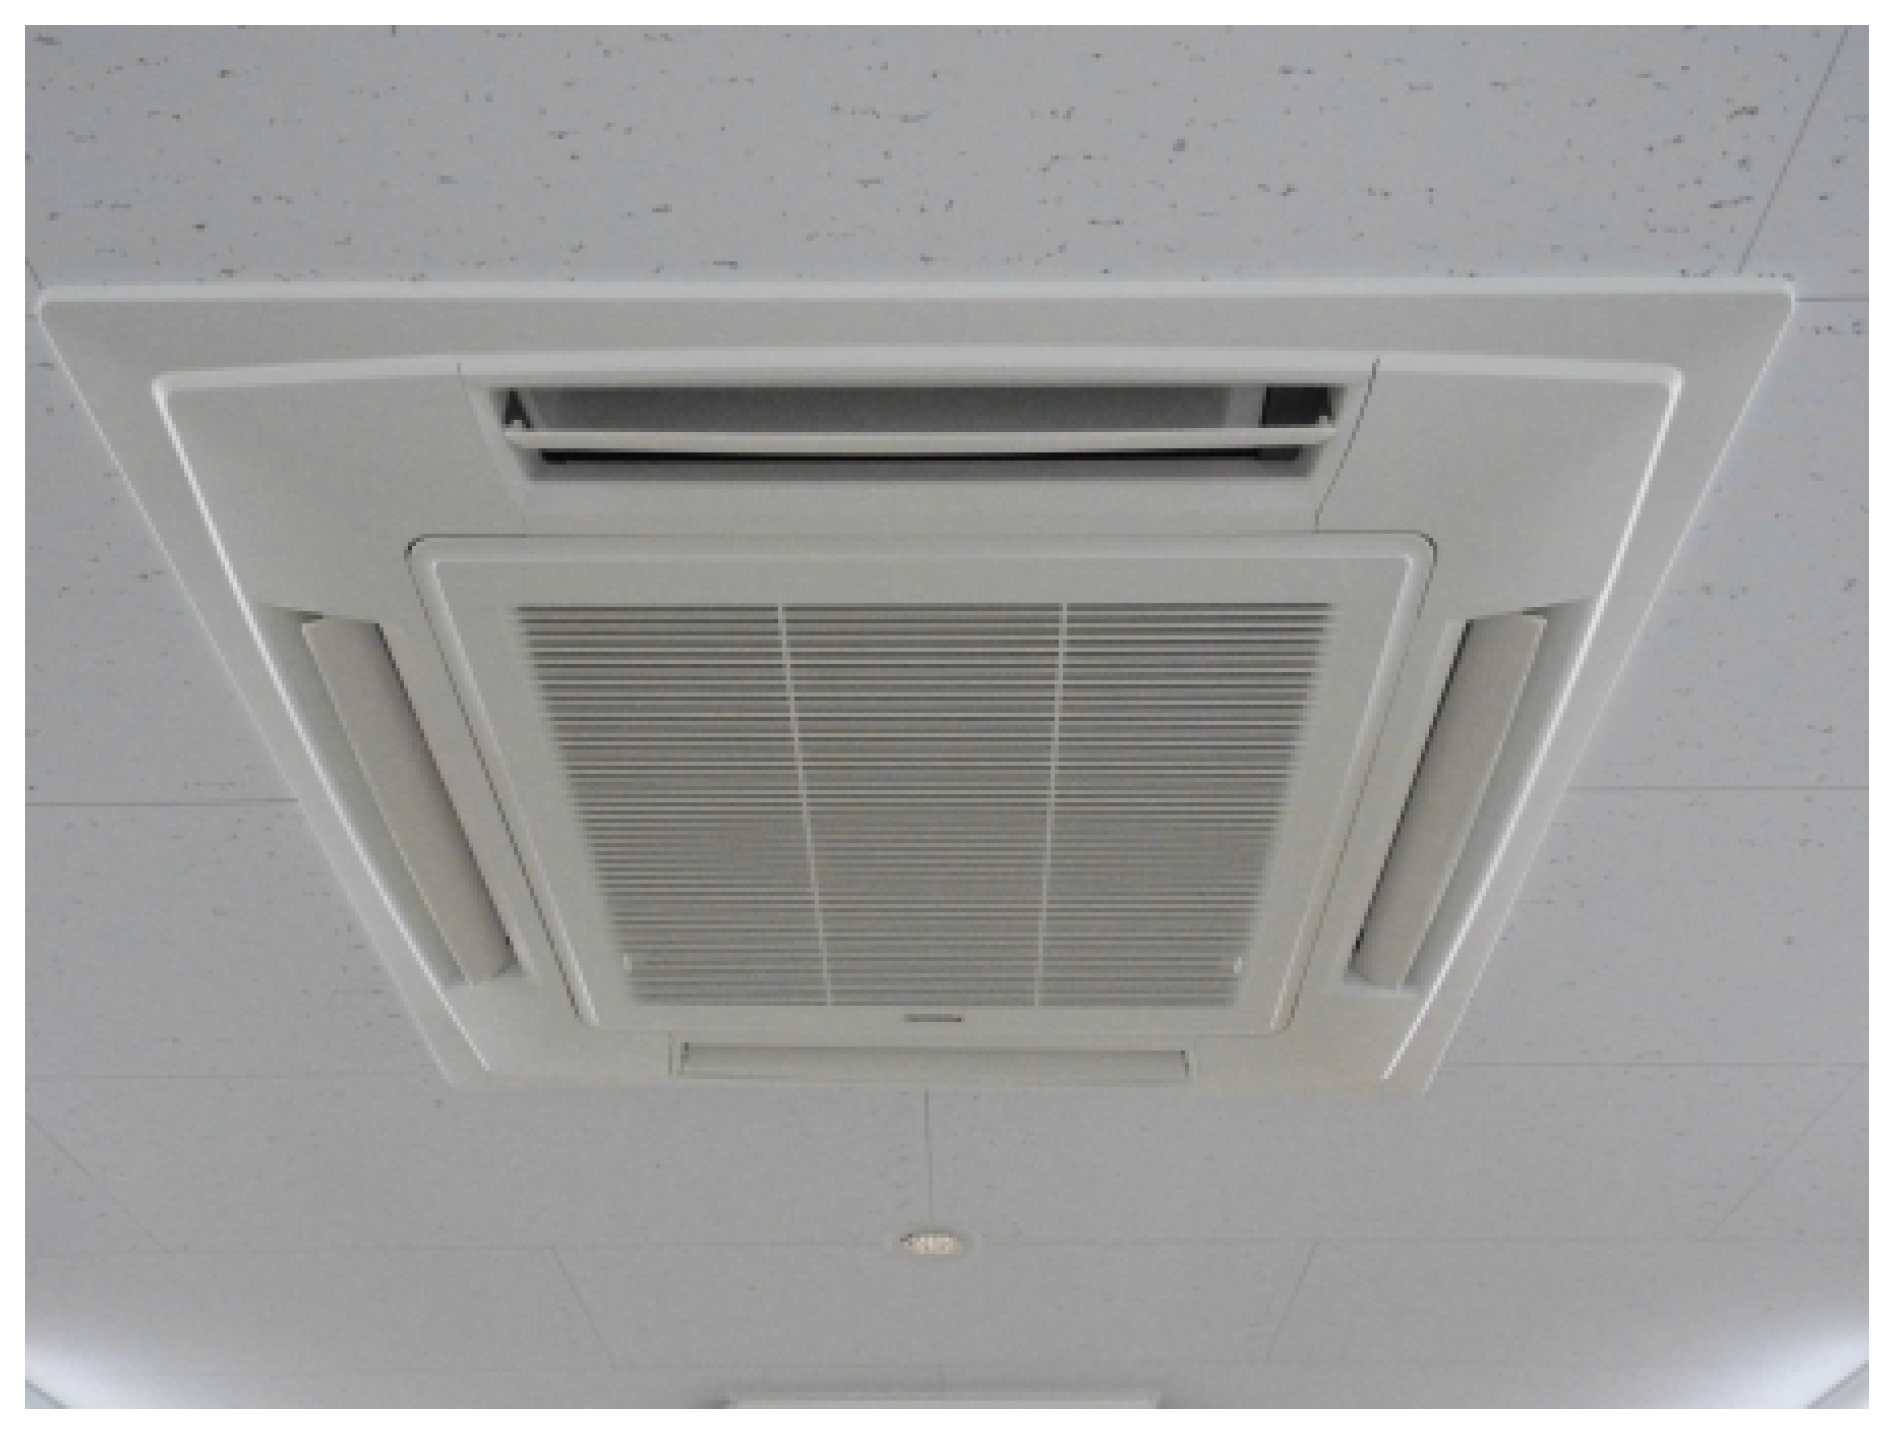
Figure 5 shows an example of the air conditioner we assumed, which has four air supplies on the rim with a wing for controlling air direction and an air-intake at the center.
Table 1 shows the parameters of an air conditioner in this simulation.
4.2. Evaluation with a Small Room
We conducted the evaluation with the small room shown in
Figure 3 which has two air conditioners under the ceiling. We used a ResNet-50 model pretrained with the ImageNet and ResNet-50 models without pretraining. Both models are trained with 300 epochs with an Adam optimizer and mean squared error (MSE) Loss. We employed the ResNet in Keras with the default setting and do not conducted parameter tuning for the training. We generate 10,000 images for the training.
As validation, we inferred the air conditioners’ control parameters using 100 sets of temperature and flow volume distribution images which were not used in the training. We then regenerated the images of temperature and airflow volume distributions from the inferred parameters.
Figure 6 shows two examples of input images, regenerated images, and difference images from a corresponding input image. The mean absolute error (MAE) of the regenerated image are shown in
Table 2.
As shown in
Table 2, the MAEs of temperature from the model with and without pretraining were
and
, respectively. the MAEs of airflow volume are
and
m
3/min, respectively. The processing time for 100 sets of images was 36.54 s, where the specifications of the computer for this processing are Ubuntu 16.04, Intel(R) Xeon(R) E5-2640 v4 2.40 GHz, 256GB DDR4, and NVIDIA GeForce GTX 1080 Ti. We believe the processing speed is enough to manage actual air conditioning in real time.
We conducted Welch T-test to confirm significant differences between the model with pretraining and without pretraining. The result of the Weltch T-test with a significance level 0.05 is shown in
Table 3. Along with these results, there was no significant difference in the airflow volume but there is significant difference in the temperature.
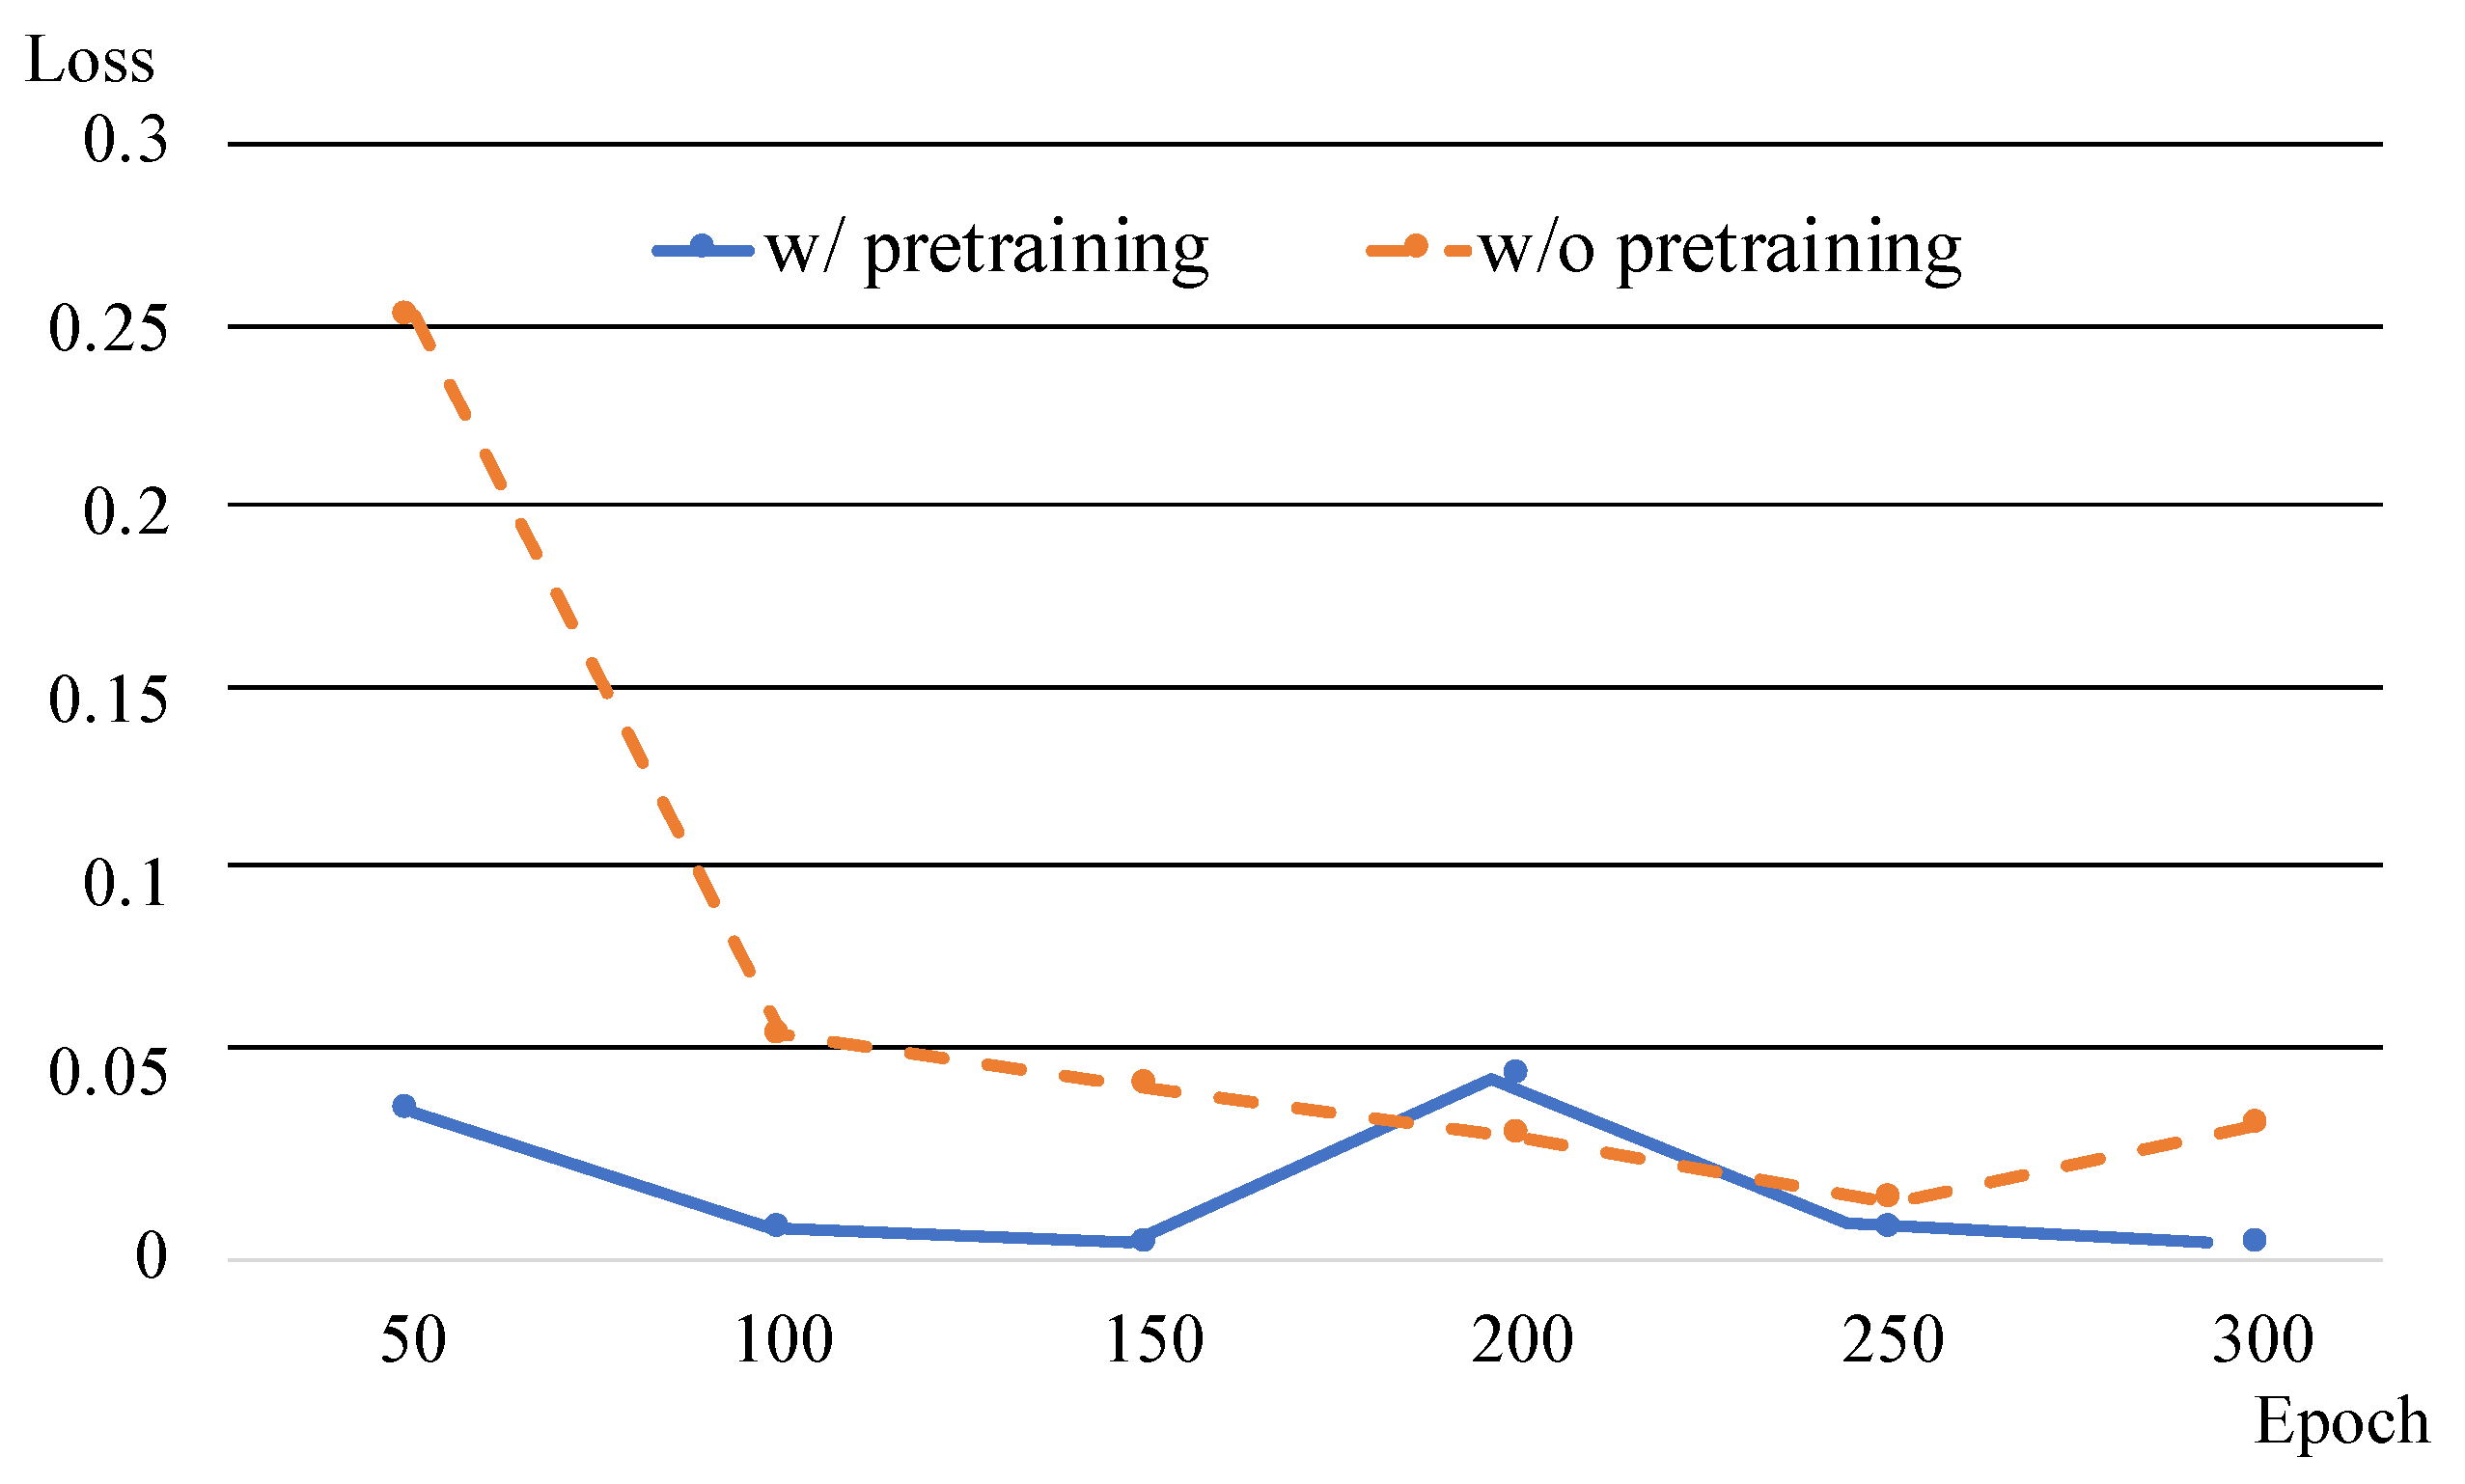
Figure 7 shows the variations of the loss with pretraining and without pretraining. The pretrained model decreases the loss earlier than the model without pretraining. Thus, the pratraining has an advantage to reduce training time but its performance is lower than the model without pretraining. From these results, we can conclude that the Non-pretrained model can produce better thermal environment if the computational resources for training model and data generation are available.
4.3. Evaluation with a Large Room
We conducted an evaluation with a large room shown in
Figure 4 which has four air conditioners under the ceiling. In the same way as the evaluation with small room, we used ResNet-50 with pretraining with ImageNet. We trained the model for 600 epoch, and the other training parameters were the same as the evaluation with the small room. We conducted 5100 simulations for generating the training dataset.
We validated the performance of the trained models with 90 sets of images of temperature and airflow distributions in the room. The examples of input images, regenerated images, and difference images are shown in
Figure 8. We also conducted a comparison between two room sizes as shown in
Table 4. Moreover, the result of a Welch T-test between the two sizes of the room are shown in
Table 5. Along with this test, there was no significant difference in the temperature but there was a significant difference in the airflow. As shown in the
Table 4, the MAEs of temperature and airflow are 1.5 °C and 0.1 m
3/min, respectively. The results indicate that there is less of an effect of room size on the performance of air distribution control by our method. Although, the number of training epochs should be increased along with the room size.
5. Conclusions
In this study, we proposed a machine learning based method for controlling multiple air-conditioners in a room to generate the non-uniform air-temperature and -flow distributions that can satisfy the thermal comfort of multiple users. We utilized CFD simulation for generating a training data set, which includes the air condition in the room and the corresponding control parameters of air conditioners in the room. The generated air condition in a room that has air temperature and airflow at each element is compressed to 2D image of air temperature and airflow volume as an input for training. As an implementation, we utilized ResNet-50 as a machine learning model and the performance of our method are 1.5 °C and 0.1 m3/min MAE in a room. We also compared pretrained ResNet-50 and ResNet-50 without pretraining. The future works for this method includes refinement of the model by employing some advanced machine learning techniques.
Author Contributions
Conceptualization, T.M.; methodology, T.M. and T.K.; software, T.K.; validation, T.K.; investigation, T.K. and T.M.; data curation, T.K.; writing—original draft preparation, T.K. and T.M.; writing—review and editing, T.M. and P.R.; supervision, T.M. and P.R.; project administration, T.M.; All authors have read and agreed to the published version of the manuscript.
Funding
This Research Was Funded By Daikin Industries, LTD.
Conflicts of Interest
The authors declare no conflict of interest.
Abbreviations
The following abbreviations are used in this manuscript:
| CFD | Computational Fluid Dynamics |
| MAE | Mean Absolute Error |
References
- Mora, R.; Bean, R. Thermal comfort: Designing for people. ASHRAE J. 2018, 60, 40–46. [Google Scholar]
- ASHRAE. Thermal Environmental Conditions for Human Occupancy; Standard 55-2017; American Society of Heating, Refrigerating and Air-Conditioning Engineers Inc.: Atlanta, GA, USA, 2017. [Google Scholar]
- Corgnati, S.P.; Filippi, M.; Viazzo, S. Perception of the thermal environment in high school and university classrooms: Subjective preferences and thermal comfort. Build. Environ. 2007, 42, 951–959. [Google Scholar] [CrossRef]
- Schiller, G.; Arens, E.A.; Bauman, F.; Benton, C.; Fountain, M.; Doherty, T. A field study of thermal environments and comfort in office buildings. ASHRAE Trans. 1988, 94. [Google Scholar] [CrossRef]
- Misra, R.; Bansal, V.; Agrawal, G.D.; Mathur, J.; Aseri, T.K. CFD analysis based parametric study of derating factor for Earth Air Tunnel Heat Exchanger. Appl. Energy 2013, 103, 266–277. [Google Scholar] [CrossRef]
- Hill, M.J.; Kunz, R.F.; Medvitz, R.B.; Handschuh, R.F.; Long, L.N.; Noack, R.W.; Morris, P.J. CFD analysis of gear windage losses: Validation and parametric aerodynamic studies. J. Fluids Eng. 2011, 133, 031103. [Google Scholar] [CrossRef] [Green Version]
- Skinner, S.N.; Zare-Behtash, H. State-of-the-art in aerodynamic shape optimisation methods. Appl. Soft Comput. 2018, 62, 933–962. [Google Scholar] [CrossRef]
- Liu, X.; Zhai, Z. Inverse modeling methods for indoor airborne pollutant tracking: Literature review and fundamentals. Indoor Air 2007, 17, 419–438. [Google Scholar] [CrossRef] [PubMed]
- Liu, X.; Zhai, Z. Location identification for indoor instantaneous point contaminant source by probability-based inverse Computational Fluid Dynamics modeling. Indoor Air 2008, 18, 2–11. [Google Scholar] [CrossRef] [PubMed]
- Liu, W.; You, R.; Zhang, J.; Chen, Q. Development of a fast fluid dynamics-based adjoint method for the inverse design of indoor environments. J. Build. Perform. Simul. 2017, 10, 326–343. [Google Scholar] [CrossRef]
- Xue, Y.; Zhai, Z.J.; Chen, Q. Inverse prediction and optimization of flow control conditions for confined spaces using a CFD-based genetic algorithm. Build. Environ. 2013, 64, 77–84. [Google Scholar] [CrossRef]
- Kutz, J.N. Deep learning in fluid dynamics. J. Fluid Mech. 2017, 814, 1–4. [Google Scholar] [CrossRef] [Green Version]
- Guo, X.; Li, W.; Iorio, F. Convolutional neural networks for steady flow approximation. In Proceedings of the 22nd ACM SIGKDD International Conference on Knowledge Discovery and Data Mining, San Francisco, CA, USA, 13–17 August 2016; pp. 481–490. [Google Scholar]
- Tompson, J.; Schlachter, K.; Sprechmann, P.; Perlin, K. Accelerating eulerian fluid simulation with convolutional networks. In Proceedings of the 34th International Conference on Machine Learning, Sydney, Australia, 6–11 August 2017; pp. 3424–3433. [Google Scholar]
- Ladickỳ, L.; Jeong, S.; Solenthaler, B.; Pollefeys, M.; Gross, M. Data-driven fluid simulations using regression forests. ACM Trans. Graph. TOG 2015, 34, 1–9. [Google Scholar] [CrossRef]
- Singh, A.P.; Medida, S.; Duraisamy, K. Machine-learning-augmented predictive modeling of turbulent separated flows over airfoils. AIAA J. 2017, 55, 2215–2227. [Google Scholar] [CrossRef]
- He, K.; Zhang, X.; Ren, S.; Sun, J. Deep residual learning for image recognition. In Proceedings of the IEEE Conference on Computer Vision and Pattern Recognition, Chengdu, China, 15–17 December 2016; pp. 770–778. [Google Scholar]
| Publisher’s Note: MDPI stays neutral with regard to jurisdictional claims in published maps and institutional affiliations. |
© 2020 by the authors. Licensee MDPI, Basel, Switzerland. This article is an open access article distributed under the terms and conditions of the Creative Commons Attribution (CC BY) license (http://creativecommons.org/licenses/by/4.0/).


