1. Introduction
Any everyday object today has the ability to interact with other objects without human intervention if they are connected to a network. This interconnection between machines is known as machine-to-machine (M2M) communication and has evolved over the years to create the concept of the Internet of Things (IoT), as a greater variety of objects have enabled communication features and can exchange data through the internet.
Cybernetic systems, the use of the Internet, and these types of networks are currently allowing an evolution in industry, giving way to Industry 4.0, which seeks the transformation towards an intelligent organization in order to achieve optimized results. Based on this definition, the “Industrial Internet of Things” (IIoT) concept has emerged, using IoT-based technologies with the aim of improving industrial processes.
Some of the most promising communication solutions being adopted are low-power wide-area network (LPWAN) technologies since their characteristics fit some industrial application requirements [
1]. LPWAN technologies make use of end devices, gateways, network servers, and application servers to enable the exchange of data in the range of kilometers at a very low energy cost. Within LPWAs there are several technologies such as Sigfox, LoRaWAN, NB-IoT, or Dash7. All LPWAN candidates enable long-range communication, use devices with a battery life that can last up to years (configured accordingly), and can integrate a large number of devices with small infrastructure, which entails a low cost. LoRaWAN (Long Range Wide Area Network) has been chosen for all the advantages it offers. The key advantage of selecting this technology over the other popular LPWAN solutions is that LoRaWAN can be deployed as a private network, avoiding the use of public infrastructure and allowing some degree of optimization and special configuration that can be of interest to better fit industrial applications, as it operates in unlicensed bands and the MAC layer protocol is open [
2].
Nevertheless, there are still some aspects, issues, and barriers to overcome for this technology to be successfully adopted. One hurdle to face is battery lifetime. These devices must have a long useful life, but this is only possible with careful configurations and optimizations. Another big issue is the loss of packets in the network, which is influenced by the position of devices. This is a problem since the loss of information can have serious repercussions in the industrial process and data analytics.
The use of a LoRaWAN network in industrial scenarios makes sense because of this network’s ability to deploy a large number of connected devices. To improve the performance in such networks, the implementation of the Adaptive Data Rate (ADR) mechanism has been carried out following the description of the standard. This mechanism saves resources on the channel and saves battery by optimizing the transmission parameters. It also helps to adapt to channel conditions by changing the data rate transmission parameters of devices, which translates into a reduction in congestion in dense areas. In this way, the probability of success increases considerably. The main output of this work is therefore the implementation of the mechanism for adapting the data rate under a simulator—in this case, the widespread ns-3 simulator. This simulation tool allows operators to characterize the operation of the network and optimize parameters to reduce consumption and losses by configuring some parameters not strictly fixed by the standard. This implementation not only includes the mechanism for the uplink communication, which is the one selected by the standard, but also proposes using this mechanism for the downlink communication, from gateway to nodes, so it can help optimize new applications often overlooked until now, where the receivers of data are the end devices, such as actuators and sensor configurations. For instance, this implementation can be applied in a scenario where devices receive maintenance alerts coming from a data analysis system, as is presented in the Zero Defect Manufacturing Platform (ZDMP) [
3], and where the proposed LoRaWAN network is used to support the data acquisition and alarm event applications in industrial plants where communications are restricted to sub-gigahertz bands.
The rest of the paper is structured as follows:
Section 2 describes the concepts and technologies employed during the design and definition of the work.
Section 3 shows the related work relevant to the topic with a description of the main key points.
Section 4 and
Section 5 explain the proposed implementation, scenario, and configurations selected, while
Section 6 presents the results of the simulations for the cases under study. Finally,
Section 7 summarizes the conclusions and suggests future work.
2. LoRaWAN
LoRaWAN technology is a network protocol that makes use of Long Range (LoRa) technology, which acts as a physical layer. It is used for communication and device administration. Each of the two technologies, LoRa and LoRaWAN, will be explained in more detail below.
2.1. LoRa
Semtech’s Long Range (LoRa) [
4] is a low-level physical interface (PHY) that uses a special modulation to create long-range communications. LoRa is based on the spread spectrum technique (frequency-shift keying (FSK)) and the extended chirp spread spectrum (CSS) for modulation, allowing it to retain the same low-power characteristics while significantly increasing the range of communication. It also integrates forward error correction (FEC). LoRa uses the entire bandwidth of the channel to transmit a signal, so the signal is more robust against noise, significantly improving the sensitivity of the receiver.
LoRa is a PHY layer implementation and is independent of higher layer implementations. This allows LoRa to coexist and interoperate with existing network architectures. LoRa modulation addresses all the problems associated with DSSS systems to provide a low-cost, low-power, but above all robust alternative to traditional broad-spectrum communication techniques.
The data speed is variable, which allows optimization of network performance for a specific bandwidth. For this, LoRa works with orthogonal dispersion factors, called spreading factors (SFs). It operates in industrial, scientific, and medical (ISM) bandwidths, shown in
Table 1.
LoRa is designed for long-distance and low-power communications. This allows the network to have a large coverage area of several kilometers, depending on the characteristics of the environment.
2.2. LoRaWAN
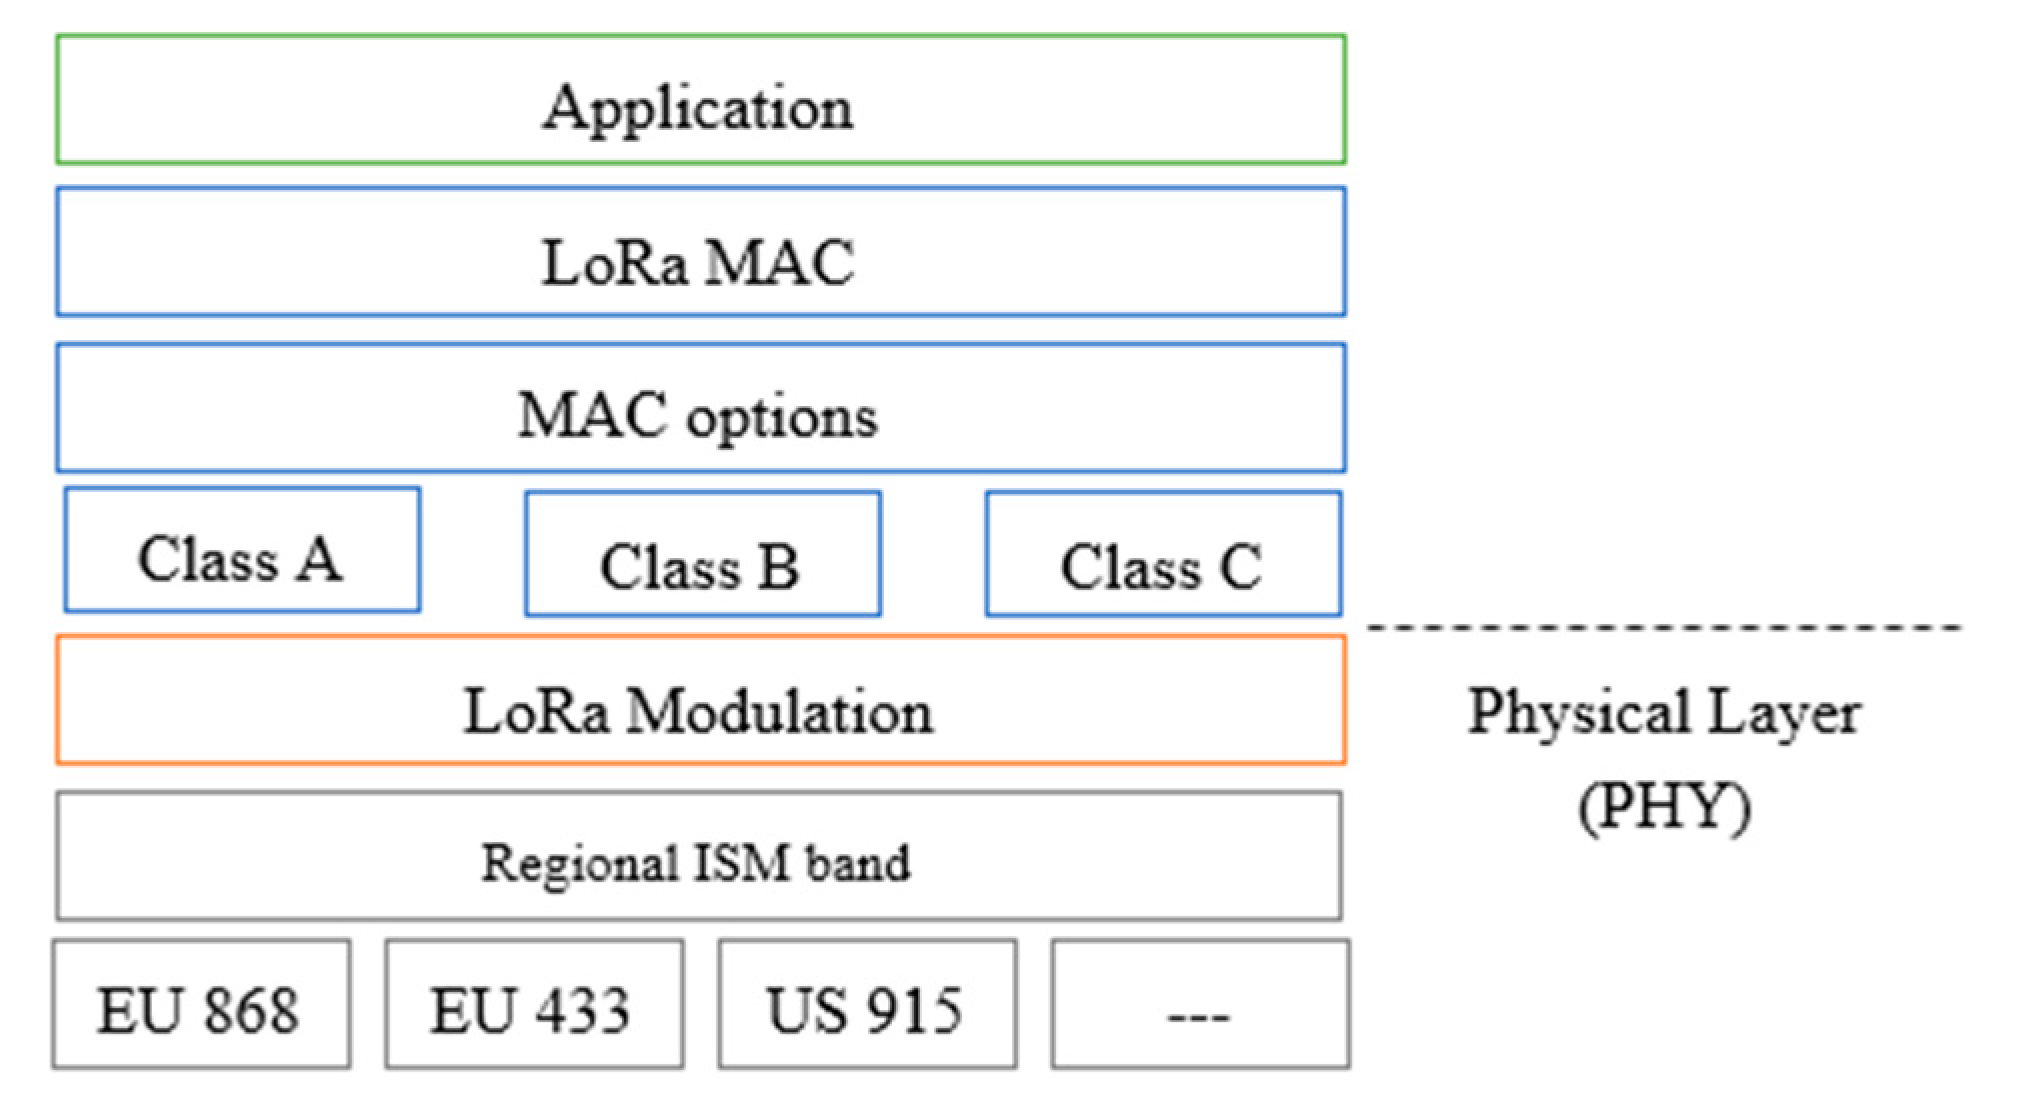
LoRaWAN [
5] oversees the definition of the MAC protocol and the architecture of the network system. LoRaWAN is an OSI layer 2 and 3 network protocol (see
Figure 1) that works with LoRa technology and is supported by a central network server that orchestrates all the devices (end nodes and gateways) of the network (for instance, selecting the best gateway for a node).
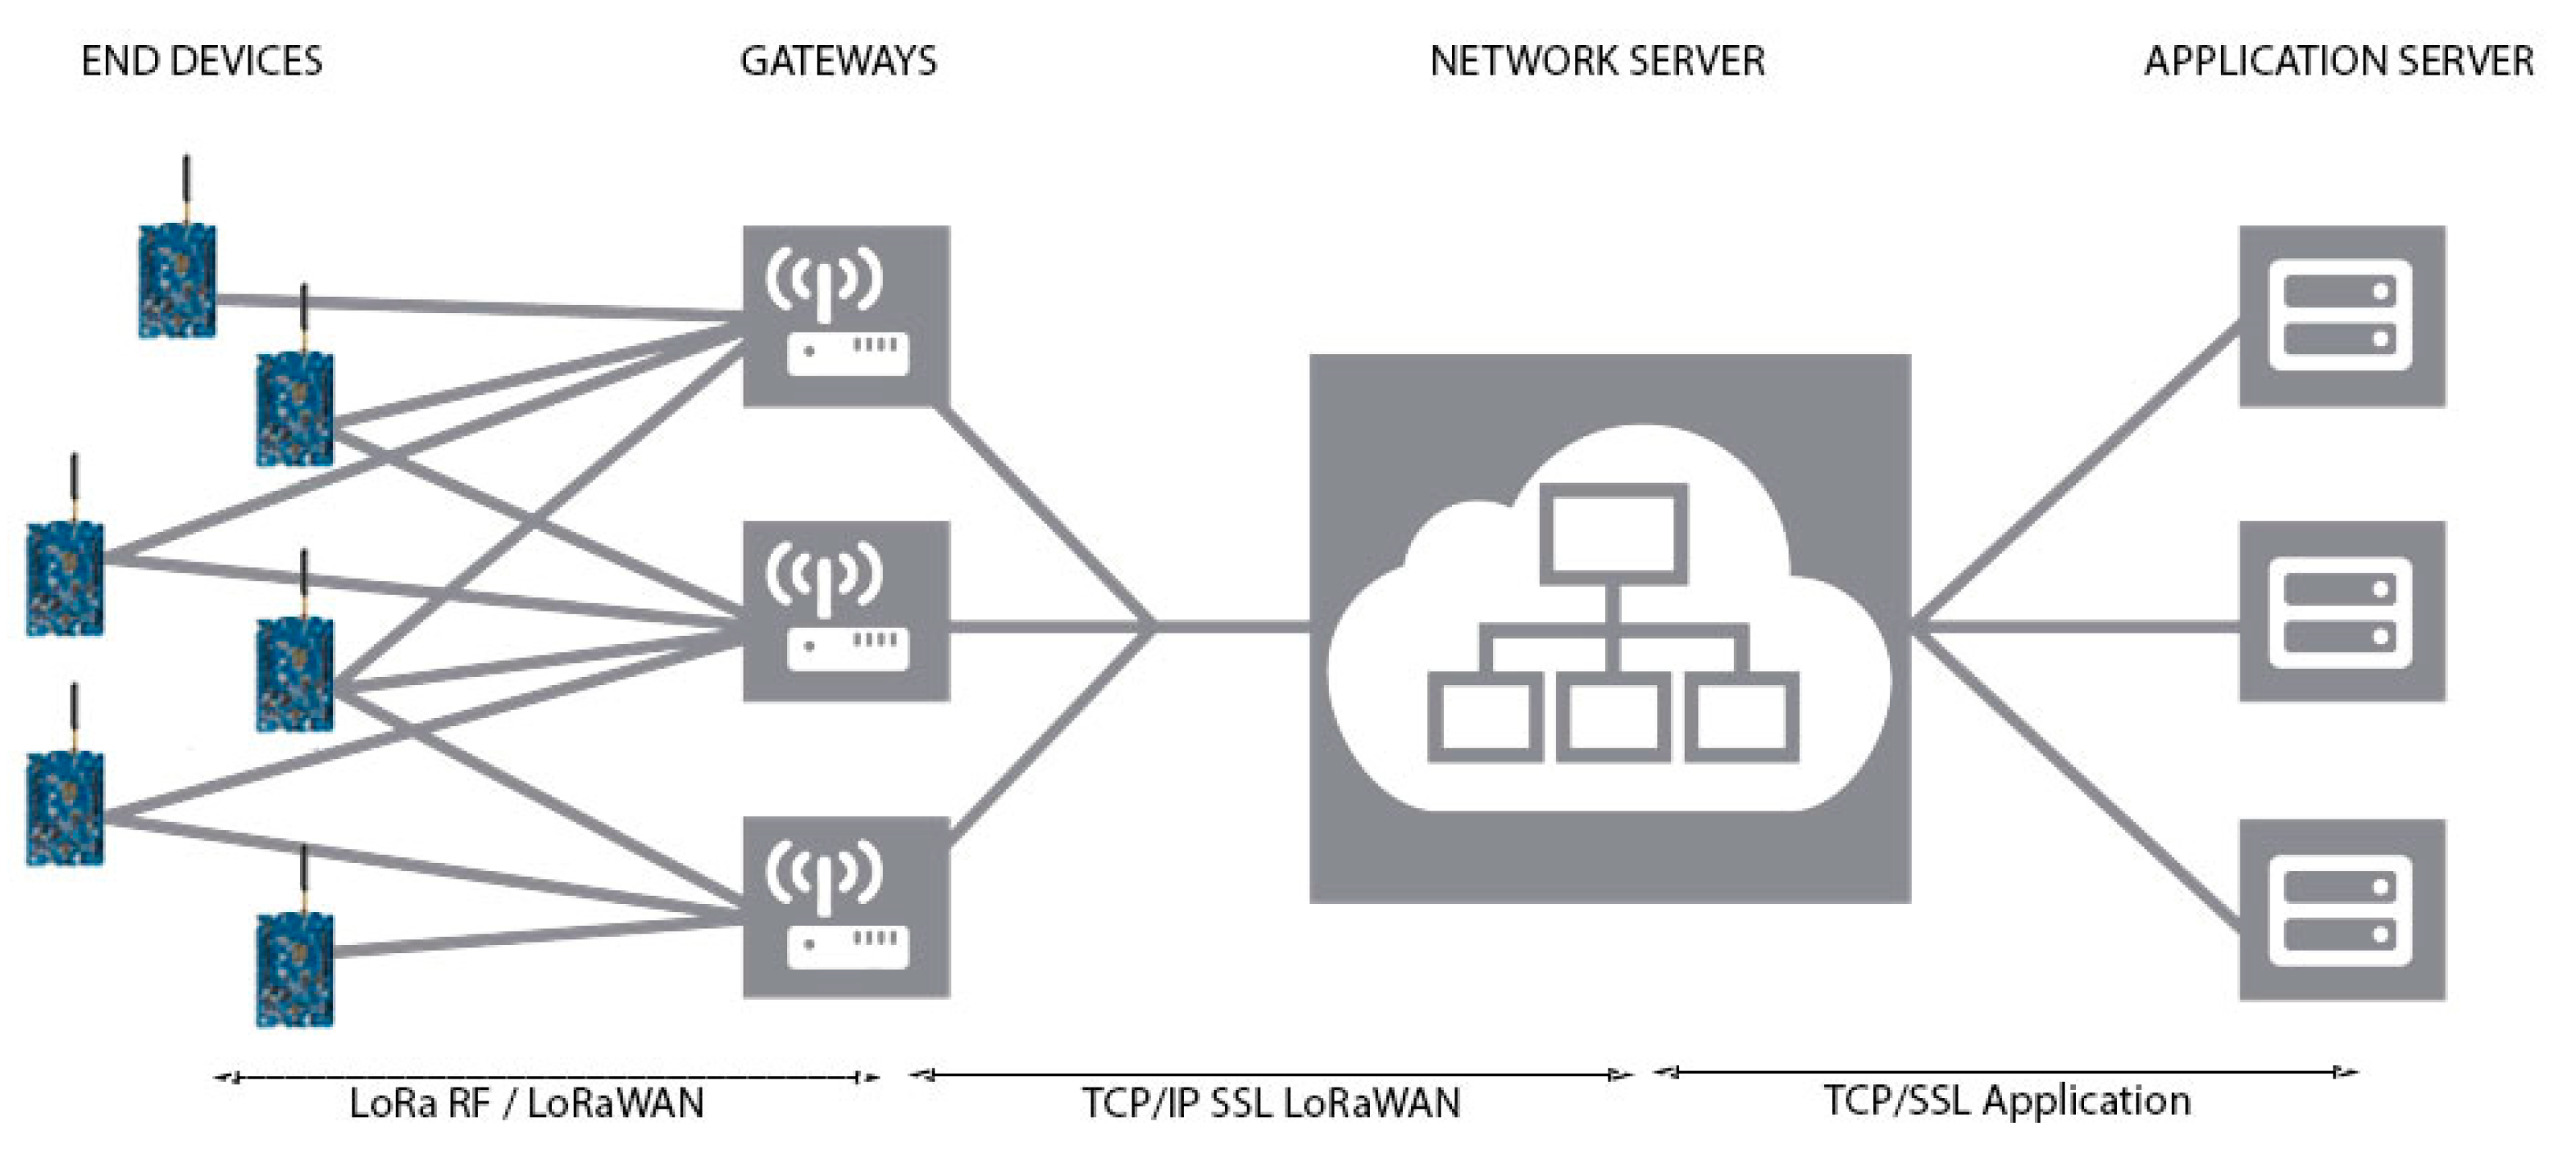
After these layers, the LoRaWAN architecture relies on application servers to connect with different application protocols, as shown in
Figure 2.
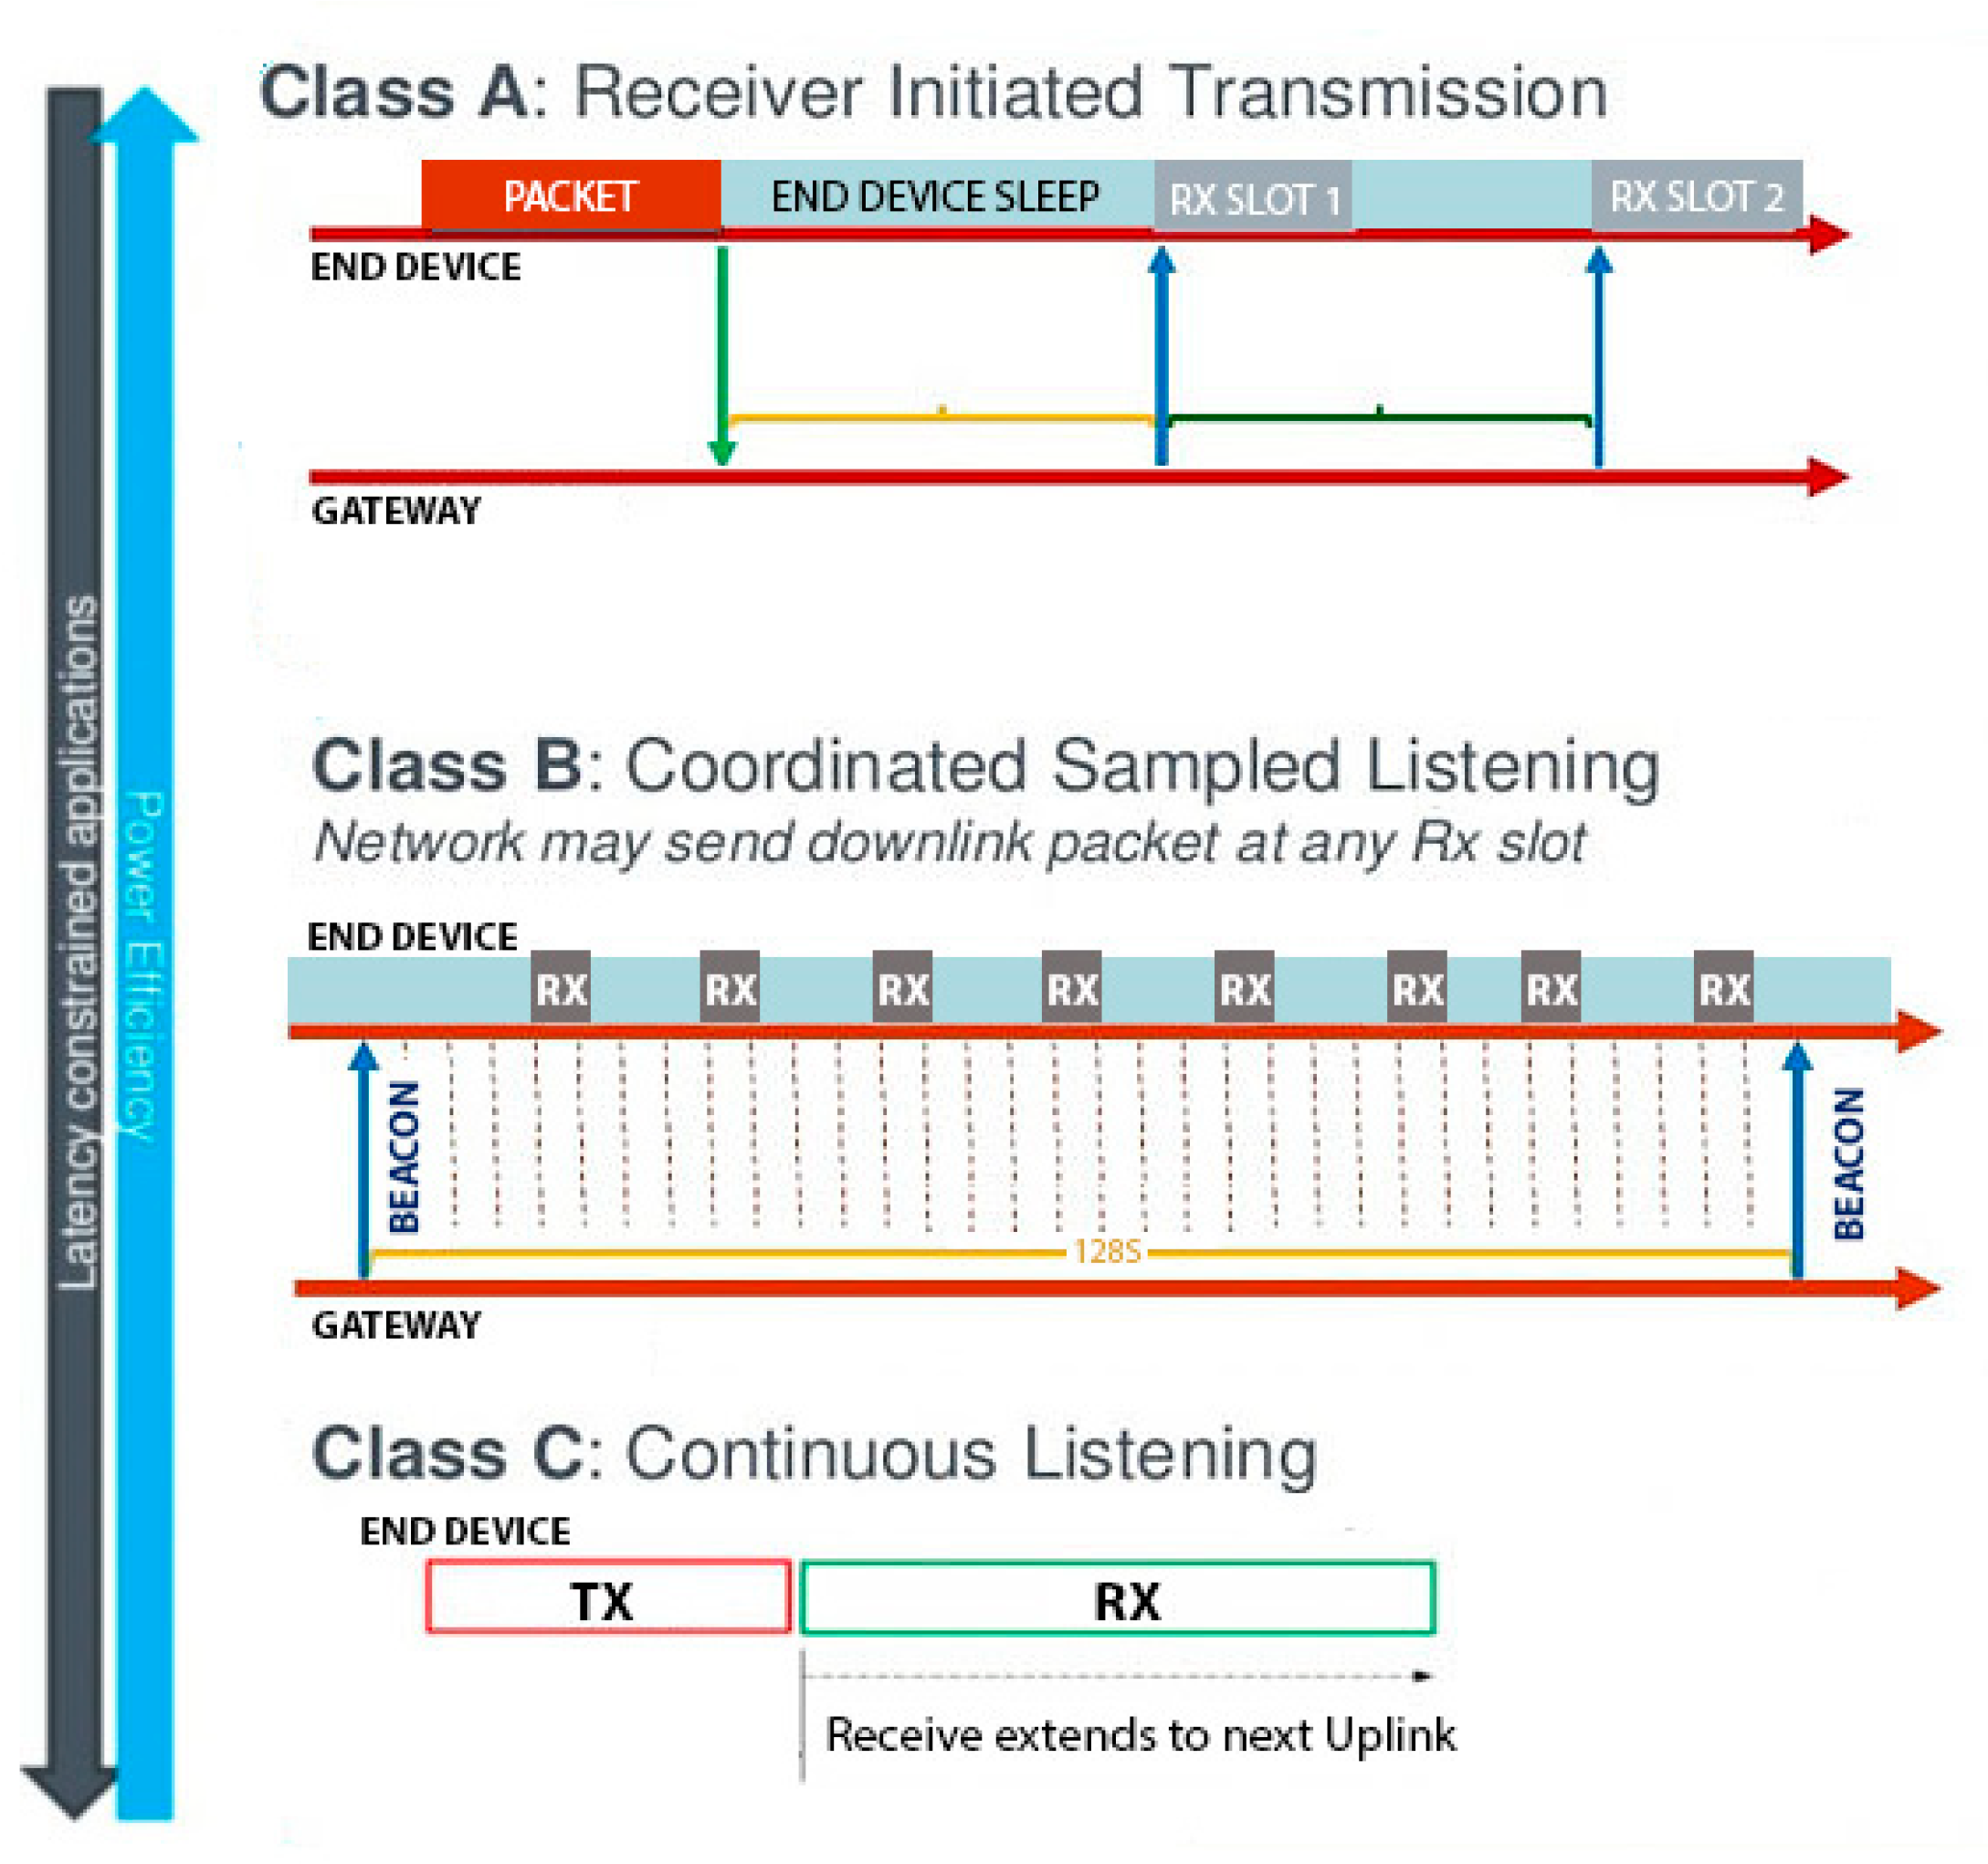
LoRaWAN offers three different classes or modes of operation for end devices (EDs), as seen in
Figure 3. Class A is the most basic mode of communication. Communication is bidirectional, with the limitation that nodes can only receive a download packet if they have previously sent an upload message, which is a great limitation for some applications. However, the battery saving in this class is greater than in the other classes.
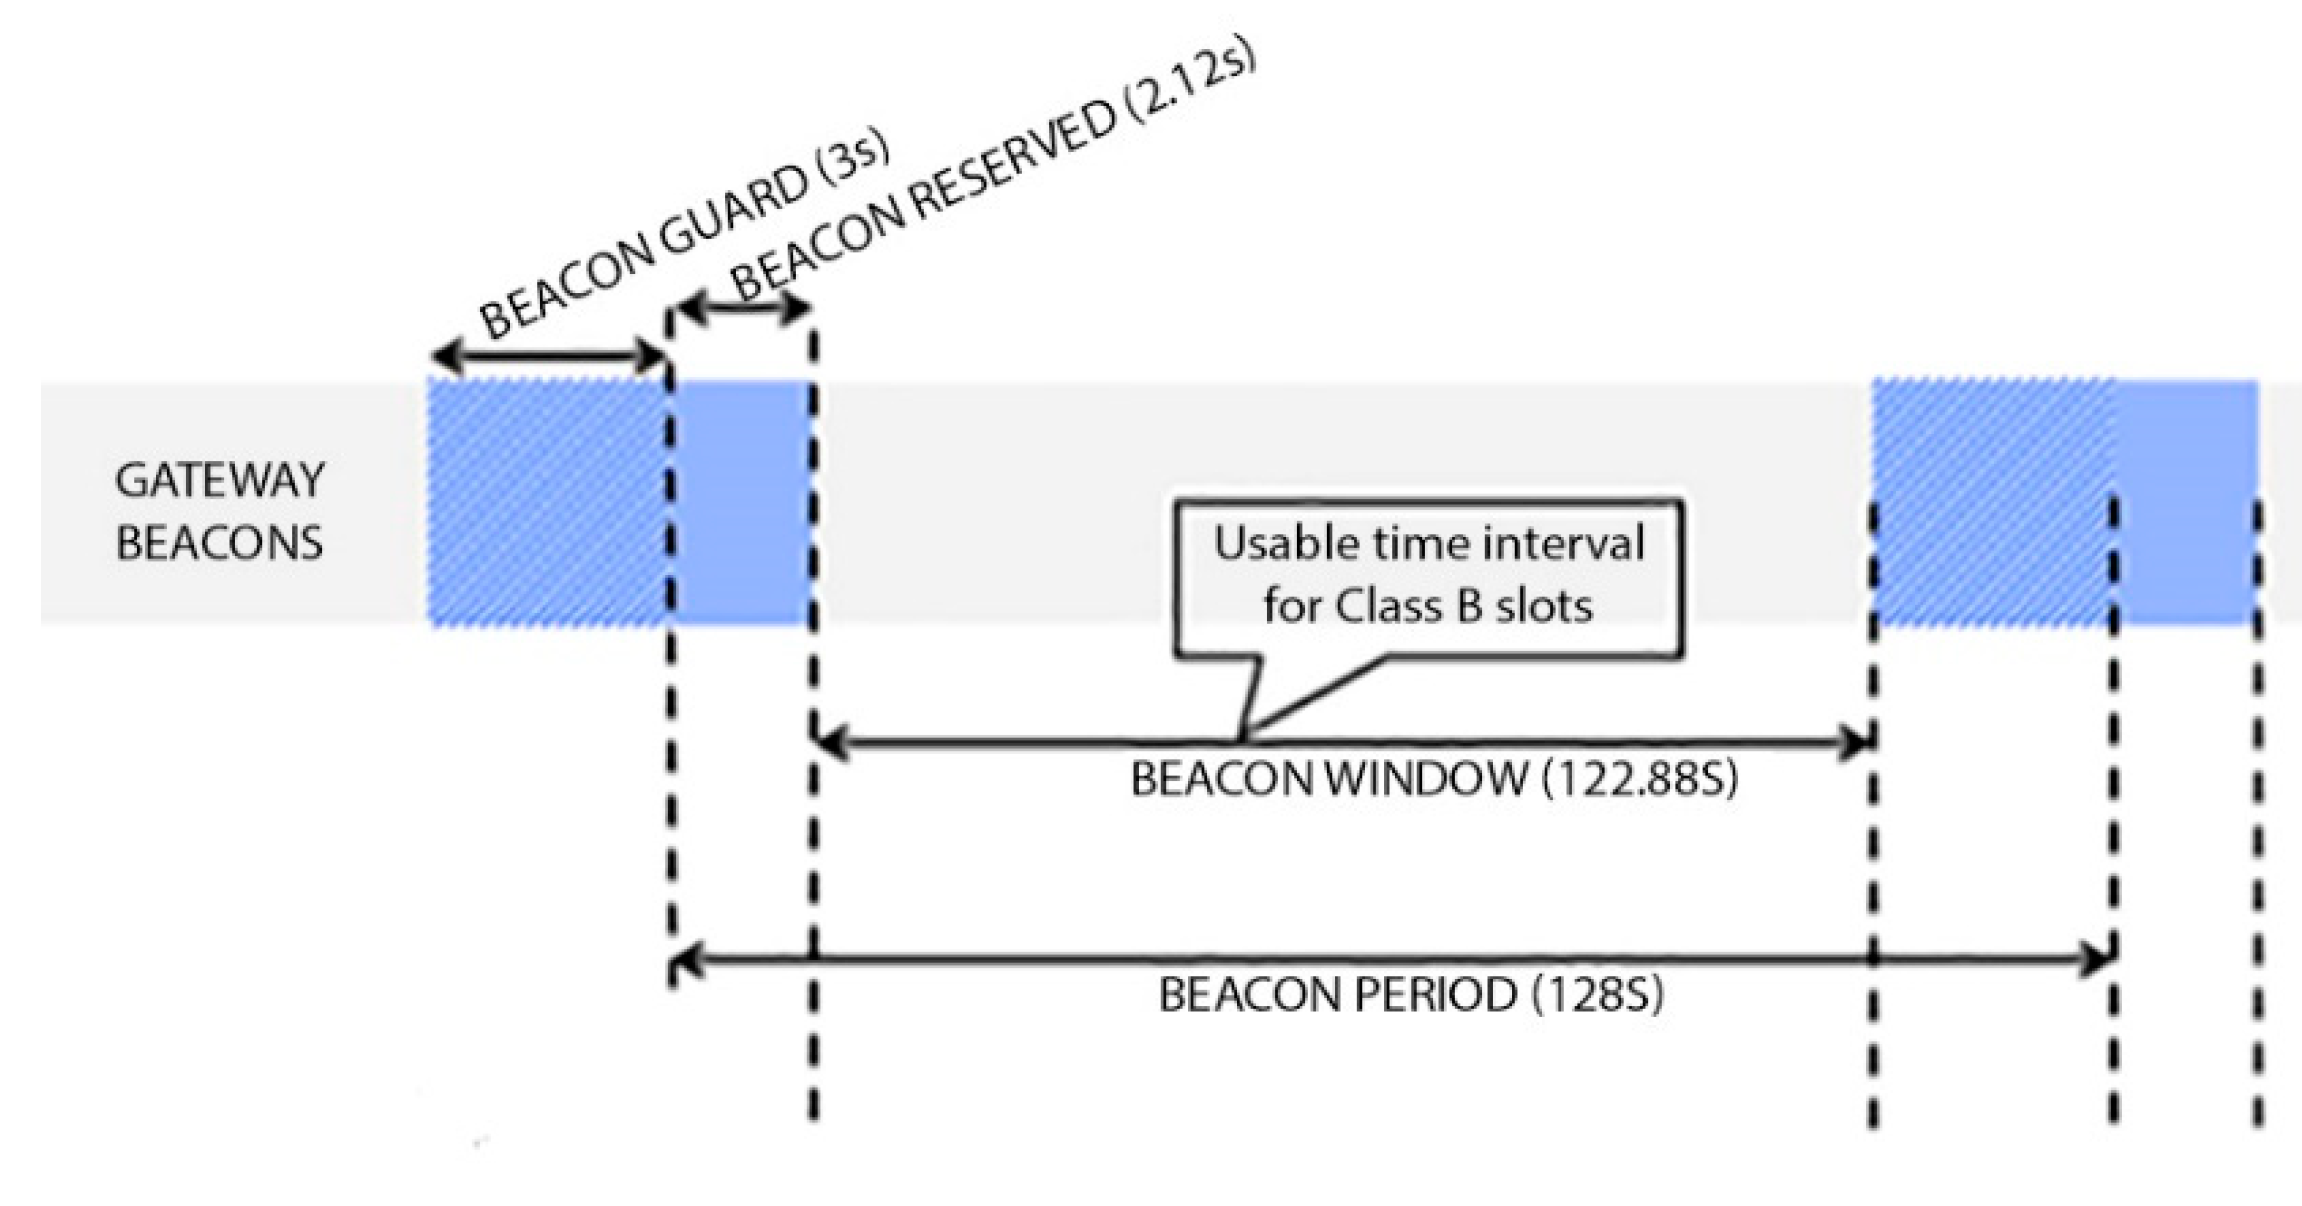
Class B is also bidirectional, but in this case, nodes can also receive in scheduled time slots. When operating in class B, nodes send upload messages following the class A mechanism, which means they can send data at any time (always respecting the duty cycle), but they do not need to enable the RX windows, as the gateway will establish a schedule reserving slots for all class B nodes in the network. Other temporal parameters can be seen in
Figure 4.
For this mechanism to work, it requires every node to be synchronized with the gateway. This is achieved by using periodic beacons broadcasted by the gateway every 128 s. The time window between beacons is then divided into slots that can be assigned to nodes to enable downlink messages without the need for previous upload packets. Finally, class C allows bidirectional communication while respecting the duty cycle, at the cost of consuming more energy because it is always active.
Regarding architecture, LoRaWAN networks have a star topology which makes more sense when trying to preserve battery life by obtaining greater connectivity at long range. However, for a long-range star network to be possible, the gateway must have the ability to connect a large number of nodes.
The nodes are asynchronous and communicate with gateways when they have any data to send, either on a scheduled basis or by events. This type of protocol is similar to the Aloha method. Depending on the class used, the battery consumption can be affected since the nodes have to wake up to synchronize, and this synchronization is the main cause of the decrease in battery life.
LoRaWAN guarantees a data rate from 0.3 kbps up to 50 kbps, acceptable for sending data in real time on IoT and machine-to-machine (M2M) applications.
On the other hand, at low speed, lower battery consumption is guaranteed, which allows the device batteries to last longer.
Another matter to keep in mind when sending and receiving messages is the duty cycle, which is the percentage of time a device uses or occupies the channel. Depending on the application and the frequency, it is limited between 0.1% and 10%, as can be seen in
Table 2. In this case, it is 1% as it is in the 868 MHz band [
6], corresponding to band G1. This choice allows end devices to use eight different channels to improve resiliency to noise.
2.3. Adaptive Data Rate (ADR)
LoRaWAN specification features the adaptive data rate (ADR), which is a mechanism that allows saving resources while improving communications with lower quality. This mechanism optimizes airtime and energy consumption in end devices. On the other hand, the end devices are the ones that decide whether or not to activate this mechanism [
7]. Changing the data rate (DR) directly impacts the SF used by the device: as one increases the other decreases, as can be seen in
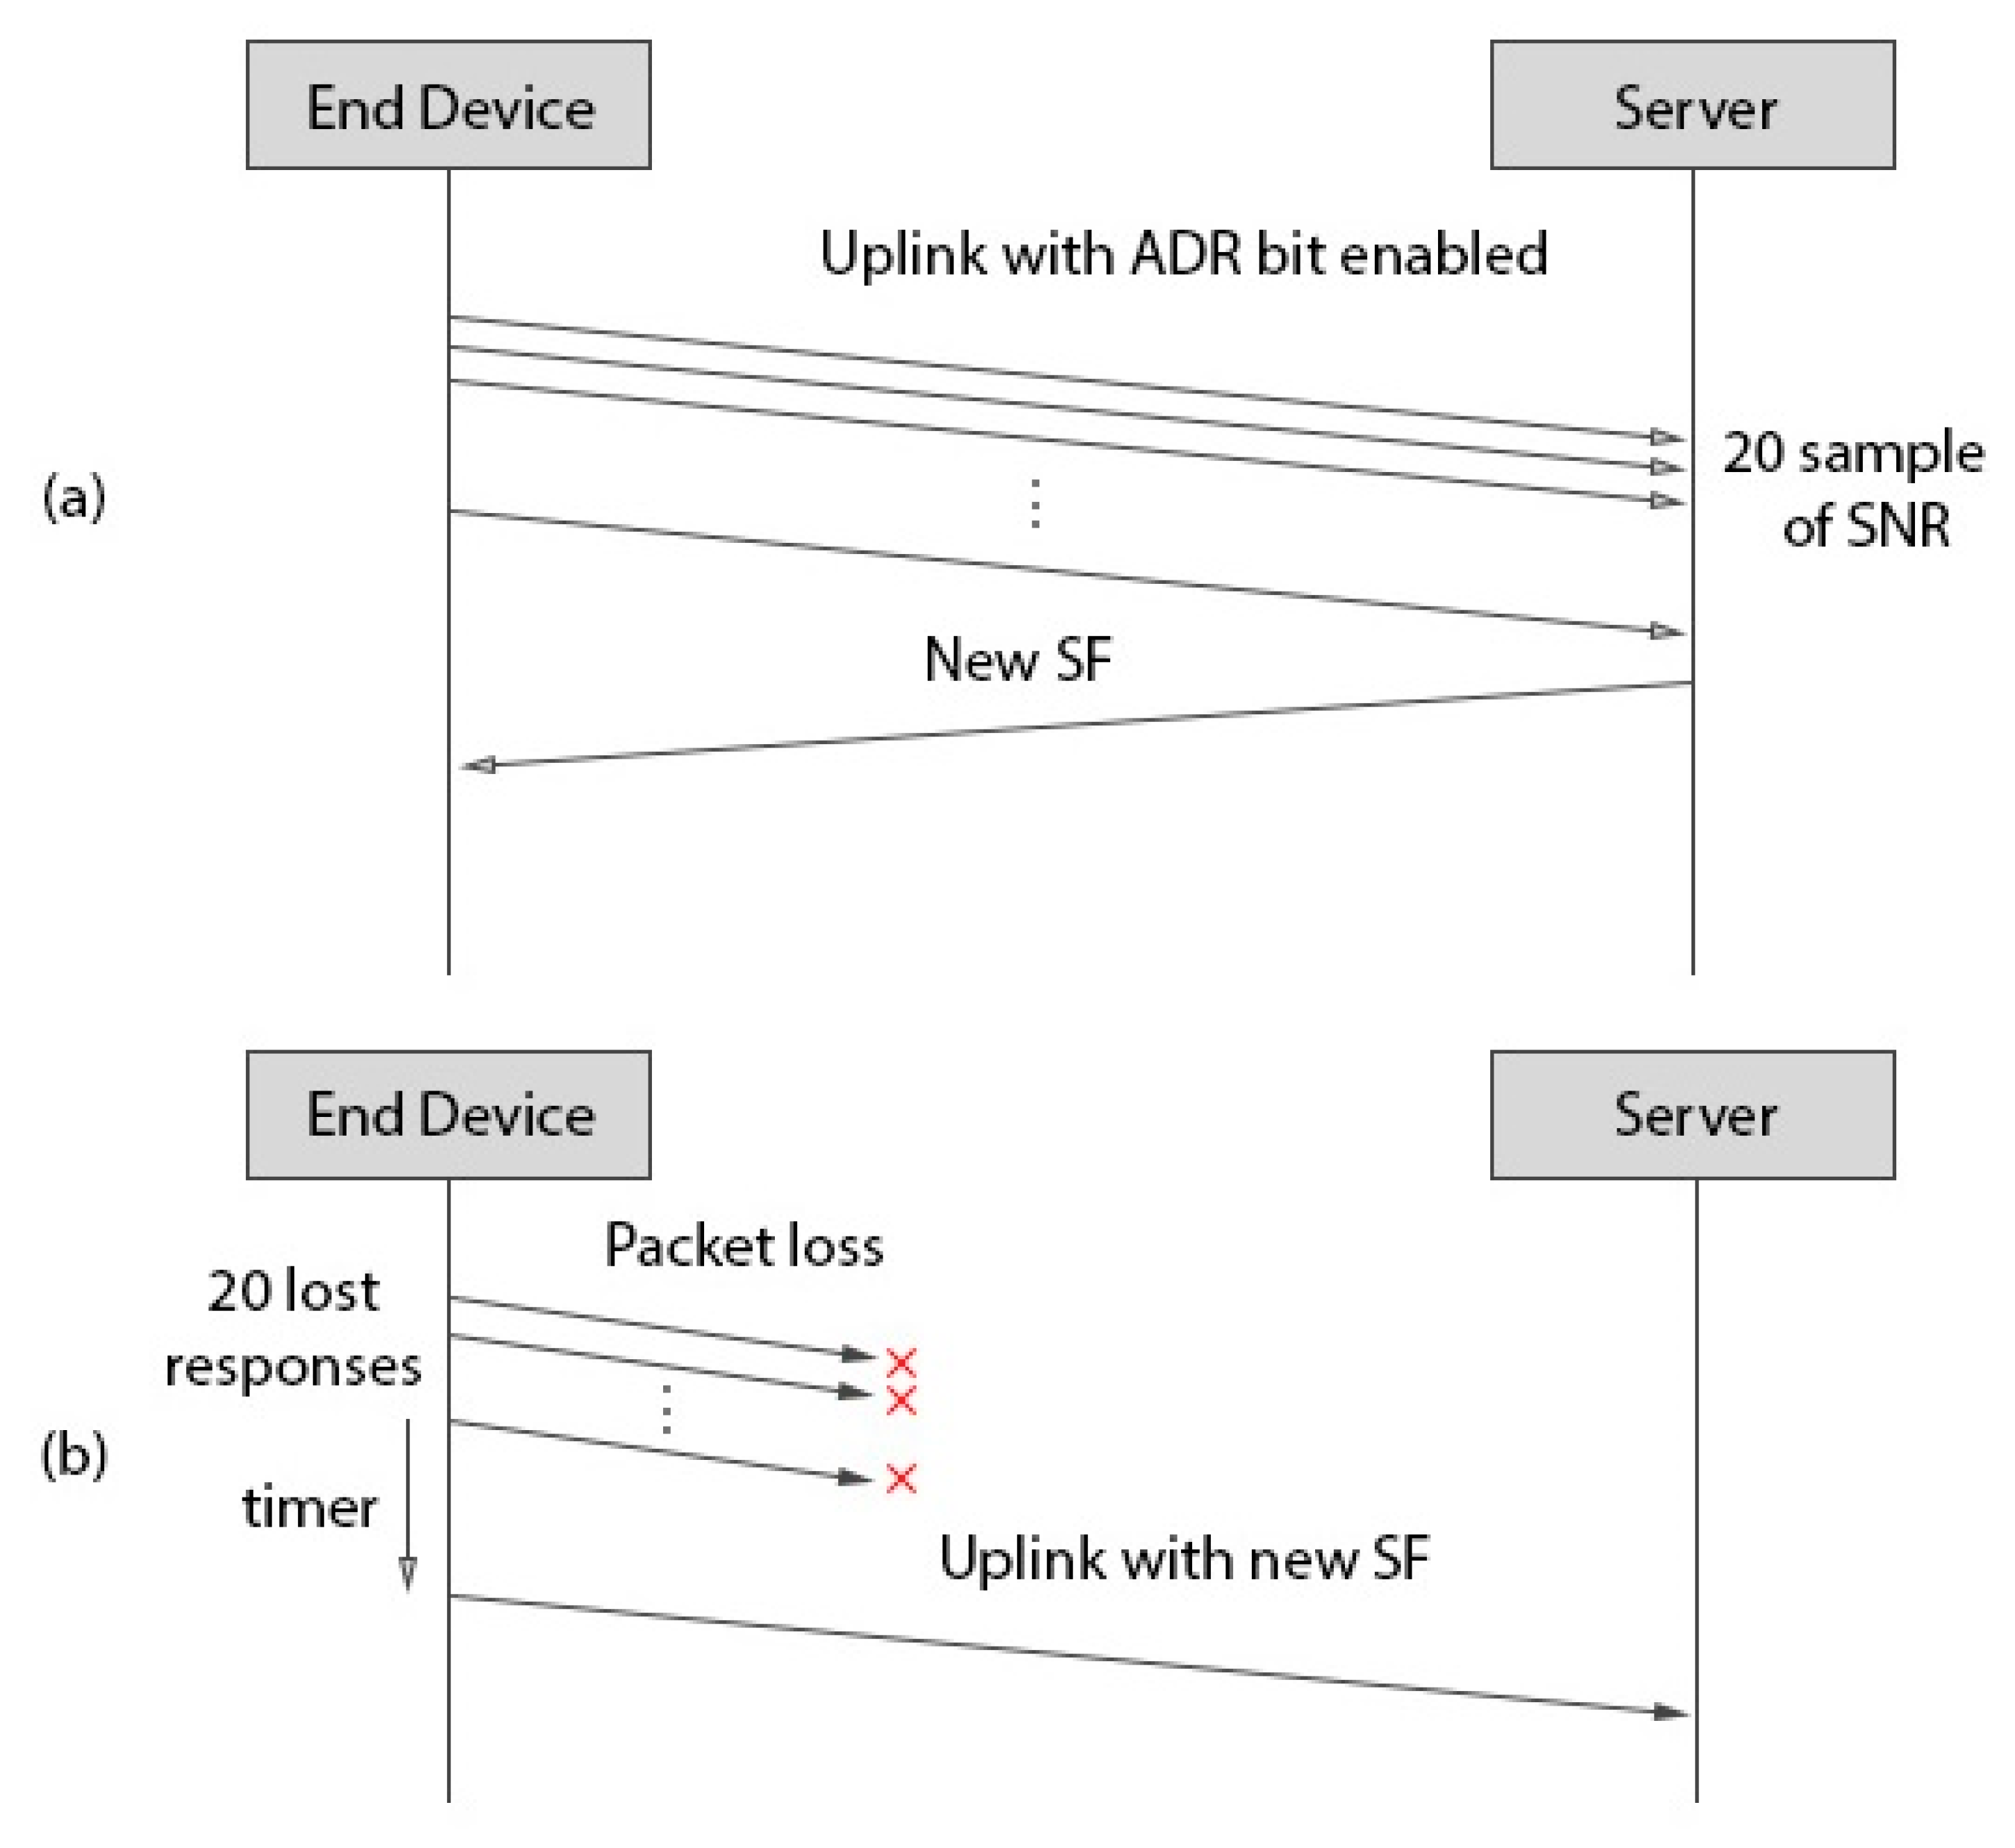
Table 3. If the final device decides to activate the ADR, the mechanism works as follows:
The SF is decreased as follows (
Figure 5a):
- ⚬
The device sets the ADR bit in an upload message.
- ⚬
The server stores the last 20 upload messages from the device that has requested the ADR. After 20 messages have arrived, the maximum Signal to Noise Ratio (SNRmax) of the 20 messages is calculated.
- ⚬
With the calculated value, the gateway decides whether to increase the SF or maintain it, with the Equations (1) and (2) below. The SF is increased one step at a time.
where
and
requiredSNR is taken from
Table 3.
- ⚬
When the new SF is determined, it is communicated to the end device in a download packet.
- ⚬
When the end device receives the new SF, it sends upload messages with the new configuration. In the case that the network condition keeps improving, the server will send a download message with the new SFs.
The SF is increased as follows (
Figure 5b):
- ⚬
An end device with ADR activated also continues to analyze download traffic to detect packet losses. With acknowledgements (ACKs) or downlink messages enabled, if the node does not receive the expected responses from the gateway, it also increments a counter up to 20.
- ⚬
Then the device activates a timer, which when expired forces the device to increase the SF to a more robust configuration.
- ⚬
If the device receives a response during the process, it resets the counter and timer and uses whichever SF the server has set up in the response.
3. Related Work
A review of the literature shows several related scenarios that have been previously studied. In [
8], results are shown for a simulation performed with LoRaWAN technology and class B devices. The devices were distributed within a radius of 6100 m. In this work, two simulations were performed, one with 1% and the other with 10% channel limitation, to study the downlink performance, but this work did not consider the impact of enabling ADR because DR was kept static during simulations.
In [
9], the mechanism of ADR was analyzed using simulations. The LoRaWANSim simulator was used to carry out a study of the ADR mechanism. The chosen duty cycle was 1% with a radius of 670 m. The results show the network behavior for a different number of nodes. This work did not analyze class B device operation.
In [
10], an indoor industrial scenario with LoRaWAN technology with class A devices was analyzed. In this case, the simulations were performed with the ns-3 simulator. Simulations were performed with a number of nodes ranging from 10 to 1000 within a radius of 200 m. The simulations were done with a constant SF, comparing those of SF7 and SF12, comparing the probability of success. Moreover, battery consumption was also compared with other technologies such as IEEE 802.15.4.
The authors of [
11] analyzed the possibility of optimizing performance by modifying the SF used, but instead of using the ADR mechanism, the gradient projection method was chosen. Simulations were performed for a number of nodes from 0 to 10,000 with the use of SF7, SF8, and SF9. In this case, the length of the packet was a consideration in optimizing performance.
A new simulator, LoRa-MAB, was analyzed in [
12]. The performance of LoRaWAN was evaluated with 100 nodes, with the possibility to select one of the six SFs available from 7 to 12. Nodes were distributed within a radius of 4.5 km. The duty cycle limitation was 1%. In this case, the algorithm used improved the performance of LoRaWAN in the values of successful packages and energy consumption. Conversely, the connection times were too long.
In [
13], the FADR algorithm with the LoRaSim simulator was presented. The simulations were performed for a number of nodes from 100 to 4000 within a radius of 100 to 3200 m. Said mechanism controlled the transmission power but could not completely eliminate all collisions.
In the different articles described, some works do not consider ADR or class B operation at all, while other studies try to propose a solution for the adaptive data rate mechanism which does not follow the LoRaWAN standards. In this present work, an implementation of the ADR mechanism is carried out following the standard for a realistic industrial indoor setting.
4. Adaptative Data Rate Implementation
The proposal of this work is to enable the ADR mechanism for the previously mentioned deployment of LoRaWAN ns-3 modules provided by the authors of [
8], which is the only one found supporting class B devices in the network. Some assumptions have been made in order to simplify the deployment at this point. While the standard ADR mechanism includes increasing or decreasing the transmission power when no DR change can be made according to Equations (1) and (2), this deployment starts with devices configured to transmit at maximum power, which is 14 dB according to regulations for the band used.
This deployment assumes that no changes will be made to this parameter during operation.
Regarding the downlink messages, acknowledgments in the destined windows RX1 and RX2 as defined in class A devices are disabled, as all downlink traffic is to be done during the beacon window defined by class B device operation.
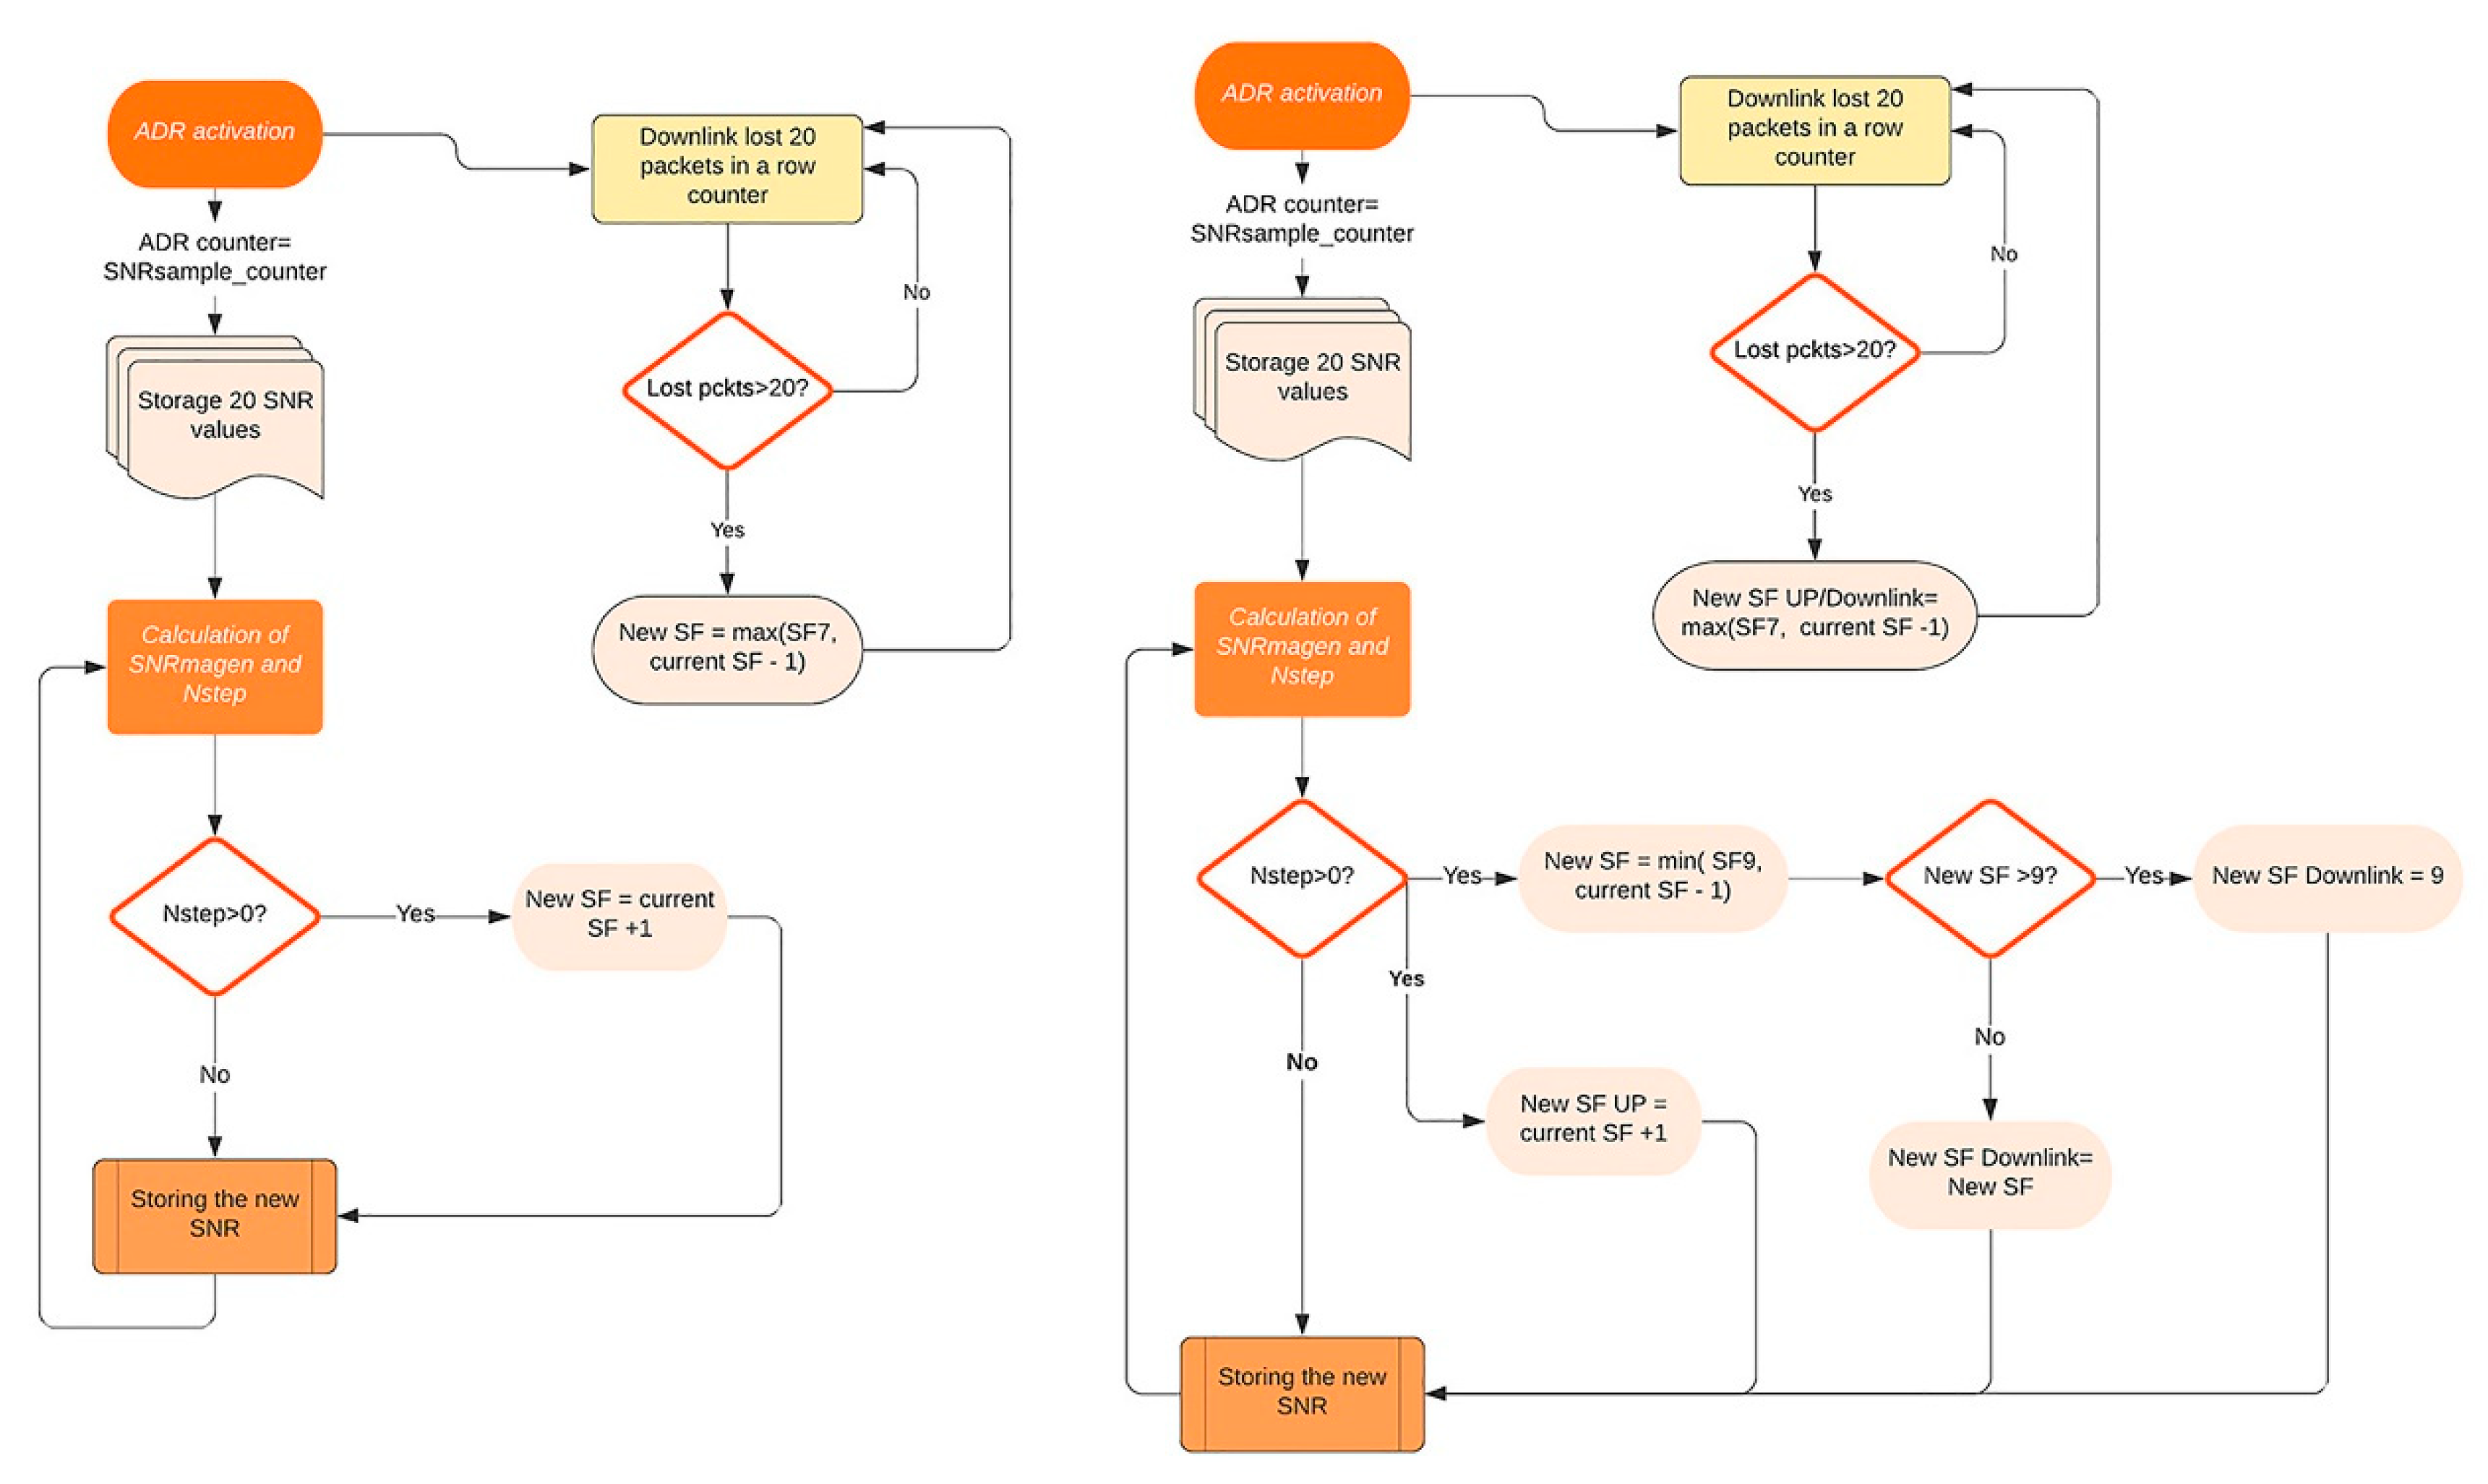
The ADR mechanism implemented establishes the number of message samples to calculate the maximum SNR as a variable that can be changed (SNR sample counter or
SNRsc), in order to test the implications of reducing this parameter, which affects the time it takes for a node to change its SF and therefore can have implications for the packet delivery ratio (PDR) and energy consumption. The typical value of
SNRsc in ADR implementations is 20 according to standard recommendations, which is why it has been used to illustrate
Figure 5 and
Figure 6.
The proposal of the ADR mechanism for downlink in class B devices addresses the energy optimization topic, which is always subject to improvements. The selection of class B is motivated by application requirements in some industrial scenarios, which require periodic and guaranteed downlink traffic, but this worsens the energy consumption with respect to class A devices, which can last longer by disregarding gateway- or application-initiated transmissions.
The implementation tested shows the possibility of enabling an ADR mechanism on the gateway side, which means following the same scheme as regular ADR, the gateway uses the SNR of received messages to check if the channel conditions allow for higher DR/lower SF. It assumes that the gateway informs the node of the new SF for downlink messages on the first next class B slot available and then changes the SF accordingly for subsequent messages. Therefore, if DR for downlink messages is optimized, the sleeping times of devices can be increased and thus battery life can be increased.
5. Scenario
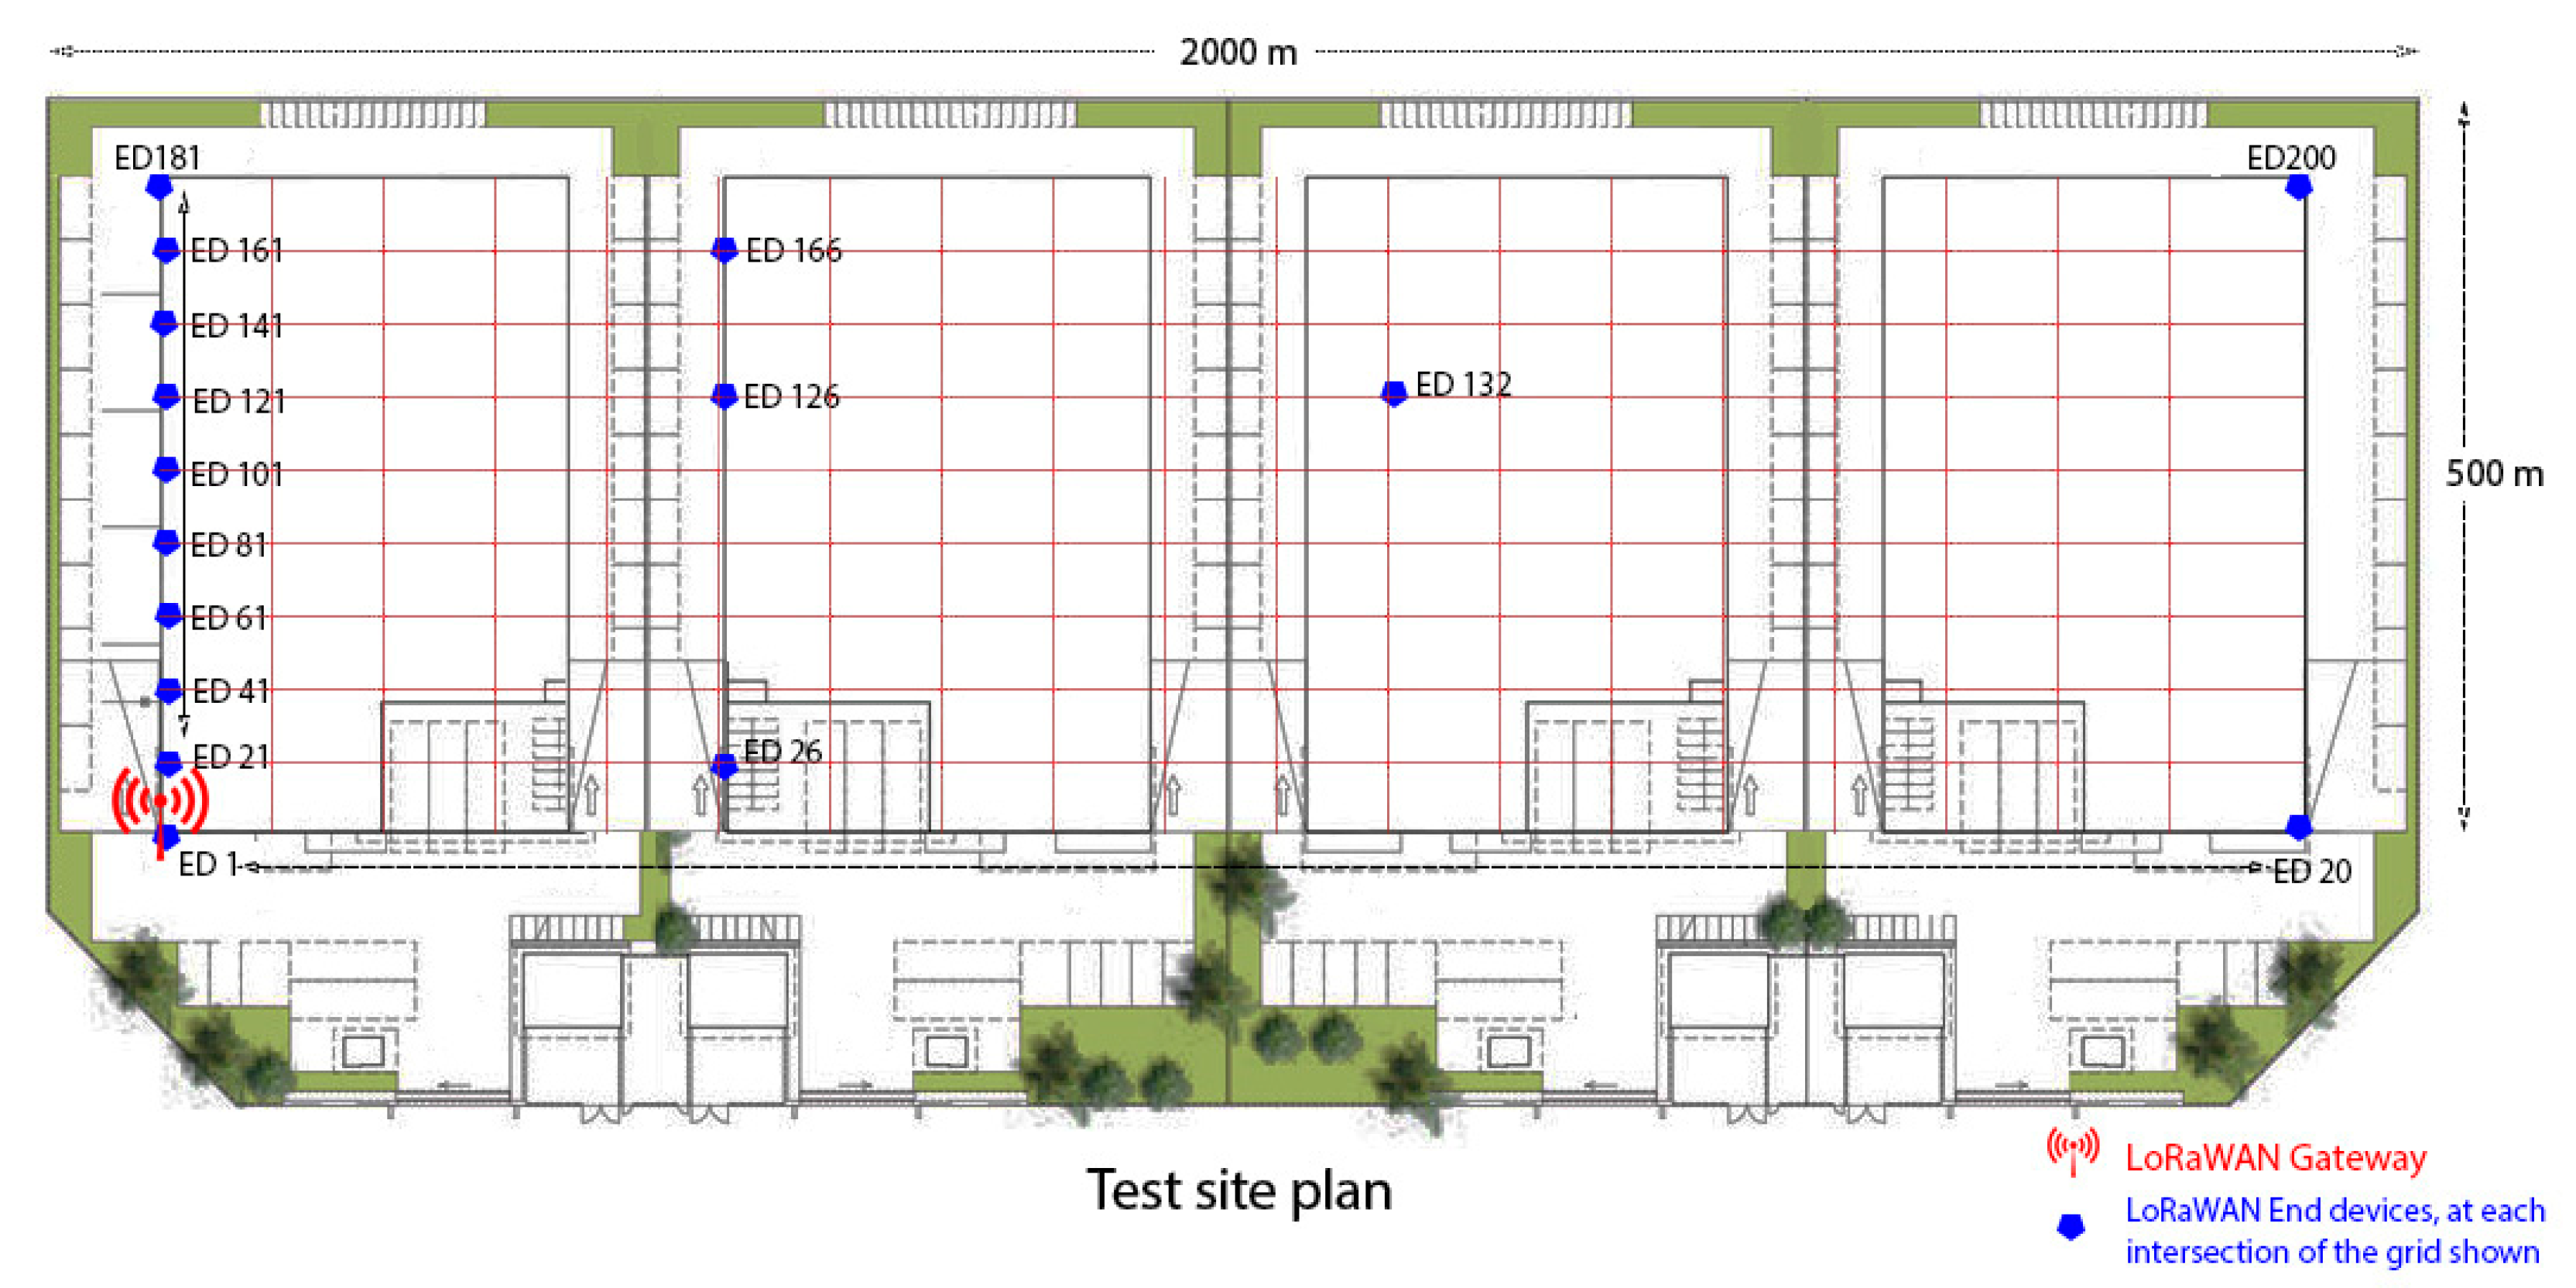
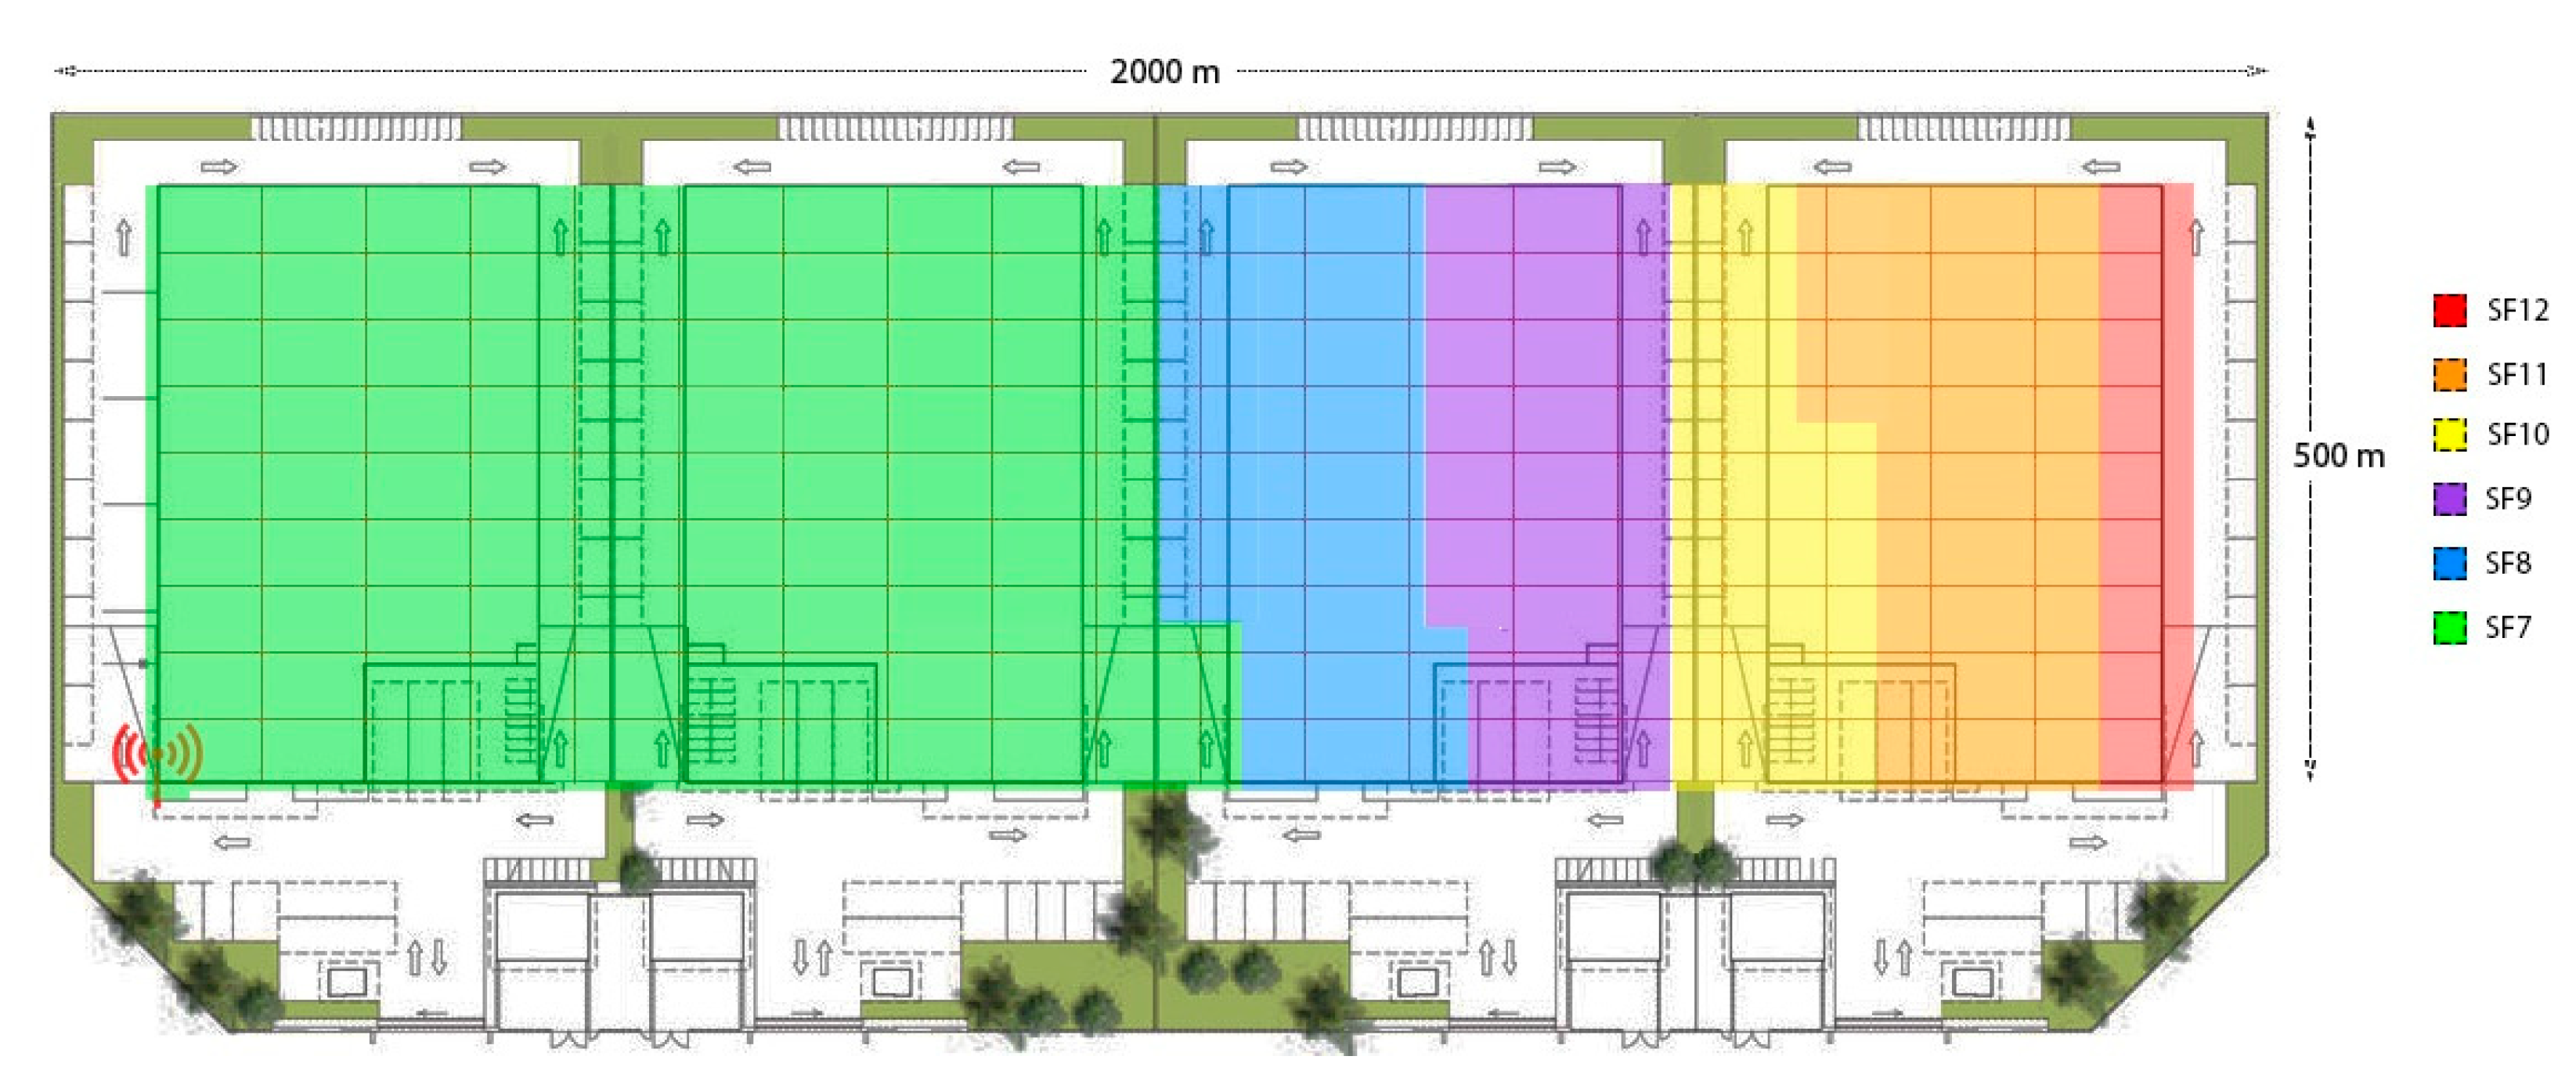
An objective of this work was to analyze the performance of LoRaWAN class B nodes in industrial scenarios. As such, simulations were carried out simulating the characteristics of an industrial plant. The dimensions of 2000 m × 500 m were chosen for the industrial plant. The height of the chosen plant was 10 m. This scenario was based on an automotive production plant that is used in related projects.
The definition of the scenario important for obtaining useful results. Therefore, this work aimed to select a realistic industrial scenario and application and simulate it in order to characterize the network before any real deployment is done.
Figure 7 shows the test site plan with the industrial plant divided into four large, connected warehouses, with each of the 200 nodes located at a unique grid intersection and the gateway in the bottom-left corner. This configuration allows simulation of indoor behavior, with internal and external walls, in a realistic scenario.
It was decided to distribute the 200 nodes throughout the plant uniformly in 100 m × 54 m squares, as seen in the grid. On the other hand, it was decided to place the gateway at the end (0,0), thus achieving a greater distance from the farthest node to obtain worse channel performance and observe the ADR mechanism impact in the change of SF.
The technology simulated was LoRaWAN, class B in particular. This class is the one that enables download traffic, without end devices starting the communication, and without the excess energy consumption which occurs in class C, but always respecting the duty cycle.
Regarding the chosen payload, the size was 21 bytes (13 bytes of LoRaWAN protocol + 8 bytes of data); in this way, a higher rate of successful reception of packets was made possible. The preamble length was 8 symbols by default as indicated in the standard. Depending on the SF, the final number of symbols varied. Once the sizes of the packages were chosen, with the Equations (3)–(7), as defined in the LoRa modem design guides from Semtech [
14], the calculation of LoRaWAN message airtime proceeded as follows:
where SF is spreading factor, PL is number of bytes of the payload, H is insertion of the optional header in the frame, DE is use of the optimized rate, and CR is code rate.
Firstly, to determine the time on air, it is necessary to define the symbol time (6). This is the time it takes to send chirps at the chirp rate. On the other hand, another time to consider is the preamble time (3), where npreamble is the number of symbols in the preamble. It is also necessary to consider the number of symbols that make up the header and the payload of the package, which is calculated with Equation (4). Once the payload time (5) has been defined, the calculation can be made for the time on air (7), which is the sum of times of the payload and preamble.
With this, in the best case with an SF = 7, the airtime is 56.58 ms and the duty cycle allows sending a message every 6 s. In the worst case, with an SF = 12, the airtime is 1482.75 ms and the duty cycle allows sending a message every 2 min 28 s. Therefore, any message rate above that value, such as the selected rate of one message each 300 s, is ensured to comply with the duty cycle regulations. The parameters chosen for the simulations are shown in
Table 4.
An important part of simulating a wireless network scenario is to model the channel and interference to be as close as possible to the real environment. The channel model selected for this work is the “
HybridBuildingsPropagationLossModel” [
15] available for the ns-3 simulator, which integrates different path loss models, such as Okumura–Hata model, COST231, or ITU-R P.1238 (indoor communications), together to adapt to indoor-to-outdoor and different types of indoor scenarios. To do this, firstly, the Building function was used. The details concerning the configuration of this model can be seen in
Table 5.
This class allowed us to implement a propagation loss model in indoor spaces.
The formula for losses is:
In this case, when choosing office type, the power loss coefficient N is 30 dB, and
where n is the number of plants, f is the frequency (MHz), and d is the distance (m).
These configurations were applied in the simulator files to analyze the performance of the network in different cases, which are presented in the following results section.
6. Results
The network was simulated for the following cases:
- -
No ADR with fixed SF;
- -
R implementation class A only;
- -
ADR implementation for downlink with class B end devices.
Firstly, the correct behavior of the ADR mechanism implemented was tested by checking the changes in SF according to SNR, ED positions, and time. Fixing an upload periodicity of one packet every 1800 s, the ADR mechanism was configured with different counter limits to perform the maximum SNR calculation. This was studied in order to check the time intervals and delays in SF change and later assess the impact on PDR and power consumption.
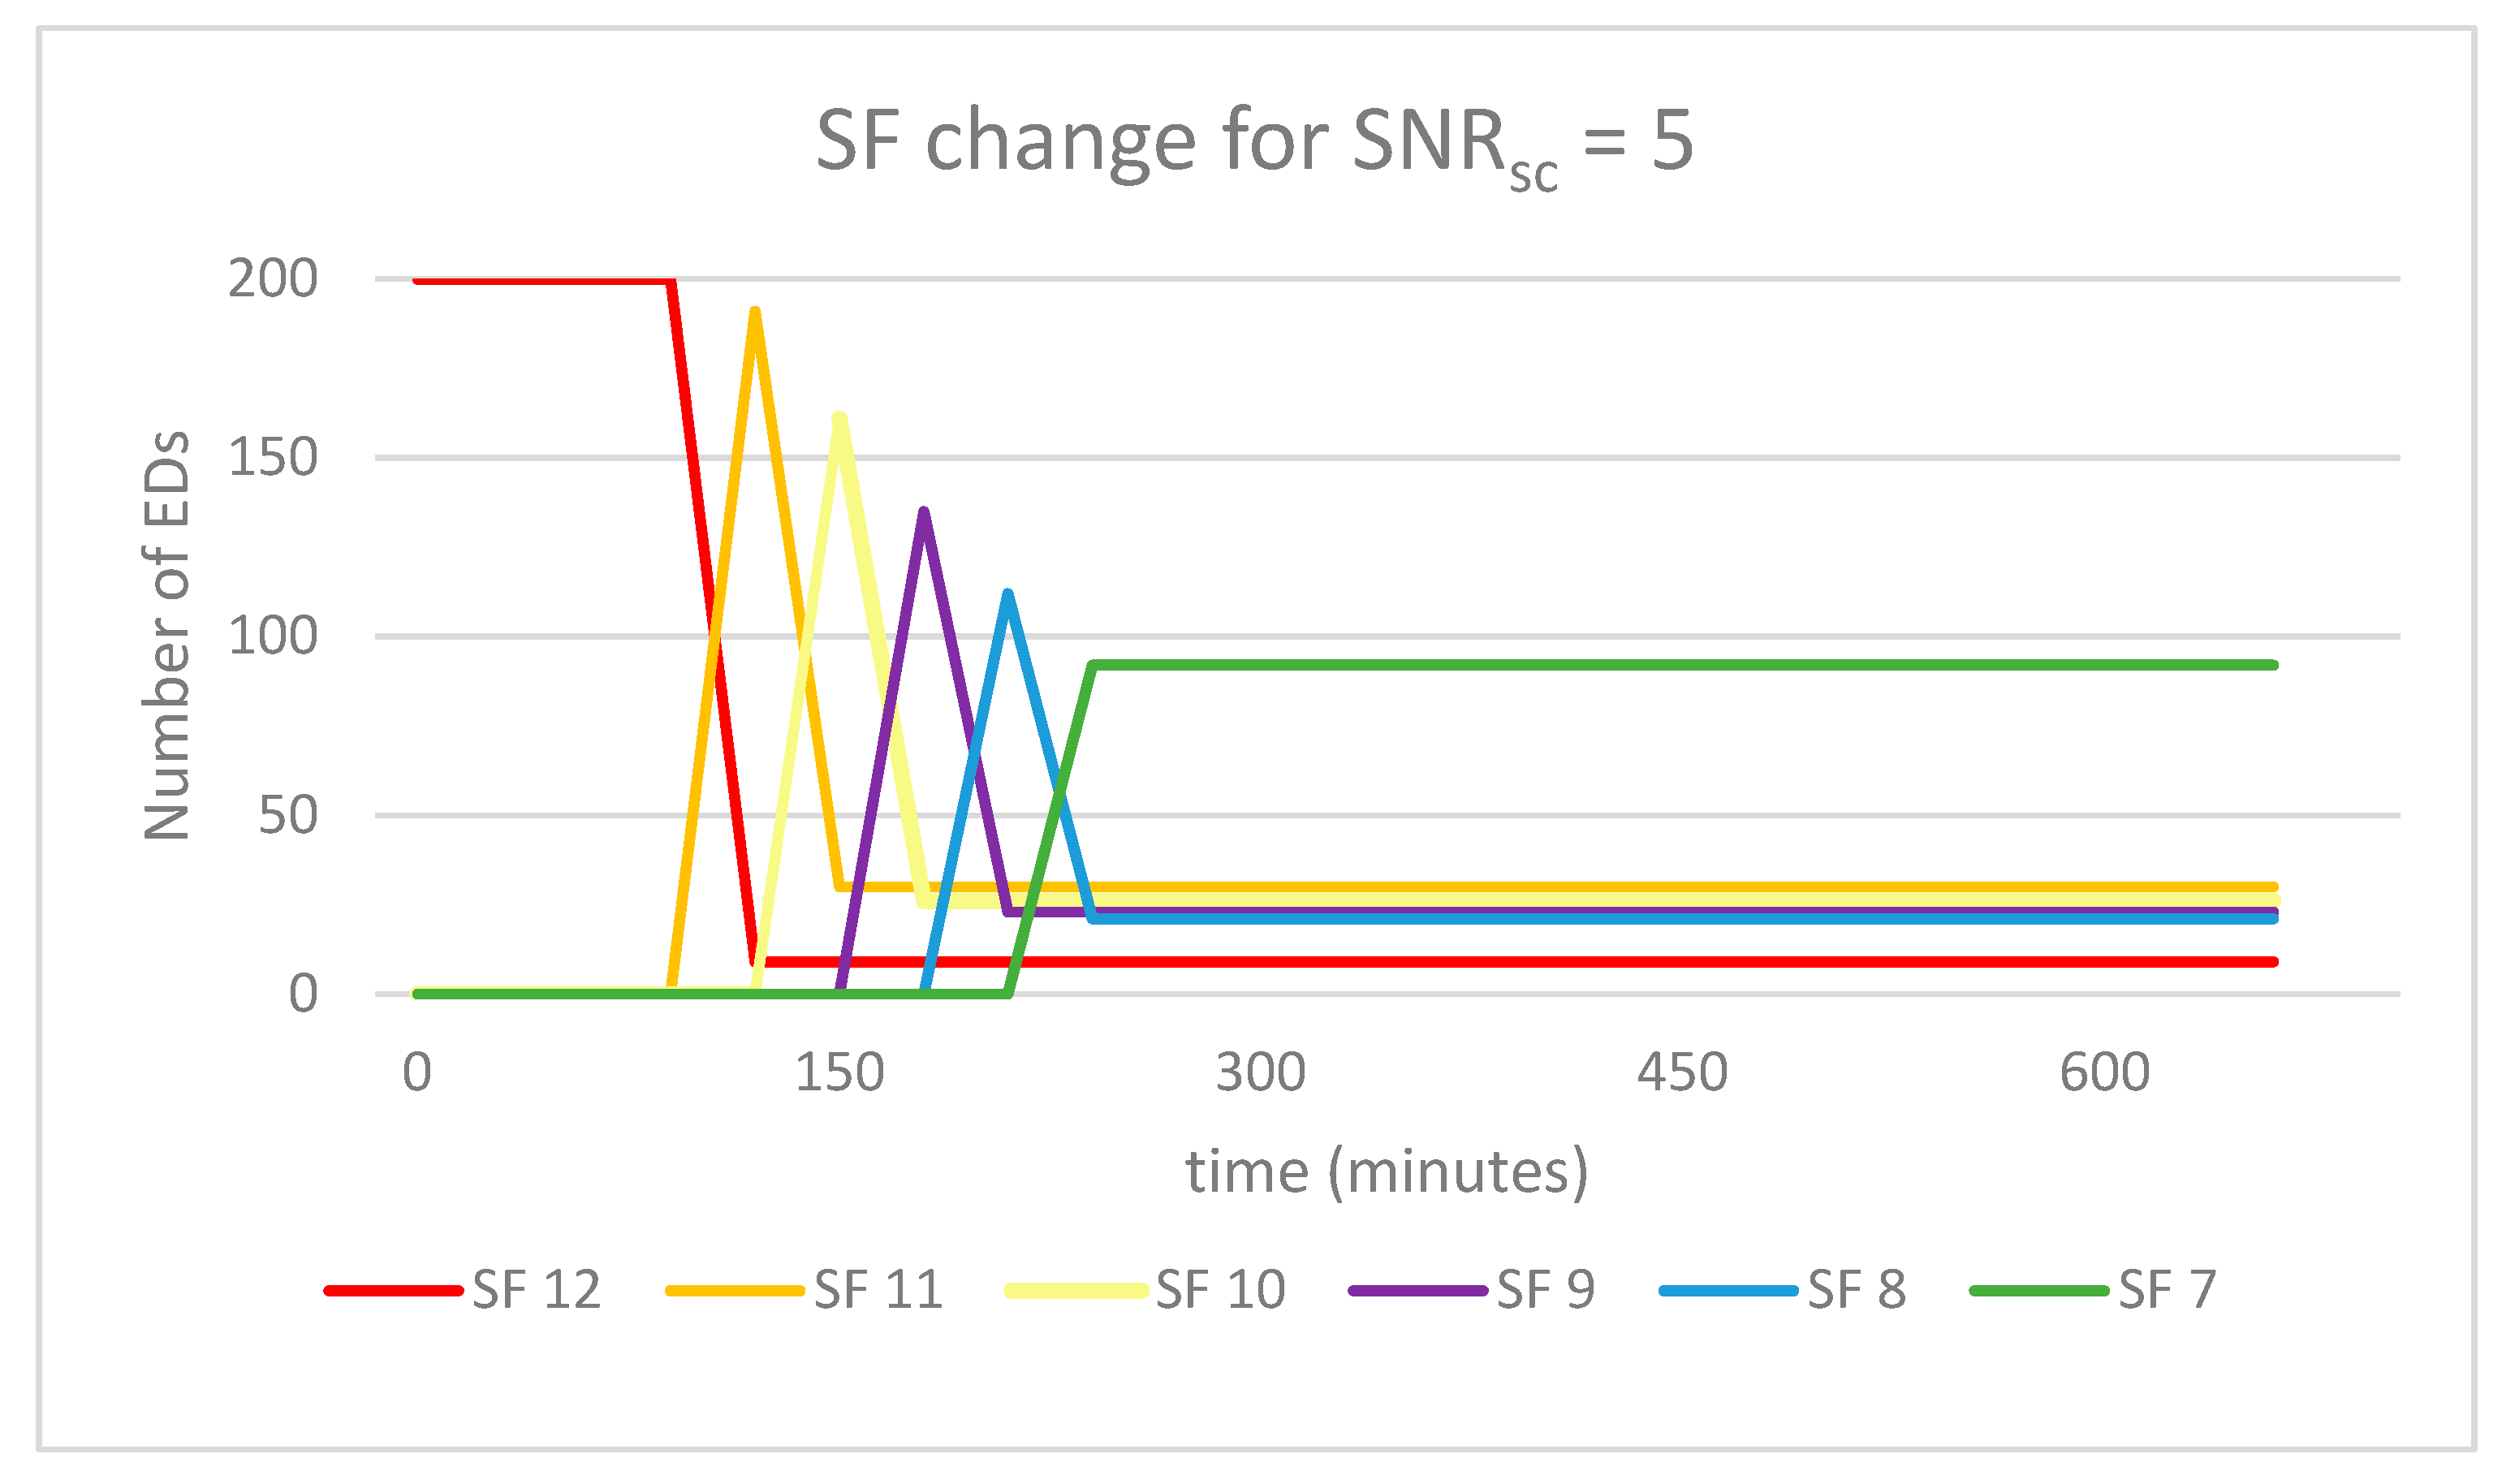
Figure 8 shows the evolution of the number of EDs that reach each SF during simulations for a SNR
sc of 5, reaching SF7 in 270 min, while
Table 6 shows the resulting values for all configurations. The representation of the SF evolution for the other configurations follows the same shape, but with longer time intervals (for the same upload periodicity and SNR
sc configured as 20, SF7 is reached in 720 min).
The results show that further end devices were never able to perform any data rate change, while nearer devices were able to reach SF7. This behavior can be seen clearly in
Figure 9 for the uplink.
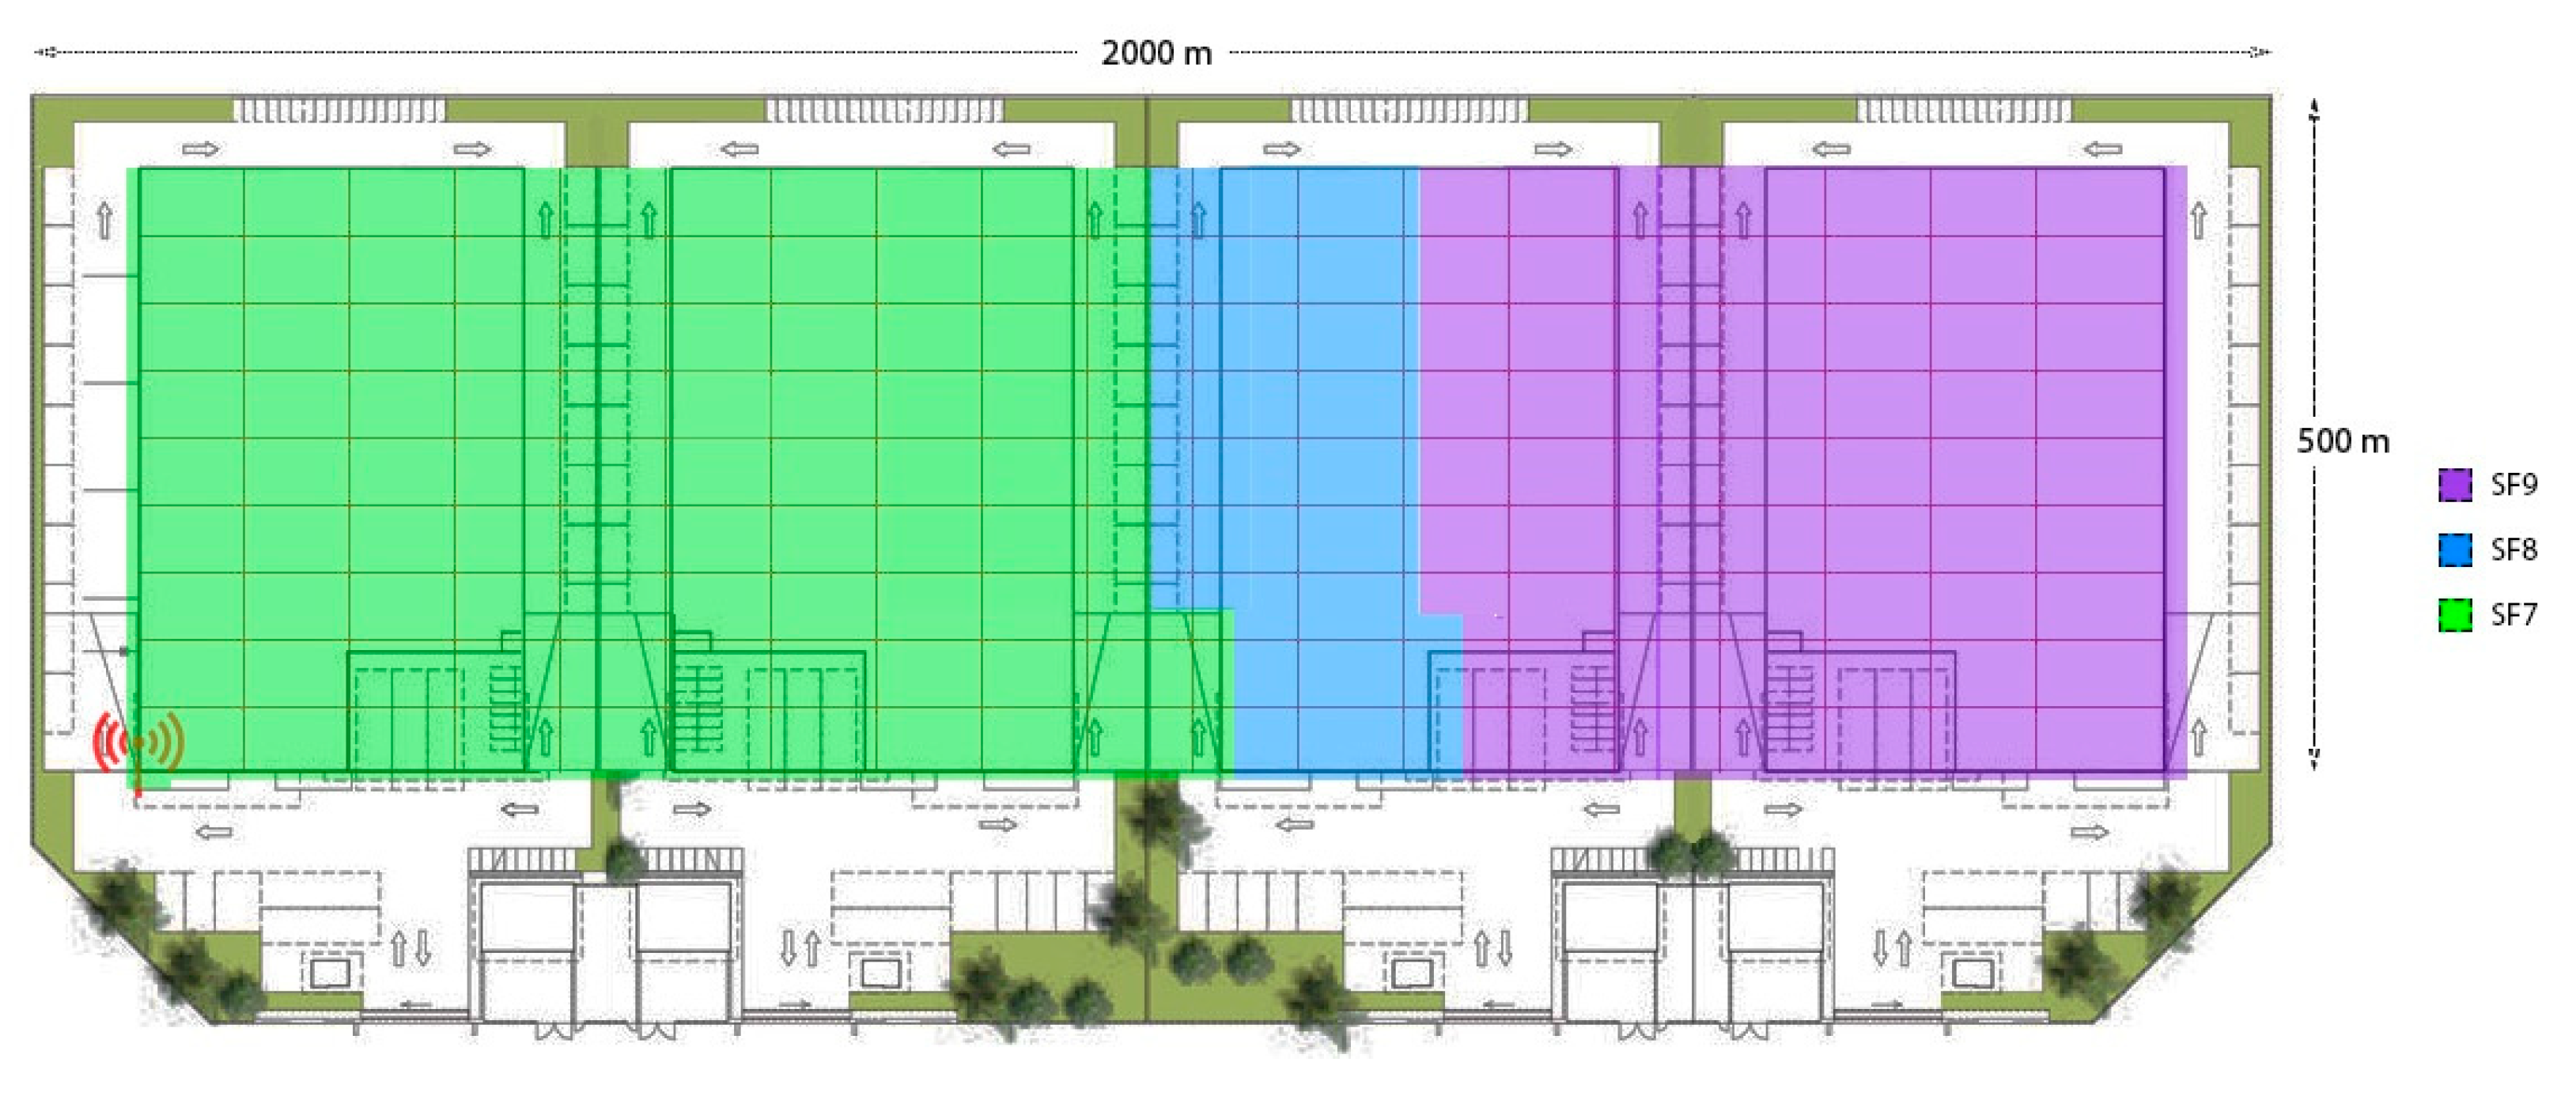
Regarding the resulting map for the proposal of using ADR in the downlink stage,
Figure 10 shows that more than one-half of the EDs were able to operate in SF7 and SF8, instead of those predefined by the standard’s recommendation of SF9.
Under the same scenario, the results with and without ADR enabled were compared in order to check the impact on several metrics, such as PDR and energy consumption.
The PDR achieved for the SNR sample counter simulated shows that reducing the number of samples needed for the ADR mechanism to start changing the SF in EDs did not impact the PDR in this scenario. This allows assuming that in the conditions studied, it is better to react faster and adapt to the channel conditions so EDs reach the optimal SF more rapidly. Nevertheless, there was an increase in PDR when sending fewer messages (as in upload periodicity = 1800 s), which could be seen in all configurations. These better PDR results for higher upload periodicity were expected as LoRaWAN MAC protocol is similar to pure Aloha in terms of scalability performance, meaning that the performance degrades when the load on the link increases.
On the other hand, configuring the network with the lower SF without any ADR mechanism achieved overall similar results, with a difference of less than 0.5% between SF7 and ADR. Nevertheless, there were areas where using the ADR showed the advantage of using different SFs to avoid collisions. This is reflected in
Table 6, as the statistics for the simulation without ADR enabled were calculated for the nearest warehouse, which is the more critical area. This is due to the fact that devices nearer to the gateway suffered more interference as there were more packets from other devices using the channel. With a fixed SF, all nodes may interfere with one another, while enabling the ADR means nodes in different regions do not interfere, as the gateway can recover packets independently from all the SFs. This translated into a difference of 1.5 to 1.8% in PDR between fixed SF7 and ADR (depending on upload periodicity). For fixed SF12, the results were worse in all configurations, as it combined all EDs interfering in the same SF with the longer time-on-air values, making collisions more probable.
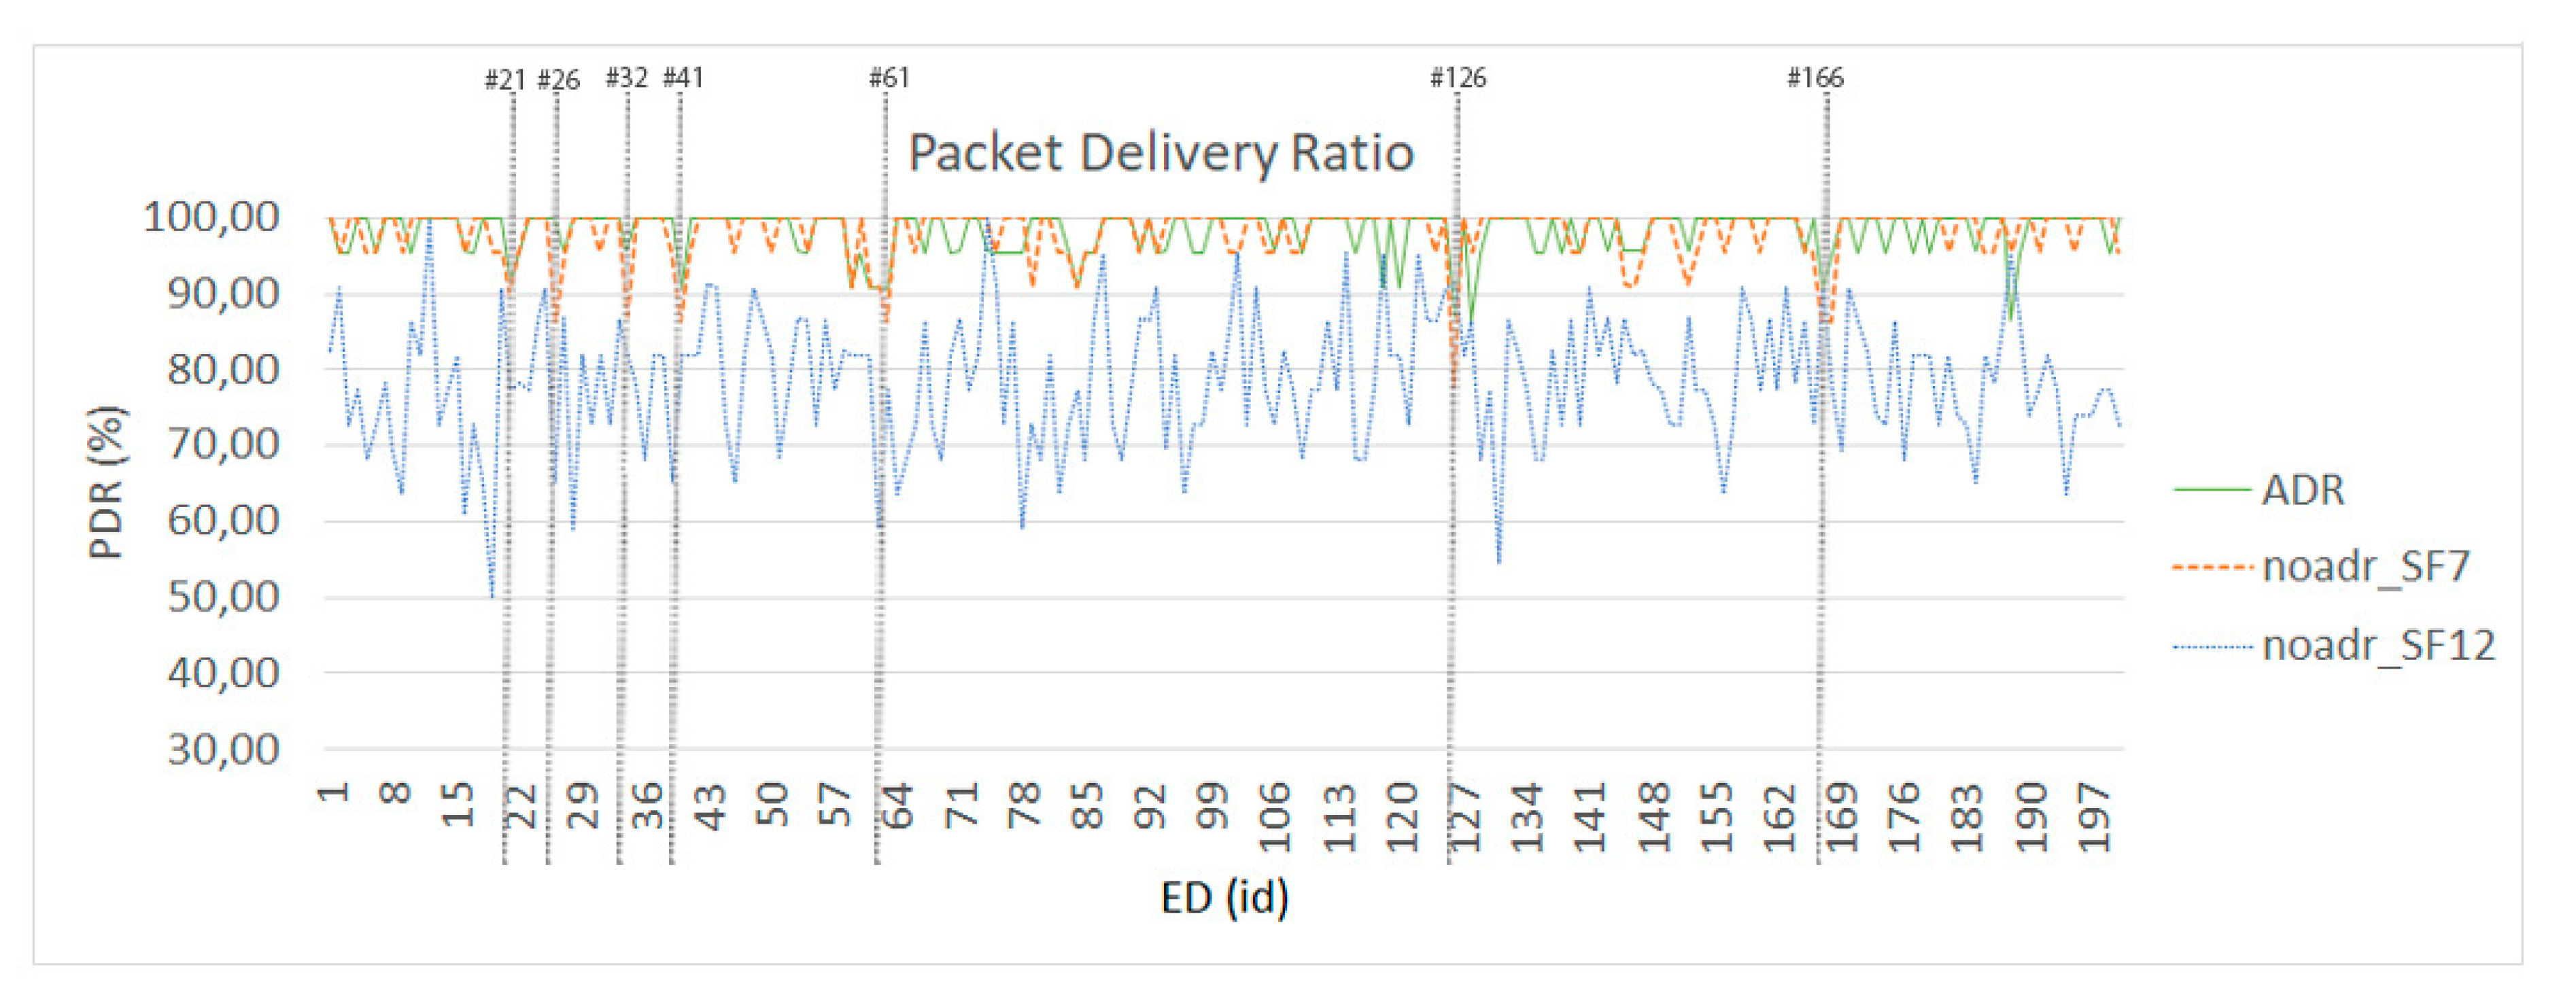
In
Figure 11, the PDR for every ED in the scenario can be seen, and it is clear that devices in the first warehouse, as well as the ones near the walls in the rest of the scenario, show the worst PDR values. This is due to the combination of walls, as well as the distance between nodes on the vertical axis being one-half the distance between nodes on the horizontal axis.
From the point of view of downlink traffic, using the ADR mechanism described did not impact the PDR, as EDs achieved more than 99% of successful receptions, but this was mainly due to the use of class B operation mode, where devices have an assigned and scheduled time slot, so the success probability was already maximized; thus, this mechanism may only be interesting from the energy consumption point of view in this scenario. Nevertheless, even noisier or variable scenarios may take advantage of adapting the SF up and down to palliate losses and optimize PDR.
While these results may tempt one to disregard using ADR, it must be taken into account that the difference between using it and not using it increases with the distance between ED and the gateway; thus, for different scenarios with different conditions, the choice should be supported by further simulations, given that the ADR mechanism has been validated to work as expected.
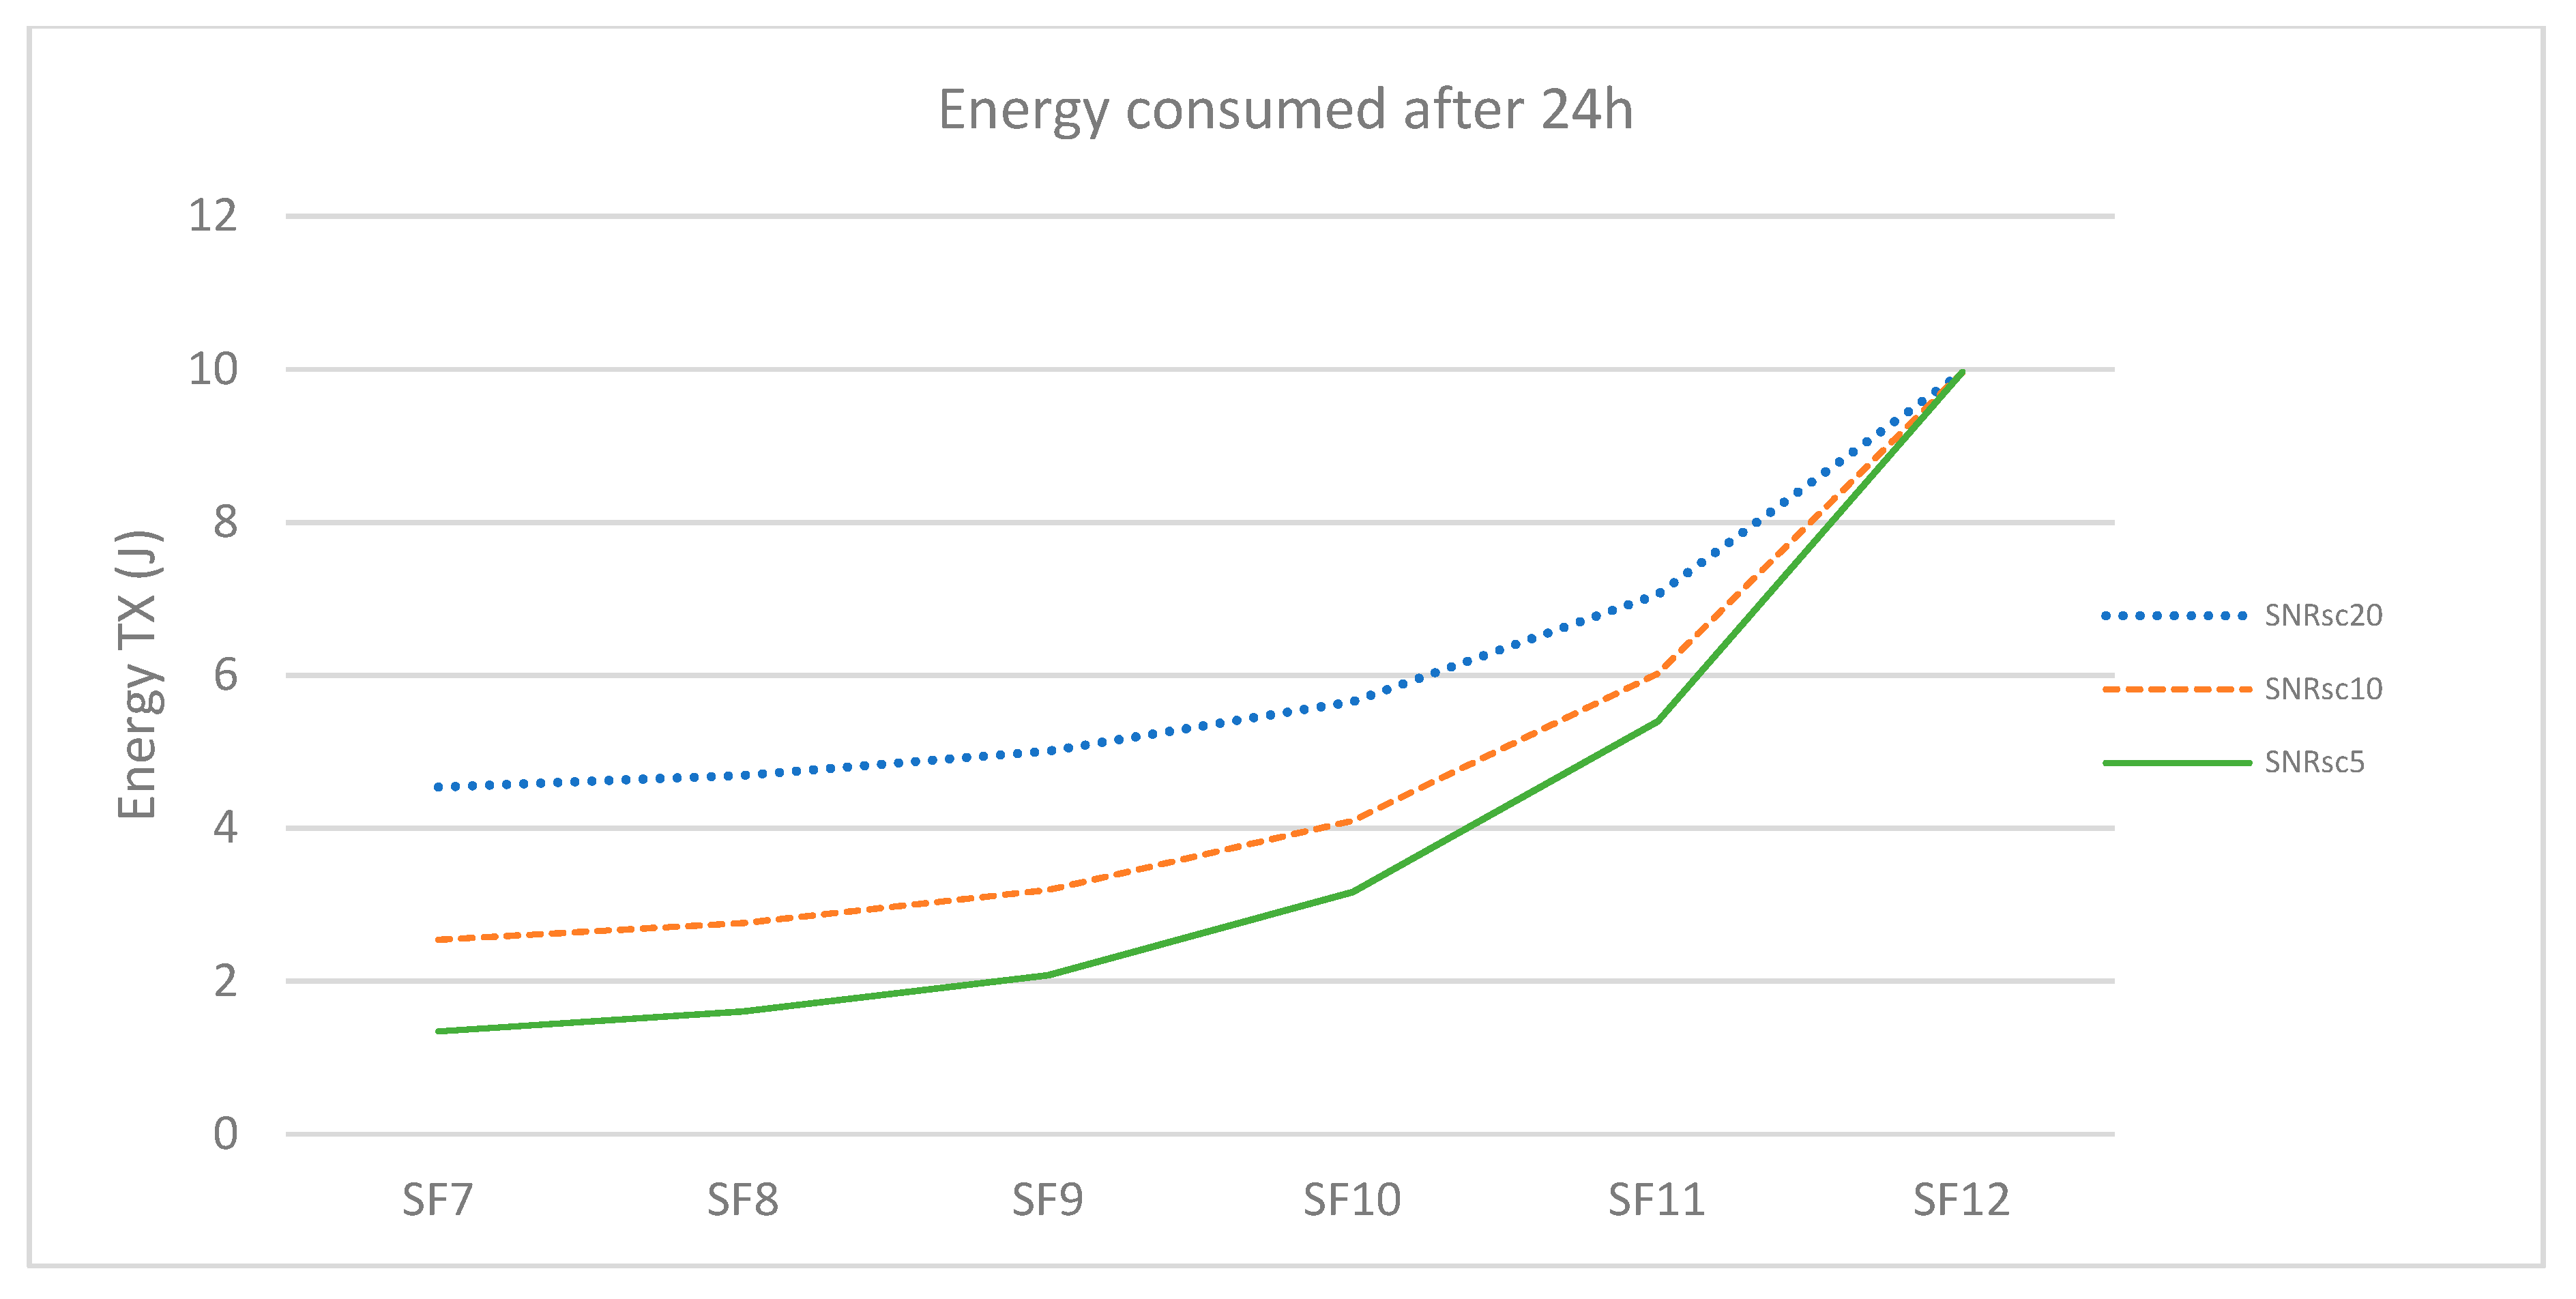
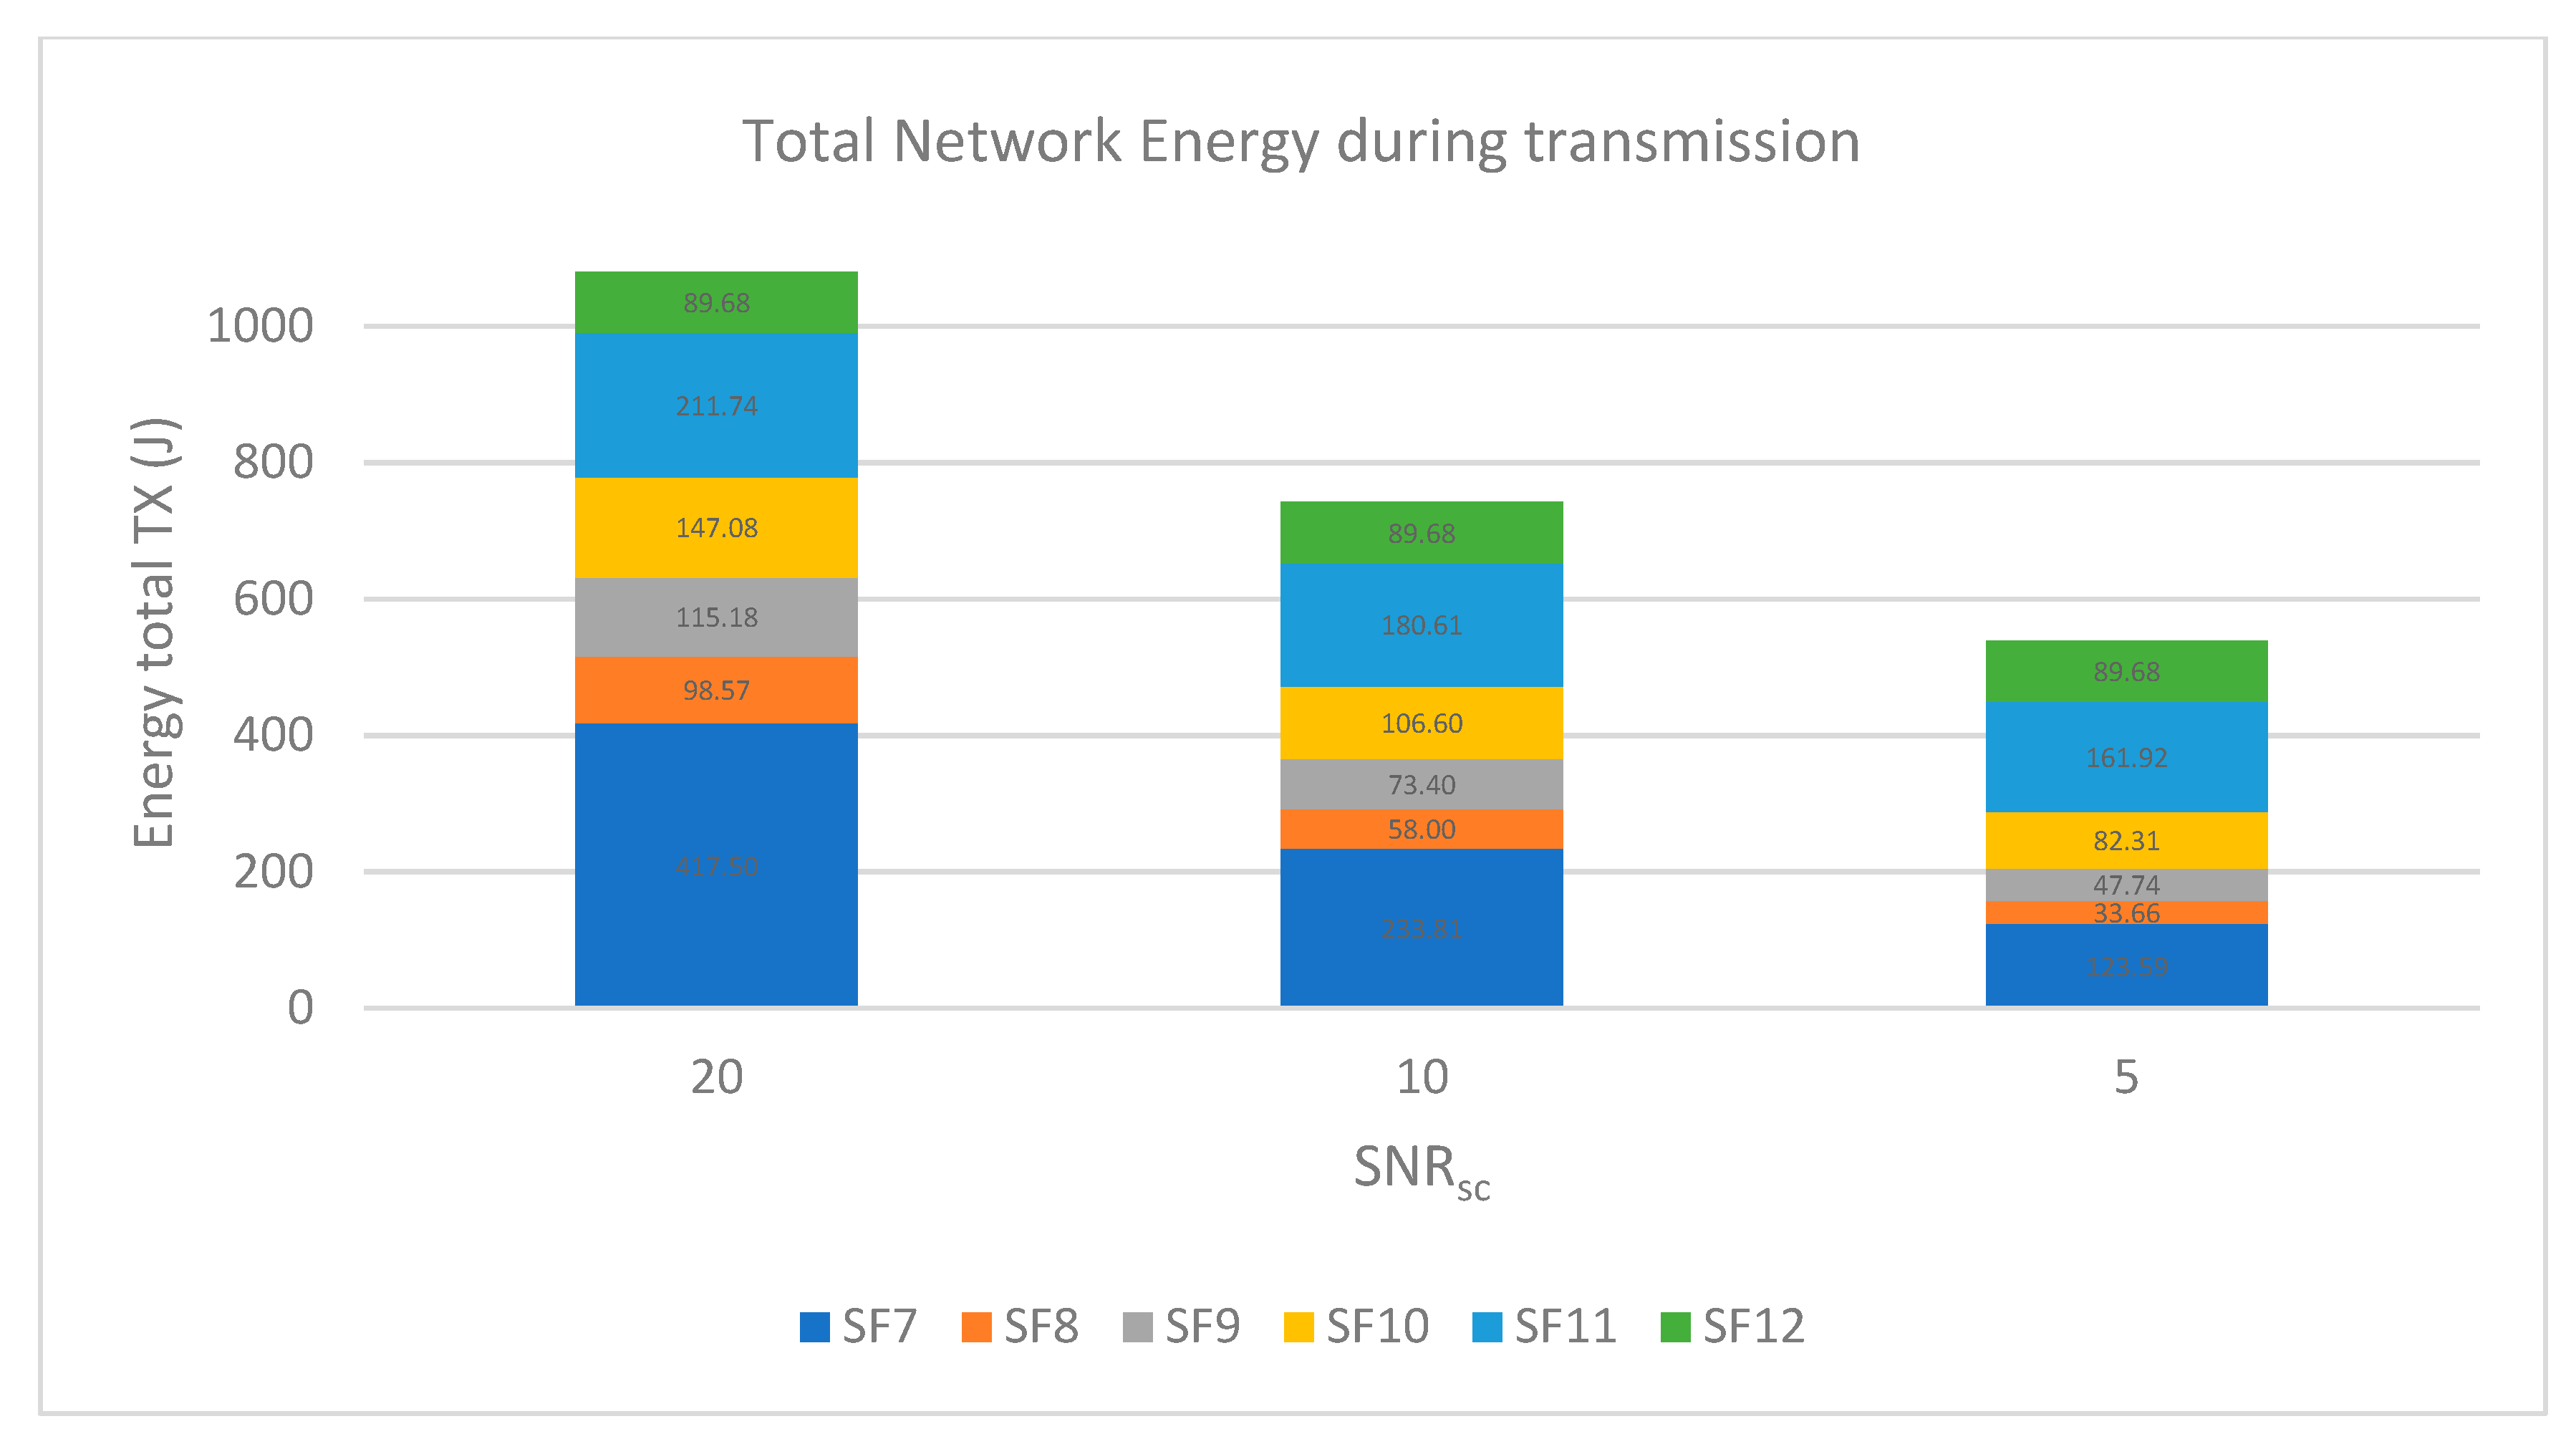
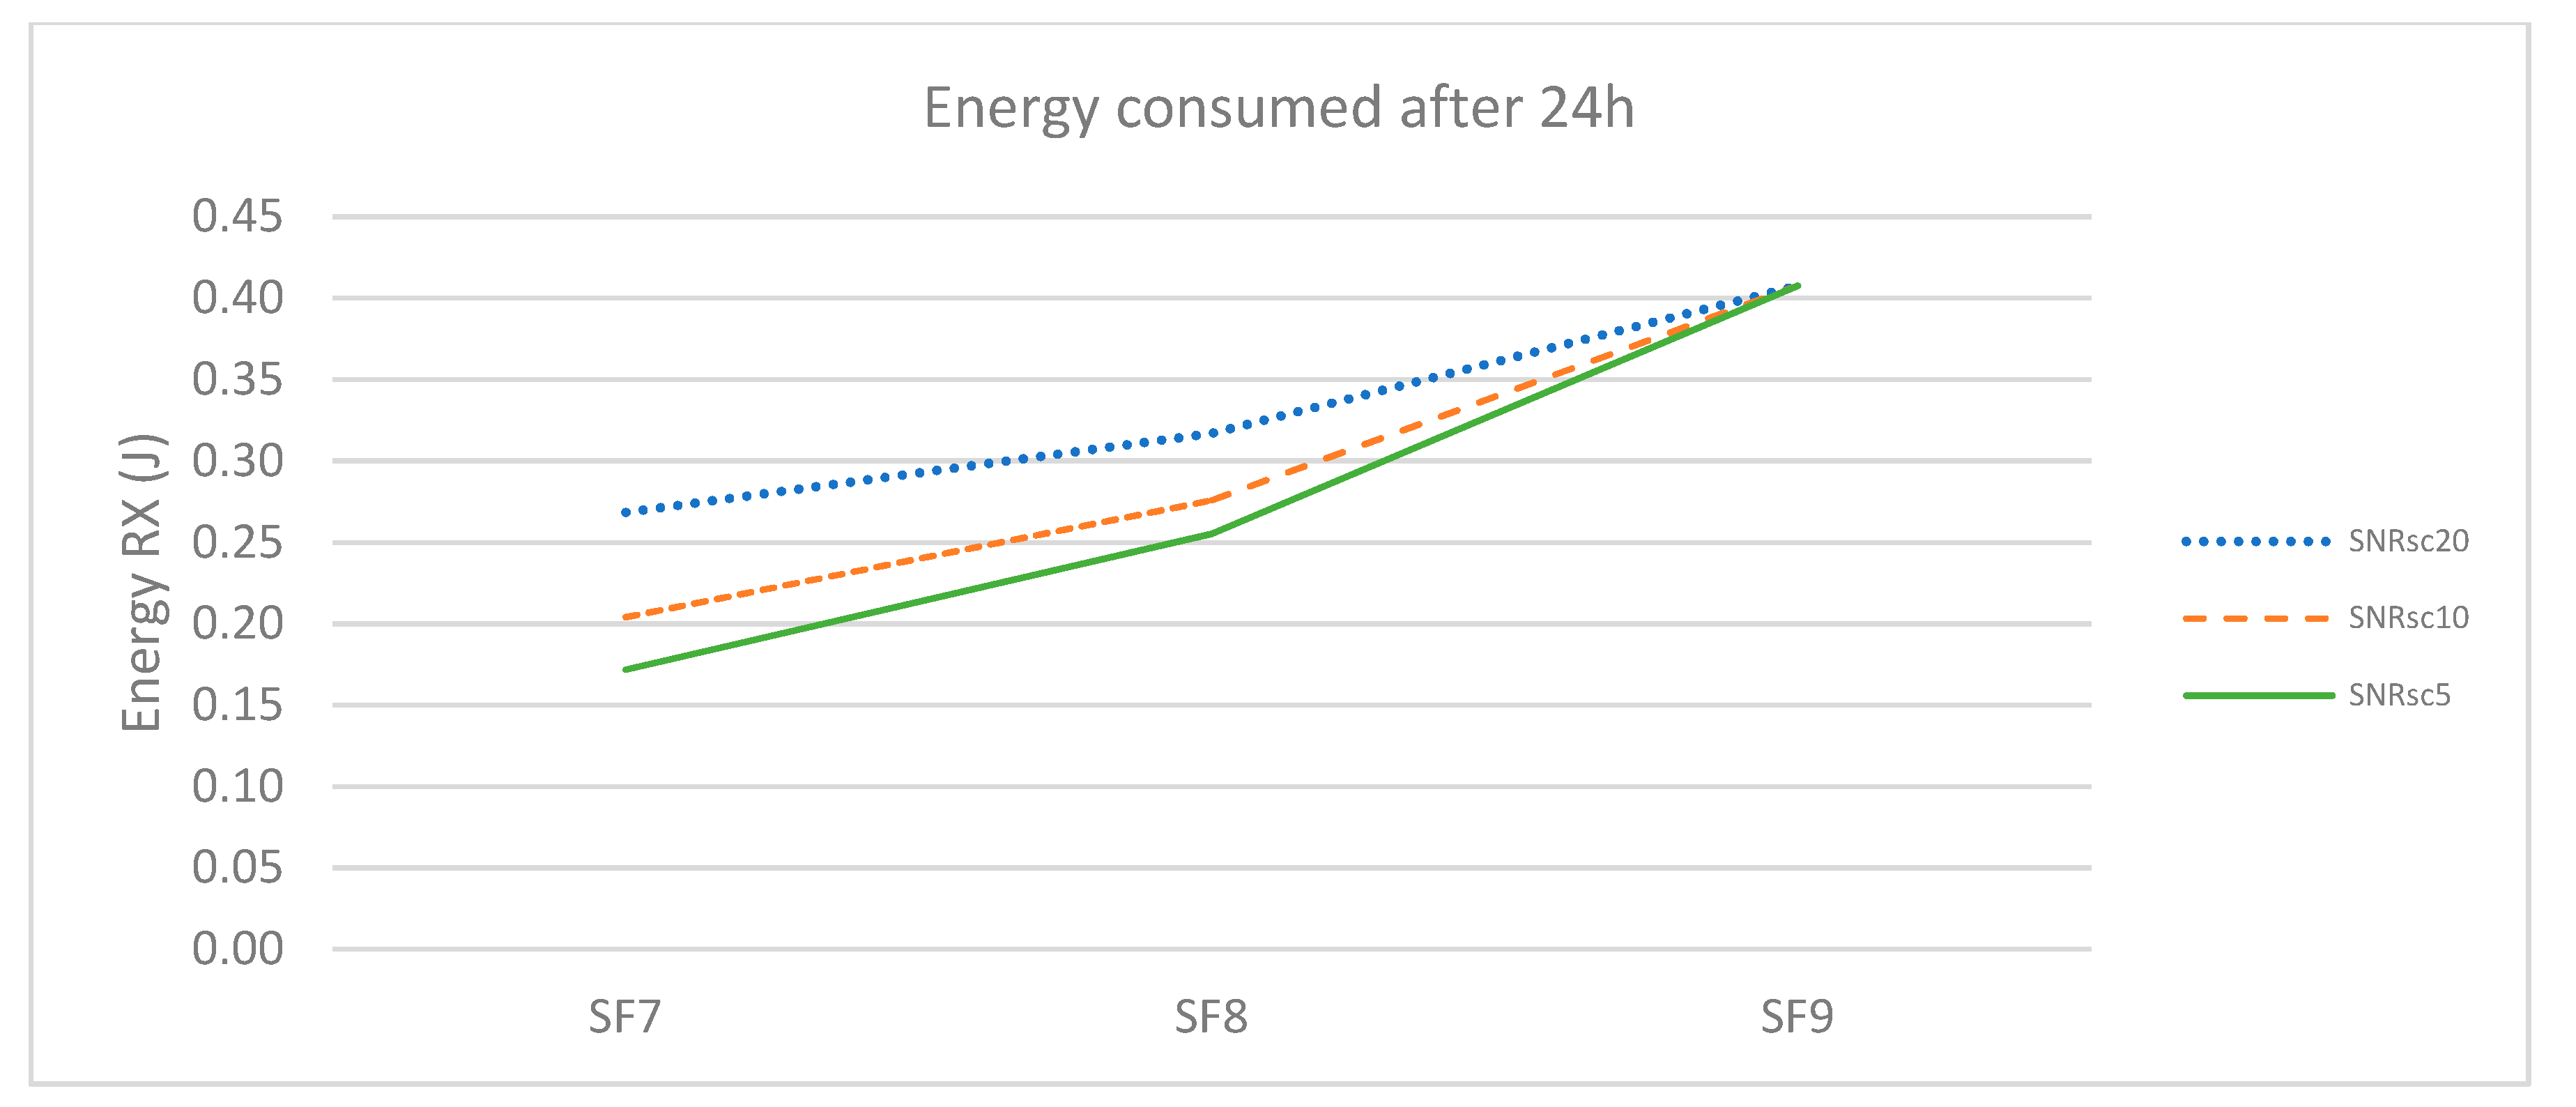
These results have a serious impact on the energy consumption of devices. Equation (10), where I_tx is the current consumption during transmission and V is the voltage fixed at 5 V, is used to calculate the energy used for transmission in 24 h according to the SF achieved due to the ADR.
Figure 12 and
Figure 13 show that by choosing lower SNR
sc, lower SFs are reached faster, and therefore, EDs spend less time transmitting, which translates to lower energy consumption. Configuring the ADR mechanism to only use 5 samples as SNR
sc reduces the network energy consumption by one-half compared with the commonly used value of 20 samples.
Regarding the downlink stage, when nodes receive packets, the power overhead of class B operation is a function of the following:
- -
The time-on-air of the beacon, which is region-specific (SF9/125 kHz) => beacon time-on-air ~160 ms;
- -
The periodicity of the ping slots (two ping slots per beacon period in this case);
- -
The ping slot SF;
- -
The class B downlink periodicity.
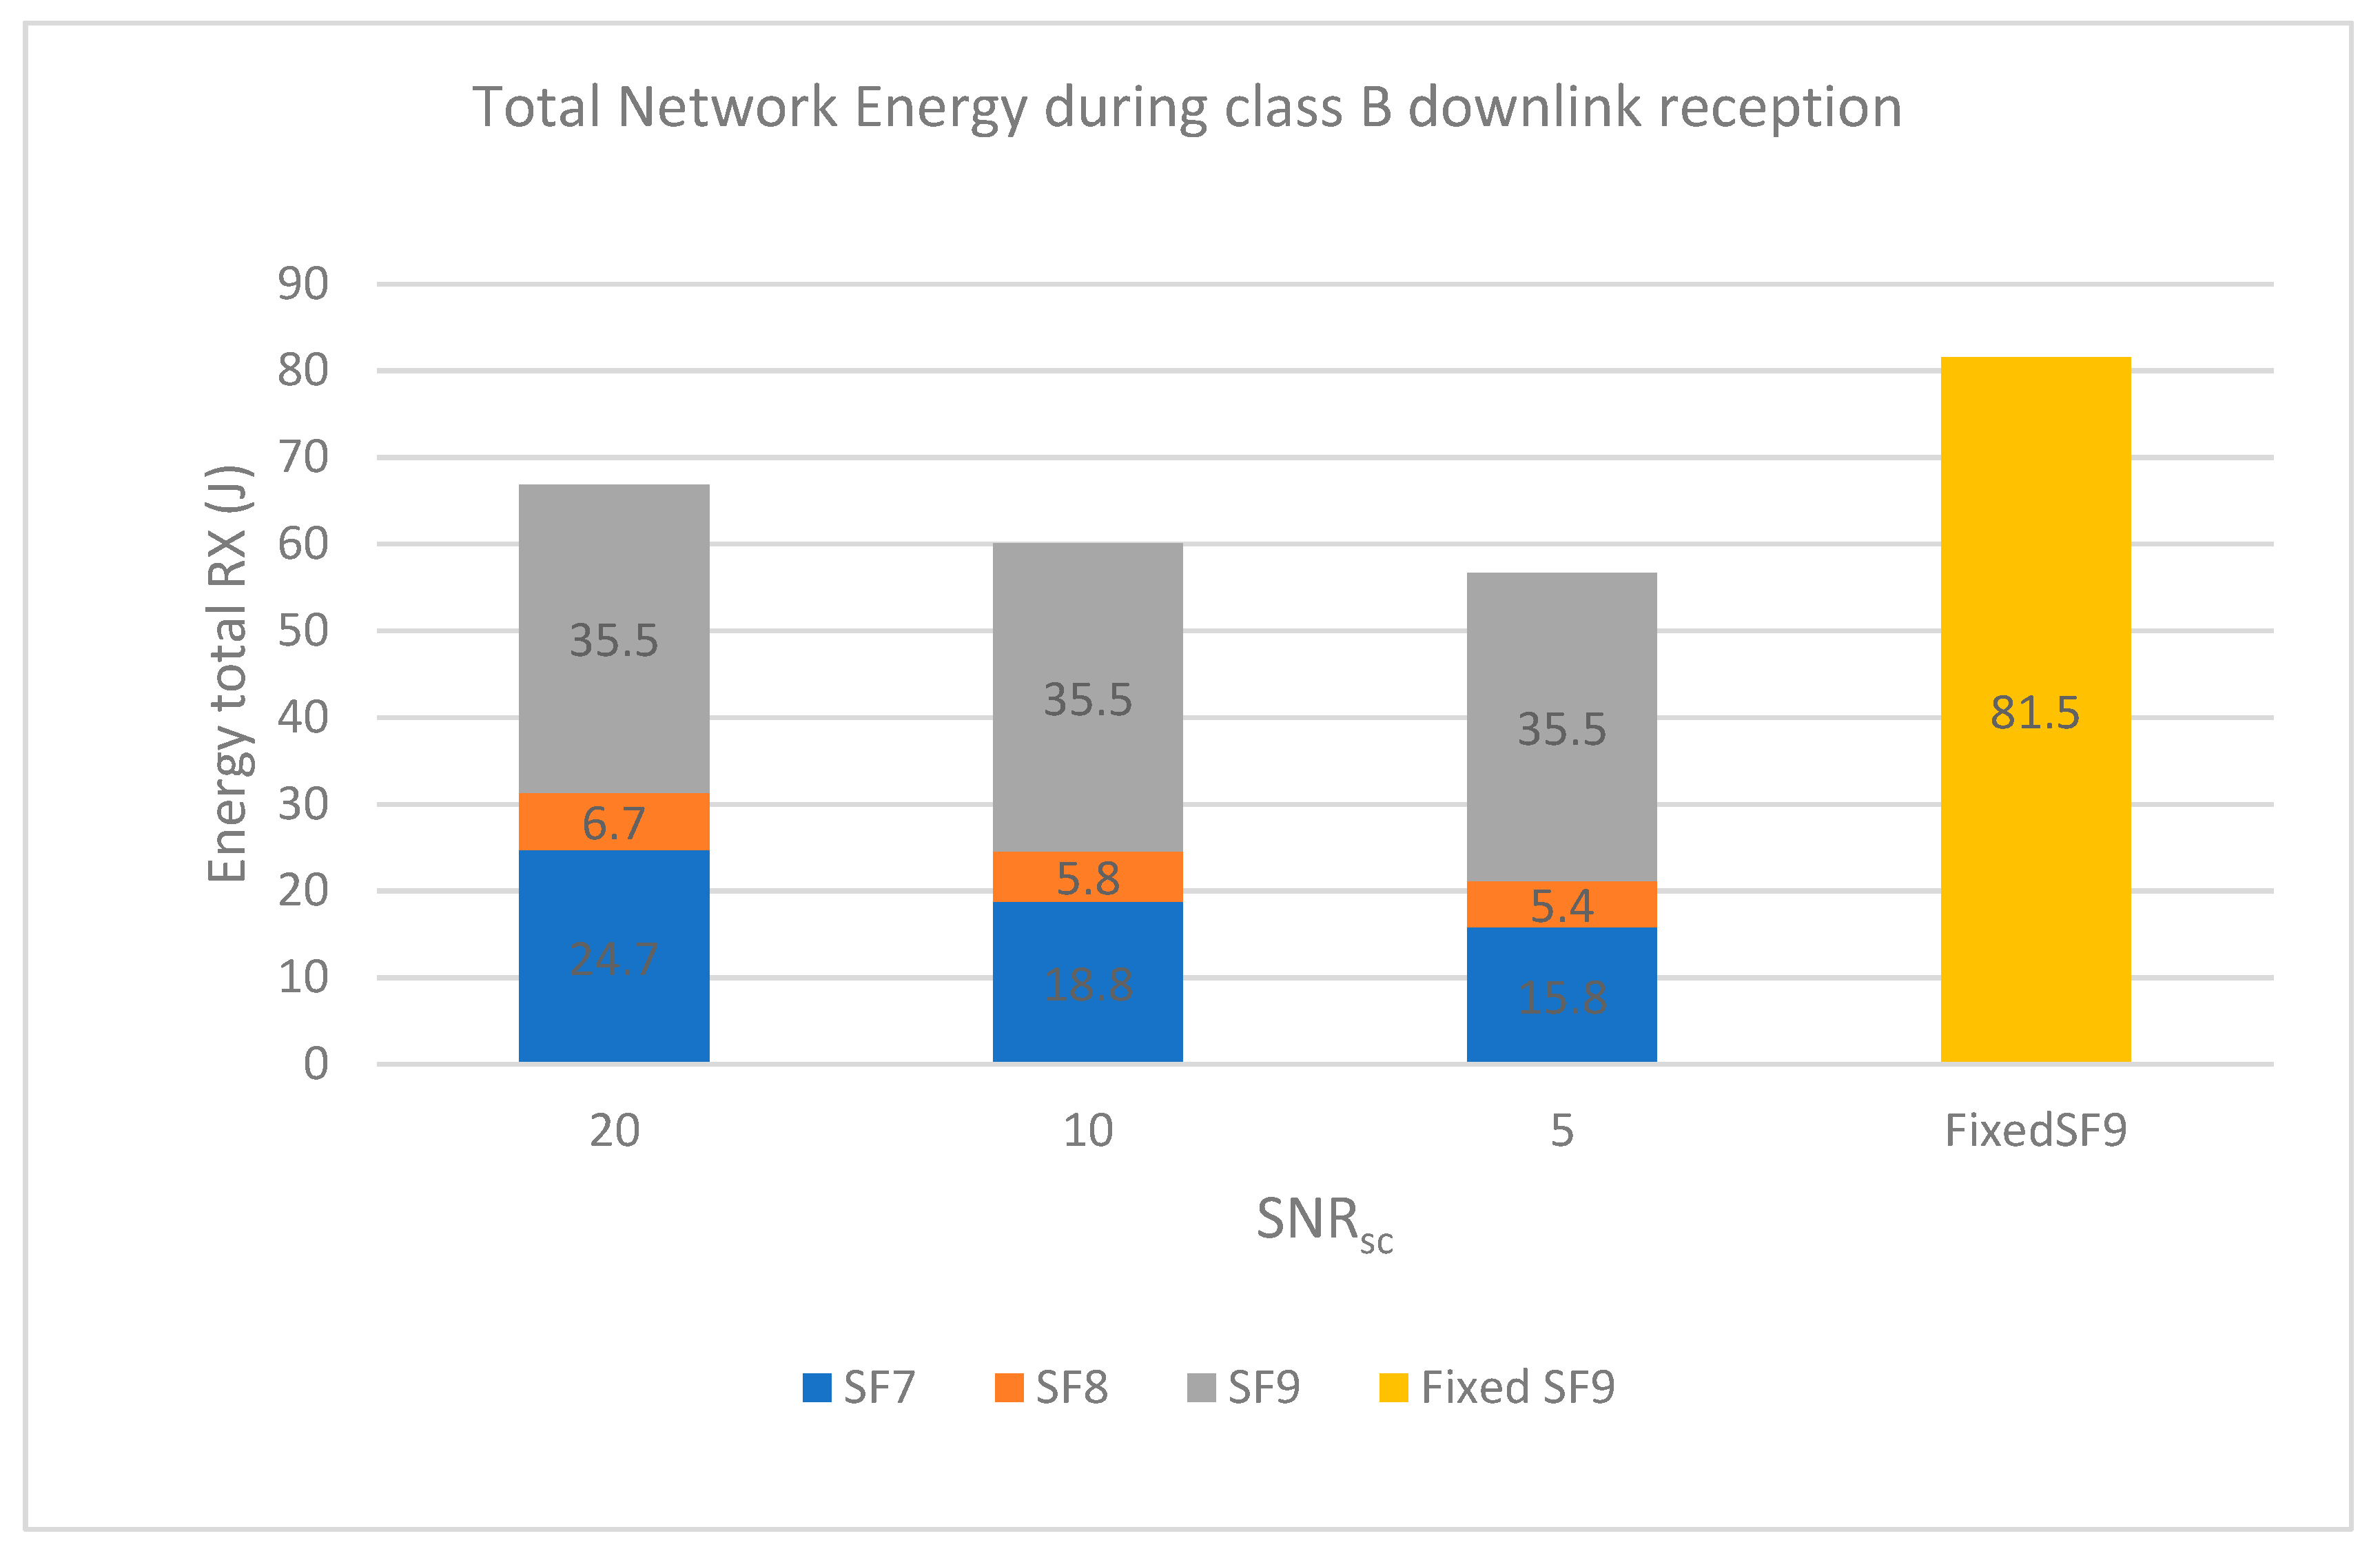
Taking this into account, the main energy drainer for an ED is the reception of beacons and the minimum time it must be listening during its assigned ping slots even if there are no incoming packets. This consumption is fixed and the same for all nodes, so it is not added to the calculation in order to highlight the impact of changing the SF during downlink, which, as can be seen in
Figure 14, is similar to the uplink stage.
In
Figure 15, the total energy consumed by EDs in the network when receiving packets during class B ping slots is shown; here, it can be seen that the impact of reducing the SF in devices translates to a considerable energy consumption reduction.
7. Conclusions and Future Work
LoRaWAN networks have proven to be an interesting technological solution for industrial use cases that require wireless communications that are robust to interference (especially where using unlicensed bands is a requirement), have low energy consumption, and may need to reach long distances. When selecting this technology, it is important is to know in advance how it will perform in each scenario so unexpected behavior can be avoided before carrying out a costly network deployment.
This article overviewed proposed network simulators and LoRaWAN implementations and improved the ns-3 simulator modules to include missing features, such as class B support and ADR support, that were previously only tested independently, and it also proposed the application of ADR for downlink traffic.
Enabling the ADR for downlink traffic, in packets that are by definition sent with SF9, allows devices to lower the SF and therefore spend less time with their radios active. This can significantly lower the amount of energy consumed without affecting the PDR, as the mechanism ensures the selection of an optimal SF.
Then, the proposed implementation (which can be found in [
16] after requesting access) was simulated and tested over a carefully selected scenario which complied with a real industrial use case under study. The results are promising in terms of robustness and energy optimization. Although the comparison with some fixed SF values shows similar network performance, with around 2% better PDR in troublesome areas for ADR implementation, the study was successful in that the mechanism worked as expected. The usage of ADR for downlink in class B devices in this scenario only had an impact on energy consumption, which was expected as downlink packets were scheduled and thus avoided collisions naturally. Nevertheless, the energy consumption was improved, network-wise, by between 31 and 43% (depending on SNR
sc used) in the downlink stage.
In real-world deployments, the ADR mechanism allows us to adapt better to changes in the environment and to cases where EDs change their positions at given times. The use of ADR can be even more relevant when the number of devices increases, i.e., in more densely populated scenarios, or when there are greater interference and noise levels due to the specific characteristics of other environments.
Therefore, there are two main results for consideration: (1) the enhanced simulation tools to conduct new experiments for realistic LoRaWAN network deployments and (2) the optimization of downlink traffic by enabling ADR which has a great impact on energy savings. This is a first step where some configuration assumptions have been made, allowing for future work that would characterize even more realistic operation and configuration for LoRaWAN networks. The implementation of features for the network simulator allows new experiments to be conducted with other channel models that may introduce more variability. Moreover, the proposals, even if they involve a particular configuration, are still compliant enough with the standard to allow validation of results using commercial off-the-shelf (COTS) devices in the near future.

 ,
, 


