Article

A Preprocessing Strategy for Denoising of Speech Data Based on Speech Segment Detection

Department of Industrial Engineering, Seoul National University of Science and Technology, 232 Gongneung-Ro, Nowon-Gu, Seoul 01811, Korea
*
Author to whom correspondence should be addressed.
Appl. Sci. 2020, 10(20), 7385; https://doi.org/10.3390/app10207385
Submission received: 8 September 2020 / Revised: 6 October 2020 / Accepted: 13 October 2020 / Published: 21 October 2020
(This article belongs to the Special Issue Intelligent Speech and Acoustic Signal Processing)

Abstract

:
In this paper, we propose a preprocessing strategy for denoising of speech data based on speech segment detection. A design of computationally efficient speech denoising is necessary to develop a scalable method for large-scale data sets. Furthermore, it becomes more important as the deep learning-based methods have been developed because they require significant costs while showing high performance in general. The basic idea of the proposed method is using the speech segment detection so as to exclude non-speech segments before denoising. The speech segmentation detection can exclude non-speech segments with a negligible cost, which will be removed in denoising process with a much higher cost, while maintaining the accuracy of denoising. First, we devise a framework to choose the best preprocessing method for denoising based on the speech segment detection for a target environment. For this, we speculate the environments for denoising using different levels of signal-to-noise ratio (SNR) and multiple evaluation metrics. The framework finds the best speech segment detection method tailored to a target environment according to the performance evaluation of speech segment detection methods. Next, we investigate the accuracy of the speech segment detection methods extensively. We conduct the performance evaluation of five speech segment detection methods with different levels of SNRs and evaluation metrics. Especially, we show that we can adjust the accuracy between the precision and recall of each method by controlling a parameter. Finally, we incorporate the best speech segment detection method for a target environment into a denoising process. Through extensive experiments, we show that the accuracy of the proposed scheme is comparable to or even better than that of Wavenet-based denoising, which is one of recent advanced denoising methods based on deep neural networks, in terms of multiple evaluation metrics of denoising, i.e., SNR, STOI, and PESQ, while it can reduce the denoising time of the Wavenet-based denoising by approximately 40–50% according to the used speech segment detection method.

1. Introduction

Denoising is the process of extracting only the clean speech from a mixed sound of speech and noise. Figure 1 shows denoising of speech data. The main goal of denoising is to enhance the perceptual quality of speech and the robust speech recognition. Applications of denoising include cellular and teleconference communications affected by background and channel noise [1]. The denoising performance has a considerable impact on both the comprehensibility and the post-processing efficiency of the speech data. Therefore, various denoising methods have been studied [2]. However, as shown in Figure 1, we indicate that denoising, i.e., mitigating the noise affecting a speech signal, is a difficult process because the noise and speech coexist at the same time point.
The previous denoising methods can be classified into the following three categories:
1.
Statistical feature-based methods: There have been previous studies that exclude the noise by the threshold value according to a specific statistical feature. The proposed representative criteria are nonnegative matrix factorization [3], Wiener filter [1,4,5], and wavelet transformation denoising [2,6]. Before AutoEncoder and deep learning-based methods were proposed, this approach had been widely used.
2.
AutoEncoder-based methods: Denoising AutoEncoder (DAE) has been already used in image processing to extract the noise for the classification [7]. For denoising in speech signals, there have also been many previous studies to adopt the DAE to extract the noise from noisy speech data: DAE using the noisy speech as the input and the clean speech as the output [8], a new pre-training and fine tuning methods based on the DAE [9], weighted DAE capturing the relationship between the noisy and clean speech signals [10], time-domain convolutional DAE [11], and speaker-aware DAE [12].
This approach allows us to conduct unsupervised learning without manual labeling because the noises are automatically generated in the model. However, it has been known that the strength and accuracy of the model are lower than the deep learning methods, which are supervised learning based on the labeling of clean and noisy data sets.
3.
Deep neural network (DNN)-based models: Deep learning-based denoising learns the difference between noisy speech data and clean speech data. Various deep learning models have been proposed: Wavenet-based denoising model [13], Fully-Convolutional Networks (FCNs) denoising model [14], Convolutional Neural Network (CNN) denoising model [15], Recurrent Neural Networks (RNNs) denoising model [16], and Convolutional-RNN (CRNN) denoising model [17]. This approach generally shows a high performance although it requires large-scale data sets with labeling and requires significant computing costs in the training process. One of recent advances in deep learning-based methods is the Wavenet-based algorithm, which is an end-to-end model developed by Google [13]. Wavenet has been used to produce sound waveforms within Tacotron [18], Google’s voice synthesis model [13], which can identify speech features effectively. It has been shown that Wavenet-based denoising performs better than Wiener filter, which is one of the most widely used methods [4].
A design of computationally efficient speech denoising is necessary to develop a scalable method for large-scale data sets [19]. Furthermore, it becomes more important as the deep learning-based methods have been developed because they require significant costs while showing the high performance in general. Especially, deep learning model has been widely applied in various environments including not only high-performance servers equipped with GPUs but also low-performance embedded or IoT devices such as raspberry pi [20]. Therefore, reducing the computational cost in deep learning model is one of critical issues in practice because it allows us to provide real-time services based on the deep learning model even in limited environments [21]. In this paper, we deal with the deep learning-based model for denoising and focus on improving its denoising speed while maintaining the accuracy of denoising. The importance of efficient denoising is supported by our experimental results, which show that the denoising time of Wavenet-based denoising (e.g., 3867 s) is much larger than the original signal lengths (e.g., 2072 s) in our experimental setting and it is significantly reduced by the proposed strategy (See Section 5).
In this paper, we propose a preprocessing strategy for denoising of speech data based on the speech segment detection. Figure 2 shows the concept of the proposed preprocessing strategy for denoising. The basic idea of the proposed method is using the speech segment detection so as to exclude non-speech segments before denoising. The speech segmentation detection can exclude non-speech segments with a negligible cost, which will be removed in denoising process with a much higher cost, while maintaining its accuracy of denoising. As shown in Figure 2, the proposed preprocessing strategy consists of the following four steps:
1.
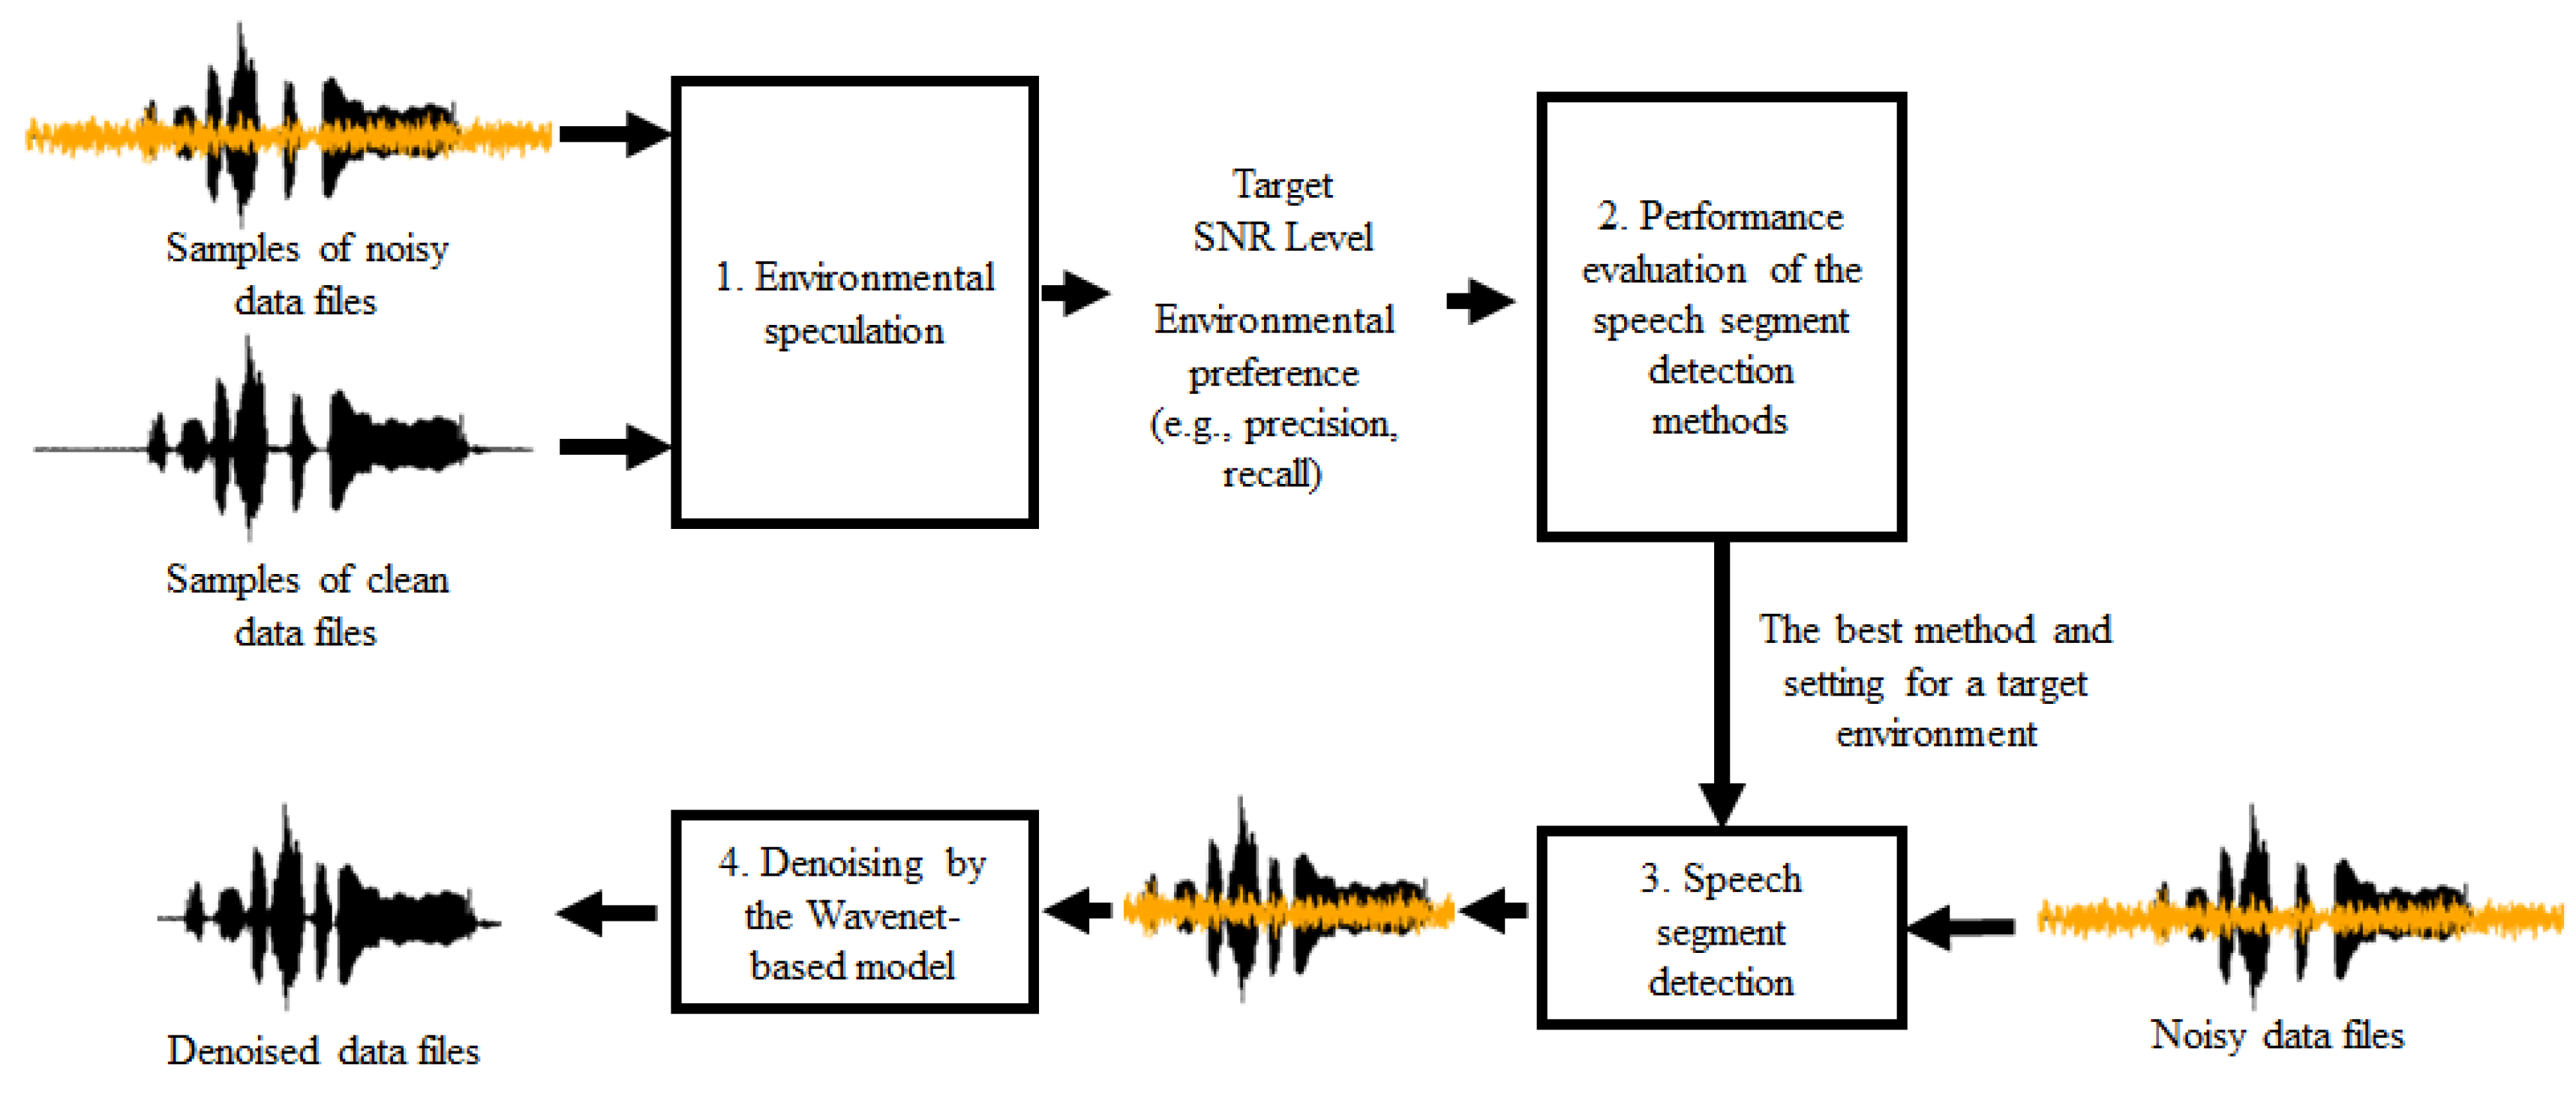
We speculate the target environment using samples of noisy and clean data files to figure out the characteristics of the environment. To define the environment, we use different levels of signal-to-noise ratio (SNR) and multiple evaluation criteria, which affect the results of preprocessing significantly. That is, the effects of the speech segment detection methods are quite varied according to the level of SNR (See Section 4). In addition, we need to determine a preferred evaluation criterion. Specifically, in some environments, we should not allow to exclude any small speech segments even if many non-speech segments are not excluded (i.e., recall takes the precedence over precision); in other environments, we can improve the overall effects of denoising by allowing to exclude some negligible speeches (i.e., precision over recall).
2.
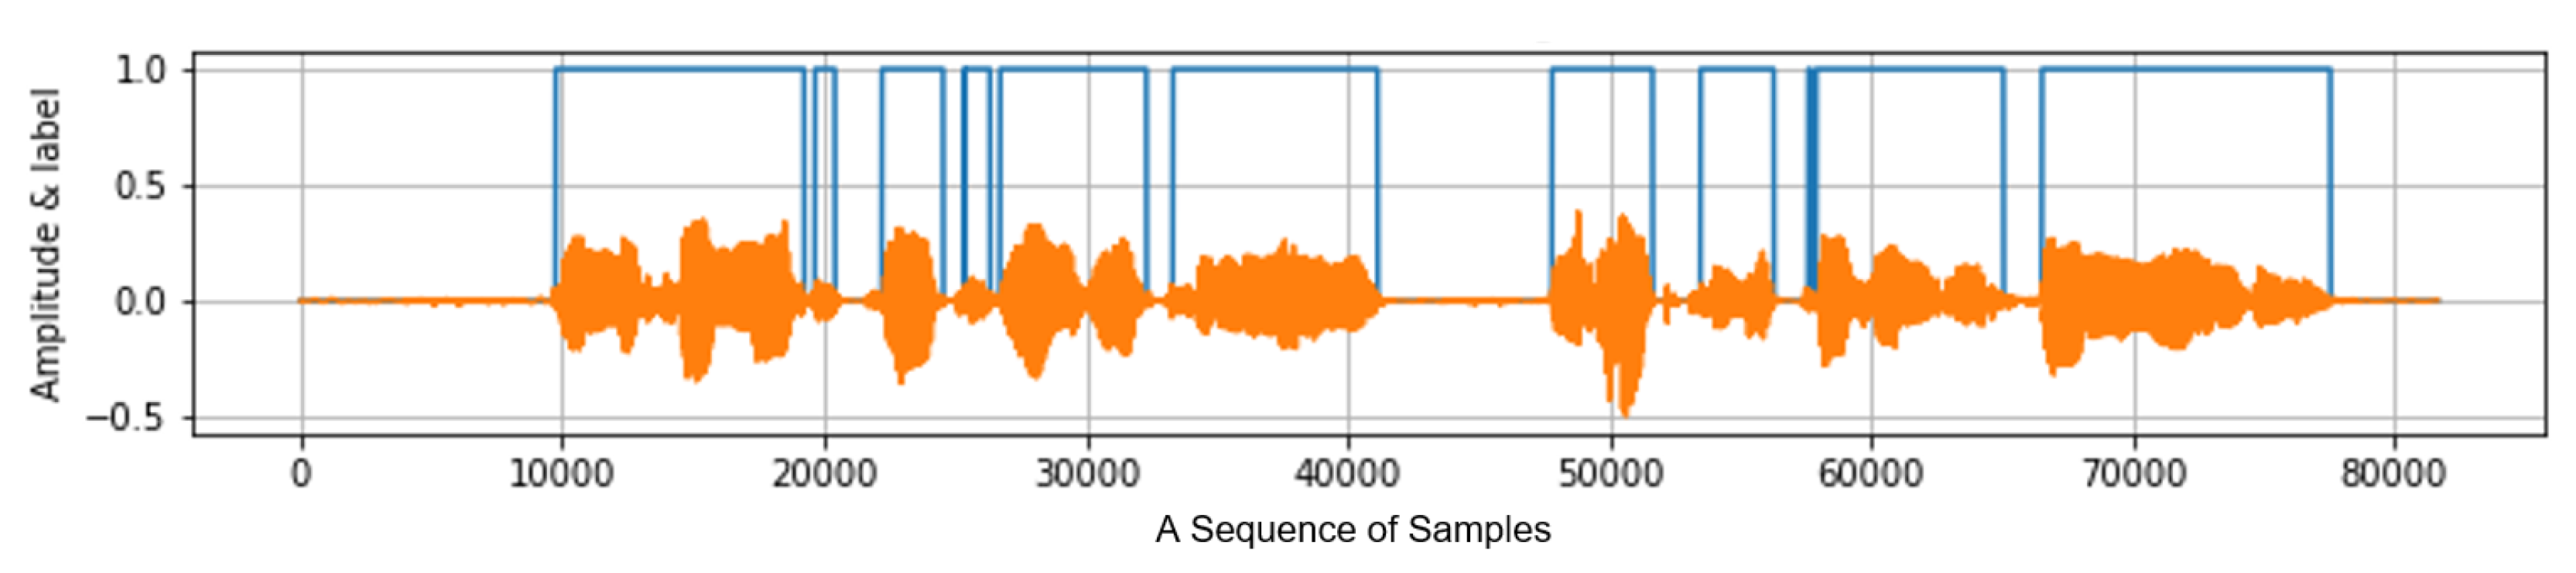
We enumerate the speech segment detection methods by combining filtering and unsupervised methods that have been used for the voice activity detection [22] and conduct their performance evaluation to select the most effective method for a target environment. Here, we note that the purpose of the speech segment detection methods is effectively excluding the non-speech segments as preprocessing of denoising, not improving the performance of the speech segment detection itself. As a result, we investigate simple and efficient speech segment detection methods that can work effectively with the denoising method.
3.
We apply the speech segment detection method with the best setting by each method into noisy data files. In this step, the non-speech segments, which will be removed with a significant cost in deep learning-based denoising process, are efficiently excluded, while the overall accuracy is maintained.
4.
We apply the Wavenet-based denoising model [13], which is one of recent advanced denoising methods based on deep neural networks, to only the speech segments. Through extensive experiments, we evaluate the performance of the proposed strategy by each speech segment detection method where the best setting in the previous step is used and compare them with the original Wavenet-based denoising model in terms of the speed and accuracy of denoising.
We summarize the contributions of the paper as follows:
1.
We devise a framework to choose the best preprocessing method for denoising based on the speech segment detection for a target environment. For this, we speculate the environments for denoising using different levels of SNR and multiple evaluation metrics. As shown in Figure 2, the framework finds the best speech segment detection method tailored to a target environment according to the performance evaluation of speech segment detection methods.
2.
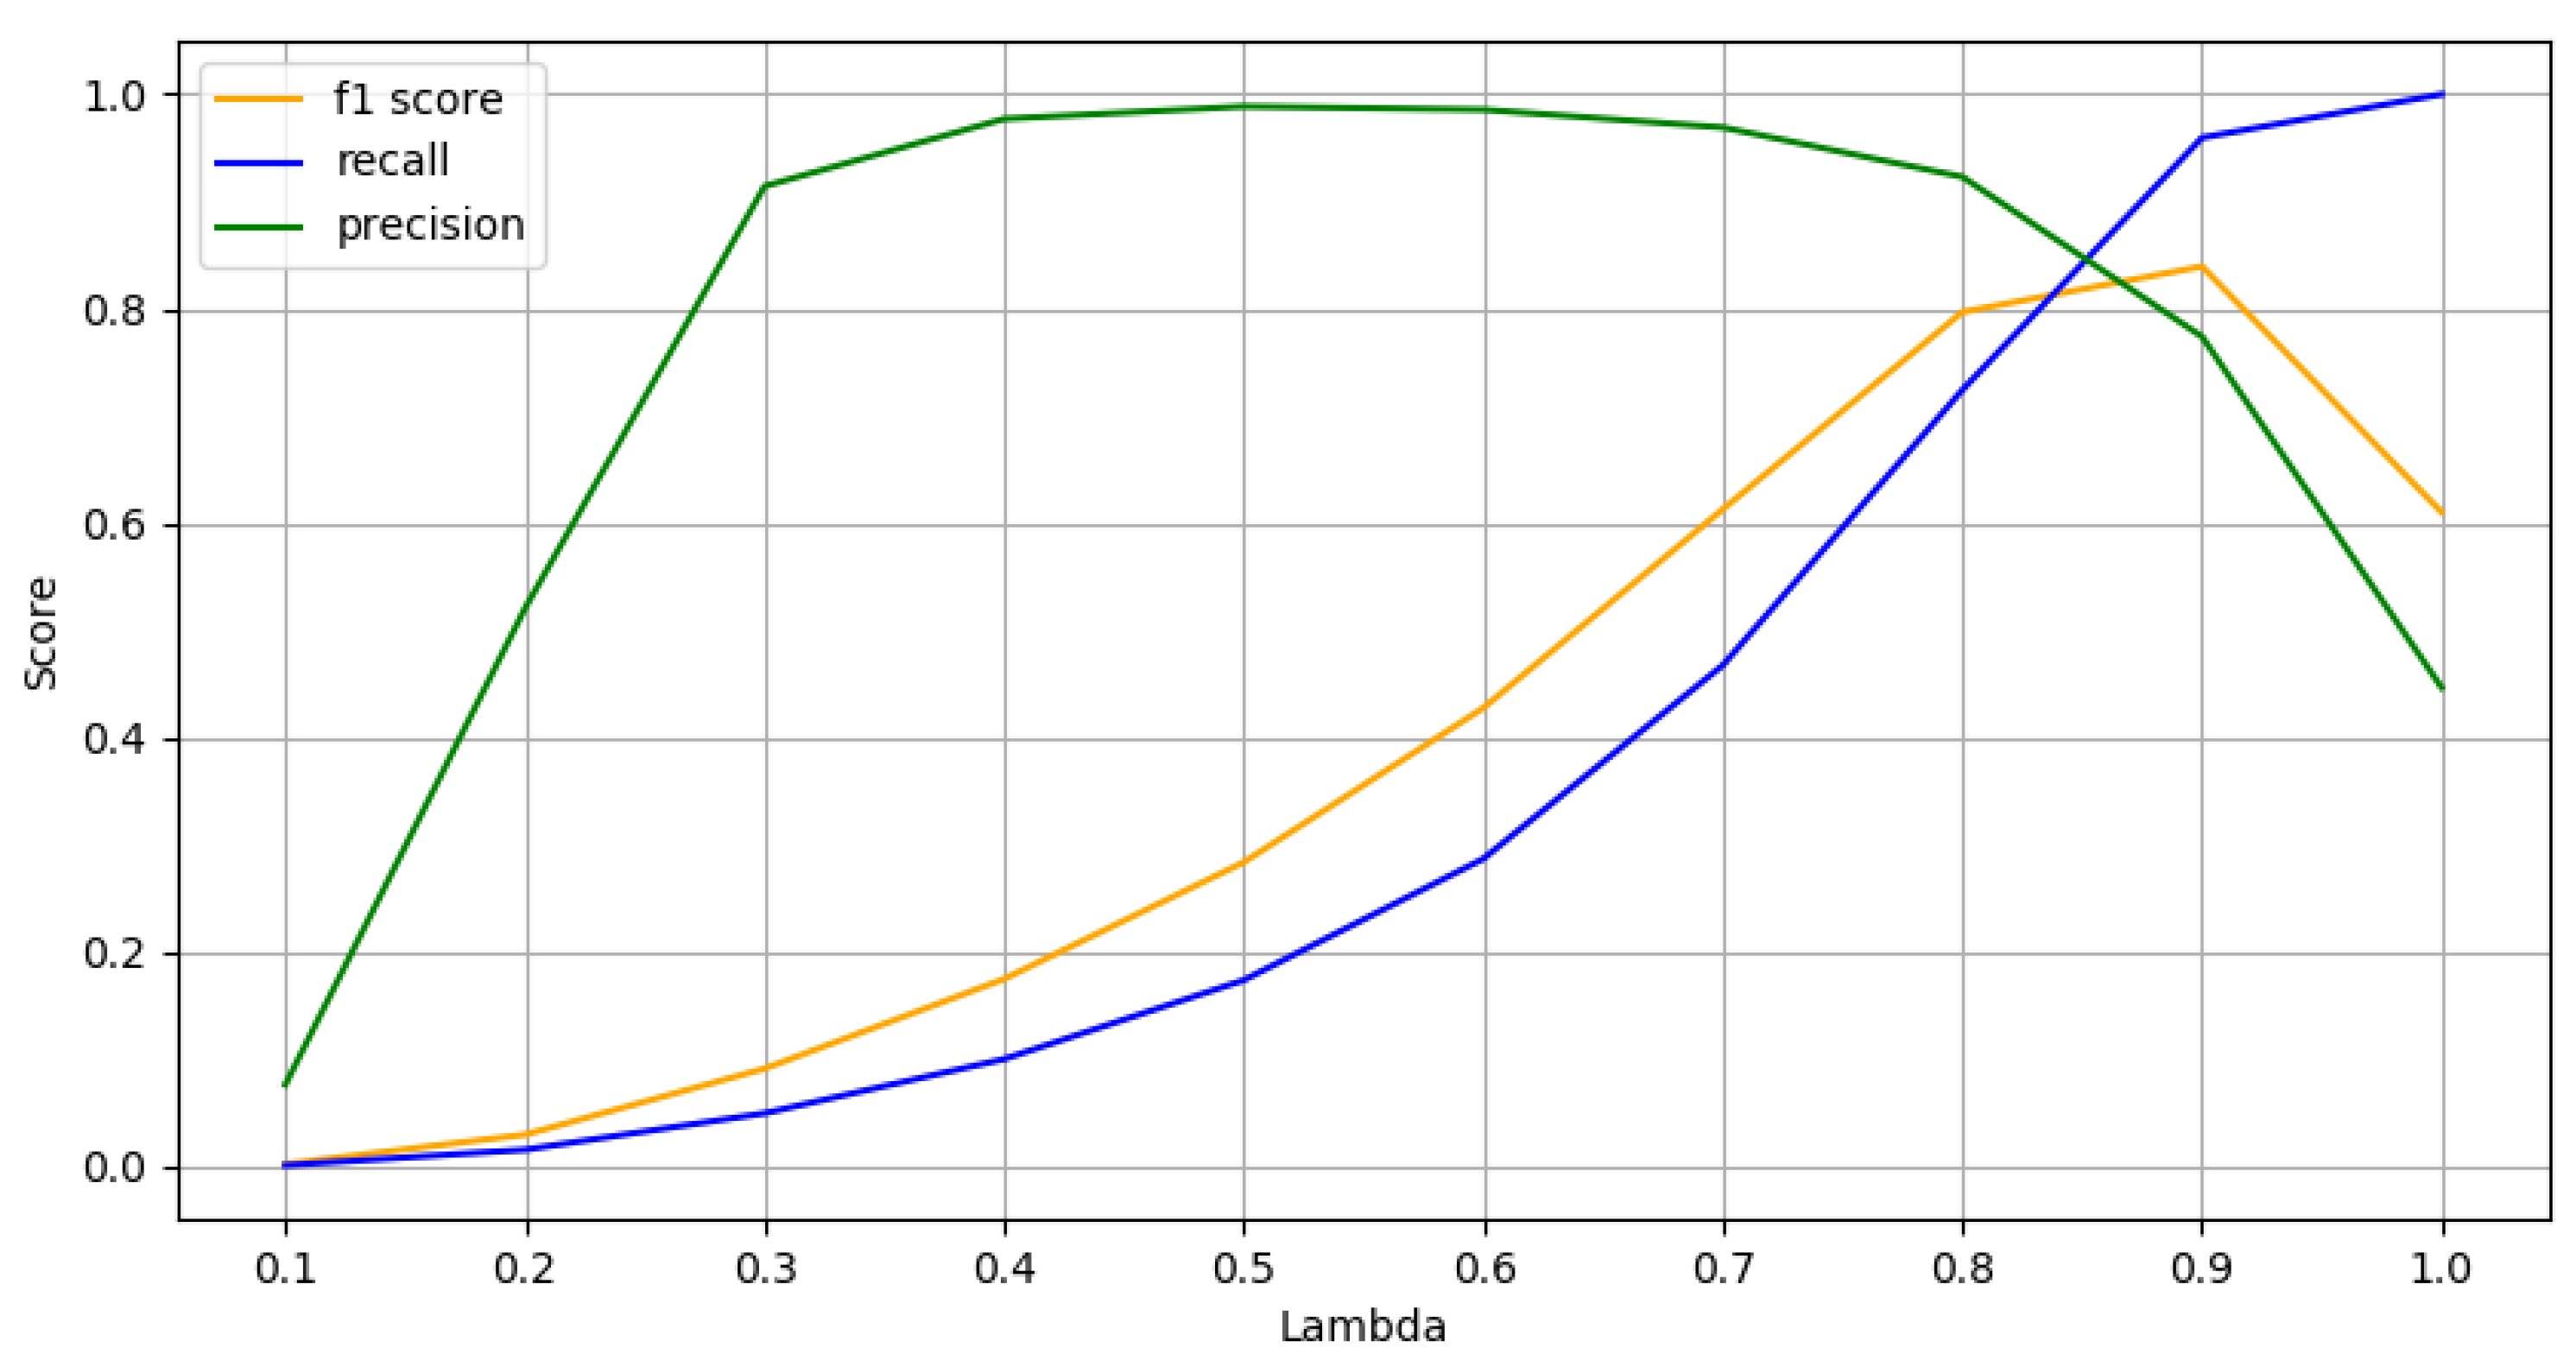
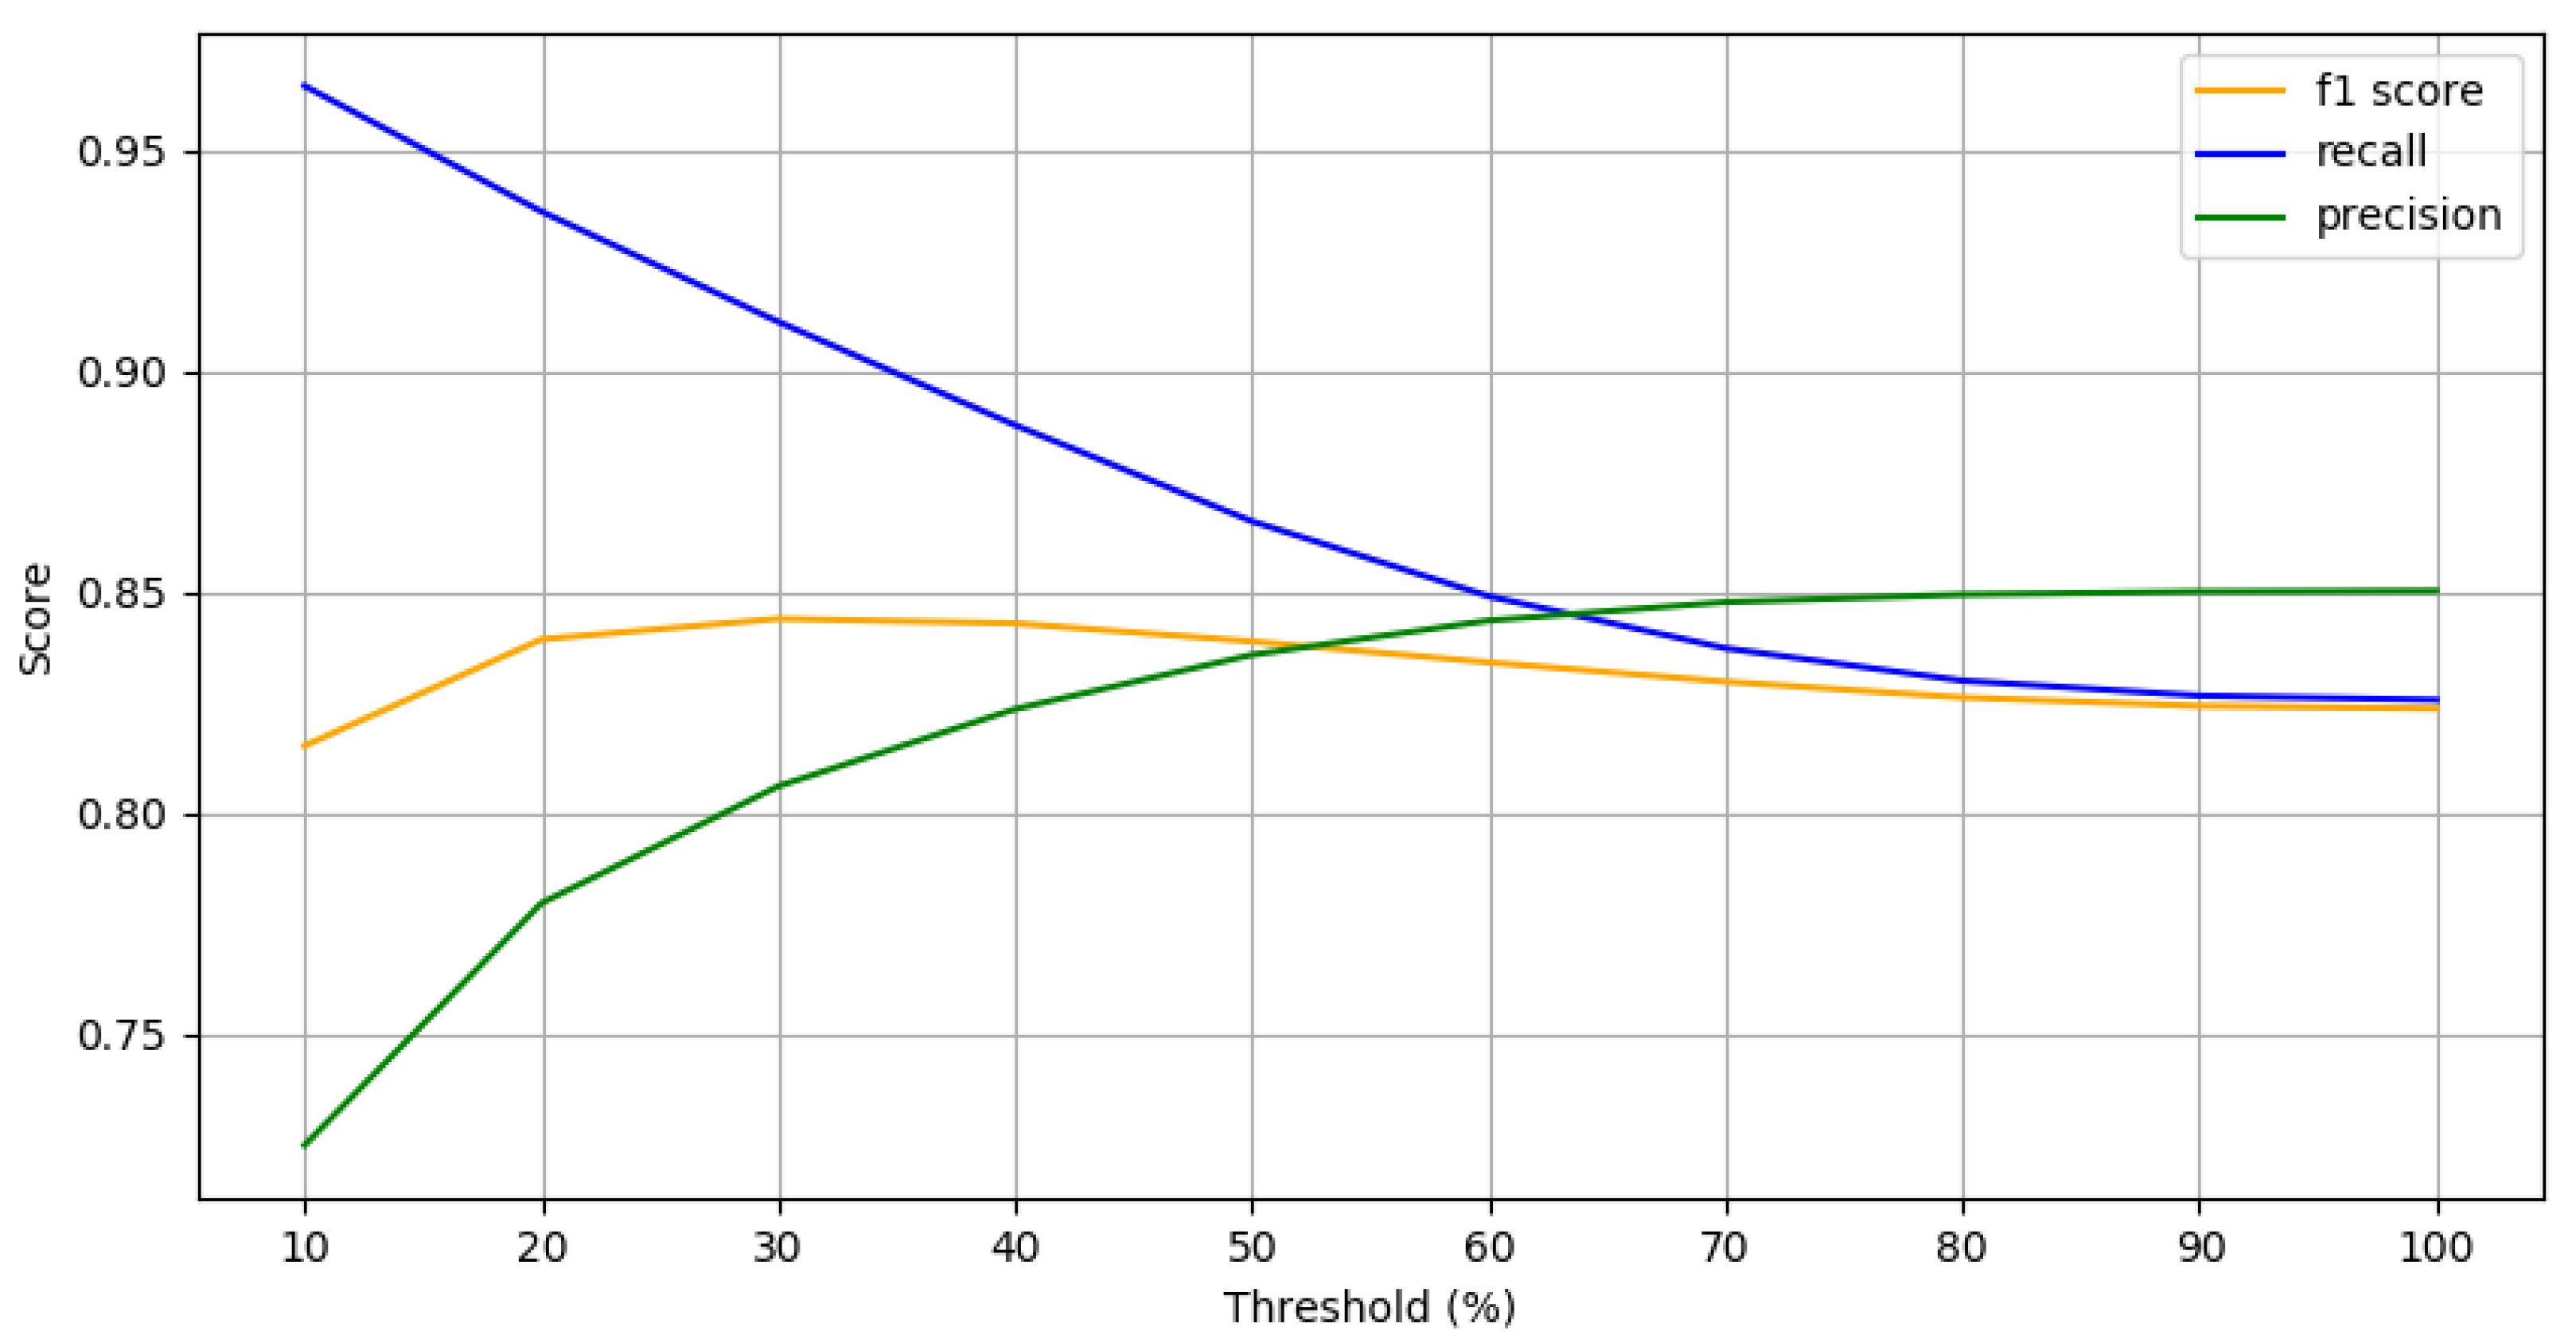
We investigate the accuracy of the speech segment detection methods extensively. We conduct the performance evaluation of five speech segment detection methods with different levels of SNRs and multiple evaluation metrics. Especially, we show that we can adjust the accuracy between the precision and recall of each method by controlling a parameter. Through extensive experiments, we measure the accuracy of the speech segment detection methods with a variety of SNRs and evaluation metrics and observe that a different speech segment detection method shows the best accuracy for each group of SNRs and evaluation metric. This result indicates that we need to select the most effective speech segment detection method for a given target environment.
3.
We incorporate the best speech segment detection method for a target environment into a denoising process. Through extensive experiments, we show that the accuracy of the proposed preprocessing strategy is comparable to or even better than that of the original Wavenet-based denoising in terms of multiple evaluation metrics of denoising, i.e., SNR, STOI, and PESQ, while it can reduce the denoising time of the Wavenet-based denoising by 40.06–50.76% according to the used speech segment detection method.
The organization of the paper is as follows. In Section 2, we explain preliminaries. In Section 3, we present the proposed method. In Section 4, we describe the experimental results. In Section 5, we conclude the paper.

2. Preliminaries

2.1. Wavenet-Based Denoising

Wavenet is an internal speech DNN model within a voice synthesis model, Tacotron [18], to create raw sound waveforms. Since Wavenet enables the effective understanding of speech data features, it has been proposed as a denoising tool [13]. Figure 3 describes its overall architecture [13], which allows to identify the comprehensive features of speech data effectively using a dilated convolution layer, which enables to extend the reception field with a small number of layers. It also tries to avoid overfitting and to reduce computational costs by skipping several layers randomly using the concept of skip connection. For these reasons, Wavenet-based denoising performs better compared to Wiener filter [4]. Specifically, in a speech quality assessment involving 33 participants, Wavenet-based denoising is scored 3.6 while Wiener filter 2.92 [13].

2.2. Voice Activity Detection

Voice activity detection (VAD) is a technique for detecting the presence of speech signal in speech data [22]. It has been widely used to enhance the speech contents such as speech classification [23], speaker recognition [24], and speech enhancement [25,26]. Figure 4 shows three processing steps for VAD: (1) noise reduction, (2) segmentation, and (3) elimination [27]. As depicted in Figure 4, the length of the original signal becomes shorter after applying VAD by eliminating the non-VAD segments. For the efficient denoising, we aim to exclude only the segments that definitely do not contain speech. To this purpose, we use segmentation and elimination steps of the overall VAD process, which we call the speech segment detection, for the preprocessing of denoising process.
We classify existing methods for the speech segment detection in VAD into three categories: (1) filtering methods, (2) unsupervised methods, and (3) deep learning-based methods. Filtering methods detect the speech segment based on statistical features of the signal such as LPC parameters, energy levels, and ZCR [28,29]. For the unsupervised methods, Górriz et al. have proposed fuzzy C-means based clustering [30]. Ramírez et al. have presented multiple observation likelihood ratio test (MO-LRT) [31], and Petsatodis et al. have devised the method that improves MO-LRT [32]. Tan et al. have proposed an unsupervised method that can calculate spectral flatness efficiently for the robust VAD [33]. For deep learning-based methods, Tashev et al. have designed a fully connected deep neural network to classify speech and non-speech segments [22]. Ferrer et al. have formalized VAD problem as a binary classification and have classified speech and non-speech segments using DNN-based model [34].
Although it has been known that the deep learning-based methods generally outperform the other methods, they require significant computational costs. In this paper, because the speech segment detection will be used as pre-processing to improve the efficiency of denoising, we need a simple and fast method for detecting speech segments. To this purpose, we investigate filtering and unsupervised methods that have fast inference time due to the simple mechanism [35].

3. Denoising Based on the Speech Segment Detection

3.1. The Overall Flowchart

Figure 5 describes the overall process of denoising into which we apply the preprocessing based on the speech segmentation detection. As shown in Figure 2, the selected speech segment detection method for a target environment is used for a denoising process. As the input data sets, we use speech data files with noises formatted in wav where each sample is recorded at a rate of 16 Khz [36]. First, we separate the noisy speech data file into the speech and non-speech segments by the selected speech segment detection method. Second, we perform the smoothing process. It accumulates audio signals of 200 time points before and after each time point, which corresponds to smoothing on a running window of 25 ms. Then, if more signals out of the accumulated 200 signals belong to speech signals than non-speech signals, the time point is classified as speech signal; otherwise, as non-speech signal. Third, we accumulate all the extracted speech segments into a single speech data file. Fourth, we put the speech data file as the inputs of the Wavenet-based denoising method and obtain the final denoised result.
For the speech segment detection, we consider five methods by combining filtering and unsupervised methods of VAD. First, we use two representative features of speech signals [29,37,38]: (1) energy and (2) entropy. Second, we use an unsupervised method: fuzzy clustering [39]. This is a very powerful method compared to traditional hard clustering for handling a number of ambiguous data sets such as audio signals [40]. Third, we combine filtering methods with a fuzzy clustering method: (1) energy-based filtering with fuzzy clustering and (2) entropy-based filtering with fuzzy clustering.
As the criteria to measure the accuracy of the speech segment detection methods, we use three metrics: (1) precision, (2) recall, and (3) F1 score. Equation (1) shows precision; Equation (2) recall; Equation (3) F1 score. Precision means the ratio of relevant instances among all the instances retrieved by the method; recall the ratio of instances retrieved by the method among total relevant instances. Here, we determine the relevance of each instance according to whether or not it is included in the speech segment. Precision and recall are used as the criteria to represent the environmental preference when the denoising is applied. That is, a high precision means the segments selected by the speech segment detection are highly likely the speech segments even if a significant amount of speech segments are actually missed while a high recall means most of actual speech segments are selected by the speech segment detection even if a significant amount of the selected segments are not actual speech segments. F1 score is a combined metric of precision and recall, showing the overall accuracy of the speech segment detection.
P r e c i s i o n = T r u e P o s i t i v e s T r u e P o s i t i v e s + F a l s e P o s i t i v e s
R e c a l l = T r u e P o s i t i v e s T r u e P o s i t i v e s + F a l s e N e g a t i v e s
F 1 s c o r e = 2 * P r e c i s i o n * R e c a l l P r e c i s i o n + R e c a l l

3.2. Filtering Methods

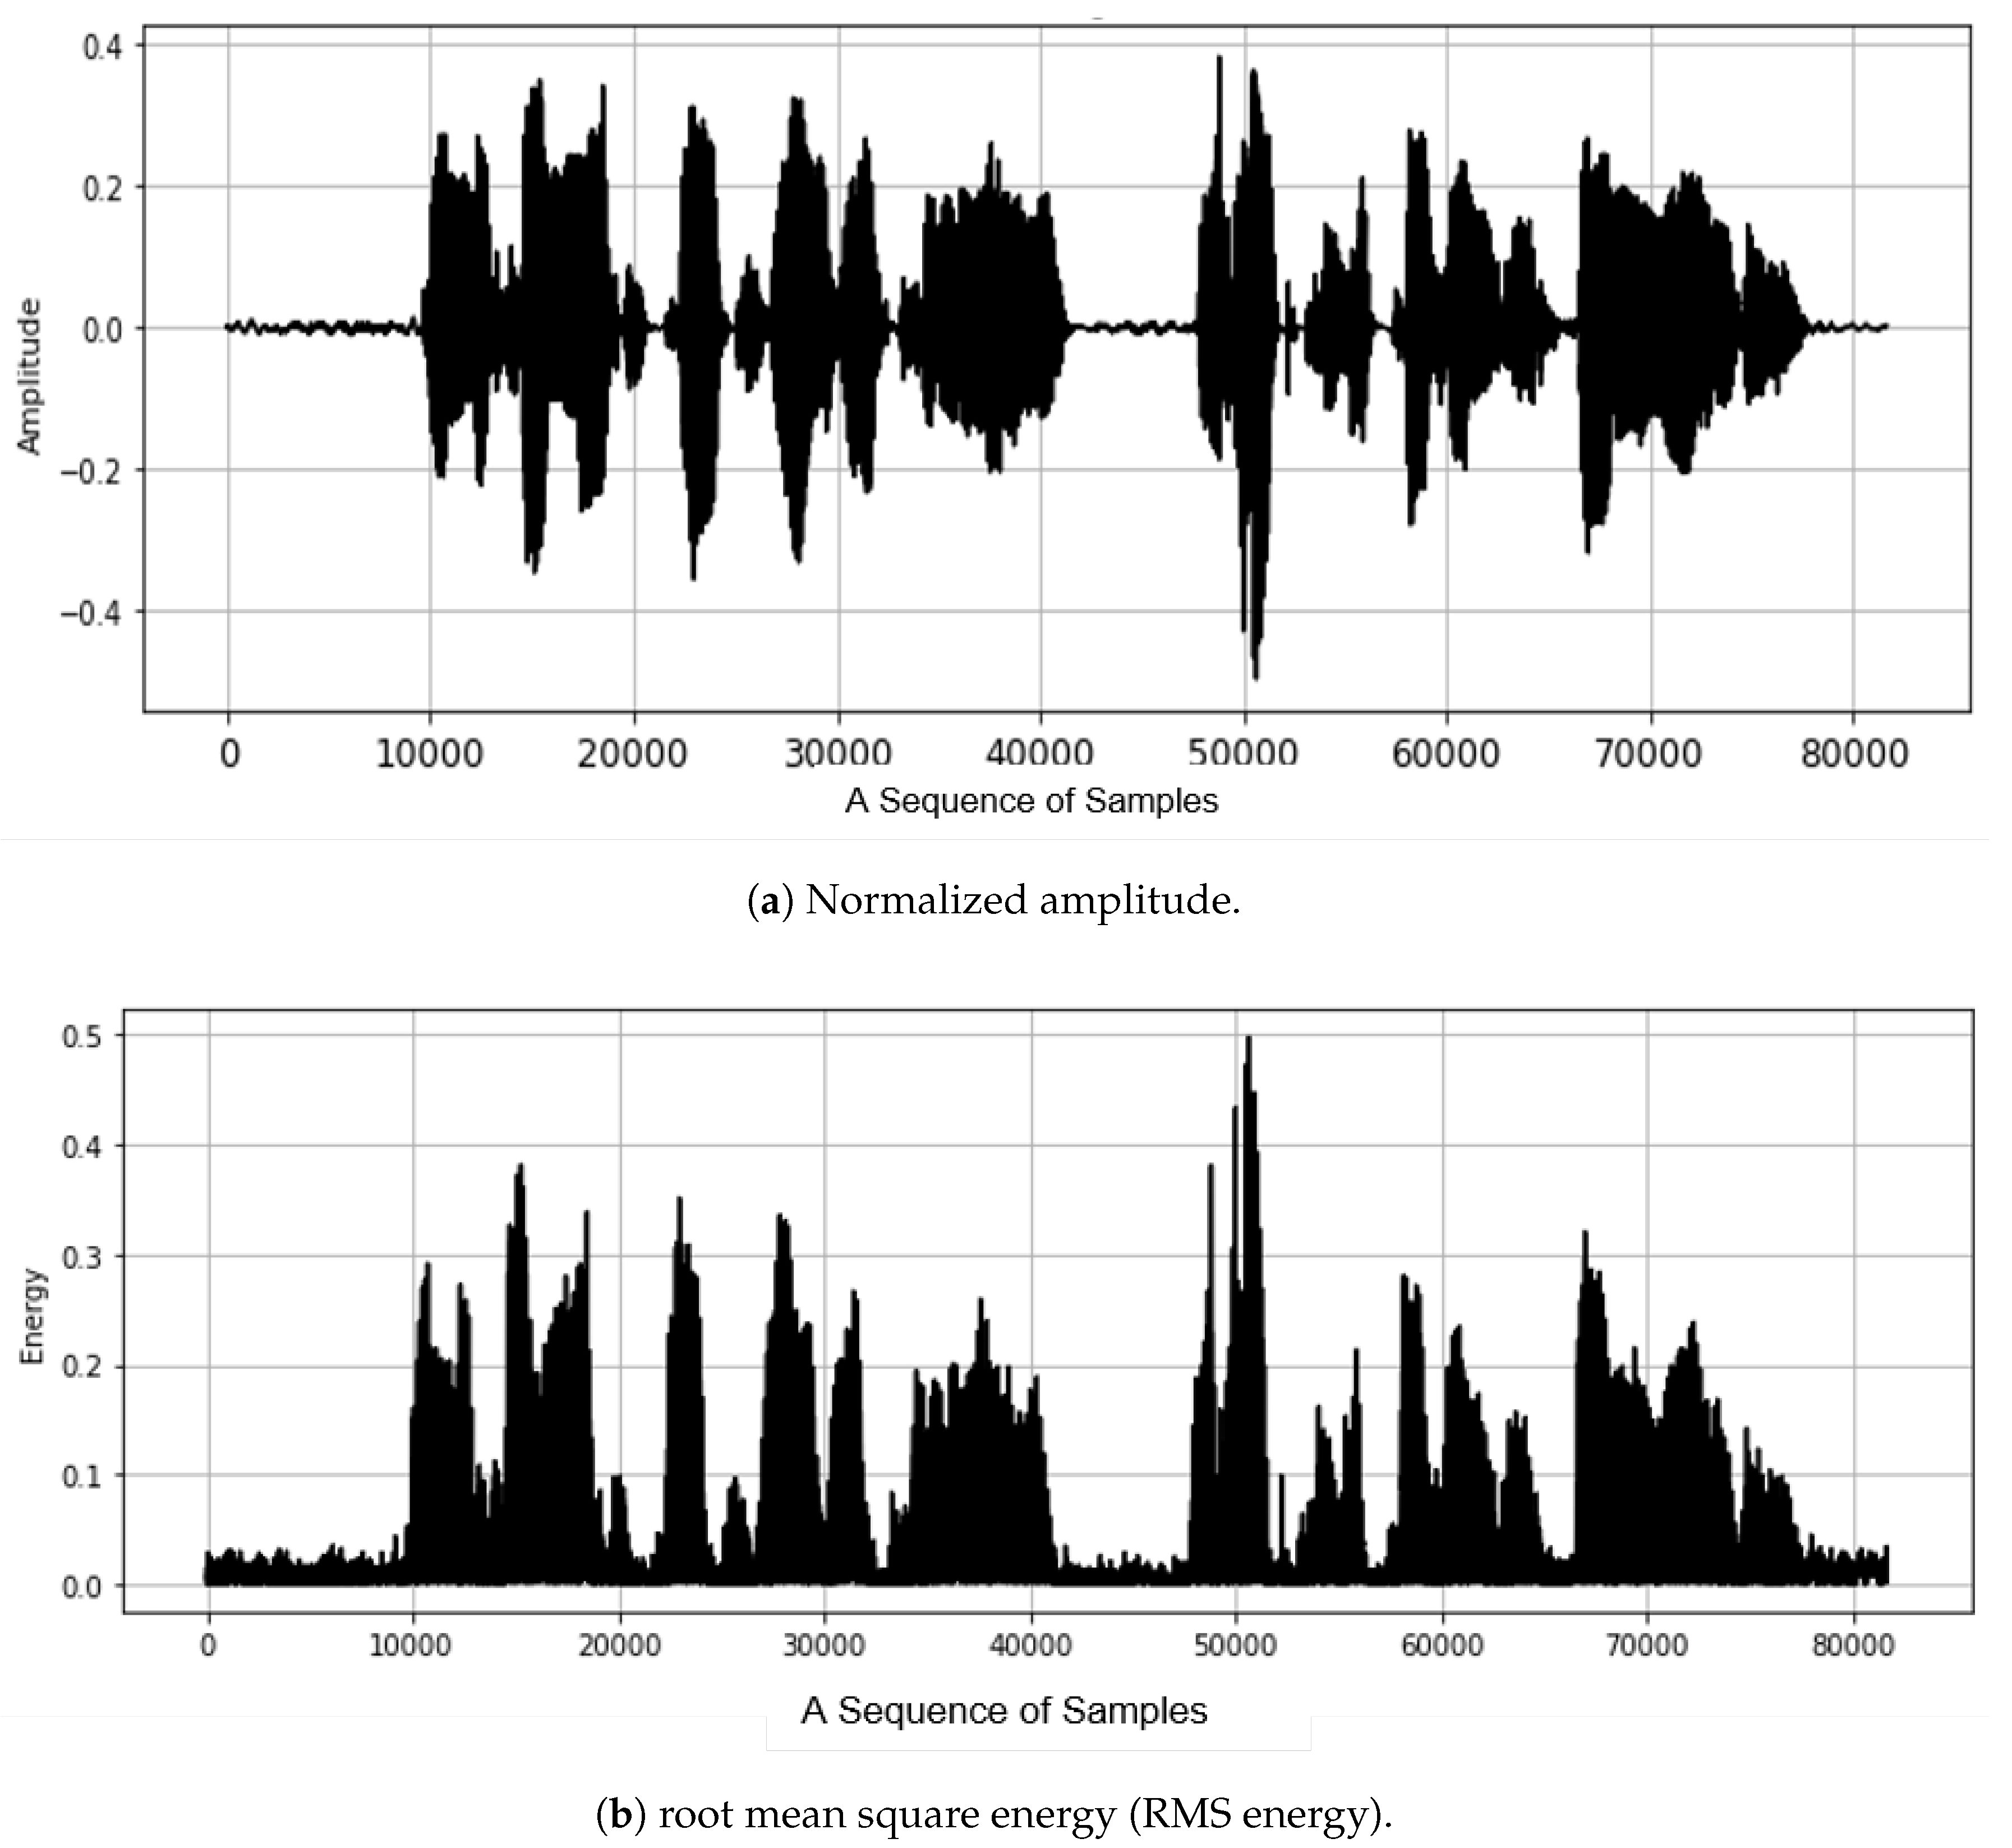
3.2.1. Energy-Based Filtering

In general, the signal energy remains the basic component to the feature vector [29]. Most of the standardized algorithms use energy besides other metrics to make a decision [29]. Thus, we present an energy-based filtering method to extract the segments containing the speech based on the energy. A common way to calculate the energy of a speech signal is the root mean square energy (RMS energy), which is the square root of the average sum of the squares of the amplitude of the signal samples [29]. In Equation (4) [29], we present the RMS energy E N ( t ) for a time point t. Here, n is the number of contiguous time points; x ( k ) is the amplitude for a time point k. In the experiment, we use 100 for n. Figure 6a illustrates the normalized amplitude (range: −1.0–1.0) of a sample audio signal; Figure 6b shows the RMS energy (range: 0.0–1.0) of the same sample according to Equation (4).
E N ( t ) = 1 n × k = t n / 2 t + n / 2 x ( k ) 2
In Equation (5) [29], we define the threshold. λ is used as a weight from 0 to 1 between the maximum and minimum RMS energy. Then, if E N ( t ) for a time point t in a time frame is greater than the threshold, we determine it as the speech segment; otherwise, we determine it as the non-speech segment.
T h r e s h o l d = ( 1 λ ) × max ( E N ) + λ × min ( E N )
In the energy-based filtering method, λ in Equation (5) is an important parameter affecting the accuracy of the method. Figure 7 shows the recall, precision, and F1 score of energy-based filtering as λ is varied from 0.1 to 1.0. For all the figures showing the recall, precision, and F1 score of the speech segment detection methods, we use a total 824 validation noise-speech data files and the corresponding clean speech data files (See Section 4). We use the same data files to measure the accuracy of all the methods in this section. We indicate that the most accurate result of energy-based filtering is observed when λ is 0.9, where the recall and F1 score are the highest. We note that we can increase the recall to 100% by setting λ as 1.0, but precision dramatically decreases. This implies that we have an adequate λ for a target environment.
Figure 8 illustrates the ideal answer for the speech segment detection, i.e., the clean speech file without noises; Figure 9 illustrates the result of applying the energy-based filtering method to a noisy speech data file, where the original clean speech signal is presented in orange and the speech segment extracted by energy-based filtering is in blue.

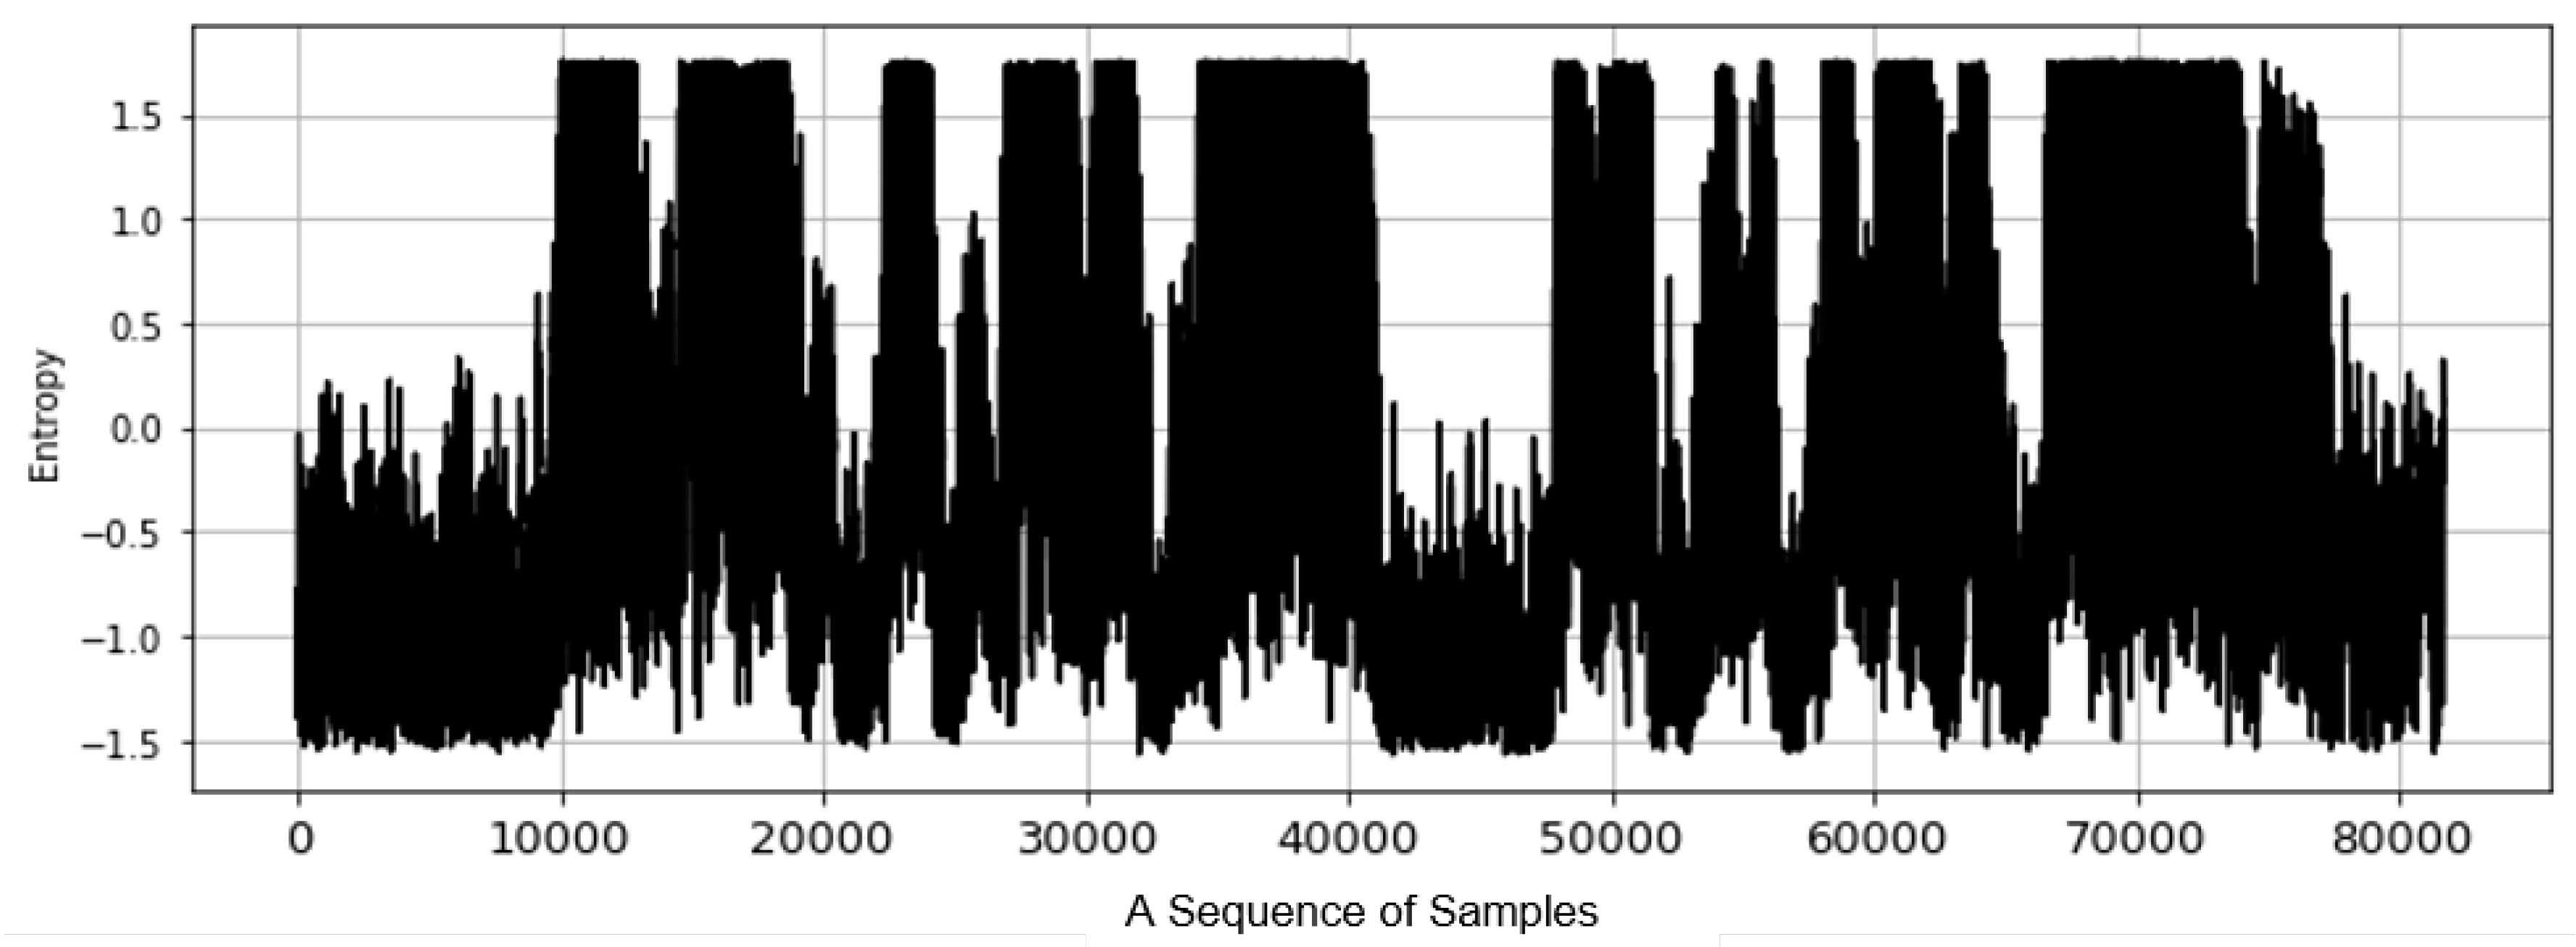
3.2.2. Entropy-Based Filtering

The entropy represents the statistical disorder and is used as a measure of the amount of information in the data [41]. Using the characteristic of the entropy, we present a method to detect the speech segments. We calculate the entropy based on the energy change before and after each time point in the speech data. In Equation (7) [37], we define the entropy H ( t ) for a time point t. Here, n is the number of contiguous time points. In the experiment, we use 10 for n. In Equation (6), we define the probability p ( t ) as the relative amplitude of a time point t as shown in Equation (6), where x ( t ) is the amplitude at t. Finally, we obtain the normalized entropy E ( t ) using the entropy H ( t ) , the average of entropy M for H ( k ) where ( t n / 2 ) k ( t + n / 2 ) , and standard deviation of entropy S for H ( k ) where ( t n / 2 ) k ( t + n / 2 ) , as shown in Equation (8).
p ( t ) = x ( t ) max x
H ( t ) = k = t l / 2 t + l / 2 p ( k ) × log ( p ( k ) )
E ( t ) = H ( t ) M S
Figure 10 illustrates the entropy value calculated according to Equation (8). In Equation (9), we define the threshold. λ is used as a weight from 0 to 1 between the maximum and minimum entropy value. Then, if E ( t ) for a time point t is greater than the threshold in Equation (9), we determine it as the speech segment.
T h r e s h o l d = ( 1 λ ) × max ( E ) + λ × min ( E )
In entropy-based filtering, λ is also an important parameter affecting the accuracy of the method like in energy-based filtering. Figure 11 shows the recall, precision, and F1 score of entropy-based filtering as λ is varied from 0.1 to 1.0. We indicate that the most accurate result of entropy-based filtering is observed when λ is 0.6, where the F1 score is the highest. Figure 12 illustrates the result of entropy-based filtering where the audio signal is presented in orange and the speech segment is in blue.

3.3. Fuzzy Clustering

Fuzzy clustering is used for clustering data based on a probability to be included in each cluster [39]. We present a method using fuzzy clustering to detect the speech segments. As the criteria for fuzzy clustering, we use both the energy and entropy because they can be used complementarily in the speech segment detection. That is, the entropy reflects the change of the signal while the energy considers the absolute value of the signal.
For each time point, fuzzy clustering outputs the probability of belonging to a certain cluster—speech or non-speech segments. Here, we establish the threshold as a probability to determine if a given sample is in speech or non-speech segments.
Figure 13 shows the accuracy variation of fuzzy clustering as the threshold is varied from 10% to 100%. In the result, we note that the precision is relatively constant while the recall decreases as the threshold increases. The F1 score is the highest when the threshold is 30%. Figure 14 illustrates the result of fuzzy clustering where the audio signal is presented in orange and the speech segment is in blue.

3.4. Filtering with Fuzzy Clustering

Now, we investigate methods that combine fuzzy clustering with energy-based or entropy-based filtering methods. Specifically, we first extract the speech segments using the filtering method, and then, conduct fuzzy clustering on only the segments that are excluded by the filtering method. We define two kinds of methods in this approach: (1) energy-based filtering with fuzzy clustering and (2) entropy-based filtering with fuzzy clustering. Similar to fuzzy clustering, we use a threshold probability for finding the best parameter setting.
Figure 15 shows the accuracy variation of energy-based filtering with fuzzy clustering as threshold is varied from 10% to 100%. In the result, we note that the recall decreases significantly, but precision increases slightly as the threshold increases. When the threshold is 50%, the precision and the F1 score are the highest. Figure 16 illustrates the results of energy-based filtering with fuzzy clustering. Here, we note that this method recovers some segments that have been excluded by the energy-based filtering method.
Figure 17 shows the accuracy variation of entropy-based filtering with fuzzy clustering as the threshold is varied from 10% to 100%. The overall trend is quite similar to energy-based filtering with fuzzy clustering. The F1 score is the highest when the threshold is 80%. Figure 18 illustrates the result of entropy-based filtering with fuzzy clustering. Similar to energy-based filtering with fuzzy clustering, this method also recovers the speech segments that have been excluded by entropy-based filtering.
We analyze the results of the filtering method, fuzzy clustering, and filtering with fuzzy clustering. Here, we show the result of entropy-based filtering, fuzzy clustering, and entropy-based filtering with fuzzy clustering. Figure 19 represents the distribution of data sets according to each method where the x-axis represents the entropy and y-axis the energy by the audio signal. Figure 19a represents the answer classification of speech and non-speech segments. Figure 19b represents the classification after entropy-based filtering. Here, we indicate that this simple filtering method can effectively classify speech and non-speech signals, but some speech signals are classified as non-speech signals. Figure 19c represents the classification of fuzzy clustering for all the audio signals. Figure 19d represents the classification of fuzzy clustering only for non-speech signals that have been excluded by entropy-based filtering. Here, we note that, fuzzy clustering can recover some signals that have been excluded by entropy-based filtering. Figure 19e represents the final result of entropy-based filtering with fuzzy clustering.

3.5. Smoothing

We perform the smoothing process for all the presented speech segment detection [42]. The smoothing process considers multiple contiguous time points before and after a time point and determines to detect the speech data considering those time points as the unit. Here, we use 200 audio samples before and after each time point, which corresponds to smoothing on a running window of 25 ms, and determine the time point is a speech or non-speech segment in which a larger number of time points belong.
Figure 20 illustrates the result of the speech segment detection if the smoothing process is applied or not when we use fuzzy clustering. Specifically, Figure 20a illustrates the result of the speech segment detection before smoothing; Figure 20b illustrates the result of it after smoothing. The blue-filled areas show that the speech and non-speech segments are sliced into multiple time points. By the smoothing process, we can determine whether a time point is in a speech or non-speech segment by considering adjacent time points in a time frame as depicted in Figure 20b. As a result, we note that some segments that have been labelled as non-speech are now correctly labelled as speech. Here, we show only the result where fuzzy clustering is used for the speech segment detection, but for all the other methods, we apply the same smoothing process into the result of the speech segment detection.

4. Performance Evaluation

4.1. Experimental Environments and Method

In the experiments, we aimed to measure (1) the accuracy of the presented five methods for the speech segment detection and (2) the execution time and accuracy of the proposed method and Wavenet-based denoising [13]. The results of the first experiment could be used to choose the best speech segment method for a target environment. To define each environment, we used various SNR levels and show the results in terms of various evaluation metrics, i.e., recall, precision, and F1 score.
For the first experiment, we used clean speech data files generated in a quiet environment as the ideal answer. We then measured the recall, precision, and F1 score of the files where each speech segment detection method was applied for the noisy-speech files based on the clean data files.
For the second experiment, we used the representative evaluation metrics for measuring the accuracy of denoising: SNR, STOI, and PESQ [43]. The proposed strategy reduced the overall length of the audio files due to the speech segment detection. Thus, we needed to consider how to compare the accuracy of denoising methods when their lengths were different. To resolve this problem, we designed three kinds of experiments. First, we attached the non-speech segments that were excluded by the speech segment detection in our proposed strategy into the final denoised results to align it with the result of Wavenet-based denoising results. It absolutely decreased the overall accuracy, but we showed that it was still effective even if non-speech segments without denoising were included in the final results. Second, we adjusted both clean and noisy-speech data files and the result of Wavenet-based denoising to have the same aligned length with the proposed strategy, i.e., the result of the speech segment detection. That is, we compared the speech segments only in both methods. Third, we compared the accuracy on the final results of methods while aligning the clean and noisy-speech data file with denoised results of each method. Even if the comparison segments between the methods became different, it was worth to show the final results of each method.
We usde speech data sets provided by Edinburgh DataShare (https://datashare.is.ed.ac.uk/). The training data files contained 4105 sentences spoken by ten native speakers, each in a noisy and quiet environment, respectively; the validation data files consisted of 824 sentences spoken by two native speaker in a quiet and noisy environment, respectively. Table 1 shows the characteristics of the data set used for the validation. We classified the entire data set into three groups according to the SNR. The dB range for the low SNR group was [−∞, 2]; that for the medium SNR group is (2, 10]; that for the high SNR group was (10, ∞]. The table shows the number of data sets, SNR, signal length, and portion of speech segments for each group. This implied that we needed to verify the effect of the speech segment detection and denoising with a variety of SNRs because the SNR fluctuated greatly for each group.
For the experiment, we use an Amazon machine image equipped with 64 GB of RAM, 4 CPUs, Tesla K80 of GPU, and 10 GB of GPU memory.

4.2. Results and Discussion

4.2.1. The Accuracy of the Speech Segment Detection Methods

We compared the accuracy of the presented five speech segment detection methods: (1) energy-based filtering, (2) entropy-based filtering, (3) fuzzy clustering, (4) energy-based filtering with fuzzy clustering, and (5) entropy-based filtering with fuzzy clustering. To this purpose, we measured the recall, precision, and F1 score of each method based on the clean speech data files. For this experiment, we used all the files of the validation dataset.
Table 2 shows the recall, precision, and F1 score for the speech segment detection methods according to different SNR groups. In this experiment, we determined a threshold (or λ ) for each speech segment detection method, which was a parameter that affected on the accuracy of each method as presented in Section 3, that showed the highest F1-score under the condition that the recall was greater than the precision so as to reduce filtering of speech segments. However, this criteria could be changed for each target environment. The result indicated that the best method became different according to the group of SNRs. Specifically, the energy-based filtering with fuzzy clustering showed the best accuracy for the low SNR group; the fuzzy clustering method for the medium SNR group; the energy-based filtering for the high SNR group. This implied that our preprocessing strategy could be used to find the best speech segment detection methods for a target SNR. We also noted that we could adjust the threshold (or λ ) to control the recall and the precision. According to Figure 7, Figure 11, Figure 13, Figure 15 and Figure 17, we observed the trade-off relationship between the recall and the precision by controlling the threshold (or λ ). As a result, we could choose an adequate threshold for a target requirement. For example, for environments where any segments including the speech should not be excluded, we could choose a parameter setting that shows almost 100% of recall.

4.2.2. The Execution Time of Denoising

Table 3 shows the execution times for Wavenet-based denoising and the proposed method. Here, we used all the files of the validation dataset. In measuring the execution time, we did not consider a variety of SNRs because its effects were negligible. The results reveal that the proposed method significantly reduced the execution time of Wavenet-based denoising by 40.06∼50.76% according to the used speech segment detection method. This shows the significance of reducing the denoising time because the original Wavenet-based denoising required much more time in denoising (i.e., 3867 s) than even the original signal length (i.e., 2072.04 s) in our environmental setting. We note that the proposed method could reduce the denoising time significantly, which was less than the original signal length.

4.2.3. The Accuracy of Denoising

Table 4, Table 5 and Table 6 show the SNR, STOI, and PESQ of the proposed method and Wavenet-based denoising with a variety of SNRs, respectively. In addition, we show the results of noisy speech data sets as a comparison. Here, we used all the files of the validation dataset. Each table shows the comparison results of the speech segments and non-speech segments targeting different segments. Table 4 shows the comparison of denoising performance for both speech and non-speech segments. Because our strategy excluded the non-speech segments, we attached the original non-speech segments without denoising to align its total length with the result of Wavenet-based denoising. Obviously, the overall accuracy of the proposed strategy was less than Wavenet-based denoising. However, this result indicated that the proposed strategy was quite effective (i.e., STOI shows better) even in the case where we utilized the original non-speech segments without denoising.
Table 5 shows the comparison of denoising performance only for the speech segments. Here, we used only the speech segments in Wavenet-based denoising as well. The result showed that both methods had similar denoising performance for the speech segments.
Table 6 compares the denoising performance for the final result of each method. Due to the speech segment detection in the proposed strategy, the overall length was different by the method, but it is worth showing the final result of the method. The overall improvement of the proposed strategy showed the evidence that non-speech segments, which were excluded by the proposed strategy, were much more noisy than the speech segments. The result indicates that the overall quality of speech was improved, however, some speeches could be excluded by the speech segment detection. To complement this case, we could adjust a parameter of the speech segment detection method to increase the recall as shown in Section 3.
For all the experiments, we measured the results for all the speech segment detection methods with the best threshold (or λ ) setting for each group of SNRs to check their accuracy variation with a variety of SNRs. The result showed that the best speech segment detection method for denoising was different by the SNR group and the evaluation metric, which are represented in bold. This implied that we needed to select the most effective speech segment detection method of denoising for a target SNR and evaluation metric. We summarize the results that the proposed strategy was comparable to Wavenet-based denoising while reducing the execution time for denoising of Wavenet-based denoising significantly (i.e., by 40.06∼50.76% as presented in Table 3).
Figure 21 and Figure 22 illustrate the denoised results of the proposed method representing two actual sample data. Figure 21a and Figure 22a illustrate the original noisy-speech data, which were the target for denoising. Figure 21b and Figure 22b illustrate the result of the speech segment detection. Here, we note that the non-speech segments were excluded while the noises in the speech segments are maintained. Figure 21c and Figure 22c illustrate the denoised result of the proposed method; Figure 21d and Figure 22d the clean speech data. We note that the noises were eliminated in Figure 21c and Figure 22c compared to Figure 21b and Figure 22b and the denoised result data became close to the clean speech data. We also indicate that the time axis of the proposed method was shortened by processing of the speech segment detection, which improved the denoising speed.

5. Conclusions

In this paper, we have proposed a preprocessing strategy for denoising of speech data based on the speech segment detection. A design of computationally efficient speech denoising is necessary to develop a scalable method for large-scale data sets. Furthermore, as the deep learning-based methods have been developed, its necessity becomes more important because they show the high performance in general while requiring significant costs. The basic idea of the proposed method is using the speech segment detection so as to exclude non-speech segments before denoising. The speech segmentation detection can exclude non-speech segments effectively, which will be removed in denoising process with a significant cost.
As further study, we plan to incorporate the proposed strategy, i.e., effective preprocessing of denoising, to build a training model for denoising of the speech data. Two goals are (1) reducing the time to build the training model and (2) improving the denoising accuracy of the model. Here, the main issue will be that we need to figure out the characteristics of a data set for a target environment, e.g., the SNR type and evaluation metric, before building the training model so as to use the most effective speech segment detection method tailored to the target data set. Another issue is the investigation on constructing an adaptive model that learns the change of the characteristics of data sets because the most effective speech segment detection method becomes different as data sets are updated or new data are added.
In this paper, we have investigated the speech segment detection methods for pre-processing of deep learning-based denoising, which require significant processing and training costs, and have improved the denoising speed by eliminating the segments that can be clearly determined by the speech segment detection. Significant overheads of the deep learning-based methods are valid in many other problems and domains as well. Especially, deep learning models in embedded devices such as mobile or IoT devices require efficient processing. The examples are the face recognition model on a single-board computer [44], real-time DNN model in mobile devices [45], and emotion recognition in Rasberry Pi [46]. As a result, the proposed strategy, i.e., pre-processing for excluding unnecessary parts with a negligible cost, which incur significant overhead in the deep learning process, can be adapted and investigated to the deep-learning based methods for the other problems.

Author Contributions

Conceptualization, S.-J.L. and H.-Y.K.; methodology, S.-J.L. and H.-Y.K.; validation, S.-J.L. and H.-Y.K.; data curation, S.-J.L.; writing—original draft preparation, S.-J.L. and H.-Y.K.; writing—review and editing, H.-Y.K.; supervision, H.-Y.K.; project administration, H.-Y.K.; funding acquisition, H.-Y.K. All authors have read and agreed to the published version of the manuscript.

Funding

This work was supported by the National Research Foundation of Korea (NRF) grant funded by the Korea government (MSIT) (No. 2018R1C1B5084424).

Conflicts of Interest

The authors declare no conflict of interest.

References

  1. Gui, Y.; Kwan, H.K. Adaptive subband Wiener filtering for speech enhancement using critical-band gammatone filterbank. In Proceedings of the 48th Midwest Symposium on Circuits and Systems, Covington, GA, USA, 7–10 August 2005; pp. 732–735. [Google Scholar]
  2. Soon, Y.; Koh, S.N.; Yeo, C.K. Wavelet for speech denoising. In Proceedings of the IEEE TENCON’97, Brisbane, Australia, 4 December 1997; pp. 479–482. [Google Scholar]
  3. Wilson, K.W.; Raj, B.; Smaragdis, P.; Divakaran, A. Speech denoising using nonnegative matrix factorization with priors. In Proceedings of the 2008 IEEE International Conference on Acoustics, Speech and Signal Processing, Las Vegas, NA, USA, 31 March–4 April 2008; pp. 4029–4032. [Google Scholar]
  4. Venkateswarlu, S.C.; Prasad, K.S.; Reddy, A.S. Improve Speech Enhancement Using Wiener Filtering. Glob. J. Comput. Sci. Technol. 2011, 11, 30–38. [Google Scholar]
  5. Stahl, V.; Fischer, A.; Bippus, R. Quantile based noise estimation for spectral subtraction and Wiener filtering. In Proceedings of the IEEE International Conference on Acoustics, Speech, and Signal Processing, Istanbul, Turkey, 5–9 June 2000; pp. 1875–1878. [Google Scholar]
  6. Hidayat, R.; Bejo, A.; Sumaryono, S.; Winursito, A. Denoising speech for mfcc feature extraction using wavelet transformation in speech recognition system. In Proceedings of the 2018 10th International Conference on Information Technology and Electrical Engineering (ICITEE), Bali, Indonesia, 24–26 July 2018; pp. 280–284. [Google Scholar]
  7. Vincent, P.; Larochelle, H.; Lajoie, I.; Bengio, Y.; Manzagol, P.A.; Bottou, L. Stacked denoising autoencoders: Learning useful representations in a deep network with a local denoising criterion. J. Mach. Learn. Res. 2010, 11, 3371–3408. [Google Scholar]
  8. Lu, X.; Tsao, Y.; Matsuda, S.; Hori, C. Speech enhancement based on deep denoising autoencoder. In Proceedings of the Interspeech 2013, Lyon, France, 25–29 August 2013; pp. 436–440. [Google Scholar]
  9. Feng, X.; Zhang, Y.; Glass, J. Speech feature denoising and dereverberation via deep autoencoders for noisy reverberant speech recognition. In Proceedings of the 2014 IEEE International Conference on Acoustics, Speech and Signal Processing (ICASSP), Florence, Italy, 4–9 May 2014; pp. 1759–1763. [Google Scholar]
  10. Xia, B.; Bao, C. Speech enhancement with weighted denoising auto-encoder. In Proceedings of the Interspeech 2013, Lyon, France, 25–29 August 2013; pp. 3444–3448. [Google Scholar]
  11. Tawara, N.; Kobayashi, T.; Ogawa, T. Multi-Channel Speech Enhancement Using Time-Domain Convolutional Denoising Autoencoder. In Proceedings of the Interspeech 2019, Graz, Austria, 15–19 September 2019; pp. 86–90. [Google Scholar]
  12. Chuang, F.K.; Wang, S.S.; Hung, J.W.; Tsao, Y.; Fang, H.S. Speaker-Aware Deep Denoising Autoencoder with Embedded Speaker Identity for Speech Enhancement. In Proceedings of the Interspeech 2019, Graz, Austria, 15–19 September 2019; pp. 3173–3177. [Google Scholar]
  13. Rethage, D.; Pons, J.; Serra, X. A wavenet for speech denoising. In Proceedings of the IEEE International Conference on Acoustics, Speech and Signal Processing (ICASSP), Calgary, AB, Canada, 15–20 April 2018; pp. 5069–5073. [Google Scholar]
  14. Fu, S.W.; Tsao, Y.; Lu, X.; Kawai, H. Raw waveform-based speech enhancement by fully convolutional networks. In Proceedings of the 2017 Asia-Pacific Signal and Information Processing Association Annual Summit and Conference (APSIPA ASC), Kuala Lumpur, Malaysia, 12–15 December 2017; pp. 6–12. [Google Scholar]
  15. Fu, S.W.; Tsao, Y.; Lu, X. SNR-Aware Convolutional Neural Network Modeling for Speech Enhancement. In Proceedings of the Interspeech 2016, San Francisco, CA, USA, 8–12 September 2016; pp. 3768–3772. [Google Scholar]
  16. Maas, A.; Le, Q.V.; O’Neil, T.M.; Vinyals, O.; Nguyen, P.; Ng, A.Y. Recurrent neural networks for noise reduction in robust ASR. In Proceedings of the Interspeech 2012, Portland, OH, USA, 9–13 September 2012; pp. 22–25. [Google Scholar]
  17. Zhao, H.; Zarar, S.; Tashev, I.; Lee, C.H. Convolutional-recurrent neural networks for speech enhancement. In Proceedings of the 2018 IEEE International Conference on Acoustics, Speech and Signal Processing (ICASSP), Calgary, AB, Canada, 15–20 April 2018; pp. 2401–2405. [Google Scholar]
  18. Wang, Y.; Skerry-Ryan, R.J.; Stanton, D.; Wu, Y.; Weiss, R.J.; Jaitly, N. Tacotron: Towards end-to-end speech synthesis. arXiv 2017, arXiv:1703.10135. [Google Scholar]
  19. Brakel, P.; Stroob, T.D.; Schrauwen, B. Bidirectional truncated recurrent neural networks for efficient speech denoising. In Proceedings of the Interspeech 2013, Lyon, France, 25–29 August 2013; pp. 2973–2977. [Google Scholar]
  20. Vanhoucke, V.; Senior, A.; Mao, M.Z. Improving the Speed of Neural Networks on CPUs. Deep Learning and Unsupervised Feature Learning Workshop, NIPS 2011, Granada, Spain, 12–17 December 2011; pp. 1–8. [Google Scholar]
  21. Drakopoulos, F.; Baby, D.; Verhulst, S. Real-time audio processing on a Raspberry Pi using deep neural networks. In Proceedings of the 23rd International Congress on Acoustics (ICA 2019), Aachen, Germany, 9–13 September 2019; pp. 2827–2834. [Google Scholar]
  22. Tashev, I.; Mirsamadi, S. DNN-based causal voice activity detector. In Proceedings of the Information Theory and Applications Workshop, La jolla, USA, 31 January–5 February 2016. [Google Scholar]
  23. Wang, K.C. Robust Audio Content Classification Using Hybrid-Based SMD and Entropy-Based VAD. Entropy 2020, 22, 183. [Google Scholar] [CrossRef] [Green Version]
  24. Kalia, A.; Sharma, S.; Pandey, S.K.; Jadoun, V.K.; Das, M. Comparative Analysis of Speaker Recognition System Based on Voice Activity Detection Technique, MFCC and PLP Features. In Intelligent Computing Techniques for Smart Energy Systems; Springer: Singapore, 2020; pp. 781–787. [Google Scholar]
  25. Kim, S.K.; Kang, S.I.; Park, Y.J.; Lee, S.; Lee, S. Power spectral deviation-based voice activity detection incorporating teager energy for speech enhancement. Symmetry 2016, 8, 58. [Google Scholar] [CrossRef] [Green Version]
  26. Lee, G.W.; Kim, H.K. Multi-Task Learning U-Net for Single-Channel Speech Enhancement and Mask-Based Voice Activity Detection. Appl. Sci. 2020, 10, 3230. [Google Scholar] [CrossRef]
  27. Johny, E.R.; Vasuki, P.; Mohanalin, J. Voice activity detection using fuzzy entropy and support vector machine. Entropy 2016, 18, 298. [Google Scholar] [CrossRef] [Green Version]
  28. Petsatodis, T.; Boukis, C.; Talantzis, F.; Tan, Z.H.; Prasad, R. Convex combination of multiple statistical models with application to VAD. IEEE Trans. Audio Speech Lang. Process. 2011, 19, 2314–2327. [Google Scholar] [CrossRef]
  29. Sakhnov, K.; Verteletskaya, E.; Simak, B. Approach for Energy-Based Voice Detector with Adaptive Scaling Factor. IAENG Int. J. Comput. Sci. 2009, 36, 4. [Google Scholar]
  30. Górriz, J.M.; Ramírez, J.; Segura, J.C.; Puntonet, C.G.; González, J.J. Noise subspace fuzzy c-means clustering for robust speech recognition. In Proceedings of the International Conference on Computational Science and Its Applications, Glasgow, UK, 8–11 May 2006; pp. 772–779. [Google Scholar]
  31. Ramírez, J.; Segura, J.C.; Benítez, C.; García, L.; Rubio, A. Statistical voice activity detection using a multiple observation likelihood ratio test. IEEE Signal Process. Lett. 2005, 12, 689–692. [Google Scholar] [CrossRef]
  32. Petsatodis, T.; Talantzis, F.; Boukis, C.; Tan, Z.H.; Prasad, R. Multi-sensor voice activity detection based on multiple observation hypothesis testing. In Proceedings of the Interspeech 2011, Florence, Italy, 28–31 August 2011; pp. 2633–2636. [Google Scholar]
  33. Tan, Z.H.; Dehak, N. rVAD: An unsupervised segment-based robust voice activity detection method. Comput. Speech Lang. 2020, 59, 1–21. [Google Scholar] [CrossRef]
  34. Ferrer, L.; Graciarena, M.; Mitra, V. A phonetically aware system for speech activity detection. In Proceedings of the 2016 IEEE International Conference on Acoustics, Speech and Signal Processing (ICASSP), Shanghai, China, 20–25 March 2016; pp. 5710–5714. [Google Scholar]
  35. Cavallaro, A.; Beritelli, F.; Casale, S. A fuzzy logic-based speech detection algorithm for communications in noisy environments. In Proceedings of the 1998 IEEE International Conference on Acoustics, Speech and Signal Processing, ICASSP’98 (Cat. No. 98CH36181), Seattle, USA, 12–15 May 1998; pp. 565–568. [Google Scholar]
  36. Ashihara, K. Hearing thresholds for pure tones above 16 kHz. J. Acoust. Soc. Am. 2007, 122, EL52–EL57. [Google Scholar] [CrossRef] [PubMed] [Green Version]
  37. Shannon, C.E. A Mathematical Theory of Communication. ACM Sigmobile Mob. Comput. Commun. Rev. 2001, 5, 3–55. [Google Scholar] [CrossRef]
  38. Jaiswal, R.; Hines, A. The Sound of Silence: How Traditional and Deep Learning Based Voice Activity Detection Influences Speech Quality Monitoring. In Proceedings of the 6th Irish Conference on Artificial Intelligence and Cognitive Science, Dublin, Ireland, 6–7 December 2018; pp. 174–185. [Google Scholar]
  39. Höppner, F.; Klawonn, F.; Kruse, R.; Runkler, T. Fuzzy Cluster Analysis: Methods for Classification, Data Analysis and Image Recognition; John Wiley & Sons: Hoboken, NJ, USA, 1999. [Google Scholar]
  40. Beliakov, G.; King, M. Density based fuzzy c-means clustering of non-convex patterns. Eur. J. Oper. Res. 2006, 173, 717–728. [Google Scholar] [CrossRef] [Green Version]
  41. Zhang, Y.; Tang, Z.M.; Li, Y.P.; Luo, Y. A hierarchical framework approach for voice activity detection and speech enhancement. Sci. World J. 2014, 2014, 723643. [Google Scholar] [CrossRef] [PubMed] [Green Version]
  42. Rabiner, L.; Sambur, M.; Schmidt, C. Applications of a nonlinear smoothing algorithm to speech processing. IEEE Trans. Acoust. Speech, Signal Process. 1975, 23, 552–557. [Google Scholar] [CrossRef]
  43. Janbakhshi, P.; Kodrasi, I.; Bourlard, H. Pathological speech intelligibility assessment based on the short-time objective intelligibility measure. In Proceedings of the ICASSP 2019–2019 IEEE International Conference on Acoustics, Speech and Signal Processing (ICASSP), Brighton, UK, 12–17 May 2019; pp. 6405–6409. [Google Scholar]
  44. Lindner, T.; Wyrwał, D.; Białek, M.; Nowak, P. Face recognition system based on a single-board computer. In Proceedings of the 2020 International Conference Mechatronic Systems and Materials (MSM), Bialystok, Poland, 1–3 July 2020; pp. 1–6. [Google Scholar]
  45. Niu, W.; Ma, X.; Lin, S.; Wang, S.; Qian, X.; Lin, X.; Ren, B. Patdnn: Achieving real-time DNN execution on mobile devices with pattern-based weight pruning. In Proceedings of the Twenty-Fifth International Conference on Architectural Support for Programming Languages and Operating Systems, Lausanne, Switzerland, 16–20 March 2020; pp. 907–922. [Google Scholar]
  46. Suja, P.; Tripathi, S. Real-time emotion recognition from facial images using Raspberry Pi II. In Proceedings of the 2016 3rd International Conference on Signal Processing and Integrated Networks (SPIN), Noida, India, 11–12 February 2016; pp. 666–670. [Google Scholar]
Figure 1. Denoising of speech data.
Applsci 10 07385 g001
Figure 2. The concept of the proposed preprocessing strategy for denoising.
Applsci 10 07385 g002
Figure 3. The architecture of Wavenet-based denoising [13].
Applsci 10 07385 g003
Figure 4. The overall process of the voice activity detection.
Applsci 10 07385 g004
Figure 5. The overall denoising process based on the speech segment detection.
Applsci 10 07385 g005
Figure 6. Normalized amplitude and RMS energy of a sample audio signal.
Applsci 10 07385 g006
Figure 7. The accuracy variation of energy-based filtering as λ is varied.
Applsci 10 07385 g007
Figure 8. The ideal answer of the speech segment detection.
Applsci 10 07385 g008
Figure 9. The result of energy-based filtering.
Applsci 10 07385 g009
Figure 10. Entropy of a sample audio signal.
Applsci 10 07385 g010
Figure 11. The accuracy variation of entropy-based filtering as λ is varied.
Applsci 10 07385 g011
Figure 12. The result of entropy-based filtering.
Applsci 10 07385 g012
Figure 13. The accuracy variation of fuzzy clustering as the threshold is varied.
Applsci 10 07385 g013
Figure 14. The result of fuzzy clustering.
Applsci 10 07385 g014
Figure 15. The accuracy variation of energy-based filtering with fuzzy clustering as the threshold is varied.
Applsci 10 07385 g015
Figure 16. The result of energy-based filtering with fuzzy clustering.
Applsci 10 07385 g016
Figure 17. The accuracy variation of entropy-based filtering with fuzzy clustering as the threshold is varied.
Applsci 10 07385 g017
Figure 18. The result of entropy-based filtering with fuzzy clustering.
Applsci 10 07385 g018
Figure 19. Analysis of the accuracy improvement of entropy-based filtering with fuzzy clustering.
Applsci 10 07385 g019
Figure 20. The result of using the smoothing process in fuzzy clustering.
Applsci 10 07385 g020
Figure 21. The denoised results of a sample p226 0 03.
Applsci 10 07385 g021aApplsci 10 07385 g021b
Figure 22. Denoised results of a sample p226 0 22.
Applsci 10 07385 g022aApplsci 10 07385 g022b
Table 1. The characteristics of the used data set.
Types of
Data Sets
Number of
Data Sets
Avg. of
SNR (dB)
Avg. of (Min∼Max)
Signal Length
(Seconds)
Portion of
Speech Segments (%)
Low SNR group2000.9152.469 (1.367∼9.768)46.05
Medium SNR group2276.1472.548 (1.320∼7.184)46.04
High SNR group39713.5552.518 (1.237∼8.509)46.70
Total data set8248.4462.514 (1.237∼9.768)46.34
Table 2. The recall, precision, and F1 score by speech segment detection methods.
Speech Segment
Detection Methods
Energy-Based
Filtering
Entropy-Based
Filtering
Fuzzy
Clustering
Energy-Based
Filtering with
Fuzzy Clustering
Entropy-Based
Filtering with
Fuzzy Clustering
Low SNR GroupThreshold(%)/λ0.80.5405080
Recall0.7790.8390.8760.8640.891
Precision0.7580.6520.6370.6420.626
F1 score0.7510.7190.7270.7260.725
Medium SNR GroupThreshold(%)/λ0.90.5506090
Recall0.9660.8290.8660.8690.871
Precision0.7050.8140.7900.7860.786
F1 score0.8090.8120.8170.8160.817
High SNR GroupThreshold(%)/λ0.90.6204070
Recall0.9430.9320.9450.9230.943
Precision0.9330.9140.9020.9190.902
F1 score0.9350.9200.9190.9170.918
Total GroupThreshold(%)/λ0.90.6305080
Recall0.9590.9410.9110.8900.910
Precision0.7730.7730.8060.8170.803
F1 score0.8390.8340.8440.8420.843
Table 3. The execution time and length comparison between the proposed method and Wavenet-based denoising.
Wavenet-Based
Denoising
Energy-Based
Filtering
Entropy-Based
Filtering
Fuzzy-Based
Clustering
Energy-Based
Filtering with
Fuzzy Clustering
Entropy-Based
Filtering with
Fuzzy Clustering
Denoising Time
(seconds)
386723181904199619382000
Signal Length
(seconds)
2072.041234.37945.501092.161044.861094.29
Denoising Time/Original Signal Length1.8661.120.9190.9630.9350.965
Table 4. The comparison of denoising performance for both speech and non-speech segments.
Denoising MethodsNoisyWavenet-Based Denoising [13]Energy-Based FilteringEntropy-Based FilteringFuzzy ClusteringEnergy-Based Filtering with
Fuzzy Clustering
Entropy-Based Filtering with
Fuzzy Clustering
Low SNR GroupSNR0.91514.5525.4087.5547.6697.6398.349
STOI0.8680.8640.8480.8460.8450.8430.846
PESQ1.4131.5511.2901.2251.2721.2291.223
Medium SNR GroupSNR6.14717.31112.21310.29910.57010.69410.749
STOI0.9130.8950.8980.9000.9010.8980.898
PESQ1.7571.8241.5151.5311.5771.5201.519
High SNR GroupSNR13.55519.63915.50415.74215.81115.56715.820
STOI0.9510.9140.9430.9420.9420.9420.941
PESQ2.3732.1402.2832.2022.2292.2382.200
Total GroupSNR6.87217.16712.127
STOI0.9100.8910.897
PESQ1.8471.8381.716
Table 5. The comparison of denoising performance only for the speech segments.
Denoising MethodsNoisyWavenet-Based Denoising [13]Energy-Based FilteringEntropy-Based FilteringFuzzy ClusteringEnergy-Based Filtering with
Fuzzy Clustering
Entropy-Based
Filtering with
Fuzzy Clustering
Low SNR GroupSNR1.31015.00314.75814.84614.86314.80314.872
STOI0.9110.9260.9270.9420.9410.9420.941
PESQ1.4591.6201.8261.6591.6421.6431.635
Medium SNR GroupSNR7.94019.12818.11118.22818.18918.15218.183
STOI0.9600.9700.9730.9510.9680.9670.963
PESQ2.0432.4322.1722.4482.3682.3642.371
High SNR GroupSNR16.49021.91921.04721.02820.99720.96620.991
STOI0.9850.9840.9820.9800.9820.9790.985
PESQ3.0783.4803.4463.3543.3333.3903.318
Total GroupSNR8.58018.70318.049
STOI0.9520.9590.967
PESQ2.1942.5112.573
Table 6. The comparison of denoising performance for the final result of each method.
Denoising MethodsNoisyWavenet-Based Denoising [13]Energy-Based FilteringEntropy-Based FilteringFuzzy ClusteringEnergy-Based Filtering with Fuzzy ClusteringEntropy-Based
Filtering with
Fuzzy Clustering
Low SNR GroupSNR0.91514.55214.75814.84614.86314.80314.872
STOI0.8680.8640.9270.9420.9410.9420.941
PESQ1.4131.5511.8261.6591.6421.6431.635
Medium SNR GroupSNR6.14717.31118.11118.22818.18918.15218.183
STOI0.9130.8950.9730.9510.9680.9670.963
PESQ1.7571.8242.1722.4482.3682.3642.371
High SNR GroupSNR13.55519.63921.04721.02820.99720.96620.991
STOI0.9510.9140.9820.9800.9820.9790.985
PESQ2.3732.1403.4463.3543.3333.3903.318
Total GroupSNR6.87217.16718.049
STOI0.9100.8910.967
PESQ1.8471.8382.573
Publisher’s Note: MDPI stays neutral with regard to jurisdictional claims in published maps and institutional affiliations.

