Article

The Flexural Fatigue Behavior of Honeycomb Sandwich Composites Following Low Velocity Impacts

by
Murat Yavuz Solmaz
1,* and
Tolga Topkaya
2
1
Mechanical Engineering Department, Engineering Faculty, Fırat University, 23100 Elazığ, Turkey
2
Mechanical Engineering Department, Engineering and Architecture Faculty, Batman University, 72100 Batman, Turkey
*
Author to whom correspondence should be addressed.
Appl. Sci. 2020, 10(20), 7262; https://doi.org/10.3390/app10207262
Submission received: 9 September 2020 / Revised: 13 October 2020 / Accepted: 14 October 2020 / Published: 17 October 2020

Abstract

:

Featured Application

Authors are encouraged to provide a concise description of the specific application or a potential application of the work. This section is not mandatory.

Abstract

This study experimentally investigated the flexural fatigue behaviors of honeycomb sandwich composites subjected to low velocity impact damage by considering the type and thickness of the face sheet material, the cell size and the core height parameters. Carbon-fiber reinforced composite and the aluminum alloy was used as the face sheet material. First, the static strength of undamaged and damaged specimens was determined by three-point bending loads. Secondly, the fatigue behaviors of the damaged and undamaged specimens were determined. Low velocity impact damage decreased the flexural strength and fatigue lives but increased the damping ratio for all specimens. Maximum damping ratio values were observed on specimens with a aluminum face sheet.

1. Introduction

Composites are fundamental materials in today’s engineering applications. The reason for their popularity is because they combine high strength with low weight. In particular, sandwich composites are preferred in applications requiring low weight [1,2,3]. Usually, aluminum and Nomex honeycomb are used as a core material to produce sandwich composites; on the other hand, carbon fiber-reinforced composites (CFRP) and auxetic materials in various geometries have also been used in recent years [3,4,5,6].
Honeycomb sandwich composites are formed by putting thick core structures in between thin and thick plates. The bonding between the plates and the honeycomb cells is achieved by structural adhesives that have numerous application areas [7,8]. Honeycomb structures are defined by low weight and high flexural rigidity characteristics, but they are also conveniently used to counter tensile, compression and flexural loads [9,10,11]
Unlike metals, composites do not have a homogeneous and isotropic structure. Damage is not seen due to local crack propagation. Fiber damage occurs through the formation of different damage mechanisms like matrix damage and delamination [12,13,14]. Tai et al. investigated fatigue after impact behavior of carbon epoxy composites. Fatigue tests are conducted under tensile-tensile loading. Results showed that tensile strength and the fatigue life of samples decreased with low velocity impact [15]. Koo et al. investigated the fatigue behavior of woven carbon–fiber-reinforced plastic after low velocity impact. Impact damage decreased the fatigue life of samples [16]. Uda et al. reported that the compression fatigue life of impacted samples reduced according to non-impacted samples. The damage growth of samples was inspected with a pulse-echo system. Results showed that the initial delamination growth occurred in the width direction and the delamination extended in the loading direction at the end of the fatigue life [17]. Nettles et al. investigated the compressive cyclic behavior of polymer matrix launch vehicle hardware. They reported that in most cyclic compression load cases, damage growth is not observed before ultimate failure or before the growth is very unstable [18]. Goidescu et al. reported that stable damage propagation is perpendicular to the loading direction in CFRP composites under tensile loading conditions. [19] Bogenfield et al. presented an energy-based method to determine the delamination propagation under a compression load. They reported that stable damage propagation observed in the loading direction [20]. The most common types of damage observed during honeycomb sandwich composite production are “malformation and adhesive failures” [21]. Subhani investigated the effect of the curing temperature of the film adhesive—used for bonding honeycomb cores and face sheet material together—on the flexural strength of the composite. The results of the study revealed that the optimum temperature and curing time for the film adhesive was 110 °C and 2 h, respectively [22]. In another study performed by Jen et al., their numerical and experimental investigation of four-point bending fatigue behaviors of honeycomb sandwich composites with different face sheet thicknesses, showed that the reason for the resulting damage formed in the specimens was delamination between the core and the face sheet materials [23]. Abbadi et al. investigated the fatigue behaviors of undamaged and damaged specimens by using four-point bending loads. The results obtained indicated that the damage formed had no effect on the static strength of specimens. It is reported that honeycomb sandwich panels’ fatigue life is more effected by drilling a hole than a Brinell defect. [24]. Schubel et al. stated that difficult-to-detect damage like delamination formed in sandwich composites after impact caused significant reductions in the strength of specimens [25]. Belingardi et al. investigated the effect of adhesive failure between cores and face sheet material on the fatigue life of honeycomb sandwich composites and reported that core crushing was observed in the regions of adhesive failure [26]. Shi et al. investigated the effect of aramid fiber-reinforcement of the interface to increase bonding between the honeycomb cores and the face sheet material and revealed that aramid fiber-reinforcement increased the strength of the specimen under bending and compression loading [27].
In the aviation industry, where honeycomb sandwich composites are primarily used, airplanes are subject to impact damage due to external factors like birds, stone and surface modes. Galehdari et al. experimentally, analytically and numerically analyzed the static and low velocity impact behaviors of reinforced honeycomb sandwich composites and showed that damage was usually observed in the shape of a “V”; their analysis results were in accordance with experimental results [28]. Baba experimentally investigated the low velocity impact behaviors of curved sandwich composites with a foam core and revealed that curved sandwich composites were stronger than flat sandwich composites under low velocity impact loading [29]. He et al. investigated the effect of design parameters on the impact behaviors of honeycomb sandwich composites. The parameters affecting impact loading the most were found to be face sheet thickness and honeycomb cell wall thickness, while core height was determined to be the most ineffective parameter [30].
To calculate changes in the damping ratio of materials under fatigue loading, hysteresis curves drawn using data obtained from tests can be used [31]. Another method used in determining the change in the damping ratio of a specimen is “damping change” [32]. Damping is defined as the amount of energy that materials absorb under cyclic stresses [33].
In the present study, the damage behaviors of honeycomb sandwich composites were experimentally investigated with three-point bending, low velocity impact, and fatigue before and after impact. The static strengths of specimens were determined by three-point bending loads, and then they were subjected to fatigue tests to determine the fatigue lives of undamaged specimens. Impact damage—a type of damage commonly observed in applications where honeycomb sandwich composites are used—was investigated by a low velocity impact testing, and damaged specimens were subjected to a fatigue test, and then the effect of impact damage on fatigue lives was investigated.

2. Materials and Methods

The core material of the honeycomb used was an Al-3003 alloy. Honeycomb cores were placed in between two different face sheet materials, one Al-5754 and the other a carbon fiber-reinforced composite plate. As reinforcement material, 0°/90° twill weave carbon fiber with a density of 300 gr/m2 was used. Epoxy resin was chosen as the matrix material. Adhesion between the face sheet materials and the honeycomb cores was provided by 3M 2216 epoxy-based adhesive.
The honeycomb cores had cell sizes of 6.35 mm and 9.525 mm in diameter (D) and 10 mm, 15 mm and 20 mm in height (T). Face sheet materials had various thicknesses: 0.5 mm, 1 mm and 1.5 mm. These materials produced a composite sample of 80 mm in width and 135 mm in length. The honeycomb sandwich composite layers are shown in Figure 1, while a specimen labeling list and specimen properties for each label are shown in Table 1. There were 45 samples produced for each configuration (3 samples for undamaged static test, 3 samples for 5 J impacted static test, 3 samples for 10 J impacted static test, 12 samples for undamaged fatigue test, 12 samples for 5 J impacted fatigue test, 12 samples for 10 J impacted fatigue test).
Face sheet materials were first ground with 180 grade sandpaper in accordance with the 3M 2216 adhesive user instructions, and then the aluminum plates were cleaned with acetone, while the composite plates were cleaned with isopropyl alcohol.
Jen et al. indicated that an 0.7 kg/m2 amount of adhesive achieved a maximum flexural strength [34]; therefore, 7.5 g of adhesive, corresponding to that amount, was applied to the cleaned side of the face sheet materials with a spatula. After applying adhesive to a single face, the samples were kept under a 2.5 kg weight for 24 h, and then adhesive was applied to the other face. Before performing tests, all specimens were left at room temperature for 1 week to ensure completion of the adhesive curing process.
The mechanical properties of the materials used are determined according to the ASTM E8, ASTM D3039, ASTM D7078 standards. The mechanical properties of the 3M 2216 adhesive, and the Al-5754 and Al-3003 alloys, are shown in Table 2, while the mechanical properties of the CFRP composite are shown in Table 3. E1 and E2 are the longitudinal and transverse elastic modulus, ν12 is Poisson’s ratio, G12 is the shear modulus, and XT and XC are longitudinal tensile and compressive strengths, respectively. XC, YC and S are longitudinal compressive strength, transverse compressive strength and shear strength, respectively.

2.1. Static Tests

Flexural tests were performed in accordance with the ASTM C393 standard at a 1 mm/min loading rate using Shimadzu Universal test equipment with a 250 kN load cell. During three-point bending tests, a load was applied with a 30 mm-diameter cylinder. The span length between the 30 mm-diameter supports was 80 mm. Figure 2 shows the application of the load to the specimen.

2.2. Impact Tests

Impact tests were carried out using CEAST Fractovis Plus impact test equipment with a capacity of 1800 Joules and a 22 kN load cell. A pneumatic anti-rebound system was used to prevent repetitive impacts. A 12.7 mm diameter steel hemispherical strike face, weighing 5120 g, was used during these tests. Tests were done at 5 Joule and 10 Joule impact energies. During the impact, upper and lower supports of 76 mm in diameter were used to hold the specimen. The impact test procedure and the results obtained can be seen in reference [35]. Figure 3 shows the low velocity impact test setup.

2.3. Fatigue Tests

Fatigue tests were conducted using Shimadzu Servo-Hydraulic Fatigue test equipment with a 100 kN load cell. First, the fatigue behaviors of the materials used in producing the sandwich composites were determined using a 5 Hz frequency. Load was applied to specimens as a sine wave and an R (σminmax) of 0.1 was used. Fatigue tests were performed for aluminum, the 3M 2216 adhesive and the composite materials, for values below static damage loads. Figure 4 shows stress vs. cycles to failure graphs for the Al 5754 face sheet, the 3M 2216 adhesive and the CFRP under tensile loading. During fatigue tests, a load was applied with a 30 mm-diameter cylinder. The span length between the 30 mm-diameter supports was 80 mm.
Sandwich composites, whose strength values were determined by static tests, were subjected to testing both without impact and with impacts of variable energies; after that, fatigue tests were carried out. For fatigue tests, three-point bending loads were applied to specimens as for the static tests. Damaged specimens were subjected to fatigue tests using the load values determined by the static values of undamaged specimens. The reason for this was to determine changes in fatigue behaviors of damaged specimens with respect to undamaged specimens. All fatigue tests were conducted with Force control.
All fatigue tests were repeated three times and mean values were used, while fatigue graphs were drawn to avoid confusion. Because of decreases in the strengths of specimens with preliminary impact damage, fatigue tests were not performed for some values.

3. Results and Discussion

This study experimentally investigated the effect of preliminary impact damage on the fatigue behaviors of honeycomb sandwich composites. Preliminary impact damage was formed at impact energies of 5 Joules and 10 Joules as a result of low velocity impact tests. Impact results showed that upper face sheets perforated for 0.5 mm and 1 mm face sheet thickness values for CFRP face sheet material. For 1.5 mm CFRP and all aluminum face sheet thicknesses, no perforation was observed on upper face sheets but regional delamination was seen between core material and face sheet. The effects of the preliminary impact damage on the strength and fatigue lives of specimens were investigated by flexural tests. Damage growth of the specimens was not observed in all tests. This constitutes a shortcoming for this article and it is planned to examine damage growth in future studies. The results obtained are given below.

3.1. Flexural Tests

Figure 5 shows the images of specimens—with aluminum and CFRP face sheet materials—obtained after three-point bending tests for different face sheet thicknesses. Examining the images, in the model with an aluminum face sheet of 0.5 mm thickness, face wrinkling damage was observed at the first contact point of the cylinder used to apply the load. This damage was seen to be less in the model with a 1 mm face sheet thickness, while it was not seen in the specimen with a 1.5 mm face sheet thickness.
For specimens with a 0.5 mm thick CFRP face sheet, local crushing was dominant in the honeycomb core to which the load was applied. The amount of deflection increased with increasing face sheet thickness and the highest flexural damage was observed in the model with a face sheet thickness of 1.5 mm (Figure 5).
There was no surface damage observed in specimen 6CFRP10a with a 0.5 mm face sheet thickness, while face sheet material damage was determined in the specimens with thicknesses of 1 and 1.5 mm.
The first damage type seen in the core at the beginning of the test was cracks in the cell walls. With the continuation of the test, crushing of the cell walls and adhesive damage of the cell walls were observed. With the catastrophic failure seen in the samples, the damage has been concentrated especially in the support areas.
Figure 6 shows applied force vs. deflection graphs for pristine specimens with aluminum and CFRP face sheet materials. For both face sheet materials, increasing face sheet thickness increased flexural strength. Moreover, for the same load values, deflection decreased due to increased face sheet thickness. For example, in the specimens with an aluminum face sheet, the amounts of deflection under a 2000 N load were measured to be 1.133 mm, 0.917 mm and 0.524 mm for 6AL10a, 6AL10b and 6AL10c specimens, respectively.
Increased face sheet thickness reduced the amount of damage formed on the face sheet after impact tests. Similarly, increasing face sheet thickness decreased flexural strength more after impact. The reason for this was that during impact loading on increasing face sheet thicknesses, more of the applied load was transferred to the cores.

3.2. Fatigue Tests

Impact failure may happen any time during the lifetime of the structures. Impact failure can be observed aviation structures such as airplanes due to bird strikes or collision of ground vehicles. The main aim of this paper is to investigate the effect of impact damage on the fatigue life of honeycomb sandwich structures. The fact that impact damage was not examined for the later stages of fatigue damage constitutes the missing aspect of this study. Sandwich structures suffers not only flexural loads but also compression or membrane stretch loads.
Figure 7a shows the fatigue graphs of specimen 6AL10a with a 0.5 mm-thick aluminum face sheet obtained under three-point bending loads. It was seen that impact testing decreased the fatigue strength of specimens for all loading ratios. Reductions in fatigue strength increased as the applied loading ratio (r = Ffatigue/Fultimate) increased. The greatest fatigue life decrease (59%) was determined at r = 0.7.
Figure 7b shows the loading ratio vs. cycles to failure graphs for 6AL10b specimens obtained from fatigue tests. Decreasing the loading ratio decreased the impact effect. For a loading ratio of 0.9, the average life of undamaged specimens was 1767 cycles, while the average life of the specimen damaged by 10 Joules of impact energy decreased by 69%, or 556 cycles. When the loading ratio was 0.5, the reduction was 49%.
Figure 7c shows graphs with cycles to failure corresponding to different loading ratios for the 6AL10c specimen. For all loading ratios, the fatigue lives of damaged specimens were lower. Increasing the fatigue load increased the difference between undamaged and damaged specimens. Decreasing the applied load decreased the strength reduction in damaged specimens.
Figure 8a shows cycles to failure values corresponding to different loading ratios for the 6AL15b specimen. For all loading ratios, the cycles to failure value of specimens damaged with 5 Joules of impact energy was approximately 62% of undamaged specimens. Similarly, the cycles to failure value for specimens damaged with 10 Joules of impact energy was approximately 50% of undamaged specimens. This shows that the relationship between impact energy and fatigue life is not linear.
Figure 8b shows cycles to failure values corresponding to different loading ratios for the 6AL20b specimen. The specimen affected most by preliminary damage was 6AL20b. For r = 0.7, the preliminary damage produced by 5 Joules and 10 Joules of impact energy decreased the specimen’s life by 85% and 97.5% compared to that of the undamaged specimen. Decreasing the loading ratio increased the life of damaged and undamaged specimens.
Figure 8c shows cycles to failure values corresponding to loading ratios for the 9AL10b specimen. The static damage load of the specimen for 5 Joules of impact energy was 1739 N, while it decreased to 1539 N for 10 Joules of impact energy. When fatigue tests were performed at 90% and 80% of the static damage value for undamaged specimens, the applied static loads were found to be 1750 N and 1550 N, respectively. The static damage loads for specimens damaged by 5 Joules of impact energy were below 90% of the static damage load of the undamaged specimen, while those damaged by 10 Joules of impact energy were below 90% and 80% of the static damage load of the undamaged specimen. Thus, the fatigue tests were not carried out at these loading ratios.
Figure 9 shows the fatigue test results for the 6CFRP10a, 6CFRP10b and 6CFRP10c specimens. It was seen that the specimen affected most by the preliminary impact damage was 6CFRP10c with a face sheet material thickness of 1.5 mm. The reason for this could be that increasing face sheet thickness increased the preliminary damage resistance of the face sheet, which caused more cores to be crushed. Cycles to failure values determined in the 6CFRP10b specimen damaged by 5 Joules of impact energy diverged from the cycles to failure value of the undamaged specimen due to the decreasing loading ratio. Loading ratio vs. cycles to failure graph of specimens damaged by 10 Joules of energy corresponded to that of the undamaged specimen.
Fatigue crack was not observed during fatigue tests due to loading type. Core crushing failure is the main failure type for all fatigue specimens. No failures observed for adhesive between core and face material. Adhesion tests can be investigated in future studies.

3.3. Damping Ratio and Stiffness Reduction

Damping indicates the amount of energy required to rearrange molecules of the material due to internal friction. The energy consumed by the material due to internal friction and movements is called the storage modulus (E’), while the response energy consumed by the material against impact is the loss modulus (E’’). The damping ratio is calculated by the formula tan (δ) = E’’/E’, and it is independent of geometric effects. The material response to the applied stress and phase angle sample during fatigue loading are given in the Figure 10.
To determine the amount of energy absorbed by specimens after the fatigue tests, tan (δ) vs. cycles to failure (log N) graphs are shown below.
Figure 11 shows the effect of different loading ratios on the damping ratio for the undamaged 6AL10b specimen under three-point bending loads. The damping ratio decreased with the increasing loading ratio, while for all loading ratios, minimum damping ratios were determined at cycles to failure values where fatigue damage occurred.
Figure 12a shows damping ratios of the 6AL10b and 6CFRP10b specimens at a loading ratio of r = 0.6. At the same loading ratio, the damping ratios of the aluminum specimen were found to be higher than those of the CFRP specimen.
Figure 12b shows the normalized cycle–Stiffness reduction graph for 6AL10b and 6CFRP10b specimens. Stiffness is calculated as maximum applied load divided by maximum deflection for every cycle [36]. Stiffness change with fatigue cycle shows the same trend with damping ratio graphs. While normalized fatigue cycle approaches the 1, stiffness decreases and dramatic stiffness reduction is observed at the end of the lifetime.
Figure 13 shows the effect of impact energy on the damping ratio for the 9AL10b specimen. Increasing impact energy increased the damping ratio, while increasing cycles to failure decreased the damping ratio. After 100 cycles, when the stable region starts, the reduction in the damping ratio of damaged specimens (5 Joules and 10 Joules) was less compared to the undamaged specimen.
Damping ratio of undamaged specimens was lower than that of damaged specimens (Figure 10). The reason for this may be that undamaged structure transmits vibration more [37].

4. Conclusions

The results obtained after three-point bending, low velocity impact, three-point bending after impact, fatigue and fatigue after impact tests are evaluated below:
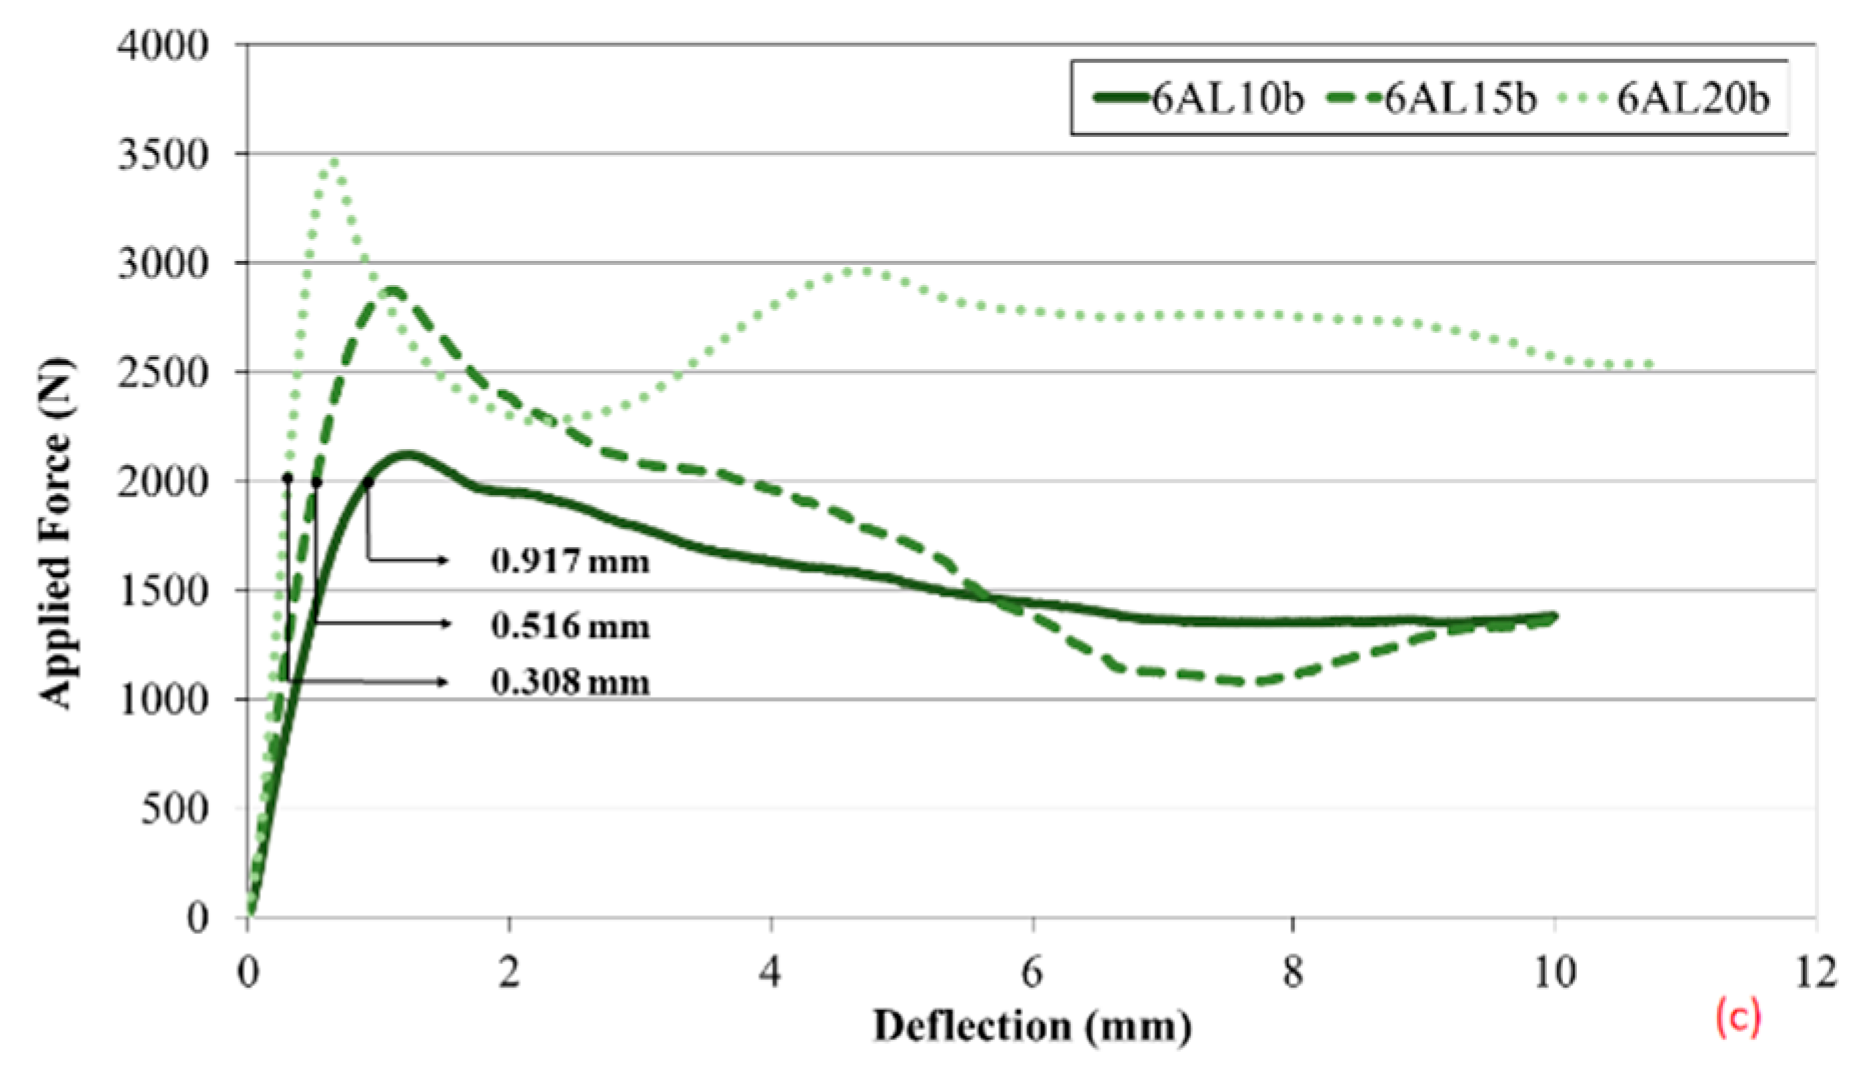
  • For three-point bending loads, increasing the core height increased the damage load of the specimen. With increased core height, damage was concentrated on the zone affected by the load. For the three core height values, debonding damage was seen between the core and the face sheet; buckling of the cell walls is the main reason for the damage.
  • Increasing face sheet thickness increased the flexural strength of specimens for both face sheet materials. This increase was more apparent in specimens of CFRP.
  • While performing fatigue tests, the applied load was determined by using the static damage load of the specimen. This restricted the effect of parameters used in the study on fatigue behavior. Application of the same amount of load to all specimens will clarify the effects of these parameters on fatigue behavior.
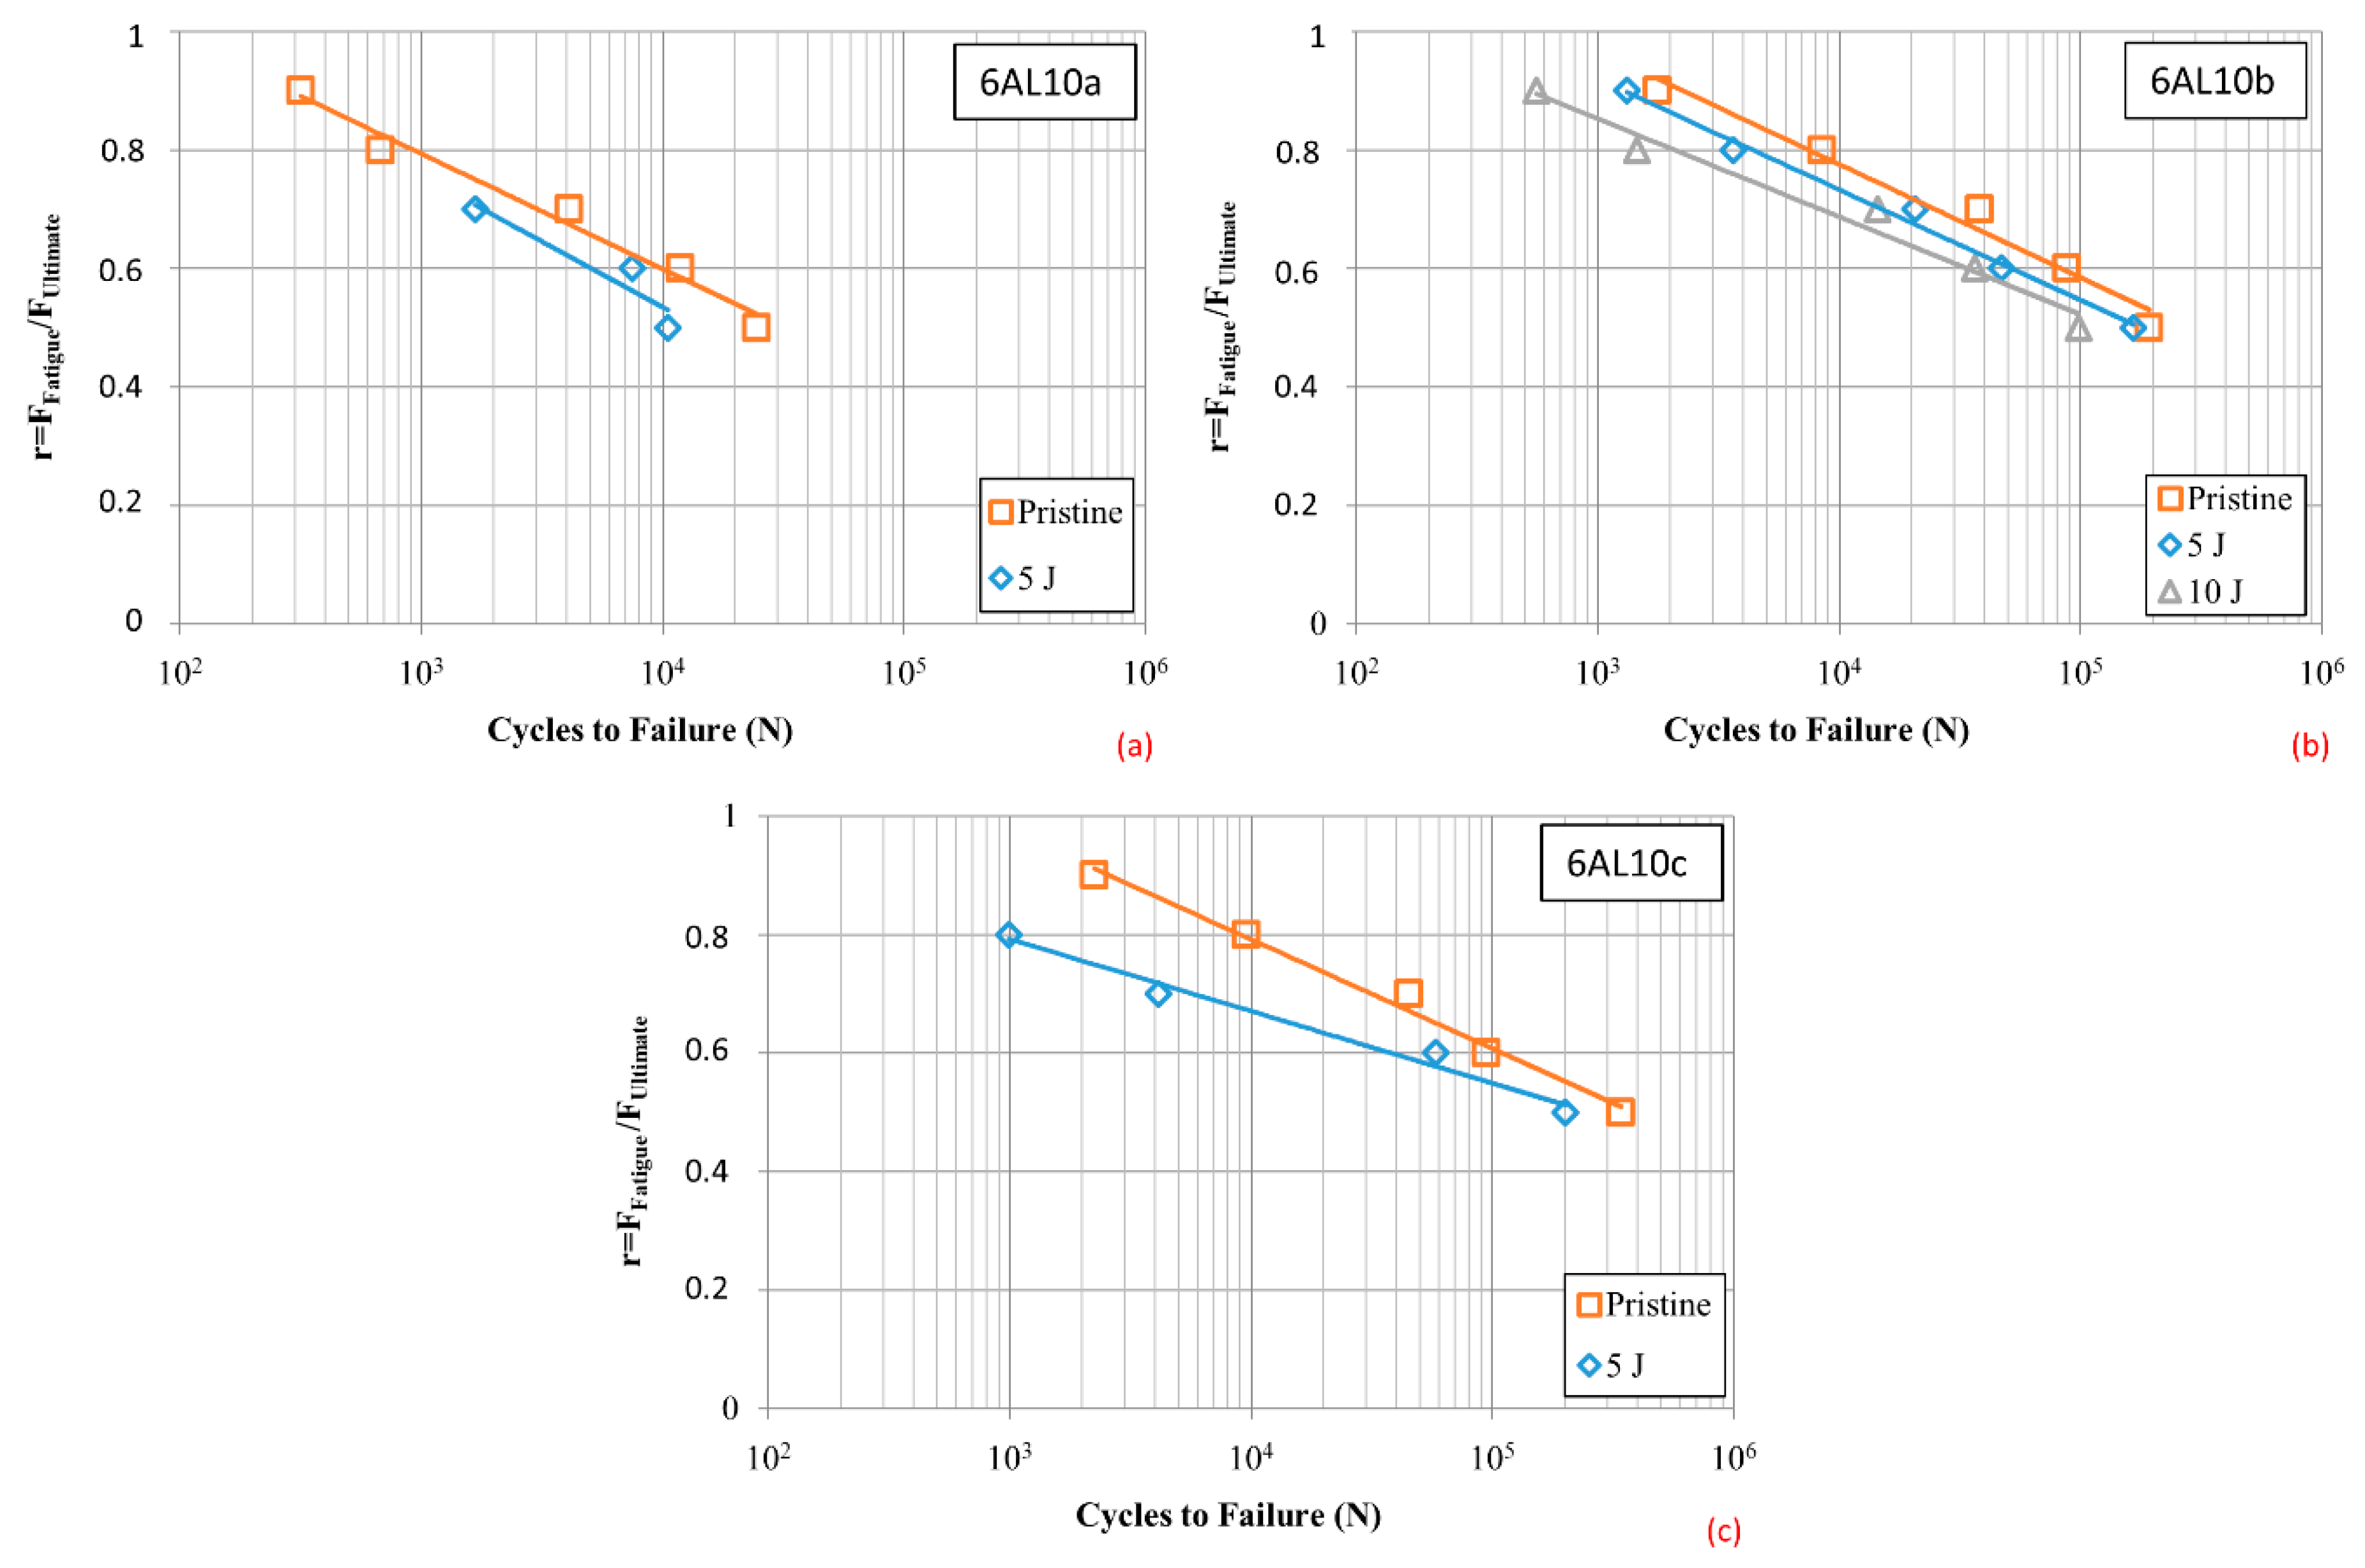
  • Increasing the core height was found to be the parameter that increased fatigue strength of specimens the most, similar to static loading.
  • In fatigue tests performed by three-point bending tests, when the loading ratio decreased, the fatigue lives of undamaged and damaged specimens converged.
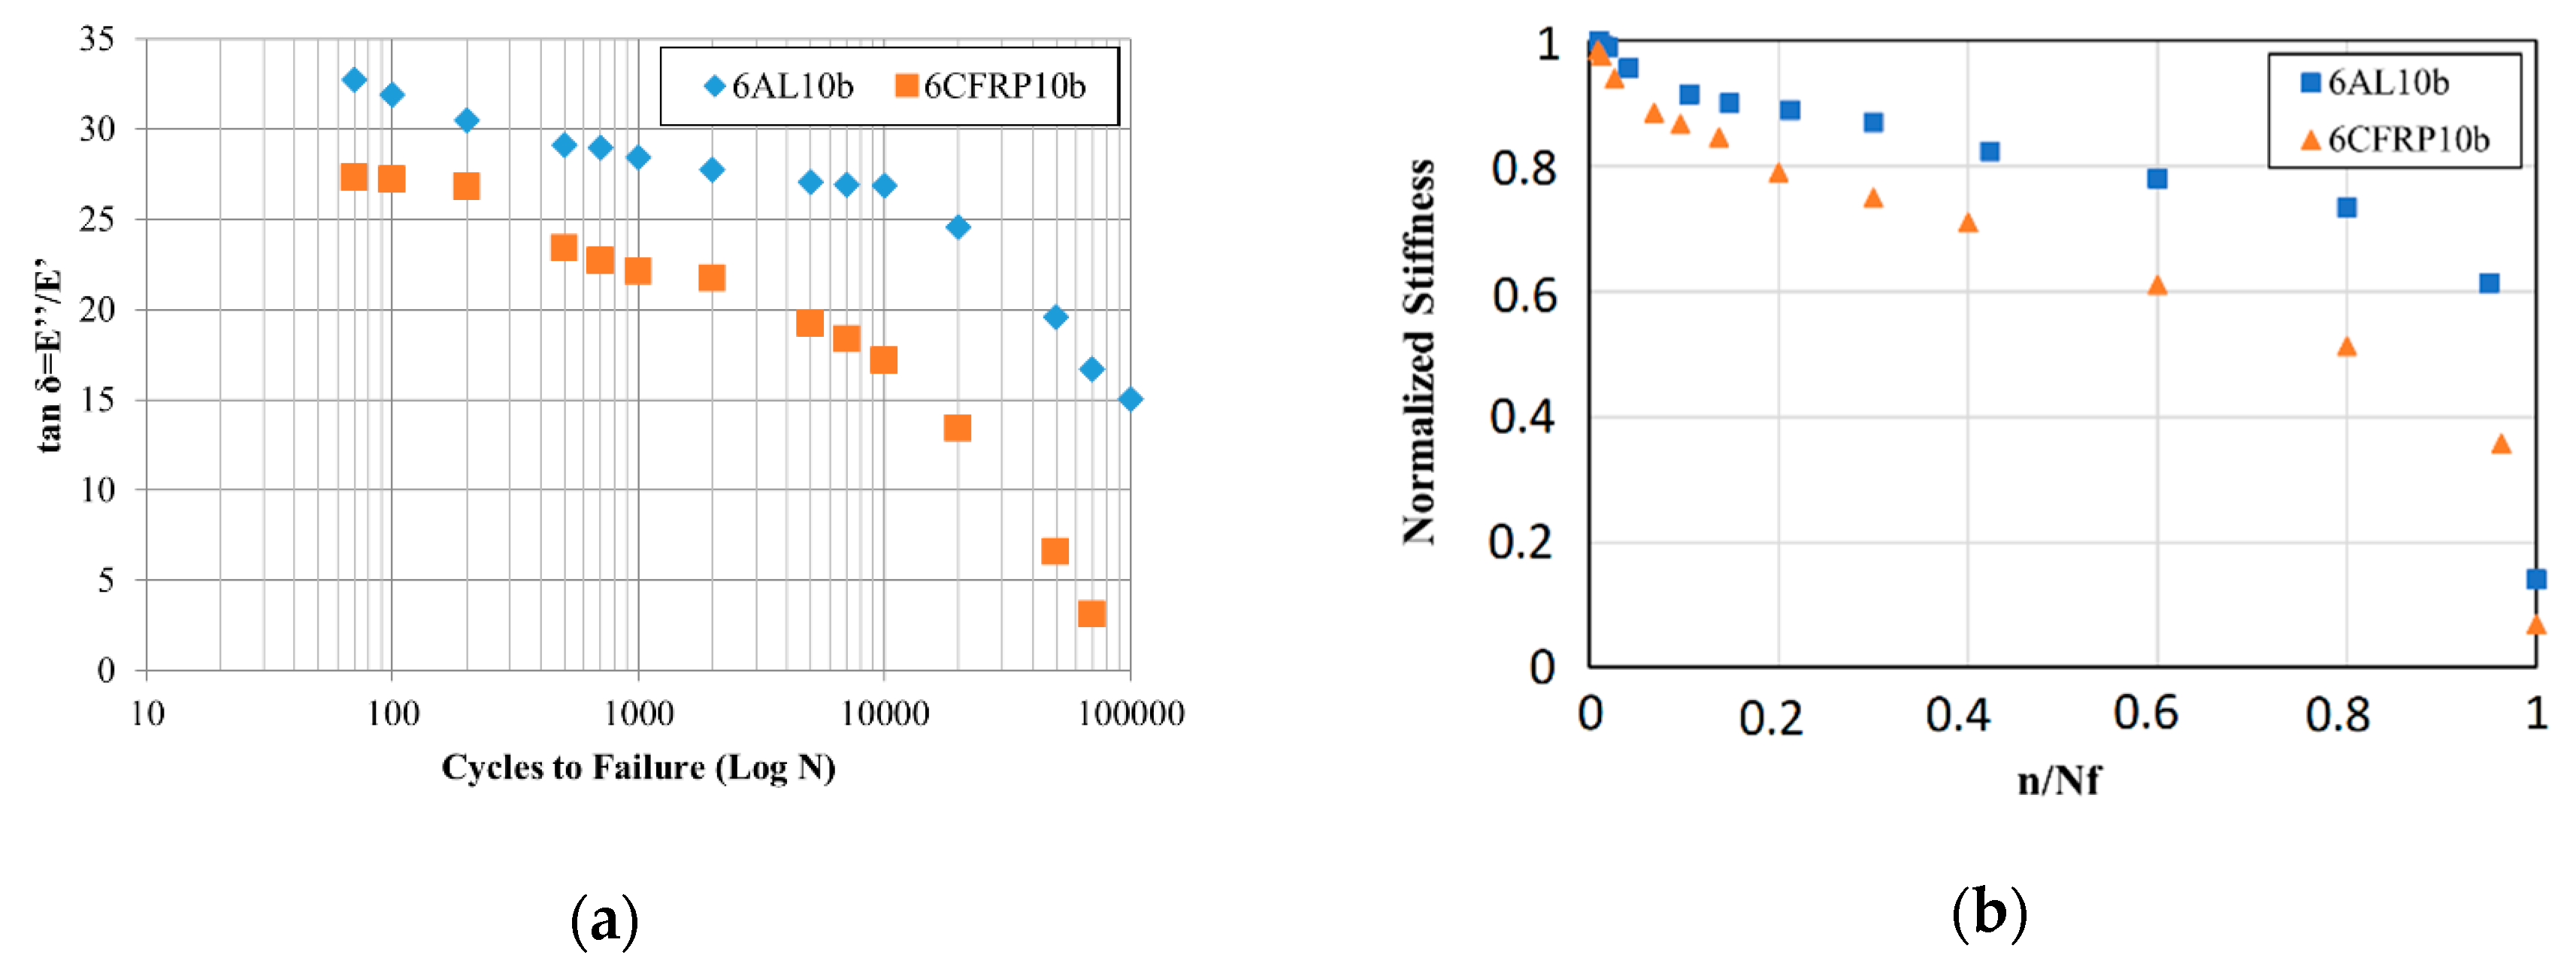
  • The damping ratio—related to the energy absorbed by specimens during fatigue tests and to rigidity—increased with the increasing impact energy. For undamaged and damaged specimens, the damping ratio approached a steady-state and continued its horizontal trend; it decreased when approaching the damage cycle and became a minimum after permanent damage of the specimen.
  • For all cycle numbers, the highest damping ratios were observed in specimens with the aluminum face sheet.
  • While normalized fatigue cycle approached the 1, stiffness decreases and dramatical stiffness reduction observed at the end of lifetime for all samples.

Author Contributions

Introduction, Materials and Methods, Fatigue Analysis, Results and Discussion, Writing, Reviewing and Editing, M.Y.S.; Introduction, Materials and Methods, Experimental Study, Results and Discussion, Writing, Reviewing and Editing, T.T. All authors have read and agreed to the published version of the manuscript.

Funding

This research was funded by [Scientific Research Projects Coordination Unit of Fırat University] grant number [MF.16.18.].

Acknowledgments

This work was supported by Scientific Research Projects Coordination Unit of Fırat University. Project number MF.16.18. Tolga TOPKAYA is grateful to The Scientific and Technological Research Council of Turkey (TUBITAK) for Ph.D. scholarship (Grant Number: 1649B031501671). This paper is a part of 479133 numbered and “Investigation of the fatigue behavior of honeycomb sandwich composites after low-velocity impact damage” titled Ph. D. thesis of Tolga TOPKAYA, awarded from Fırat University Graduate School of Sciences.

Conflicts of Interest

The authors declare no conflict of interest.

References

  1. Rajaneesh, A.; Zhao, Y.; Chai, G.B.; Sridhar, I. Flexural fatigue life prediction of CFRP-Nomex honeycomb sandwich beams. Compos. Struct. 2018, 192, 225–231. [Google Scholar] [CrossRef]
  2. Wu, X.; Yu, H.; Guo, L.; Zhang, L.; Sun, X.; Chai, Z. Experimental and numerical investigation of static and fatigue behaviors of composites honeycomb sandwich structure. Compos. Struct. 2019, 213, 165–172. [Google Scholar] [CrossRef]
  3. Li, T.; Liu, F.; Wang, L. Enhancing indentation and impact resistance in auxetic composite materials. Compos. Part B Eng. 2020, 198, 108229. [Google Scholar] [CrossRef]
  4. Strek, T.; Jopek, H.; Nienartowicz, M. Dynamic response of sandwich panels with auxetic cores. Phys. Status Solidi Basic Res. 2015, 252, 1540–1550. [Google Scholar] [CrossRef]
  5. Pehlivan, L.; Baykasoğlu, C. An experimental study on the compressive response of CFRP honeycombs with various cell configurations. Compos. Part B Eng. 2019, 162, 653–661. [Google Scholar] [CrossRef]
  6. Davalos, J.F.; Qiao, P.; Frank Xu, X.; Robinson, J.; Barth, K.E. Modeling and characterization of fiber-reinforced plastic honeycomb sandwich panels for highway bridge applications. Compos. Struct. 2001, 52, 441–452. [Google Scholar] [CrossRef]
  7. Akpinar, S.; Aydin, M.D.; Temiz, Ş.; Özel, A. 3-D non-linear stress analysis on the adhesively bonded T-joints with embedded supports. Compos. Part B Eng. 2013, 53, 314–323. [Google Scholar] [CrossRef]
  8. Wang, D.; Xie, S.; Feng, Z.; Liu, X.; Li, Y. Investigating the effect of dimension parameters on sound transmission losses in Nomex honeycomb sandwich. Appl. Sci. 2020, 10, 3109. [Google Scholar] [CrossRef]
  9. Belouettar, S.; Abbadi, A.; Azari, Z.; Belouettar, R.; Freres, P. Experimental investigation of static and fatigue behaviour of composites honeycomb materials using four point bending tests. Compos. Struct. 2009, 87, 265–273. [Google Scholar] [CrossRef]
  10. Poortabib, A. Critical buckling load of curved sandwich beams with composite skins subjected to uniform pressure load. J. Braz. Soc. Mech. Sci. Eng. 2016, 38, 1805–1816. [Google Scholar] [CrossRef]
  11. Zhao, C.; Zheng, W.; Ma, J.; Zhao, Y. Shear strengths of different bolt connectors on the large span of aluminium alloy honeycomb sandwich structure. Appl. Sci. 2017, 7, 450. [Google Scholar] [CrossRef]
  12. Nouri, H.; Lubineau, G.; Traudes, D. An experimental investigation of the effect of shear-induced diffuse damage on transverse cracking in carbon-fiber reinforced laminates. Compos. Struct. 2013, 106, 529–536. [Google Scholar] [CrossRef]
  13. Zhang, W.; Zhou, Z.; Zheng, P.; Zhao, S. The fatigue damage mesomodel for fiber-reinforced polymer composite lamina. J. Reinf. Plast. Compos. 2014, 33, 1783–1793. [Google Scholar] [CrossRef]
  14. Li, H.; Zhou, Z. Detection and characterization of debonding defects in Aeronautical honeycomb sandwich composites using noncontact air-coupled ultrasonic testing technique. Appl. Sci. 2019, 9, 283. [Google Scholar] [CrossRef] [Green Version]
  15. Tai, N.H.; Yip, M.C.; Lin, J.L. Effects of low-energy impact on the fatigue behavior of carbon/epoxy composites. Compos. Sci. Technol. 1998, 58, 1–8. [Google Scholar] [CrossRef]
  16. Koo, J.M.; Choi, J.H.; Seok, C.S. Evaluation for residual strength and fatigue characteristics after impact in CFRP composites. Compos. Struct. 2013, 105, 58–65. [Google Scholar] [CrossRef]
  17. Uda, N.; Ono, K.; Kunoo, K. Compression fatigue failure of CFRP laminates with impact damage. Compos. Sci. Technol. 2009, 69, 2308–2314. [Google Scholar] [CrossRef]
  18. Nettles, A.; Hodge, A.; Jackson, J. An examination of the compressive cyclic loading aspects of damage tolerance for polymer matrix launch vehicle hardware. J. Compos. Mater. 2011, 45, 437–458. [Google Scholar] [CrossRef]
  19. Goidescu, C.; Welemane, H.; Garnier, C.; Fazzini, M.; Brault, R.; Péronnet, E.; Mistou, S. Damage investigation in CFRP composites using full-field measurement techniques: Combination of digital image stereo-correlation, infrared thermography and X-ray tomography. Compos. Part B Eng. 2013, 48, 95–105. [Google Scholar] [CrossRef] [Green Version]
  20. Bogenfeld, R.; Freund, S.; Schuster, A. An analytical damage tolerance method accounting for delamination in compression-loaded composites. Eng. Fail. Anal. 2020, 118, 104875. [Google Scholar] [CrossRef]
  21. Wang, Z.; Li, Z.; Zhou, W.; Hui, D. On the influence of structural defects for honeycomb structure. Compos. Part B Eng. 2018, 142, 183–192. [Google Scholar] [CrossRef]
  22. Subhani, T. Mechanical Performance of Honeycomb Sandwich Structures Using Three-Point Bend Test. Eng. Technol. Appl. Sci. Res. 2019, 9, 3955–3958. [Google Scholar]
  23. Jen, Y.M.; Chang, L.Y. Effect of thickness of face sheet on the bending fatigue strength of aluminum honeycomb sandwich beams. Eng. Fail. Anal. 2009, 16, 1282–1293. [Google Scholar] [CrossRef]
  24. Abbadi, A.; Tixier, C.; Gilgert, J.; Azari, Z. Experimental study on the fatigue behaviour of honeycomb sandwich panels with artificial defects. Compos. Struct. 2015, 120, 394–405. [Google Scholar] [CrossRef]
  25. Schubel, P.M.; Luo, J.J.; Daniel, I.M. Impact and post impact behavior of composite sandwich panels. Compos. Part A Appl. Sci. Manuf. 2007, 38, 1051–1057. [Google Scholar] [CrossRef]
  26. Belingardi, G.; Martella, P.; Peroni, L. Fatigue analysis of honeycomb-composite sandwich beams. Compos. Part A Appl. Sci. Manuf. 2007, 38, 1183–1191. [Google Scholar] [CrossRef]
  27. Shi, S.S.; Sun, Z.; Hu, X.Z.; Chen, H.R. Carbon-fiber and aluminum-honeycomb sandwich composites with and without Kevlar-fiber interfacial toughening. Compos. Part A Appl. Sci. Manuf. 2014, 67, 102–110. [Google Scholar] [CrossRef]
  28. Galehdari, S.A.; Kadkhodayan, M.; Hadidi-Moud, S. Low velocity impact and quasi-static in-plane loading on a graded honeycomb structure; experimental, analytical and numerical study. Aerosp. Sci. Technol. 2015, 47, 425–433. [Google Scholar] [CrossRef]
  29. Baba, B.O. Curved sandwich composites with layer-wise graded cores under impact loads. Compos. Struct. 2017, 159, 1–11. [Google Scholar] [CrossRef]
  30. He, W.; Yao, L.; Meng, X.; Sun, G.; Xie, D.; Liu, J. Effect of structural parameters on low-velocity impact behavior of aluminum honeycomb sandwich structures with CFRP face sheets. Thin-Walled Struct. 2019, 137, 411–432. [Google Scholar] [CrossRef]
  31. Longbiao, L. A hysteresis energy dissipation based model for multiple loading damage in continuous fiber-reinforced ceramic-matrix composites. Compos. Part B Eng. 2019, 162, 259–273. [Google Scholar] [CrossRef]
  32. Menard, K.P. Dynamic Mechanical Analysis: A Pratical Introduction; CRC Press: Boca Raton, FL, USA, 2008. [Google Scholar]
  33. De Silva, C.W. Dynamic Testing and Seismic Qualification Practice; Carnegie-Mellon University: Pittsburgh, PA, USA, 1983. [Google Scholar]
  34. Jen, Y.M.; Ko, C.W.; Lin, H. Bin Effect of the amount of adhesive on the bending fatigue strength of adhesively bonded aluminum honeycomb sandwich beams. Int. J. Fatigue 2009, 31, 455–462. [Google Scholar] [CrossRef]
  35. Topkaya, T.; Solmaz, M.Y. Investigation of low velocity impact behaviors of honeycomb sandwich composites. J. Mech. Sci. Technol. 2018, 32, 3161–3167. [Google Scholar] [CrossRef]
  36. Suzuki, T.; Mahfuz, H.; Takanashi, M. A new stiffness degradation model for fatigue life prediction of GFRPs under random loading. Int. J. Fatigue 2019, 119, 220–228. [Google Scholar] [CrossRef]
  37. Idriss, M.; El Mahi, A.; Assarar, M.; El Guerjouma, R. Damping analysis in cyclic fatigue loading of sandwich beams with debonding. Compos. Part B Eng. 2013, 44, 597–603. [Google Scholar] [CrossRef]
Figure 1. Honeycomb sandwich specimen layers.
Applsci 10 07262 g001
Figure 2. Application of load to specimens during the static test.
Applsci 10 07262 g002
Figure 3. Low velocity impact test setup.
Applsci 10 07262 g003
Figure 4. Stress vs. Cycles to failure graphs for the materials used: (a) Aluminum Alloy and CFRP; (b) 3M 2216 adhesive.
Applsci 10 07262 g004
Figure 5. Specimen images obtained after three-point bending tests.
Applsci 10 07262 g005
Figure 6. Effect of (a) face sheet thickness, (b) face sheet type and (c) core height on flexural strength.
Applsci 10 07262 g006aApplsci 10 07262 g006b
Figure 7. Loading ratio vs. cycles to failure graphs for (a) 6AL10a, (b) 6AL10b and (c) 6AL10c specimens.
Applsci 10 07262 g007
Figure 8. Loading ratio vs. cycles to failure graphs for the (a) 6AL15b, (b) 6AL20b and (c) 9AL10b specimens.
Applsci 10 07262 g008
Figure 9. Loading ratio vs. cycles to failure graphs for the (a) 6CFRP10a, (b) 6CFRP10b and (c) 6CFRP10c specimens.
Applsci 10 07262 g009
Figure 10. Tan (δ) vs. Log (N) graph for the 6AL10b specimen.
Applsci 10 07262 g010
Figure 11. Tan (δ) vs. Log (N) graph for the 6AL10b specimen.
Applsci 10 07262 g011
Figure 12. (a) Tan (δ) vs. Log (N) graph for the 6AL10b and 6CFRP10b specimens, (b) Stiffness reduction vs normalized cycle graph for 6AL10b and 6CFRP10b specimens.
Applsci 10 07262 g012
Figure 13. Tan (δ) vs. Log (N) graph for the 9AL10b specimen.
Applsci 10 07262 g013
Table 1. Specimen properties.
Specimen CodesCell Size (D) mmFace Sheet MaterialCore Height (T) mmFace Sheet Thickness mm (h)
6AL10a6.35Aluminum100.5
6AL10b6.35Aluminum101
6AL10c6.35Aluminum101.5
6AL15b6.35Aluminum151
6AL20b6.35Aluminum201
9AL10b9.525Aluminum101
6CFRP10a6.35CFRP100.5
6CFRP10b6.35CFRP101
6CFRP10c6.35CFRP101.5
Table 2. Mechanical properties of the adhesive, and the Al-5754 and Al-3003 alloys.
Young’s ModulusPoisson’s RatioTensile Strength (MPa)
3M 2216 Adhesive565 MPa0.4719.88
Al-5754 Face Sheet70.3 GPa0.33245
Al-3003 Core68.9 GPa0.33131
Table 3. Mechanical properties of the carbon fiber reinforced plastic (CFRP) composite.
E1 (GPa)E2 (GPa)ν12G12 (GPa)XT,YT (MPa)XC, YC (MPa)S (MPa)
CFRP Face Sheet83.483.50.056.81008953125
Publisher’s Note: MDPI stays neutral with regard to jurisdictional claims in published maps and institutional affiliations.

