Robust Optimization Approaches for a Natural Pharmaceutical Complex Product of Atractylodes Japonica Koidz and Schisandra Chinensis

Abstract
:1. Introduction
1.1. Research Background
1.2. Literature Review
1.3. Research Motivation and Significance
2. Materials and Methods
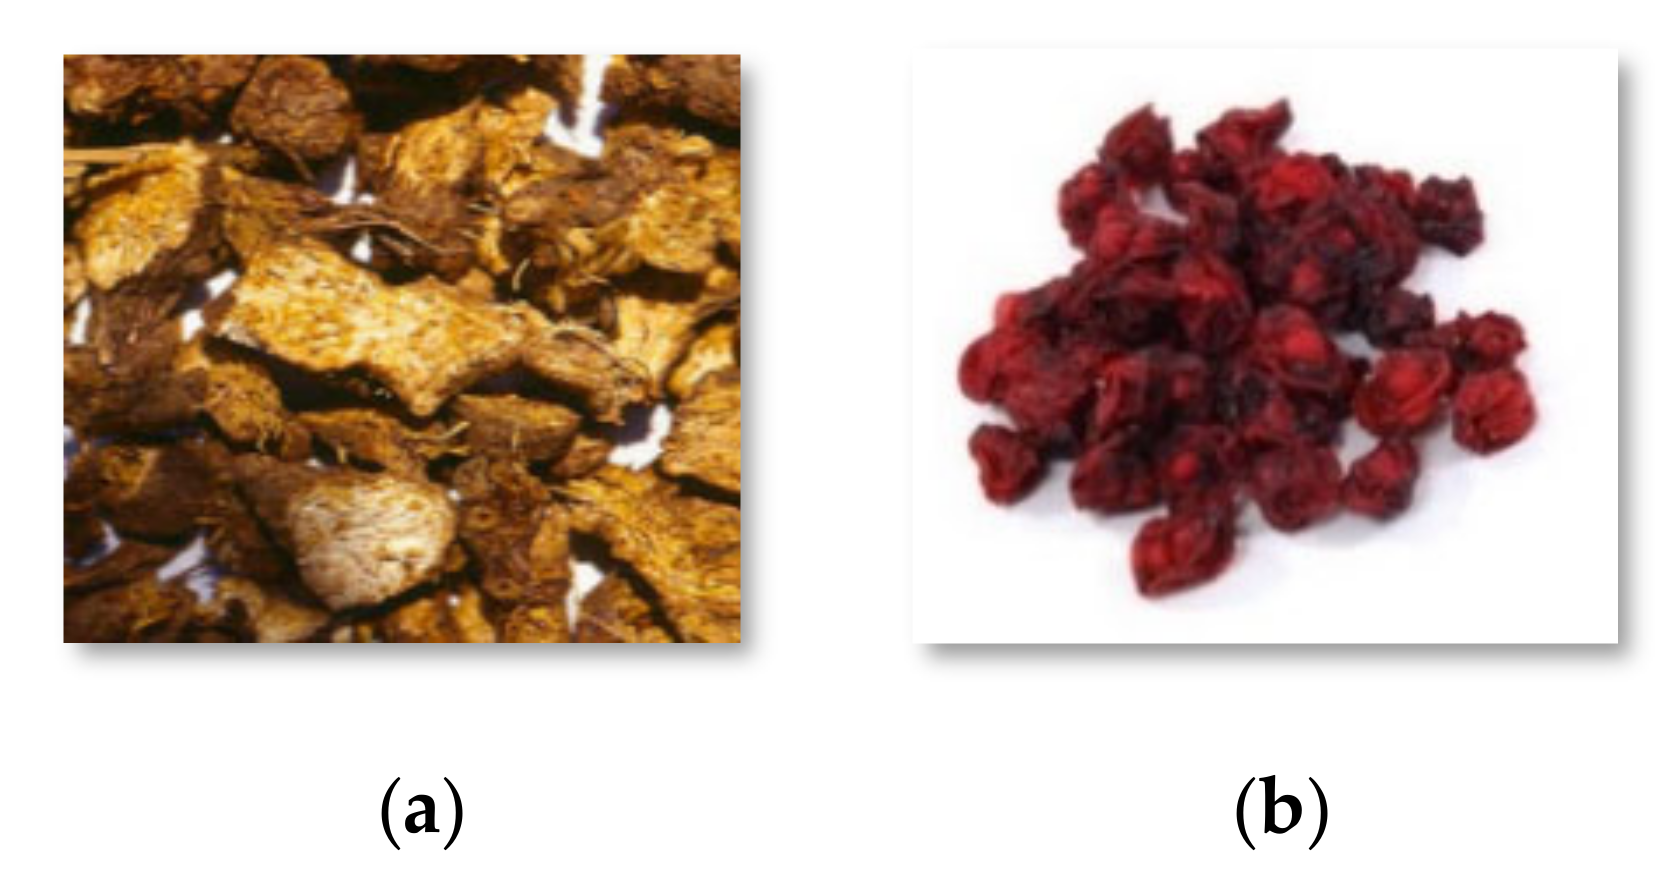
2.1. Extraction of Raw Materials
2.2. Primary Characteristics
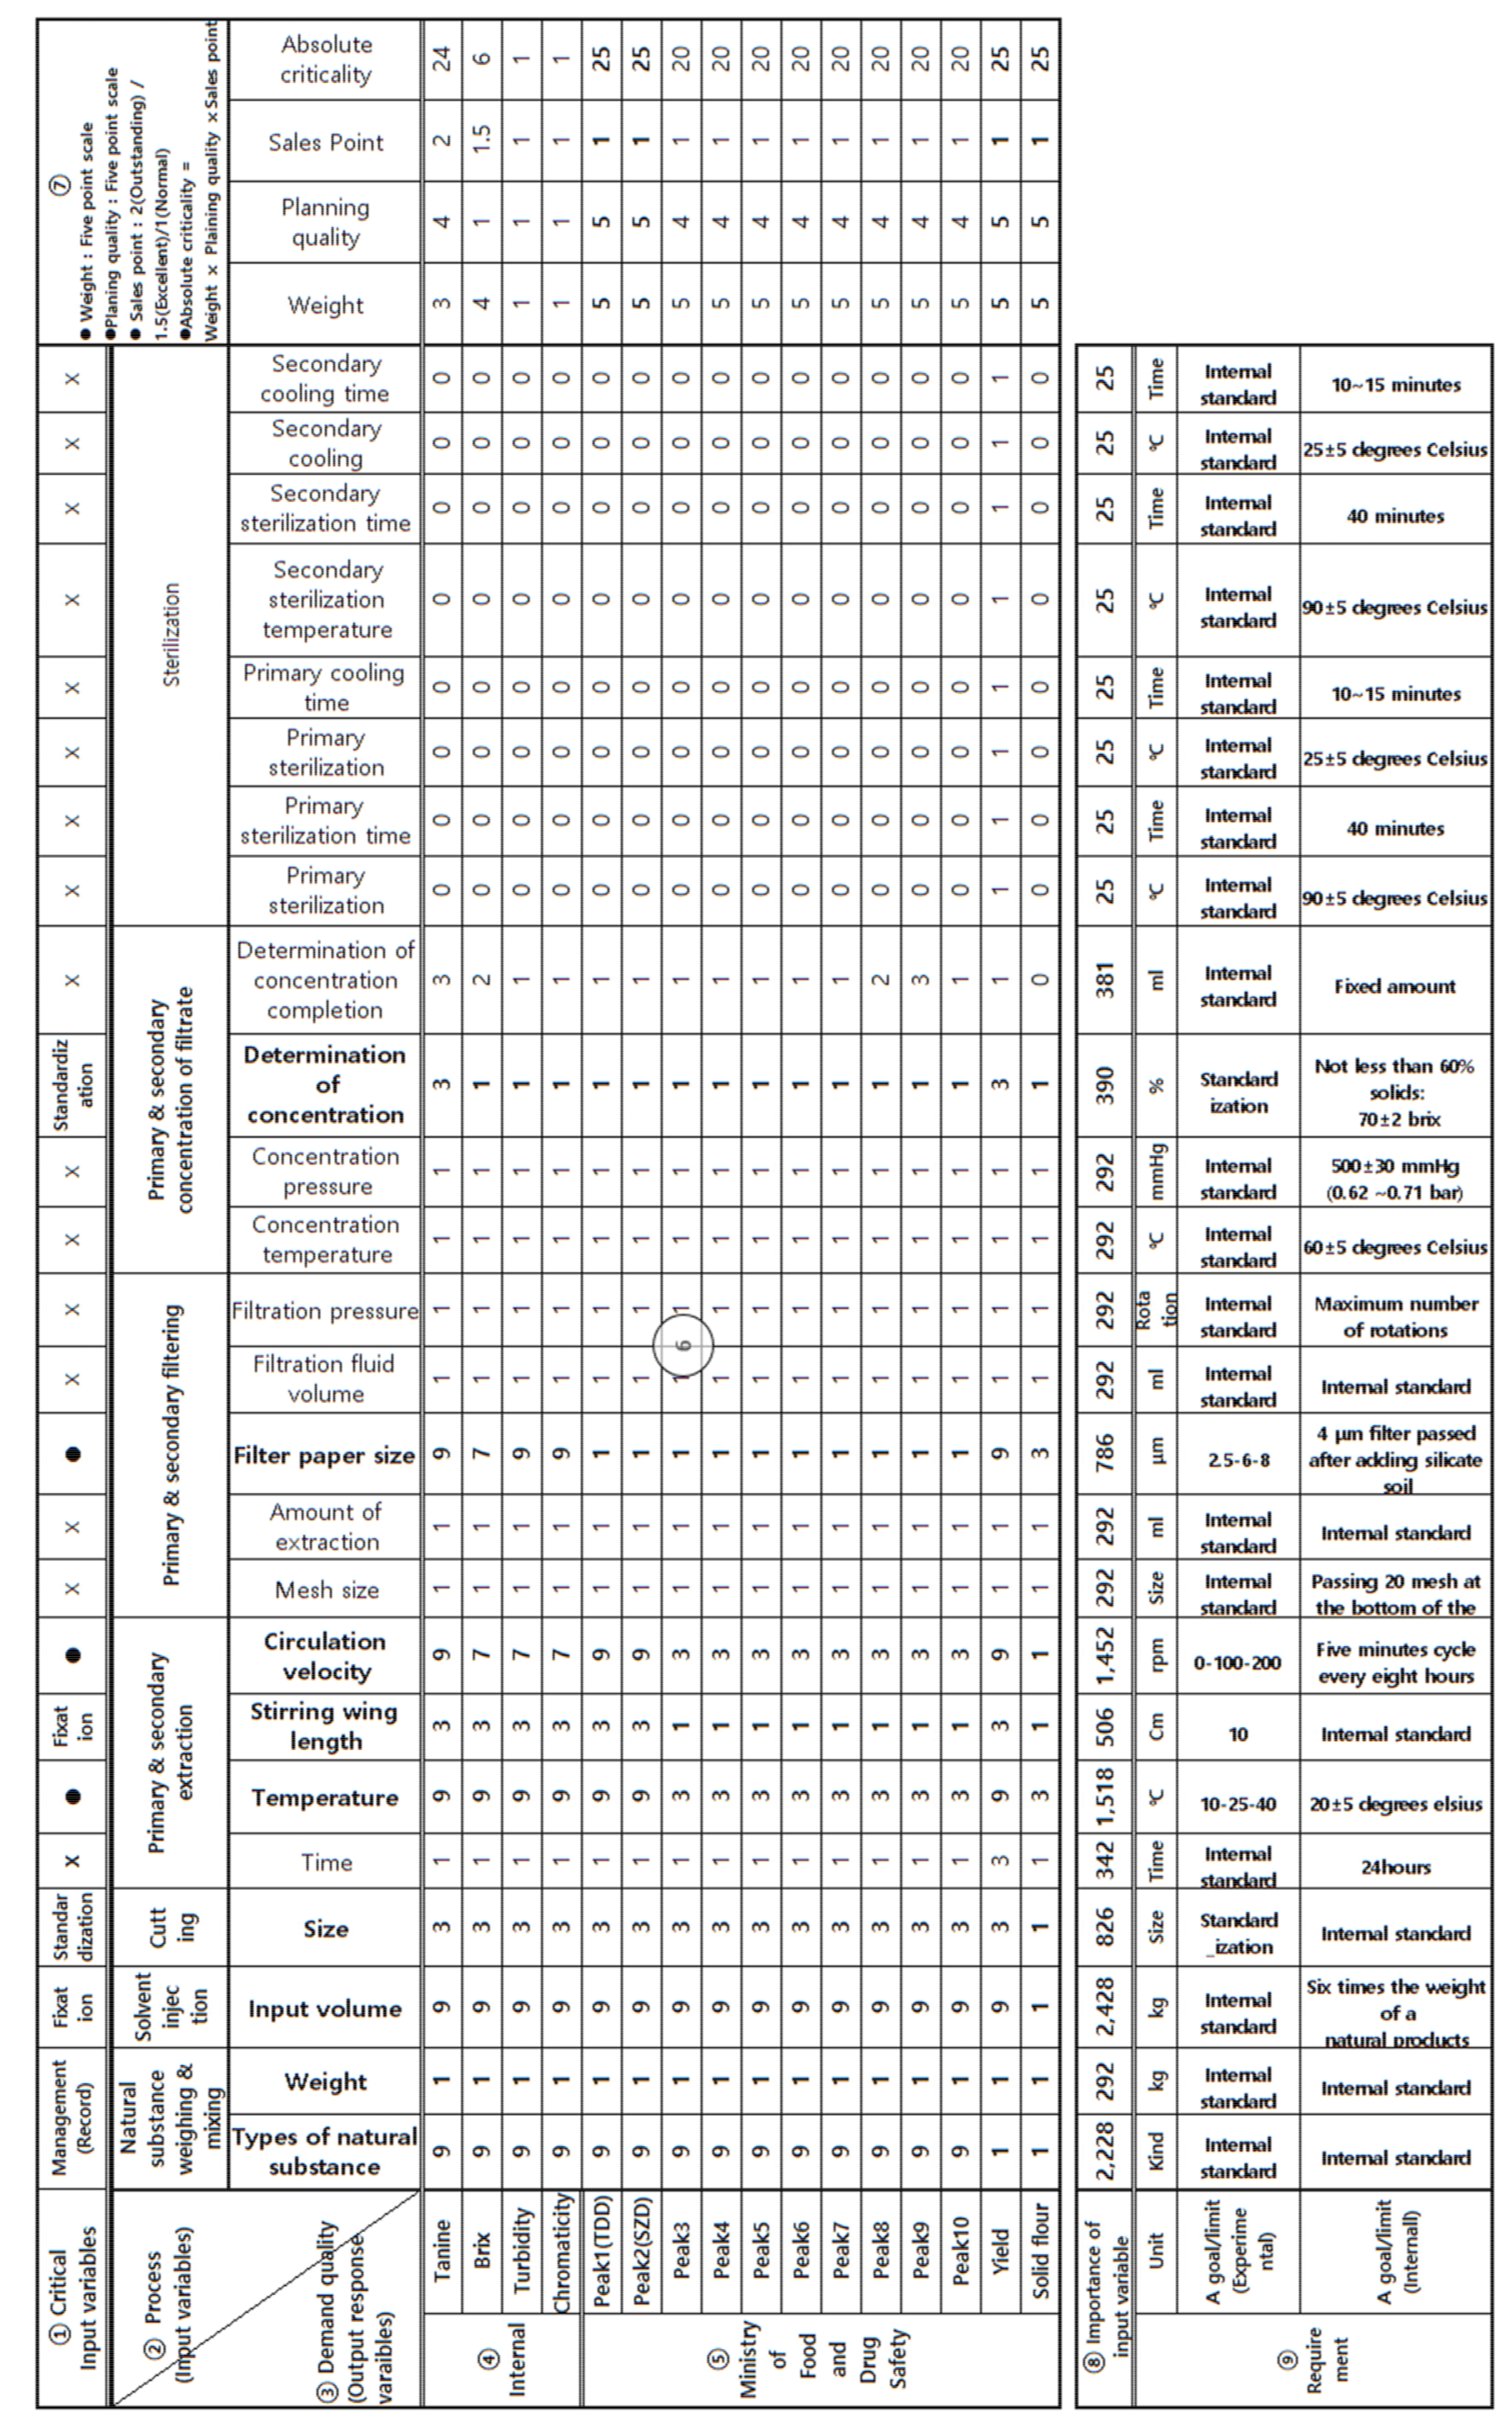
2.3. Process Standardization Method
2.4. Critical Quality Attributes of CKD-497
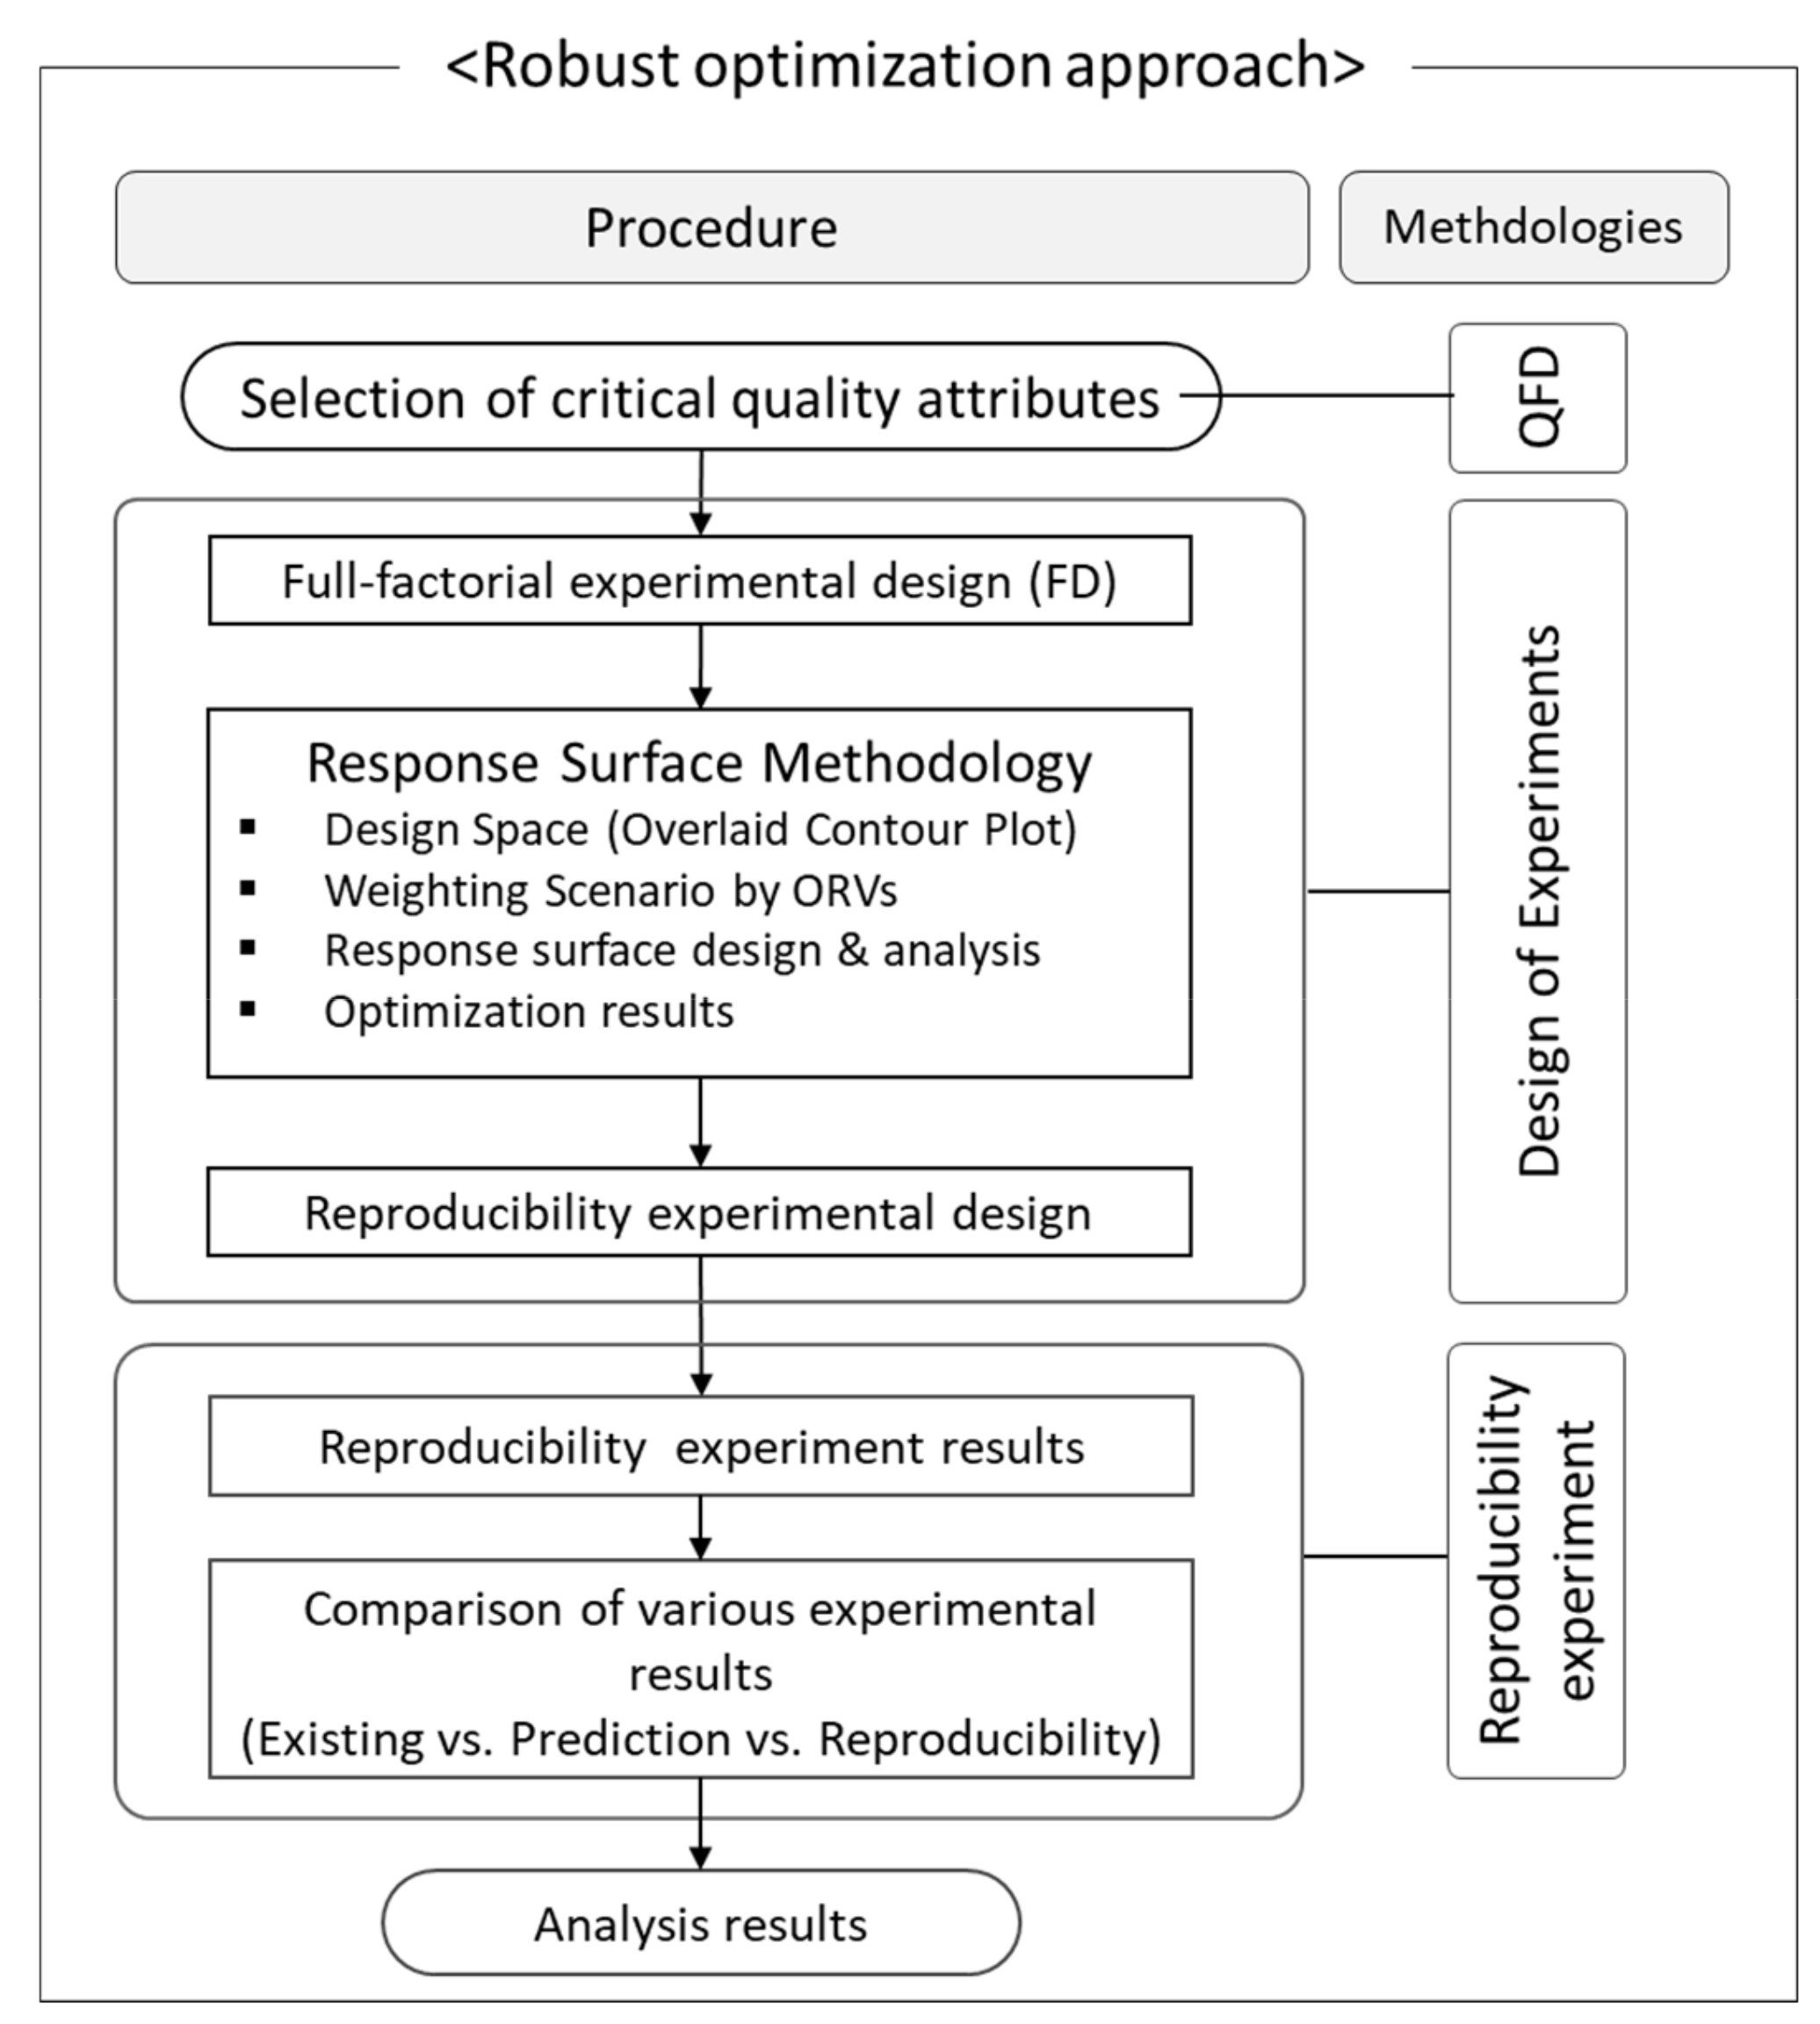
2.5. Robust Optimization Approach
3. Results
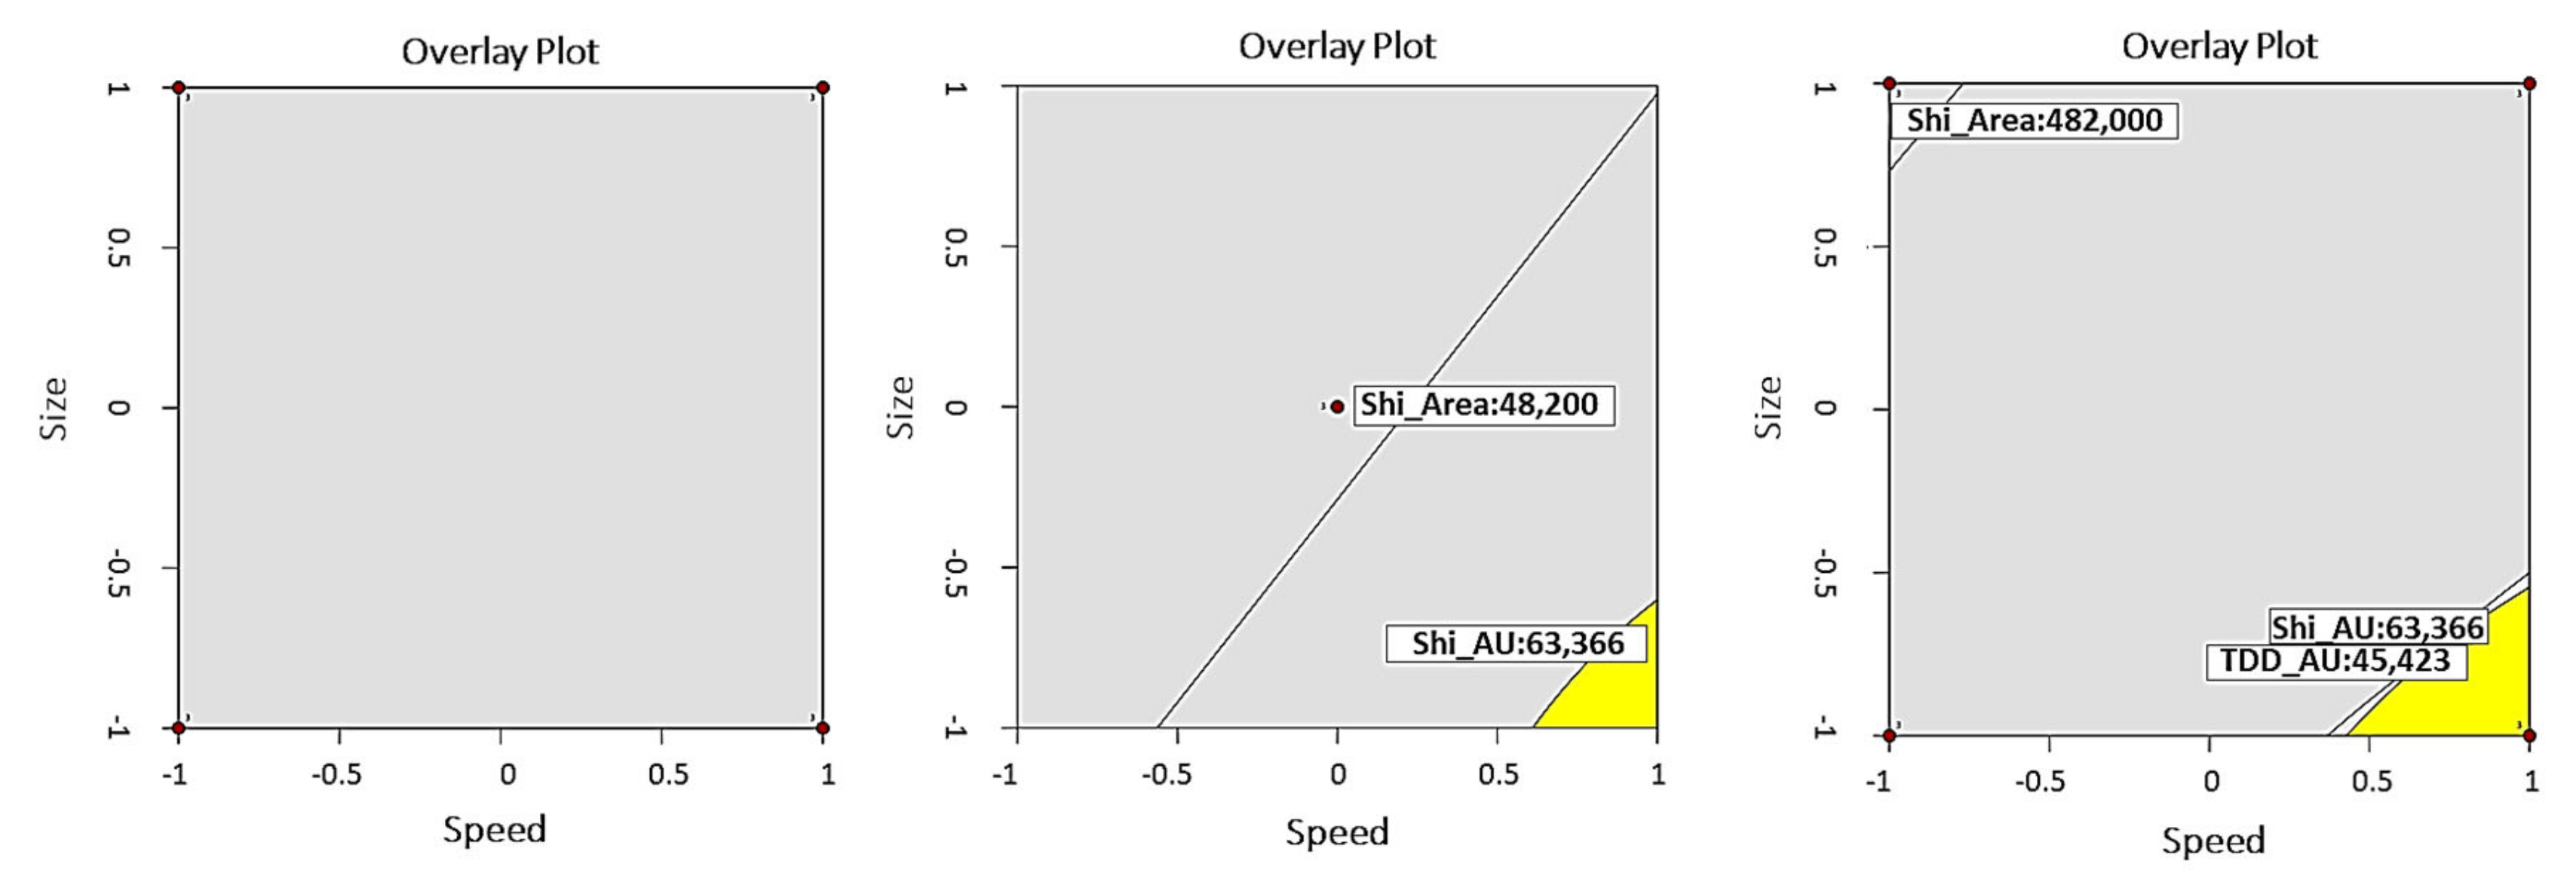
3.1. DoE Results
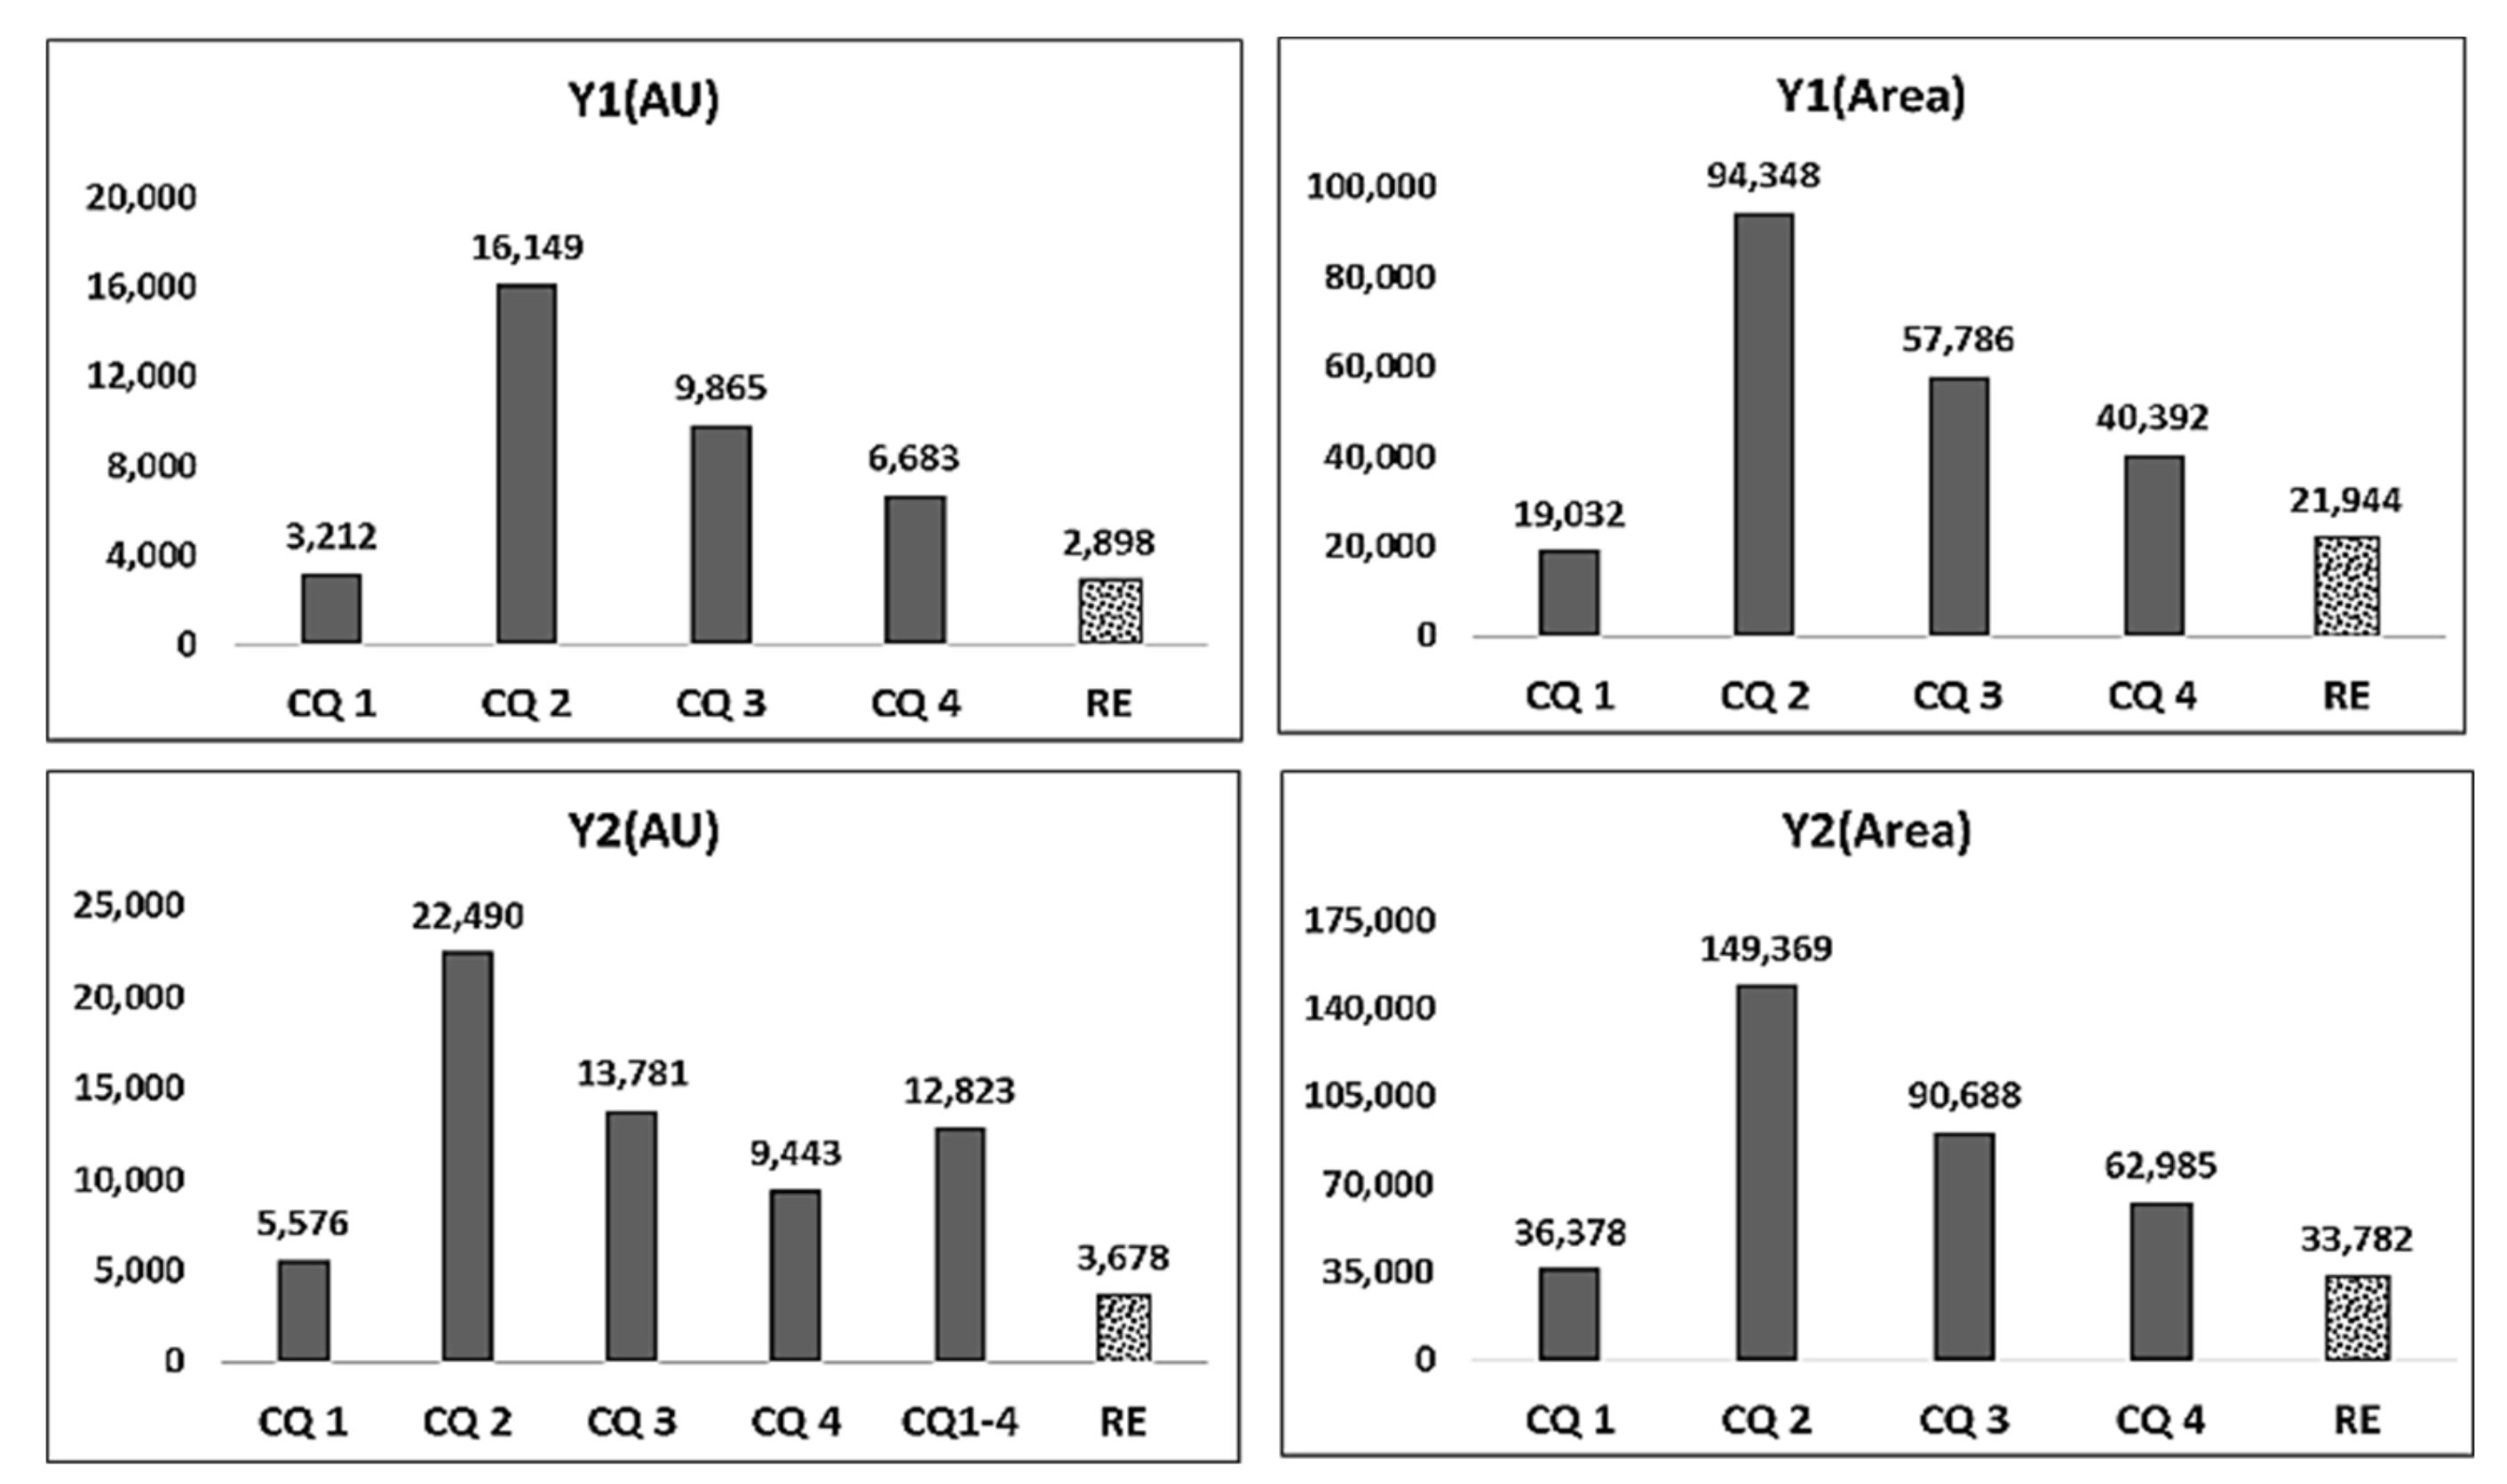
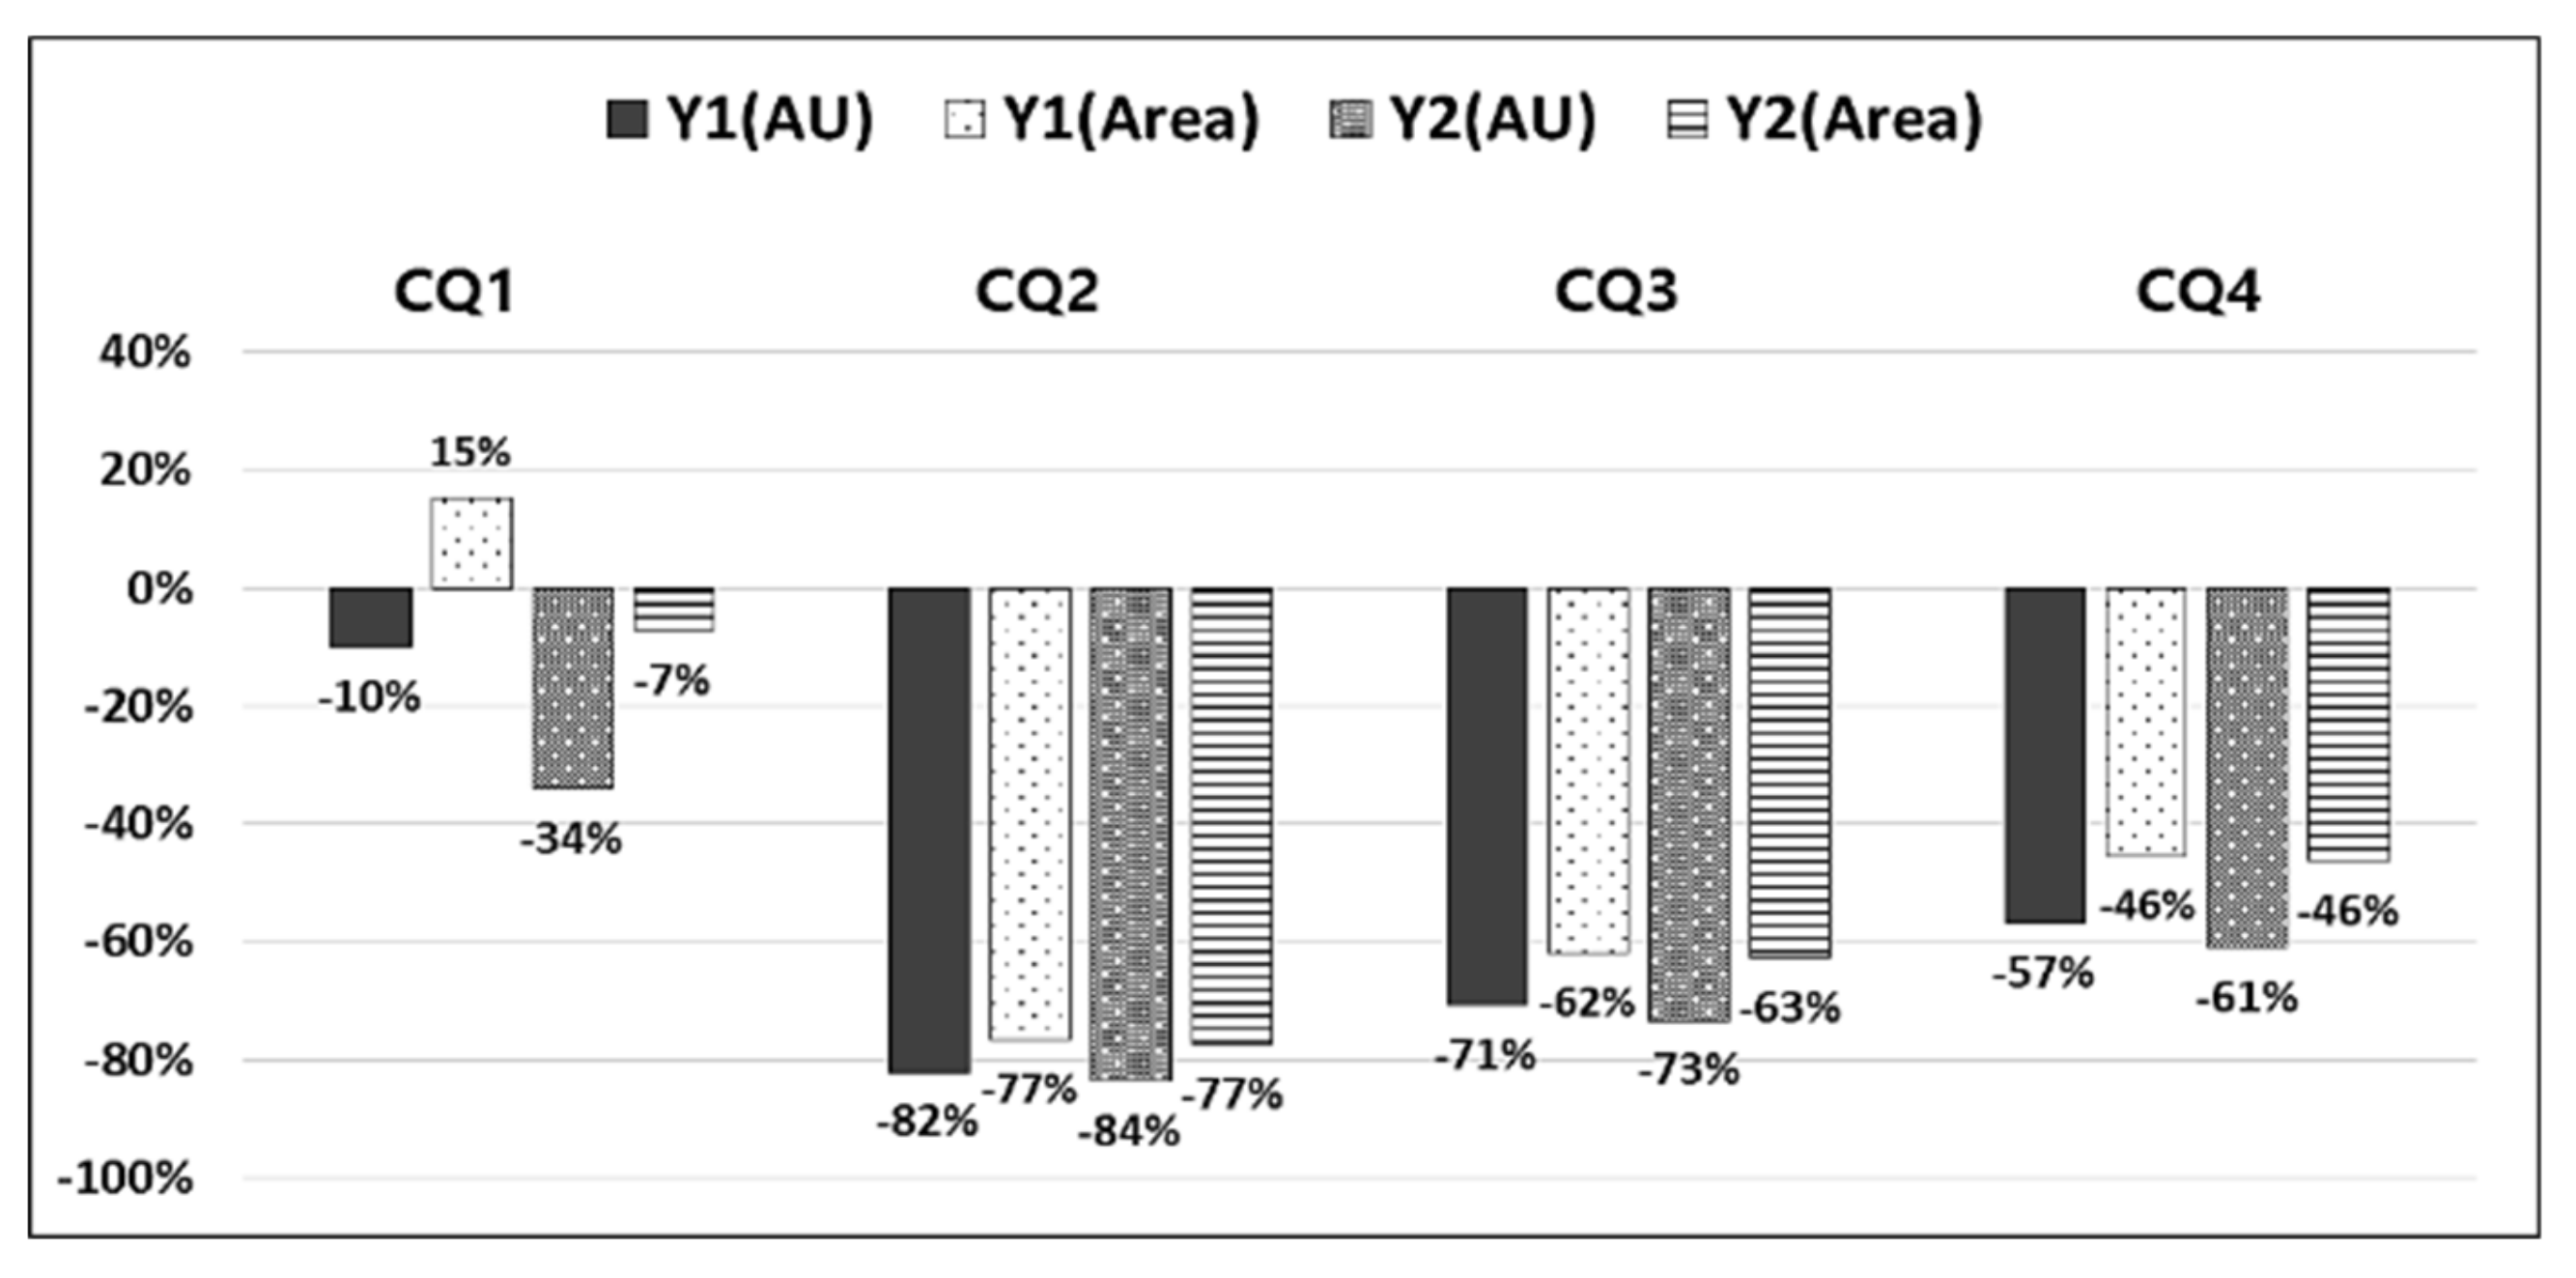
3.2. Reproducibility Experiment Results
3.3. Discussion
4. Conclusions
Author Contributions
Funding
Conflicts of Interest
References
- Shin, S.M.; Park, K.J.; Jeong, H.J. An Optimal Process Design Using a Robust Desirability Function (RDF) Model to Improve a Process/Product Quality on a Pharmaceutical Manufacturing Process. J. Soc. Korea Ind. Syst. Eng. 2010, 33, 1–9. [Google Scholar]
- Chae, H.; Kim, S.Y.; Pel, P.; Huh, J.; Joo, S.; Lim, Y.Y.; Park, S.J.; Lim, J.L.; Chin, Y. Standardized Extract of Atractylodis Rhizoma Alba and Fructus Schisandrae Ameliorates Coughing and Increases Expectoration of Phlegm. Molecules 2020, 25, 3064. [Google Scholar] [CrossRef] [PubMed]
- Tye, H. Application of statistical’ design of experiments’ methods in drug discovery. Drug Discov. Today 2004, 9, 485. [Google Scholar] [CrossRef]
- Yu, L.X. Pharmaceutical Quality by Design: Product and Process Development, Understanding, and Control. Pharm. Res. 2008, 25, 781–791. [Google Scholar] [CrossRef] [PubMed]
- Özdemir, S.; Çelik, B.; Acar, E.T.; Duman, G.; Üner, M. Eplerenone nanoemulsions for treatment of hypertension. Part I: Experimental design for optimization of formulations and physical characterization. J. Drug Deliv. Sci. Technol. 2018, 45, 357. [Google Scholar] [CrossRef]
- Kim, M.C.; Le, T.; Bao, C.; Kim, J.T.; Chun, H.S.; Shin, S.; Lee, H.J. Robust optimization for the simultaneous enhancement of nitric oxide inhibition and reduction of hepatotoxicity from green tea catechins. Food Sci. Biotechnol. 2017, 26, 1725–1734. [Google Scholar] [CrossRef] [PubMed]
- Deshmukh, N.N.; Chauhan, S.J.; Nair, S.S. Optimization of Acoustic Wave for Process Equipment Cleaning using Design of Experiments. In Proceedings of the 2019 International Conference on Nascent Technologies in Engineering (ICNTE), Navi Mumbai, India, 4–5 January 2019; pp. 1–5. [Google Scholar]
- Kim, Y.S.; Kim, J.D. Process Optimization for Plasma-sprayed CrO Coating by Design of Experiments. J. Power Syst. Eng. 2018, 22, 75–80. [Google Scholar] [CrossRef]
- Ray, D.; Roberts, T. DOE for product and process optimization, robustness, and tolerance design: 40mm IR illumination grenade. In Proceedings of the 2017 Annual Reliability and Maintainability Symposium (RAMS), Orlando, FL, USA, 23–26 January 2017; pp. 1–5. [Google Scholar]
- Ordonez, M.; Iqbal, M.T.; Quaicoe, J.E.; Lye, L.M. Modeling and Optimization of Direct Methanol Fuel Cells using Statistical Design of Experiment Methodology. In Proceedings of the 2006 Canadian Conference on Electrical and Computer Engineering, Ottawa, ON, Canada, 7–10 May 2006; pp. 1120–1124. [Google Scholar]
- Jeong, S.Y.; Lee, J.S.; Yoon, J.H. Optimal Nozzle Design of Bladeless Fan Using Design of Experiments. Trans. Korean Soc. Mech. Eng. A 2017, 41, 711–719. [Google Scholar]
- Son, I.S.; Shin, D.K. Optimum Design of Lock Snap-fit Using Design of Experiment. J. Korea Acad. Industr. Coop. Soc. 2017, 18, 378–385. [Google Scholar]
- Hwang, J.; Tseng, T.; Hsieh, Y.; Chou, F.; Wang, C.J.; Chu, C. Inhibitory effect of atractylon on tert-butyl hydroperoxide induced DNA damage and hepatic toxicity in rat hepatocytes. Arch. Toxicol. 1996, 70, 640–644. [Google Scholar] [CrossRef] [PubMed]
- Sakurai, T.; Yamada, H.; Saito, K.I.; Kano, Y. Enzyme Inhibitory Activities of Acetylene and Sesquiterpene Compounds in Atractylodes Rhizome. Biol. Pharm. Bull. 1993, 16, 142–145. [Google Scholar] [CrossRef] [PubMed] [Green Version]
- Bang, G.H.; Seong, J.S.; Park, C.H.; Kim, D.S.; Park, C.G.; Yu, H.S.; Park, H.U.; Seong, N.S. Discrimination of Atractylodes Rhizome White Using Anatomical Characteristics and SCAR Markers. Korean J. Med. Crop Sci. 2004, 12, 53–59. [Google Scholar]
- Cheng, N.; Ren, N.; Gao, H.; Lei, X.; Zheng, J.; Cao, W. Antioxidant and hepatoprotective effects of Schisandra chinensis pollen extract on CCl4-induced acute liver damage in mice. Food Chem. Toxicol. 2013, 55, 234. [Google Scholar] [CrossRef] [PubMed]
- Wei, B.; Li, Q.; Fan, R.; Su, D.; Chen, X.; Jia, Y.; Bi, K. Determination of monoamine and amino acid neurotransmitters and their metabolites in rat brain samples by UFLC–MS/MS for the study of the sedative-hypnotic effects observed during treatment with S. chinensis. J. Pharm. Biomed. Anal. 2014, 88, 416. [Google Scholar] [CrossRef] [PubMed]
- Bo, R.C.; Hye, K.K.; Jong, K.P. Effects of Schisandra chinensis fruit extract and gomisin A on the contractility of penile corpus cavernosum smooth muscle. Nutr. Res. Pract. 2018, 12, 291–297. [Google Scholar]
- Zhao, T.; Mao, G.; Zhang, M.; Zou, Y.; Feng, W.; Gu, X.; Zhu, Y.; Mao, R.; Yang, L.; Wu, X. Enhanced antitumor and reduced toxicity effect of Schisanreae polysaccharide in 5-Fu treated Heps-bearing mice. Int. J. Biol. Macromol. 2014, 63, 114. [Google Scholar] [CrossRef]
- Zhao, T.; Feng, Y.; Li, J.; Mao, R.; Zou, Y.; Feng, W.; Zheng, D.; Wang, W.; Chen, Y.; Yang, L.; et al. Schisandra polysaccharide evokes immunomodulatory activity through TLR 4-mediated activation of macrophages. Int. J. Biol. Macromol. 2014, 65, 33. [Google Scholar] [CrossRef] [PubMed]
- Jeong, E.J.; Lee, H.K.; Lee, K.Y.; Jeon, B.J.; Kim, D.H.; Park, J.; Song, J.; Huh, J.; Lee, J.; Sung, S.H. The effects of lignan-riched extract of Shisandra chinensis on amyloid-β-induced cognitive impairment and neurotoxicity in the cortex and hippocampus of mouse. J. Ethnopharmacol. 2013, 146, 347. [Google Scholar] [CrossRef] [PubMed]
- Pourseyyed-Aghaei, M.; Mahmoudi, J.; Zolghadri, M. Scheduling services in special trains using the QFD. Res. J. Transp. 2006, 4. [Google Scholar]
- Montgomery, D.C. Design and Analysis of Experiments, 8th ed.; John Wiley & Sons: Hoboken, NJ, USA, 2012; pp. 479–498. [Google Scholar]


| IVs | ORVs |
|---|---|
| X1 (Extraction temperature) X2 (Circulation velocity) X3 (Filter paper size) | Y1 (TDD) Y2 (SZD) Y3 (Yield) Y4 (Solid flour) |
| Level | Input Factors | ||
|---|---|---|---|
| X1 (Extraction Temperature) | X2 (Circulation Velocity) | X3 (Filter Paper Size) | |
| −1 | 5 | 0 | 2.5 |
| 0 | 25 | 100 | 6 |
| +1 | 45 | 200 | 8 |
| ORVs | p-Value | R2 | |
|---|---|---|---|
| Y1 (TDD) | AU | 0.00 | 84.87% |
| Area | 0.03 | 42.05% | |
| Y2 (SZD) | AU | 0.00 | 87.42% |
| Area | 0.03 | 47.35% | |
| Y3 (Yield) | 0.00 | 86.40% | |
| Y4 (Solid flour 60%) | 0.11 | 28.36% | |
| ORV | Goal | Lower Limit | Target Value | Upper Limit | |
|---|---|---|---|---|---|
| Y1 (TDD) | AU | Target value | 45,423 | 54,553 | 63,683 |
| Area | 226,000 | 339,000 | 452,000 | ||
| Y2 (SZD) | AU | 63,366 | 67,261 | 71,156 | |
| Area | 482,000 | 611,000 | 740,000 | ||
| Y3 (Yield) | Maximization | 28.9 | 60 | - | |
| Weight | |||||
|---|---|---|---|---|---|
| Cases | Y1(TDD) | Y2(SZD) | Y3 (Yield) | ||
| AU | Area | AU | Area | ||
| 1 | 1 | 1 | 1 | 1 | 1 |
| 2 | 10 | 10 | 10 | 10 | 1 |
| 3 | 5 | 10 | 5 | 10 | 5 |
| 4 | 10 | 10 | 5 | 5 | 5 |
| 5 | 5 | 5 | 10 | 10 | 5 |
| 6 | 5 | 5 | 5 | 5 | 10 |
| 7 | 1 | 10 | 1 | 10 | 1 |
| 8 | 5 | 10 | 5 | 10 | 1 |
| 9 | 1 | 10 | 1 | 10 | 0.5 |
| 10 | 1 | 10 | 1 | 10 | 0.1 |
| IVs | X1 (Extraction Temperature) | X2 (Circulation Velocity) | X3 (Filter Paper Size) |
|---|---|---|---|
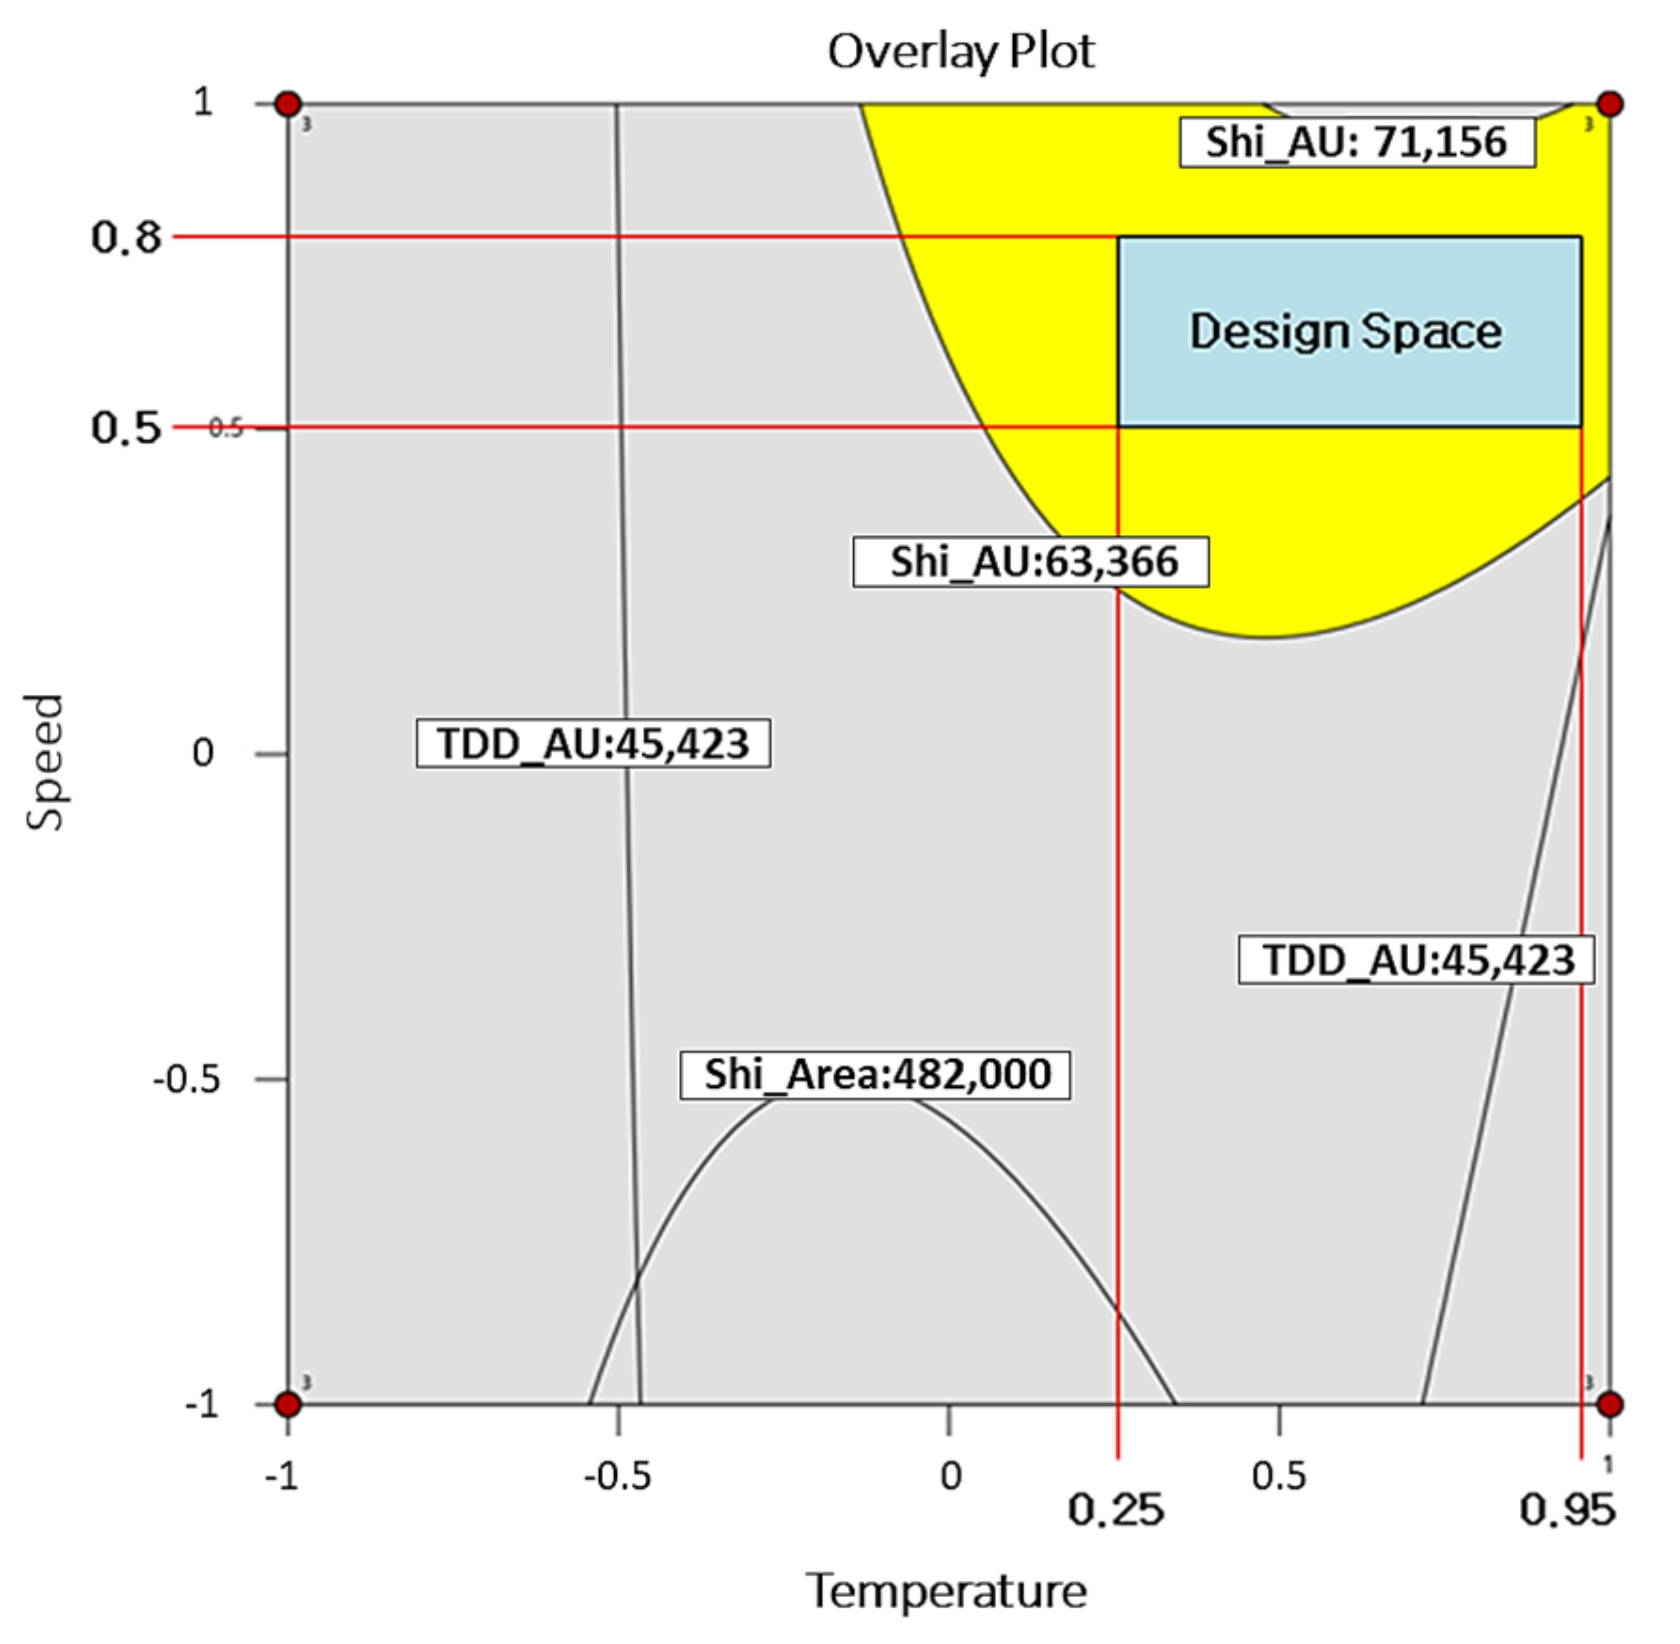
| Coded level | 0.95 | 0.76 | −1 |
| Uncoded level | 44 | 176 | 2.50 |
| Average Optimization Results | |||||
|---|---|---|---|---|---|
| Case 9 | Y1(TDD) | Y2(SZD) | Y3 (Yield) | ||
| AU | Area | AU | Area | ||
| Weight | 1 | 10 | 1 | 10 | 0.5 |
| Target value | 54,553 | 339,000 | 67,261 | 611,000 | 60 |
| Optimum value | 49,300 | 367,500 | 68,090 | 609,900 | 49.9542 |
| ORVs | Mean | Standard Deviation | Input Variable Condition | ||||||||||
|---|---|---|---|---|---|---|---|---|---|---|---|---|---|
| Experimental Results | Y1(TDD) | Y2(SZD) | Y3 (Yield) | Y1(TDD) | Y2(SZD) | X1 | X2 | X3 | |||||
| AU | Area | AU | Area | AU | Area | AU | Area | 5–45 | 0–200 | 2.5–8 | |||
| TV | 54,553 | 339,000 | 67,261 | 611,000 | 60 | 0 | 0 | 0 | 0 | ||||
| RE (◆◆) | PV ① | 49,300 | 367,500 | 68,090 | 609,900 | 49.95 | 2400 | 10,507 | 3062 | 35,553 | 44 | 176 | 2.5 |
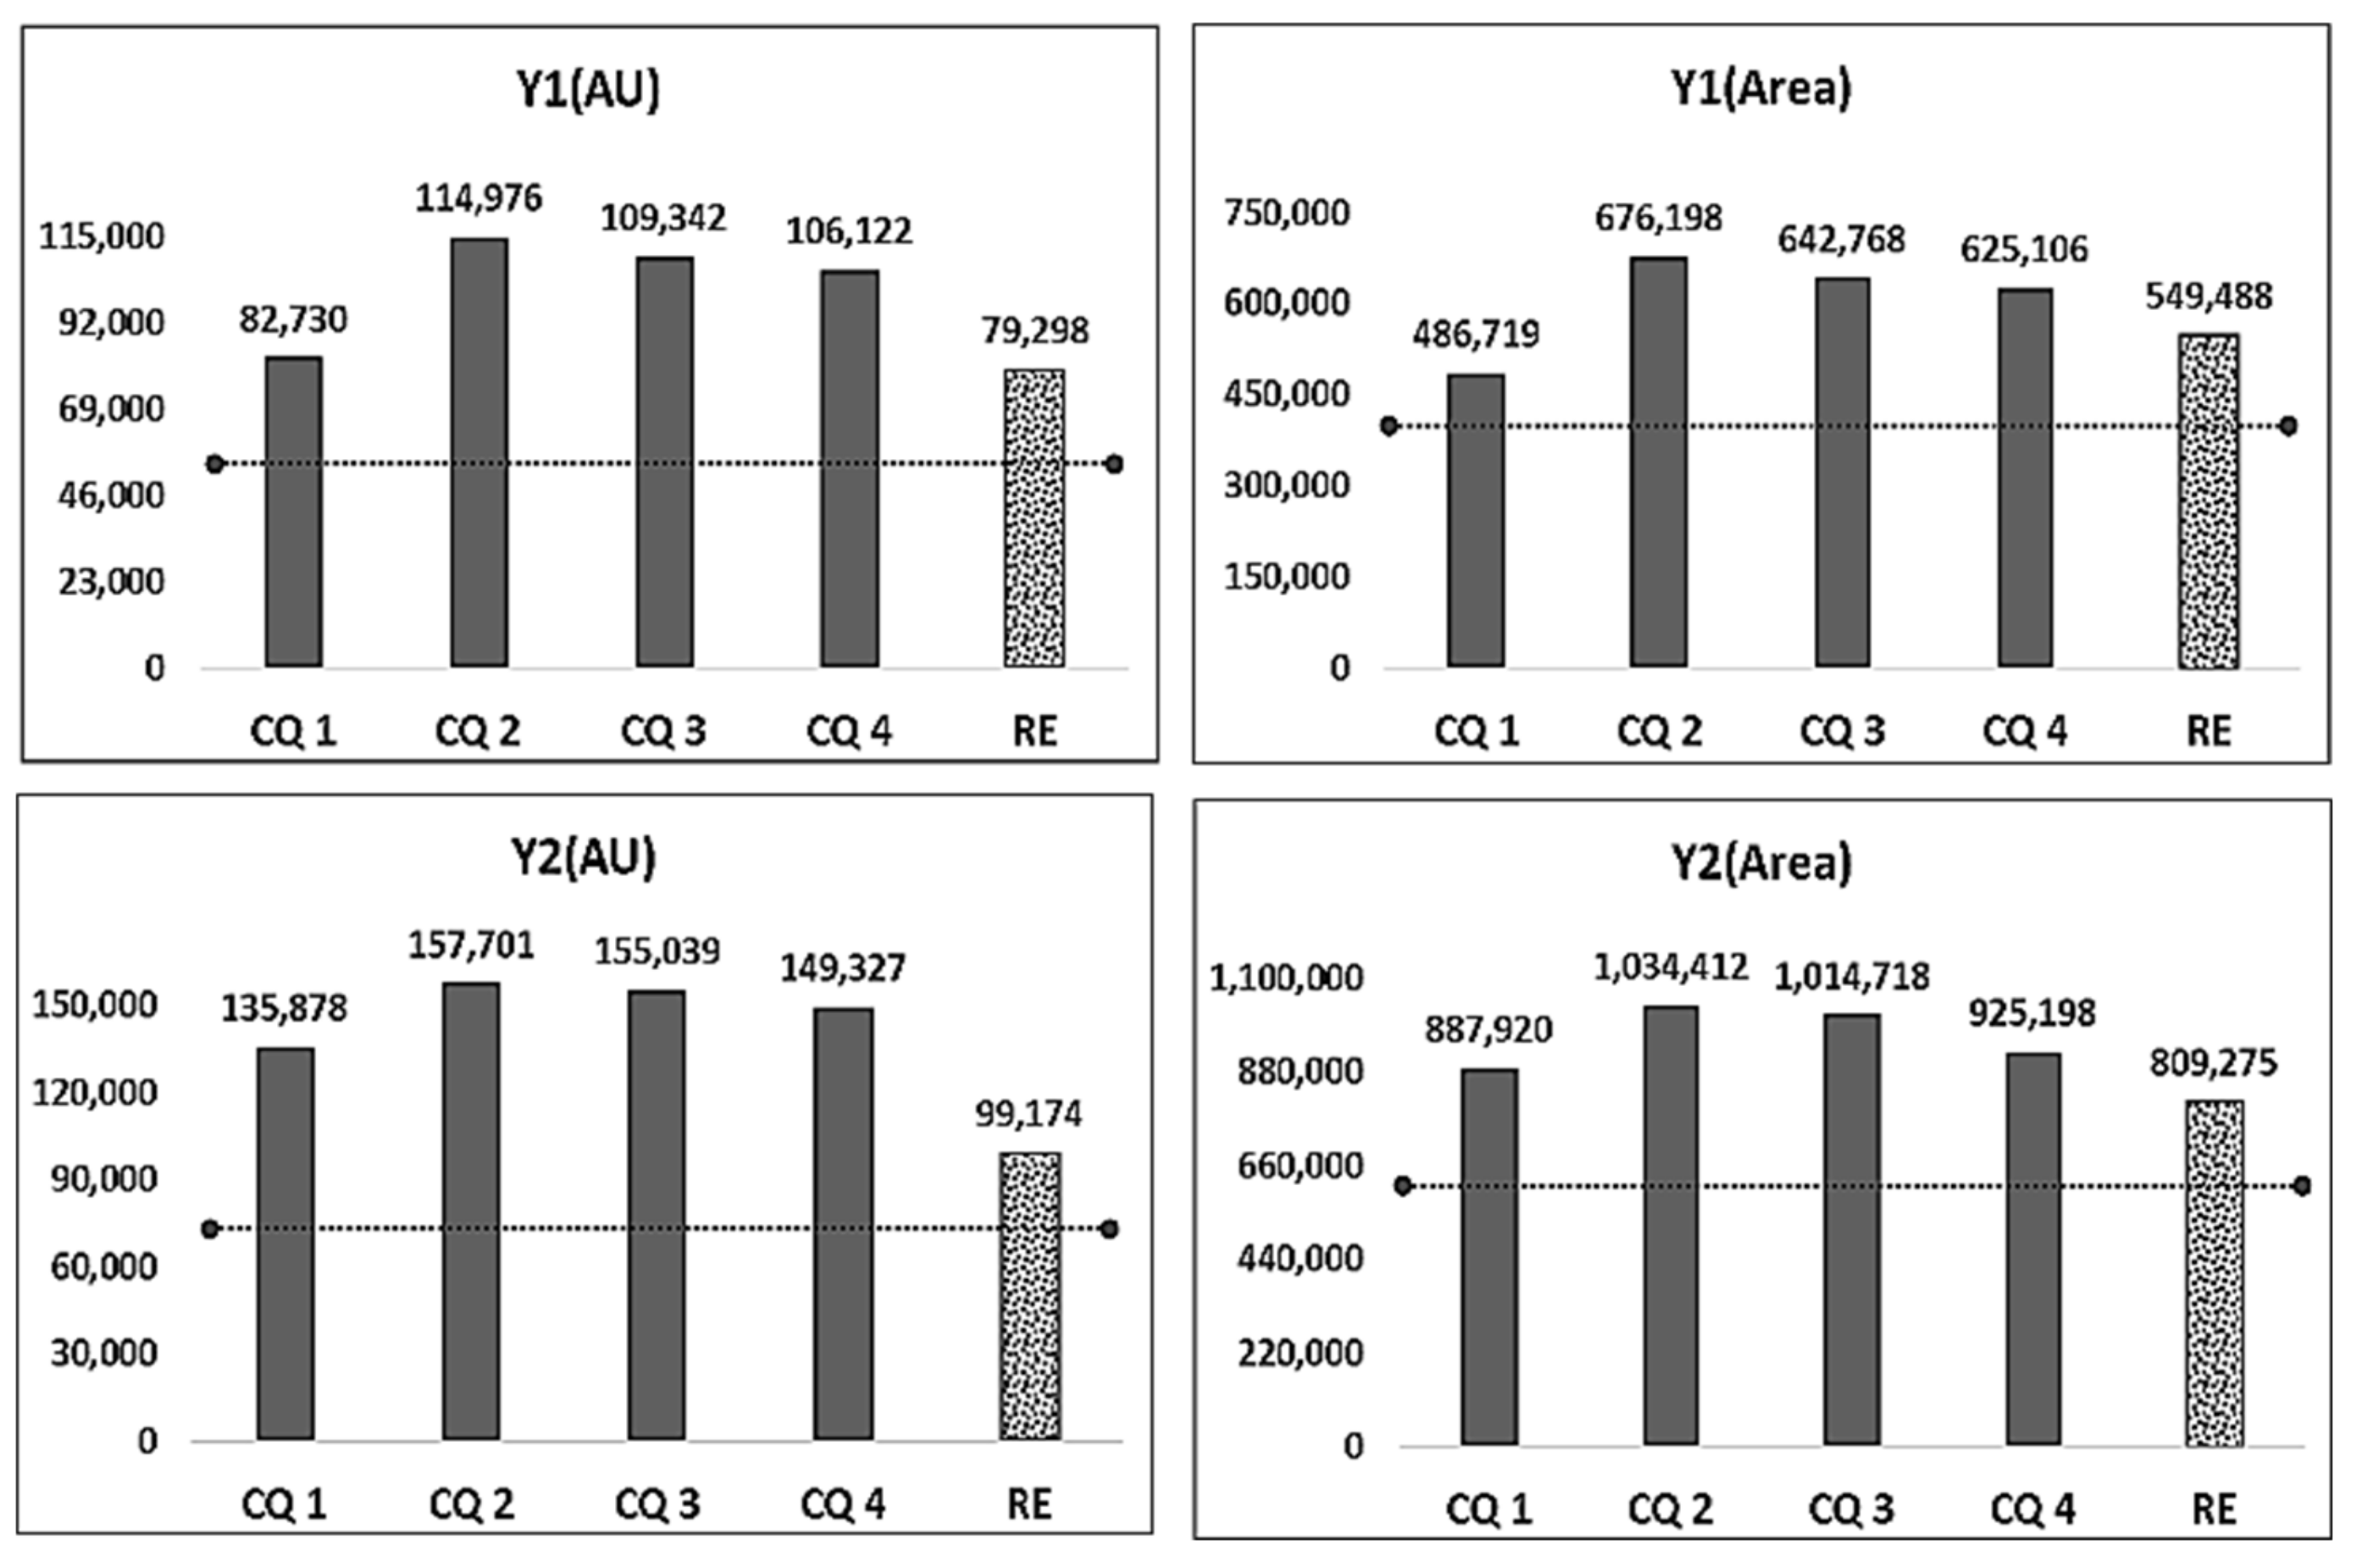
| EV ② | 79,298 | 549,488 | 99,174 | 809,275 | 50.14 | 2898 | 21,944 | 3678 | 33,782 | ||||
| ①–② | −29,998 | −181,988 | −31,084 | −199,375 | −0.19 | −498 | 11,437 | −616 | 1771 | ||||
| PE | PV ③ | 52,340 | 370,800 | 53,160 | 470,500 | - | 8160 | 60,349 | 9267 | 57,853 | 25 | 0 | 2.5 |
| CQ 1 (◆) | EV ④ | 82,730 | 486,719 | 135,878 | 887,920 | - | 3212 | 19,032 | 5576 | 36,378 | 25 | 0 | 2.5 |
| ③–④ | −30,390 | −115,919 | −82,718 | −417,420 | - | 4948 | 41,317 | 3691 | 21,475 | ||||
| CQ 2 (◆) | EV ⑤ | 114,976 | 676,198 | 157,701 | 1,034,412 | - | 16,149 | 94,348 | 22,490 | 149,369 | 25 | 0 | 2.5 |
| ③–⑤ | −62,636 | −305,398 | −104,541 | −563,912 | - | −7989 | −33,999 | −13,223 | −91,516 | ||||
| CQ 3 (◆) | EV ⑥ | 109,342 | 642,768 | 155,039 | 1,014,718 | - | 9865 | 57,786 | 13,781 | 90,688 | 25 | 0 | 2.5 |
| ③–⑥ | −57,002 | −271,968 | −101,879 | −544,218 | - | −1705 | 2563 | −4514 | −32,835 | ||||
| CQ 4 (◆) | EV ⑦ | 106,122 | 625,106 | 149,327 | 925,198 | - | 6683 | 40,392 | 9443 | 62,985 | 25 | 0 | 2.5 |
| ③–⑦ | −53,782 | −254,306 | −96,167 | −454,698 | - | 1477 | 19,957 | −176 | −5132 | ||||
© 2020 by the authors. Licensee MDPI, Basel, Switzerland. This article is an open access article distributed under the terms and conditions of the Creative Commons Attribution (CC BY) license (http://creativecommons.org/licenses/by/4.0/).
Share and Cite
Jang, H.-a.; Kim, S.Y.; Lim, Y.Y.; Lim, J.L.; Shin, S. Robust Optimization Approaches for a Natural Pharmaceutical Complex Product of Atractylodes Japonica Koidz and Schisandra Chinensis. Appl. Sci. 2020, 10, 7006. https://doi.org/10.3390/app10197006
Jang H-a, Kim SY, Lim YY, Lim JL, Shin S. Robust Optimization Approaches for a Natural Pharmaceutical Complex Product of Atractylodes Japonica Koidz and Schisandra Chinensis. Applied Sciences. 2020; 10(19):7006. https://doi.org/10.3390/app10197006
Chicago/Turabian StyleJang, Hyeon-ae, Sun Young Kim, Yun Young Lim, Jong Lae Lim, and Sangmun Shin. 2020. "Robust Optimization Approaches for a Natural Pharmaceutical Complex Product of Atractylodes Japonica Koidz and Schisandra Chinensis" Applied Sciences 10, no. 19: 7006. https://doi.org/10.3390/app10197006