Prosody-Based Measures for Automatic Severity Assessment of Dysarthric Speech


Abstract
:1. Introduction
2. Acoustic Measures
2.1. Prosody-Based Measures
2.2. Articulation and Phonation Based Measures
3. Methods
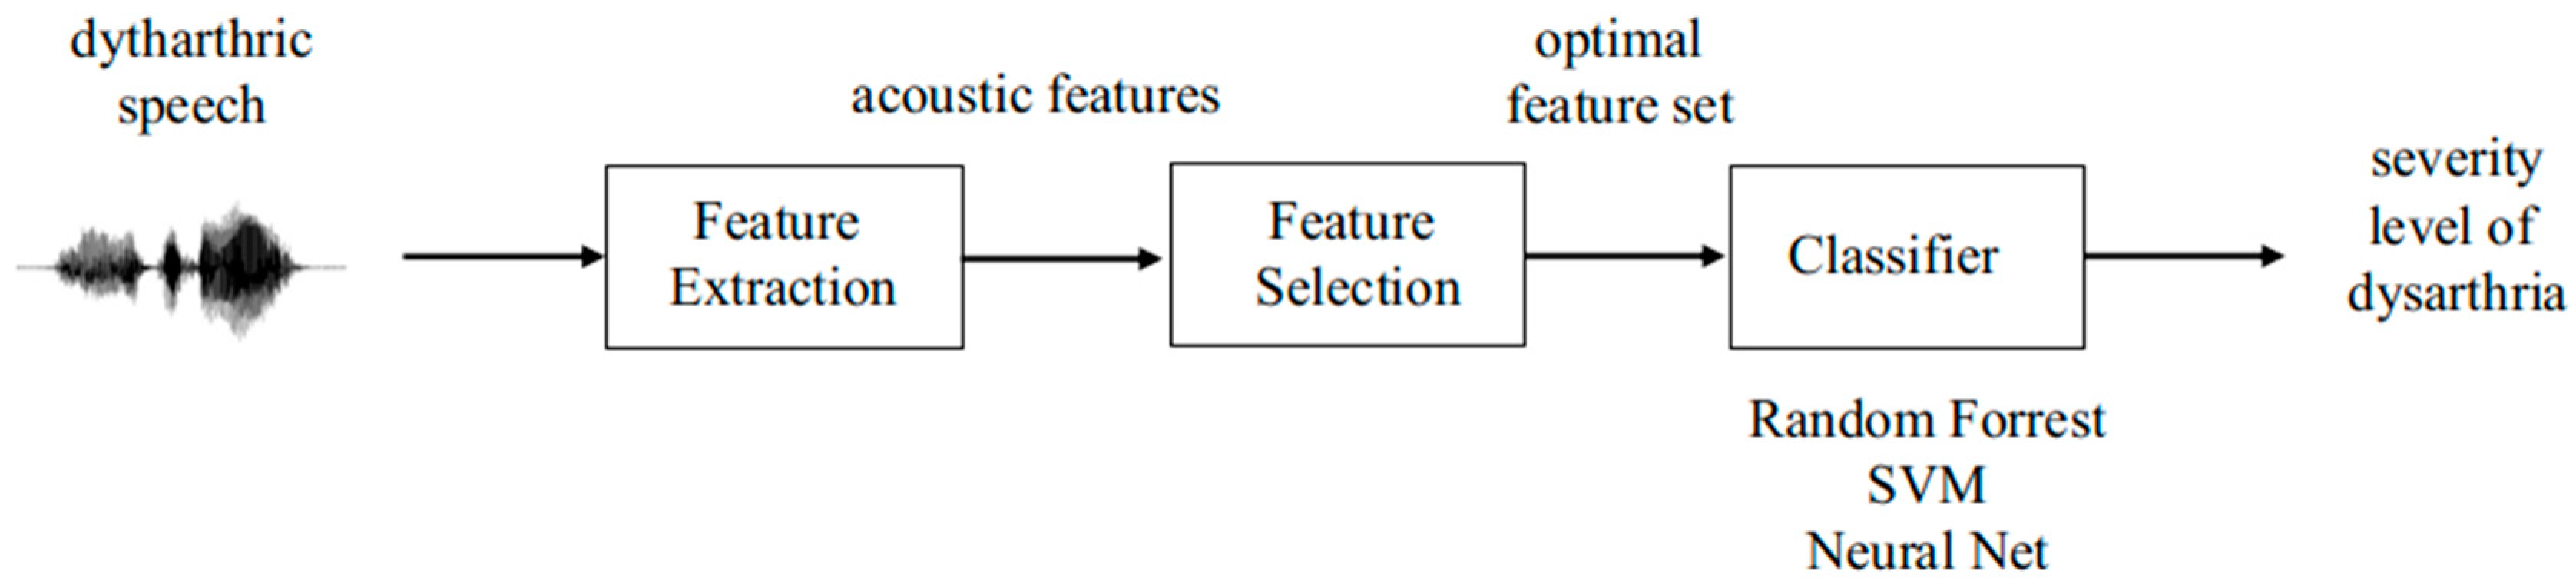
3.1. Dysarthria Severity Assessment
3.2. Feature Selection
4. Materials
4.1. English Corpus (TORGO)
4.2. Korean Corpus (QoLT)
4.3. Data Analysis
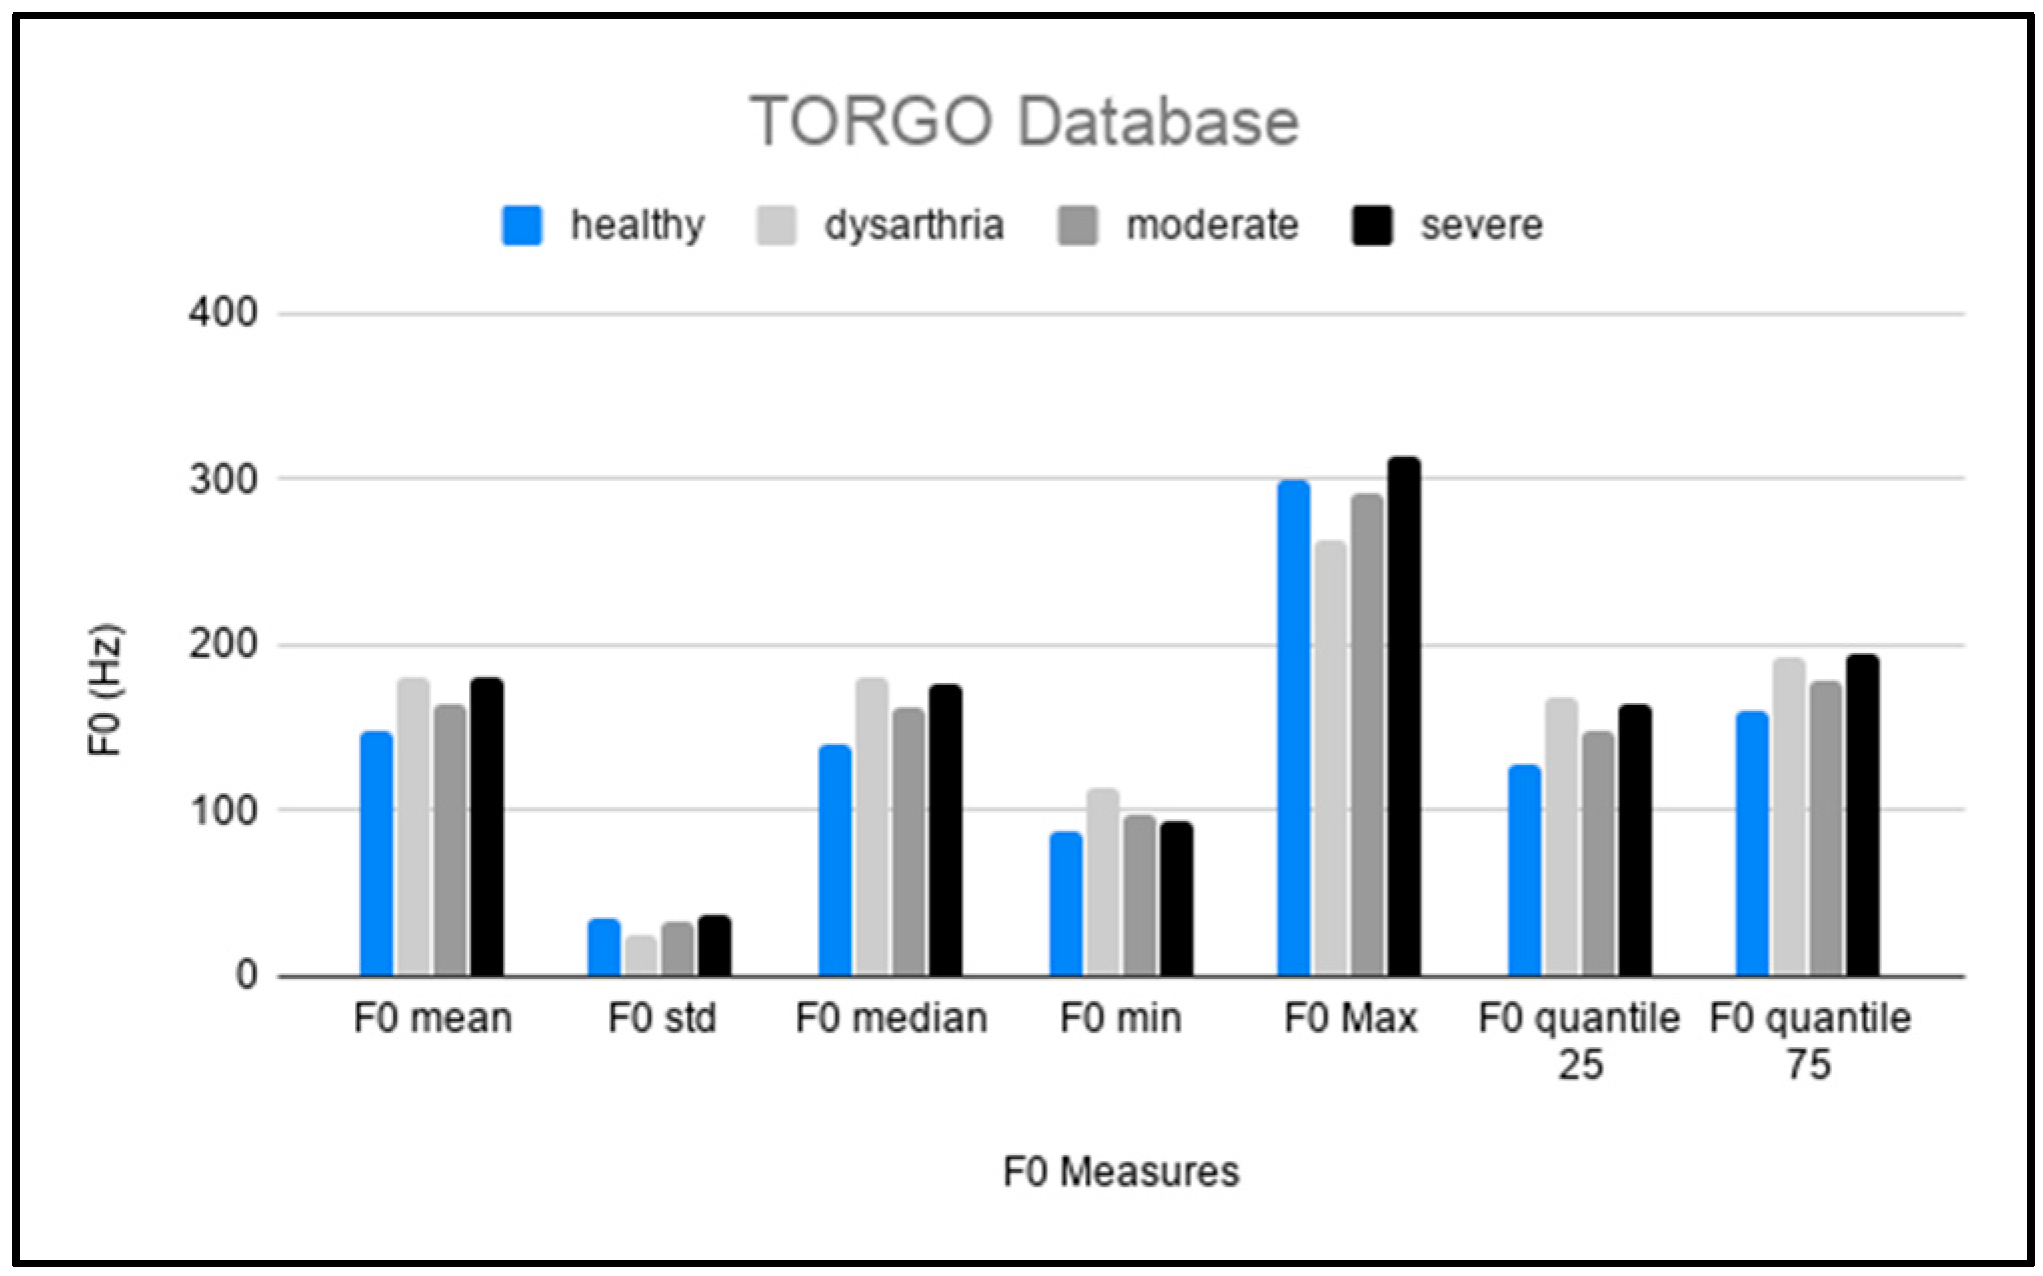
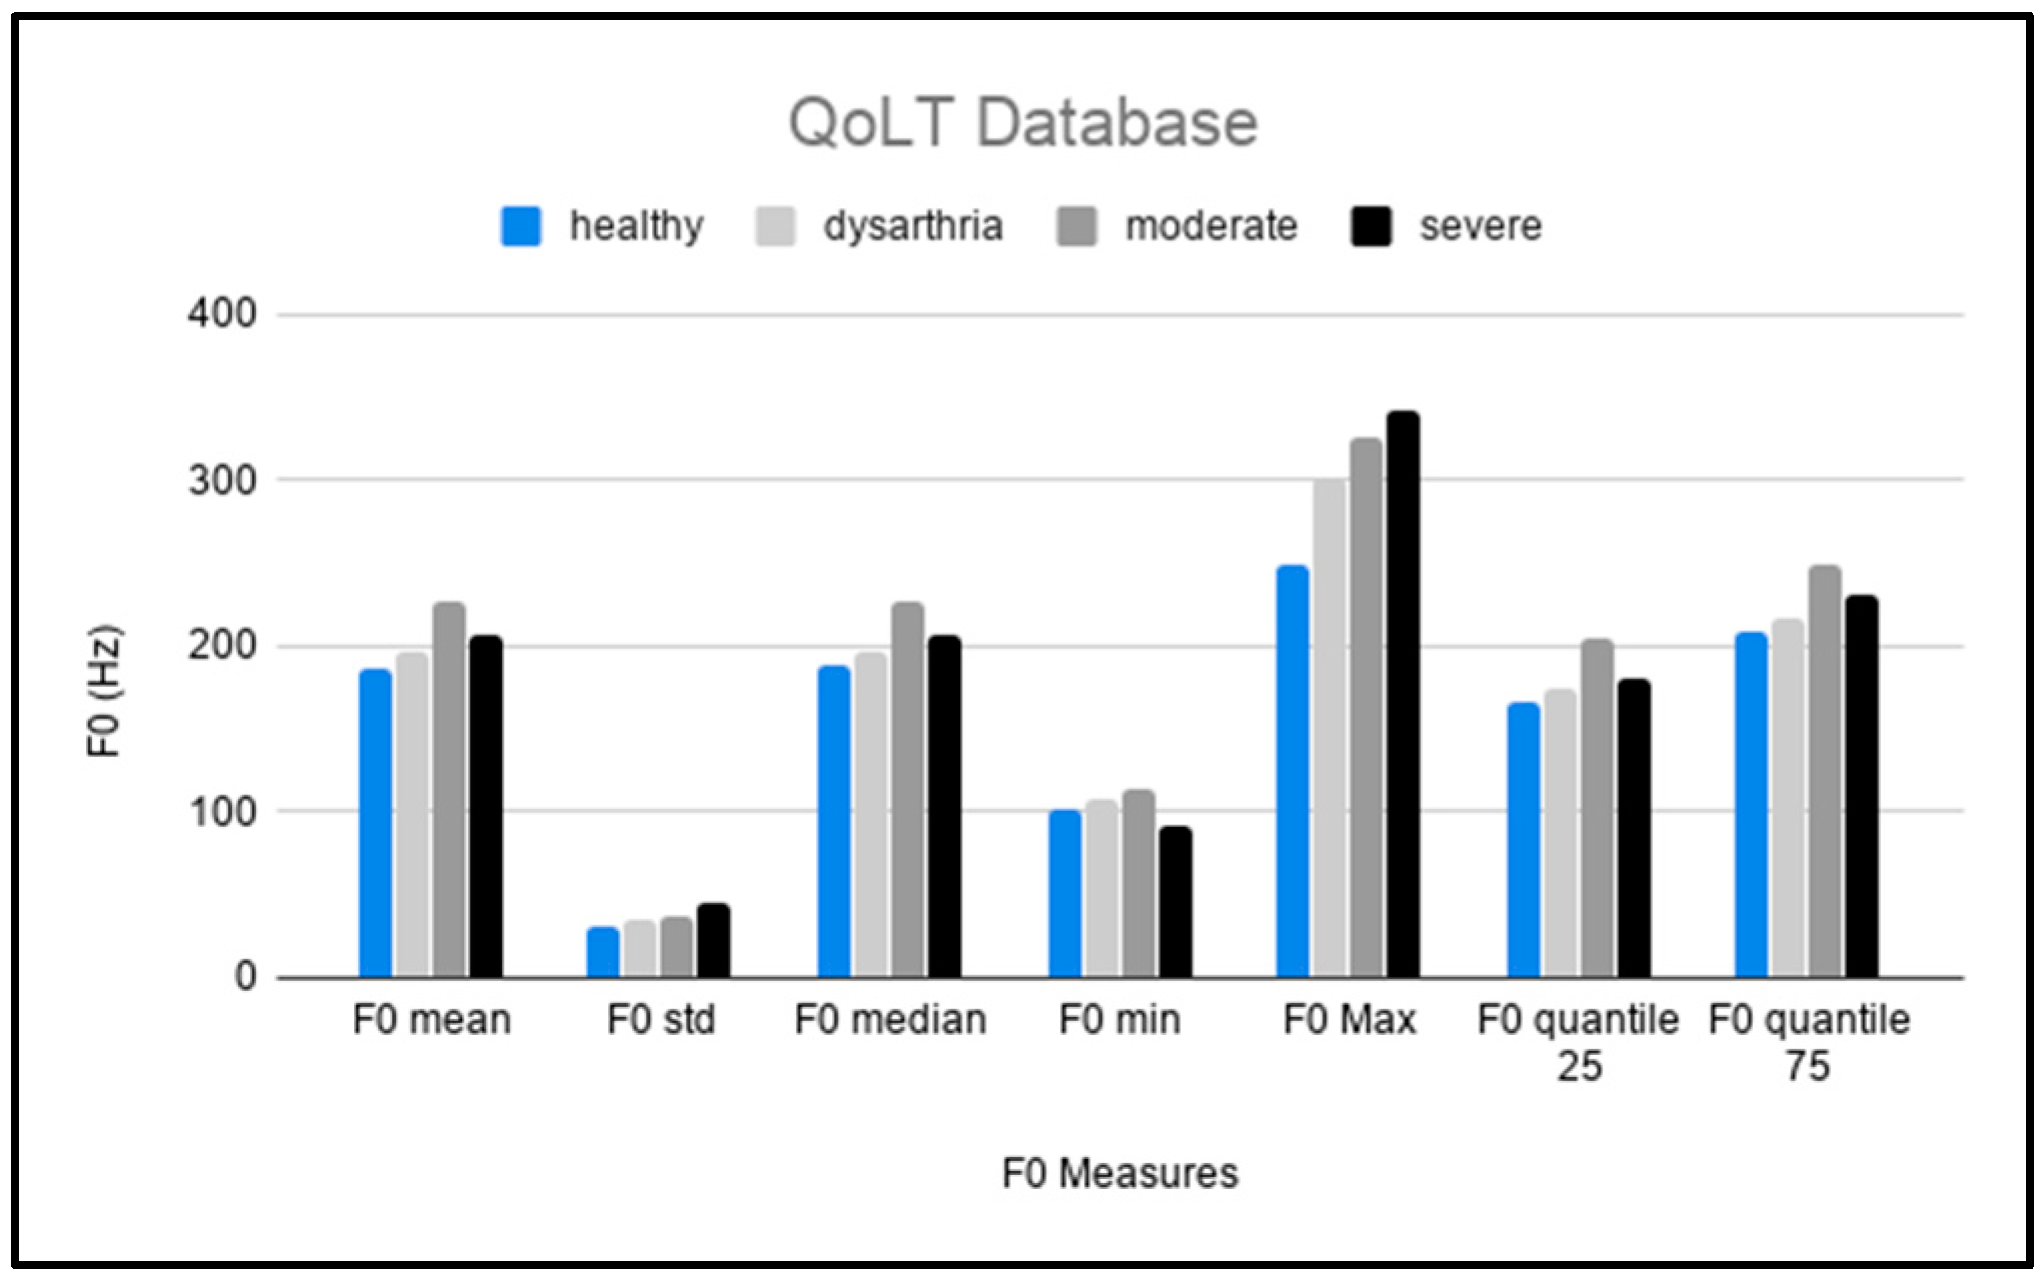
4.3.1. Pitch
4.3.2. Speech Rate
4.3.3. Rhythm
4.3.4. Voice Quality
4.3.5. Data Analysis Summary
4.4. Data Organization
5. Results
5.1. Feature Selection
5.2. TORGO
5.3. QoLT
6. Discussion & Conclusions
Author Contributions
Funding
Conflicts of Interest
Appendix A

| Type of Sentence | Examples |
|---|---|
| Restricted Sentences |
|
| Korean Hangul | Yale Romanization | English Translation |
|---|---|---|
| 추석에는 온 가족이 함께 송편을 만든다. | chwusekeynun on kacoki hamkkey songphyenul mantunta | In Chuseok, the whole family makes songpyeon together. |
| 갑자기 미국에 있는 오빠 얼굴이 보고 싶다. | kapcaki mikwukey issnun oppa elkwuli poko siphta. | Suddenly, I want to see my brother’s face who is in America. |
| 어제 하늘이 컴컴해지더니 비가 쏟아졌다. | ecey hanuli khemkhemhayciteni pika ssotacyessta. | The sky turned dark yesterday and it rained. |
| 동생이랑 싸워서 엄마한테 혼났다. | tongsayngilang ssawese emmahanthey honnassta. | My mom scolded me for fighting with my younger sibling. |
| 시원한 물 한 잔 주세요. | siwenhan mwul han can cwuseyyo. | I would like a glass of cold water. |
References
- Müller, J.; Wenning, G.K.; Verny, M.; McKee, A.; Chaudhuri, K.R.; Jellinger, K.; Poewe, W.; Litvan, I. Progression of Dysarthria and Dysphagia in Postmortem-Confirmed Parkinsonian Disorders. Arch. Neurol. 2001, 58, 259. [Google Scholar] [CrossRef] [PubMed]
- Sandyk, R. Resolution of Dysarthria in Multiple Sclerosis by Treatment with Weak Electromagnetic Fields. Int. J. Neurosci. 1995, 83, 81–92. [Google Scholar] [CrossRef] [PubMed]
- Traynor, B.J.; Codd, M.B.; Corr, B.; Forde, C.; Frost, E.; Hardiman, O.M. Clinical features of amyotrophic lateral sclerosis according to the El Escorial and Airlie House diagnostic criteria: A population-based study. Arch. Neurol. 2001, 57, 1171–1176. [Google Scholar] [CrossRef] [PubMed] [Green Version]
- Trapl, M.; Eckhardt, R.; Bosak, P.; Brainin, M. Early recognition of speech and speech-associated disorders after acute stroke. Wien. Med. Wochenschr. 2004, 154, 571–576. [Google Scholar] [CrossRef]
- Ali, M.; Lyden, P.; Brady, M. Aphasia and Dysarthria in Acute Stroke: Recovery and Functional Outcome. Int. J. Stroke 2015, 10, 400–406. [Google Scholar] [CrossRef]
- Kim, G.; Min, D.; Lee, E.; Kang, E.K. Impact of Co-occurring Dysarthria and Aphasia on Functional Recovery in Post-stroke Patients. Ann. Rehabil. Med. 2016, 40, 1010–1017. [Google Scholar] [CrossRef]
- Grossman, M.; Ash, S. Primary Progressive Aphasia: A Review. Neurocase 2004, 10, 3–18. [Google Scholar] [CrossRef]
- Ogar, J.M.; Dronkers, N.F.; Brambati, S.M.; Miller, B.L.; Gorno-Tempini, M.L. Progressive Nonfluent Aphasia and Its Characteristic Motor Speech Deficits. Alzheimer Dis. Assoc. Disord. 2007, 21, S23. [Google Scholar] [CrossRef]
- Kempler, D.; Metter, E.J.; Riege, W.H.; Jackson, C.A.; Benson, D.F.; Hanson, W.R. Slowly progressive aphasia: Three cases with language, memory, CT and PET data. J. Neurol. Neurosurg. Psychiatry 1990, 53, 987–993. [Google Scholar] [CrossRef]
- Delecluse, F.; Andersen, A.R.; Waldemar, G.; Thomson, A.-M.; Kjaer, L.; Lassen, N.A.; Postiglione, A. Cerebral blood flow in progressive aphasia without dementia. Brain 1990, 113, 1395–1404. [Google Scholar] [CrossRef]
- Duffy, J.R. Motor Speech Disorders E-Book: Substrates, Differential Diagnosis, and Management; Elsevier Health Sciences: Rochester, NY, USA, 2019; ISBN 978-0-323-55051-2. [Google Scholar]
- Kent, R.D.; Kent, J.F.; Rosenbek, J.C. Maximum Performance Tests of Speech Production. J. Speech Lang. Hear. R. 1987, 52, 367–387. [Google Scholar] [CrossRef] [PubMed]
- Darley, F.L.; Aronson, A.E.; Brown, J.R. Differential diagnostic patterns of dysarthria. Speech Lang. Hear. R. 1969, 12, 246–269. [Google Scholar] [CrossRef] [PubMed]
- Enderby, P. Frenchay Dysarthria Assessment. Br. J. Disord. Commun. 1980, 15, 165–173. [Google Scholar] [CrossRef]
- Zyski, B.J.; Weisiger, B.E. Identification of dysarthria types based on perceptual analysis. J. Commun. Disord. 1987, 20, 367–378. [Google Scholar] [CrossRef]
- Kearns, K.P.; Simmons, N.N. Interobserver Reliability and Perceptual Ratings. J. Speech Lang. Hear. R. 1988, 31, 131–136. [Google Scholar] [CrossRef]
- Zeplin, J.; Kent, R.D. Reliability of Auditory-Perceptual Scaling of Dysarthria. Disorders of Motor Speech: Assessment, Treatment, and Clinical Characterization; Brookes: Baltimore, MD, USA, 1996; pp. 145–154. [Google Scholar]
- López, J.V.E.; Orozco-Arroyave, J.R.; Gosztolya, G. Assessing Parkinson’s Disease from Speech Using Fisher Vectors. In Proceedings of the Annual Conference of the International Speech Communication Association (INTERSPEECH), Graz, Austria, 15–19 September 2019; pp. 3063–3067. [Google Scholar] [CrossRef] [Green Version]
- Kodrasi, I.; Bourlard, H. Super-gaussianity of Speech Spectral Coefficients as a Potential Biomarker for Dysarthric Speech Detection. In Proceedings of the IEEE International Conference on Acoustics, Speech and Signal Processing (ICASSP), Brighton, UK, 12–17 May 2019; pp. 6400–6404. [Google Scholar] [CrossRef]
- Tripathi, A.; Bhosale, S.; Kopparapu, S.K. Improved Speaker Independent Dysarthria Intelligibility Classification Using Deepspeech Posteriors. In Proceedings of the IEEE International Conference on Acoustics, Speech and Signal Processing (ICASSP), Barcelona, Spain, 4–8 May 2020; pp. 6114–6118. [Google Scholar] [CrossRef]
- Millet, J.; Zeghidour, N. Learning to Detect Dysarthria from Raw Speech. In Proceedings of the IEEE International Conference on Acoustics, Speech and Signal Processing (ICASSP), Brighton, UK, 12–17 May 2019; pp. 5831–5835. [Google Scholar] [CrossRef] [Green Version]
- Mayle, A.; Mou, Z.; Bunescu, R.; Mirshekarian, S.; Xu, L.; Liu, C. Diagnosing Dysarthria with Long Short-Term Memory Networks. In Proceedings of the Annual Conference of the International Speech Communication Association (INTERSPEECH), Graz, Austria, 15–19 September 2019; pp. 4514–4518. [Google Scholar]
- Kim, J.; Kumar, N.; Tsiartas, A.; Li, M.; Narayanan, S.S. Automatic intelligibility classification of sentence-level pathological speech. Comput. Speech. Lang. 2015, 29, 132–144. [Google Scholar] [CrossRef] [Green Version]
- An, K.; Kim, M.; Teplansky, K.; Green, J.; Campbell, T.; Yunusova, Y.; Heitzman, D.; Wang, J. Automatic Early Detection of Amyotrophic Lateral Sclerosis from Intelligible Speech Using Convolutional Neural Networks. In Proceedings of the Annual Conference of the International Speech Communication Association (INTERSPEECH), Hyderabad, India, 2–6 September 2018; pp. 1913–1917. [Google Scholar] [CrossRef] [Green Version]
- Hernandez, A.; Lee, H.Y.; Chung, M.H. Acoustic analysis of fricatives in dysarthric speakers with cerebral palsy. Phon. Speech Sci. 2019, 11, 23–29. [Google Scholar] [CrossRef] [Green Version]
- Hernandez, A.; Chung, M.H. Dysarthria Classification Using Acoustic Properties of Fricatives. In Proceedings of the Seoul International Conference on Speech Sciences (SICSS), Seoul, Korea, 15–16 November 2019; pp. 43–44. [Google Scholar]
- Narendra, N.P.; Alku, P. Dysarthric Speech Classification Using Glottal Features Computed from Non-words, Words and Sentences. In Proceedings of the Annual Conference of the International Speech Communication Association (INTERSPEECH), Hyderabad, India, 2–6 September 2018; pp. 3403–3407. [Google Scholar] [CrossRef] [Green Version]
- Rusz, J.; Cmejla, R.; Ruzickova, H.; Ruzicka, E. Quantitative acoustic measurements for characterization of speech and voice disorders in early untreated Parkinson’s disease. J. Acoust. Soc. Am. 2011, 129, 350–367. [Google Scholar] [CrossRef] [Green Version]
- Bocklet, T.; Nöth, E.; Stemmer, G.; Ruzickova, H.; Rusz, J. Detection of persons with Parkinson’s disease by acoustic, vocal, and prosodic analysis. In Proceedings of the 2011 IEEE Workshop on Automatic Speech Recognition Understanding, Waikoloa, HI, USA, 11–15 December 2011; pp. 478–483. [Google Scholar] [CrossRef] [Green Version]
- Schlenck, K.J.; Bettrich, R.; Willmes, K. Aspects of disturbed prosody in dysarthria. Clin. Linguist. Phon. 1993, 7, 119–128. [Google Scholar] [CrossRef]
- Bunton, K.; Kent, R.D.; Kent, J.F.; Rosenbek, J.C. Perceptuo-acoustic assessment of prosodic impairment in dysarthria. Clin. Linguist. Phon. 2000, 14, 13–24. [Google Scholar] [CrossRef]
- Lowit-Leuschel, A.; Docherty, G.J. Prosodic variation across sampling tasks in normal and dysarthric speakers. Logoped. Phoniatr. Vocol. 2001, 26, 151–164. [Google Scholar] [CrossRef] [PubMed]
- Nam, H.; Kwon, D. Prosodic Characteristics in the Persons with Spastic and Athetoid Cerebral Palsy. J. Speech Hear. Dis. 2005, 14, 111–127. [Google Scholar]
- Kang, Y.; Yoon, K.; Seong, C.; Park, H.; Kang, Y.; Yoon, K.; Seong, C.; Park, H. A Preliminary Study of the Automated Assessment of Prosody in Patients with Parkinson’s Disease. Commun. Sci. Disord. 2012, 17, 234–248. [Google Scholar]
- Seo, I.H.; Seong, C.J.; Seo, I.H.; Seong, C.J. The Prosodic Characteristics of Dysarthria with Respect to Speech Rate and Intonation Slope. Commun. Sci. Disord. 2012, 17, 390–402. [Google Scholar]
- Kadi, K.L.; Selouani, S.A.; Boudraa, B.; Boudraa, M. Discriminative prosodic features to assess the dysarthria severity levels. In Proceedings of the World Congress on Engineering (WCE), London, UK, 3–5 July 2013; Volume 3. [Google Scholar]
- Menendez-Pidal, X.; Polikoff, J.B.; Peters, S.M.; Leonzio, J.E.; Bunnell, H.T. The Nemours database of dysarthric speech. In Proceedings of the Proceeding of Fourth International Conference on Spoken Language Processing (ICSLP), Philadelphia, PA, USA, 3–6 October 1996; Volume 3, pp. 1962–1965. [Google Scholar] [CrossRef] [Green Version]
- Hernandez, A.; Yeo, E.J.; Kim, S.H.; Chung, M.H. Dysarthria Detection and Severity Assessment using Rhythm-Based Metrics. In Proceedings of the Annual Conference of the International Speech Communication Association (INTERSPEECH), Shanghai, China, 25–29 October 2020. [Google Scholar]
- Roach, P. English Phonetics and Phonology Paperback with Audio CDs (2): A Practical Course; Cambridge University Press: Cambridge, UK, 2009; ISBN 978-0-521-71740-3. [Google Scholar]
- Jun, S.A. Korean Intonational Phonology and Prosodic Transcription. Prosodic Typology: The Phonology of Intonation and Phrasing; Oxford University Press: Oxford, UK, 2005; Volume 1, p. 201. ISBN 978-0-19-924963-3. [Google Scholar]
- Roach, P. On the distinction between ‘stress-timed’ and ‘syllable-timed’ languages. Linguist. Controv. 1982, 73, 79. [Google Scholar]
- Jang, T.Y. Rhythm metrics of spoken Korean. Lang. Linguist. 2009, 46, 169–186. [Google Scholar]
- Mok, P.; Lee, S.I. Korean speech rhythm using rhythmic measures. In Proceedings of the 18th International Congress of Linguists (CIL18), Seoul, Korea, 21–26 July 2008. [Google Scholar]
- Lee, H.B.; Jin, N.T.; Seong, C.J.; Jung, I.J.; Lee, S.M. An experimental phonetic study of speech rhythm in Standard Korean. In Proceedings of the Third International Conference on Spoken Language Processing (ICSLP), Yokohama, Japan, 18–22 September 1994; pp. 1091–1094. [Google Scholar]
- Lee, H.Y. The Structure of Korean Prosody. Ph.D. Thesis, University of London, London, UK, 1990. [Google Scholar]
- Cho, M.H. Rhythm typology of Korean speech. Cogn. Process. 2004, 5, 249–253. [Google Scholar]
- Jadoul, Y.; Thompson, B.; de Boer, B. Introducing Parselmouth: A Python interface to Praat. J. Phon. 2018, 71, 1–15. [Google Scholar] [CrossRef] [Green Version]
- Mairano, P.; Romano, A. Un confronto tra diverse metriche ritmiche usando Correlatore 1.0. La Dimensione Temporale del Parlato 2010, 427, 44. [Google Scholar]
- Ramus, F.; Nespor, M.; Mehler, J. Correlates of linguistic rhythm in the speech signal. Cognition 1999, 73, 265–292. [Google Scholar] [CrossRef] [Green Version]
- Grabe, E.; Low, E.L. Durational variability in speech and the rhythm class hypothesis. Papers Lab. Phonol. 2002, 7, 515–546. [Google Scholar]
- Dellwo, V.; Wagner, P. Relationships between speech rate and rhythm. In Proceedings of the International Congress of Phonetic Sciences (ICPhS), Barcelona, Spain, 3–9 August 2003; pp. 471–474. [Google Scholar]
- Dogan, M.; Midi, I.; Yazıcı, M.A.; Kocak, I.; Günal, D.; Sehitoglu, M.A. Objective and Subjective Evaluation of Voice Quality in Multiple Sclerosis. J. Voice 2007, 21, 735–740. [Google Scholar] [CrossRef] [PubMed]
- Borrie, S.A.; Lubold, N.; Pon-Barry, H. Disordered speech disrupts conversational entrainment: A study of acoustic-prosodic entrainment and communicative success in populations with communication challenges. Front. Psychol. 2015, 6, 1187. [Google Scholar] [CrossRef] [PubMed] [Green Version]
- Boersma, P.; Weenink, D. Praat: Doing Phonetics by Computer [Computer Program]. Version 6.0.37, Retrieved March 2020. Available online: http://www.praat.org/ (accessed on 2 March 2020).
- Jović, A.; Brkić, K.; Bogunović, N. A review of feature selection methods with applications. In Proceedings of the 38th International Convention on Information and Communication Technology Electronics and Microelectronics (MIPRO), Opatija, Croatia, 25–29 May 2015; pp. 1200–1205. [Google Scholar]
- Asir, D.; Gnana, A.; Leavline, E.J. Literature review on feature selection methods for high-dimensional data. Int. J. Comput. Appl. 2016, 975, 8887. [Google Scholar] [CrossRef]
- Chandrashekar, G.; Sahin, F. A survey on feature selection methods. Comput. Electr. Eng. 2014, 40, 16–28. [Google Scholar] [CrossRef]
- Kim, H.; Hasegawa-Johnson, M.; Perlman, A.; Gunderson, J.; Huang, T.S.; Watkin, K.; Frame, S. Dysarthric speech database for universal access research. In Proceedings of the Annual Conference of the International Speech Communication Association (INTERSPEECH), Brisbane, Australia, 22–26 September 2008; pp. 1741–1744. [Google Scholar]
- Rudzicz, F.; Namasivayam, A.K.; Wolff, T. The TORGO database of acoustic and articulatory speech from speakers with dysarthria. Lang. Resour. Eval. 2012, 46, 523–541. [Google Scholar] [CrossRef]
- Choi, D.L.; Kim, B.W.; Kim, Y.W.; Lee, Y.J.; Um, Y.; Chung, M. Dysarthric Speech Database for Development of QoLT Software Technology. In Proceedings of the Eighth International Conference on Language Resources and Evaluation (LREC), Istanbul, Turkey, 21–27 May 2012; pp. 3378–3381. [Google Scholar]
- Pedregosa, F.; Varoquaux, G.; Gramfort, A.; Michel, V.; Thirion, B.; Grisel, O.; Blondel, M.; Prettenhofer, P.; Weiss, R.; Dubourg, V.; et al. Scikit-learn: Machine learning in Python. J. Mach. Learn. Res. 2011, 12, 2825–2830. [Google Scholar]
- Orozco-Arroyave, J.R.; Hönig, F.; Arias-Londoño, J.D.; Vargas-Bonilla, J.F.; Daqrouq, K.; Skodda, S.; Rusz, J.; Nöth, E. Automatic detection of Parkinson’s disease in running speech spoken in three different languages. J. Acoust. Soc. Am. 2016, 139, 481–500. [Google Scholar] [CrossRef] [Green Version]
- Bhat, C.; Vachhani, B.; Kopparapu, S.K. Automatic assessment of dysarthria severity level using audio descriptors. In Proceedings of the IEEE International Conference on Acoustics, Speech and Signal Processing (ICASSP), New Orleans, LA, USA, 5–9 March 2017; pp. 5070–5074. [Google Scholar]


| Pitch | Speech Rate | Rhythm |
|---|---|---|
| %V | ||
| F0 mean | # of syllables | Delta-V |
| F0 median | # of pauses | Delta-C |
| F0 min | Utterance duration | Varco-V |
| F0 max | Speaking duration | Varco-C |
| F0 std | Speaking rate | VrPVI |
| F0 quantile 25 | Articulation rate | CrPVI |
| F0 quantile 75 | Balance | VnPVI |
| CnPVI |
| Parameters | # of Hidden Layers | # of Neurons | Activation Function | Optimizer | Learning Rate |
|---|---|---|---|---|---|
| Values | 1, 2, 3, 4 | 25–100 | Logistic, tanh, ReLU | Adam, SGD, LBFGS | 0.0001–0.1 |
| Corpus | Speaker Group | # of Syllables | # of Pauses | Speaking Rate | Artic. Rate | Speaking Duration (s) | Total Duration (s) |
|---|---|---|---|---|---|---|---|
| TORGO | Healthy Mild Moderate Severe | 9.12 10.67 10.78 12.21 | 0.17 1.40 2.09 1.82 | 2.00 1.75 1.78 1.69 | 4.14 3.53 3.33 3.17 | 2.22 3.10 3.38 3.77 | 4.50 6.22 6.60 7.13 |
| QoLT | Healthy Mild Moderate Severe | 11.75 13.14 13.91 17.53 | 0.09 1.45 3.29 4.74 | 3.00 2.29 1.69 1.64 | 4.58 3.82 3.42 3.47 | 2.52 3.58 4.19 5.29 | 3.83 6.00 8.96 11.49 |
| Speaker | %V | Delta-V | Delta-C | Varco-V | Varco-C | VrPVI | CrPVI | VnPVI | CnPVI |
|---|---|---|---|---|---|---|---|---|---|
| TORGO-healthy | 41.72 | 60.70 | 73.28 | 53.18 | 50.89 | 66.20 | 81.85 | 55.85 | 56.89 |
| TORGO-mild | 42.50 | 66.23 | 72.56 | 54.18 | 50.00 | 71.14 | 75.01 | 57.67 | 52.89 |
| TORGO-mod | 41.78 | 94.23 | 104.32 | 47.03 | 50.92 | 105.87 | 113.87 | 50.48 | 55.48 |
| TORGO-severe | 46.23 | 121.06 | 147.46 | 50.24 | 64.21 | 133.62 | 162.25 | 53.40 | 67.41 |
| QoLT-healthy | 54.37 | 65.69 | 51.79 | 57.59 | 55.23 | 67.52 | 65.78 | 61.51 | 70.36 |
| QoLT-mild | 54.06 | 98.74 | 77.74 | 59.94 | 57.26 | 101.99 | 93.62 | 61.89 | 69.06 |
| QoLT-mod | 56.31 | 120.13 | 93.47 | 56.58 | 59.62 | 126.75 | 105.42 | 59.95 | 67.26 |
| QoLT-severe | 64.71 | 217.85 | 125.35 | 58.88 | 64.22 | 237.38 | 139.24 | 60.90 | 71.84 |
| Corpus | Speaker Group | Jitter | Shimmer | HNR | # of VB | % of VB |
|---|---|---|---|---|---|---|
| TORGO | Healthy Mild Moderate Severe | 1.85 2.02 1.80 2.24 | 11.46 9.76 7.98 8.46 | 9.59 10.23 13.75 12.67 | 6.00 6.70 7.80 9.29 | 17.13 16.71 27.10 20.86 |
| QoLT | Healthy Mild Moderate Severe | 1.68 1.53 1.62 1.69 | 7.54 7.08 6.94 7.37 | 15.12 15.78 16.14 15.50 | 5.71 7.89 9.30 11.84 | 13.15 20.90 33.39 34.58 |
| Feature Selection Method | TORGO Accuracy % | QoLT Accuracy % |
|---|---|---|
| Filter Method | 64.29 | 65.81 |
| Tree-Based | 64.71 | 66.67 |
| Lasso-Based | 63.87 | 62.39 |
| RFE | 66.39 | 63.25 |
| All | 61.76 | 64.96 |
| Prosodic Group | Optimal Features for TORGO | Optimal Features for QoLT |
|---|---|---|
| Pitch | F0 mean, F0 median, F0 quantile 25, F0 quantile 75 | F0 median, F0 quantile 75, F0 quantile 25, F0 max, F0 min, F0 mean, F0 std |
| Speech Rate | number of pauses, speaking duration, total duration, balance | total duration, number of pauses, speaking duration, balance, speaking rate |
| Rhythm | Delta-V, Delta-C, Varco-C, VrPVI, CrPVI, VnPVI | %V, VrPVI, VnPVI, Varco-C, CnPVI, Varco-V, Delta-C, Delta-V, CrPVI |
| Features | TORGO Accuracy % | QoLT Accuracy % |
|---|---|---|
| Prosody | 66.39 | 66.67 |
| MFCC | 64.02 | 60.00 |
| Voice Quality | 53.82 | 58.76 |
| Classifier | Accuracy % MFCC + Prosody | Accuracy % MFCC + Voice Quality | Accuracy % Prosody + Voice Quality | Accuracy % All Acoustic Features |
|---|---|---|---|---|
| RF | 60.50 | 57.98 | 58.40 | 62.18 |
| SVM | 68.91 | 67.65 | 68.07 | 71.00 |
| NN | 75.63 | 69.33 | 65.97 | 73.89 |
| Features | Evaluation Metrics | Healthy | Mild | Moderate | Severe |
|---|---|---|---|---|---|
| Only MFCC | F1-score % Precision % Recall % | 84.30 82.26 86.44 | 52.34 68.29 42.42 | 50.32 70.91 39.00 | 73.68 59.32 97.22 |
| MFCC + Prosody | F1-score % Precision % Recall % | 86.23 82.81 89.84 | 82.11 80.90 83.34 | 57.14 52.33 63.00 | 68.02 82.92 57.61 |
| Classifier | Accuracy % MFCC + Prosody | Accuracy % MFCC + Voice Quality | Accuracy % Prosody + Voice Quality | Accuracy % All Acoustic Features |
|---|---|---|---|---|
| RF | 66.73 | 64.11 | 60.73 | 70.10 |
| SVM | 65.78 | 66.67 | 64.11 | 67.52 |
| NN | 56.40 | 54.72 | 57.78 | 61.51 |
| Features | Evaluation Metrics | Healthy | Mild | Moderate | Severe |
|---|---|---|---|---|---|
| Only MFCC | F1-score% Precision % Recall % | 90.00 87.45 93.37 | 43.10 52.52 36.73 | 48.6 42.53 56.70 | 49.11 51.99 46.72 |
| MFCC + Prosody | F1-score % Precision % Recall % | 100.00 100.00 100.00 | 72.78 66.67 80.00 | 55.11 63.32 48.74 | 36.04 33.33 39.11 |
© 2020 by the authors. Licensee MDPI, Basel, Switzerland. This article is an open access article distributed under the terms and conditions of the Creative Commons Attribution (CC BY) license (http://creativecommons.org/licenses/by/4.0/).
Share and Cite
Hernandez, A.; Kim, S.; Chung, M. Prosody-Based Measures for Automatic Severity Assessment of Dysarthric Speech. Appl. Sci. 2020, 10, 6999. https://doi.org/10.3390/app10196999
Hernandez A, Kim S, Chung M. Prosody-Based Measures for Automatic Severity Assessment of Dysarthric Speech. Applied Sciences. 2020; 10(19):6999. https://doi.org/10.3390/app10196999
Chicago/Turabian StyleHernandez, Abner, Sunhee Kim, and Minhwa Chung. 2020. "Prosody-Based Measures for Automatic Severity Assessment of Dysarthric Speech" Applied Sciences 10, no. 19: 6999. https://doi.org/10.3390/app10196999