1. Introduction
Physical exercise is one of the main recommendations included in clinical guidelines for people with type 1 diabetes (T1D) because it is associated with substantially lower cardiovascular and overall mortality risks [
1,
2]. In addition, a minimum of 150 min of moderate-intensity physical activity per week [
3] results in improvements in insulin sensitivity, body composition, endothelial function, and blood lipid profile [
4].
Despite these benefits, adherence to regular physical activity is low in the T1D population due to factors like time limitations, no access to appropriate equipment at home, or economic costs [
5]. In addition, some people with T1D tend to be less physically active due to fear of hypoglycemia when performing sport activities [
6]. High-intensity interval training (HIIT) has been proposed as a time-efficient methodology, consisting of sessions of short duration and high intensity exercises. Safety and efficacy of HIIT in T1D has usually been analyzed using continuous glucose monitoring (CGM) to determine the influence of exercise on glycemic control [
7,
8,
9]. From these studies, HIIT demonstrated to have a lower impact on blood glucose homeostasis than moderate-intensity continuous training [
7], and is associated with low risk of hypoglycemia [
8].
In previous studies, cycle ergometer was the HIIT training method most commonly used in studies that evaluate its impact on glycemic control [
7,
8,
9,
10]. HIIT sessions have also been carried out on a treadmill [
11] under strictly controlled conditions. While those HIIT methods have been associated with glucose levels within a safe range [
8,
11] and an improvement on cardio-metabolic health [
7], their application in a clinical setting would be limited because of the dedicated equipment required. An easier and cheaper training alternative for HIIT is exercising with elastic bands, either in a clinic or at home [
12]. Elastic bands have been used in people with type 2 diabetes at low-moderate intensity conditions [
13], increasing the strength of the lower limbs [
13] and reducing the prevalence of frailty in this type of patient [
14]. Even so, training with elastic bands in T1D in combination with the HIIT method has not been investigated, and therefore, neither has its safety nor efficacy. Thus, the main objective of this study was to examine the impact of HIIT using elastic bands on glycemic control in people with T1D.
2. Materials and Methods
2.1. Inclusion Criteria
Six males were recruited to participate in this study from the Diabetes Reference Unit at the Clinic University Hospital of Valencia, Spain. The inclusion criteria were: (1) age between 18–40 years, (2) T1D with a diabetes duration for more than 2 years, (3) glycated hemoglobin (HbA1c) < 8.5% (<69 mmol mol−1), (4) stable insulin regimen in the past 6 months with less than 20% change in total insulin daily dose, (5) multiple daily injections, and (6) weekly physical activity of 90 min or more, but no practicing any sport as amateur or professional. Eligible subjects were excluded because of clinical conditions or use of medications (other than insulin) known to affect glycemic control (e.g., oral/parenteral steroids or metformin, among others). All subjects were informed about the possible risks and benefits of the project and signed a dedicated informed consent. The experimental protocol was approved by the Ethics Committee of the University of Valencia (Spain) (H1516705990871).
2.2. Experimental Design
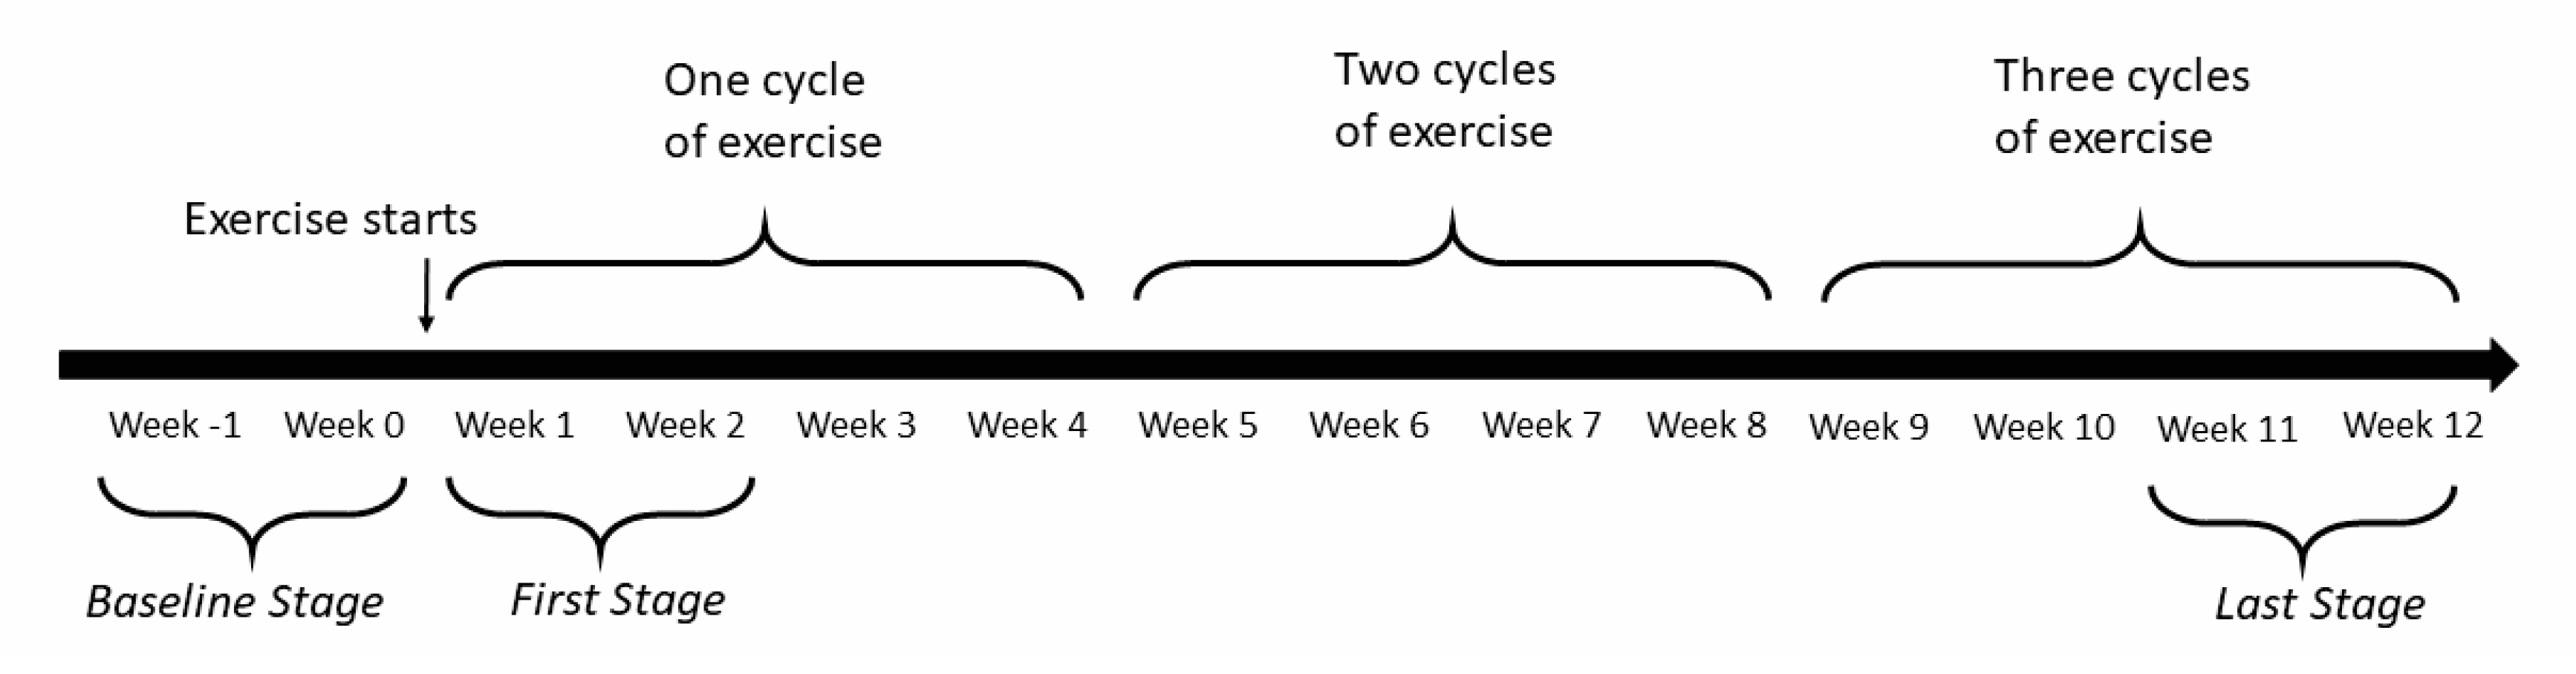
All participants were invited to perform 3 weekly sessions of HIIT using elastic bands with 48 h in-between for 12 weeks. All sessions were done in the Clinical Research Laboratory of the Physiotherapy Department of the University of Valencia, Spain. Importantly, all HIIT sessions were supervised by a physiotherapist trained in this type of exercise methodology. Before starting HIIT sessions, dietary habits were evaluated by a nutritionist based on meals recorded in the previous three days. Dietary modifications were introduced if necessary when the patient had been following an unbalanced diet.
Two weeks before study onset,
baseline glycemic control was evaluated by using intermittent scanning CGM (isCGM) with a FreeStyle Libre
® (FSL, Abbott Diabetes Care, Alameda, CA, USA) system. Glucose sensors were inserted into the back of the upper arm. Two exercise practice sessions were conducted one week before the intervention period to instruct participants on how to exercise with elastic bands. During each HIIT session, subjects performed two sets of twelve repetitions of selected exercises. During the intervention period, glucose changes were monitored with isCGM in the first two (
first stage) and in last two weeks (
last stage). The different stages of the study are illustrated in
Figure 1.
Additionally, capillary blood glucose (CBG) (FreeStyle Lite
®, Abbott Diabetes Care, Alameda, CA, USA) monitoring was performed during each session, before the start, at the end, and 60 min later (recovery period). If CBG was ≤60 mg/dL at any time during the study, the exercise session was not initiated or stopped to prevent hypoglycemia (level 1 (mild) hypoglycemia when glucose is less than 70 mg/dL; level 2 (moderate) hypoglycemia when glucose is less than 54 mg/dL) [
15]. In case of mild hypoglycemia, an orange juice of 200 mL, 10.4g carbohydrate/100 mL (47.3% fructose, 29% glucose, and 23% sucrose) was given to the subjects, and blood glucose was checked 10 min later. If CBG was not higher than 70 mg/dL, half a juice was taken additionally and CBG was checked again after 10 min. In relation to carbohydrate supplements and insulin reductions before and during exercise, we used the 4-step method developed by Campbell et al. [
16]. These guidelines were proposed to prevent hypoglycemia and hyperglycemia in people with T1D during exercise and 24 h thereafter [
16].
At the beginning and at the end of the study, a venous blood sample was drawn after a 12-h overnight fast to measure HbA1c.
2.3. Exercise Protocol
Our elastic band protocol was a modified version of previous HIIT protocols [
17,
18], substituting body weight exercises with exercises with TheraBand CLX (The Hygenic Corporation, Akron, OH, USA) [
19]. The exercise program was based on applying external load to the elastic band’s resistance and it was chosen in order to involve large muscle groups simulating conventional bodybuilding exercises. Four upper limb (bench press, seated dumbbell, shoulder press, and seated row) and four lower limb (squats, stiff-legged deadlifts, hamstring curl, and quadriceps curl) exercises were selected and mixed during sessions avoiding two consecutive exercises of the same area. All exercises were done with both arms or legs at the same time.
Prior to each training session, subjects carried out a standard warm-up by walking up and down several flights of stairs. Each session of 4 min included 20-s exercise intervals separated by 10-s rest intervals, thus diversifying exercise modes while using elastic bands. Each participant chose the width of the elastic band grip for achieving a maximum effort during 20-s of exercising. Subjects were encouraged to perform as many repetitions per 20-s interval as possible. As for the rating of perceived exertion (RPE), the Thera-Band resistance exercise scale of perceived exertion with Thera-Band
® resistance bands [
20] was used, being the intensity established for HIIT RPE ≥ 8 [
21]. A gradual increase of the maximum effort load for each session was expected during the study. In addition, from week 5 to week 9, another set of eight 20-s intervals was added after 3-min rest interval between both series.
2.4. Statistical Methods
Subjects’ demographic characteristics were reported as means ± SD. The CBGs and HbA1c were expressed by means and 95% confidence intervals (CIs). All statistical analyses were done with an alpha error of 0.05.
To analyze the HIIT effects on glucose control, mean glucose and the time spent at each glucose range (euglycemia (70–180 mg/dL), level 1 hypoglycemia (54–70 mg/dL), level 2 hypoglycemia (<54 mg/dL), level 1 hyperglycemia (180–250 mg/dL) and level 2 hyperglycemia (>250 mg/dL)) were evaluated with isCGM during 6 h, 12 h, and 24 h following any exercise session during stage 0, 1, and 2. In addition, glycemic variability was evaluated by using the coefficient of variation (CV).
where
SD(∙) stands for the standard deviation,
FLSi is the isCGM data with FLS for patient
i, and
Mean(∙) is the mean value.
The isCGM data from FSL were formatted and pre-processed in Matlab R2018a (Mathworks Inc., Natick, MA, USA). Statistical significance was calculated using R and Rstudio IDE v1.2.5001. All the above defined metrics were calculated for each subject, observation window, stage, and exercise session. Shapiro–Wilk tests were applied to the data to demonstrate a normal distribution. If the null hypothesis of normality of the data could not be rejected, a linear mixed effects analysis was performed, considering the stage variable as a fixed factor and the patient ID as a random effect. If the normality test failed, a generalized Friedman test was used to determine the influence of the stages on each of the metrics.
In addition, immediate effects of HIIT on CBGs were analyzed by one-factor repeated-measurements ANOVA. Post-hoc Bonferroni procedures were also used to examine isolated differences following significant ANOVAs for CBG performed before, immediately post-session, and 1 h later. CBG values from the first two and the last two weeks during the 12-week study period were examined to assess the subjects’ adaptation to exercise.
Finally, paired t-tests were used to analyze changes in HbA1c after the HIIT intervention, with a level of significance p < 0.05. However, in light of the small sample size of this study, normality tests for HbA1c were performed from the pre–post differential value using the Shapiro–Wilk test.
3. Results
Six subjects completed a total of 198 HIIT sessions and 97% of those sessions exceeded an RPE ≥ 8. Ten sessions were not performed due to hypoglycemia prior to the beginning of the session, and eight sessions were not conducted for other reasons (i.e., professional/personal reasons). Subject age was on average 37 years, with a diabetes onset of 8 to 19 years prior to the beginning of the study. Patients were not obese. No dietary modifications were needed for unbalanced diets. Subjects’ characteristics at baseline are presented in
Table 1.
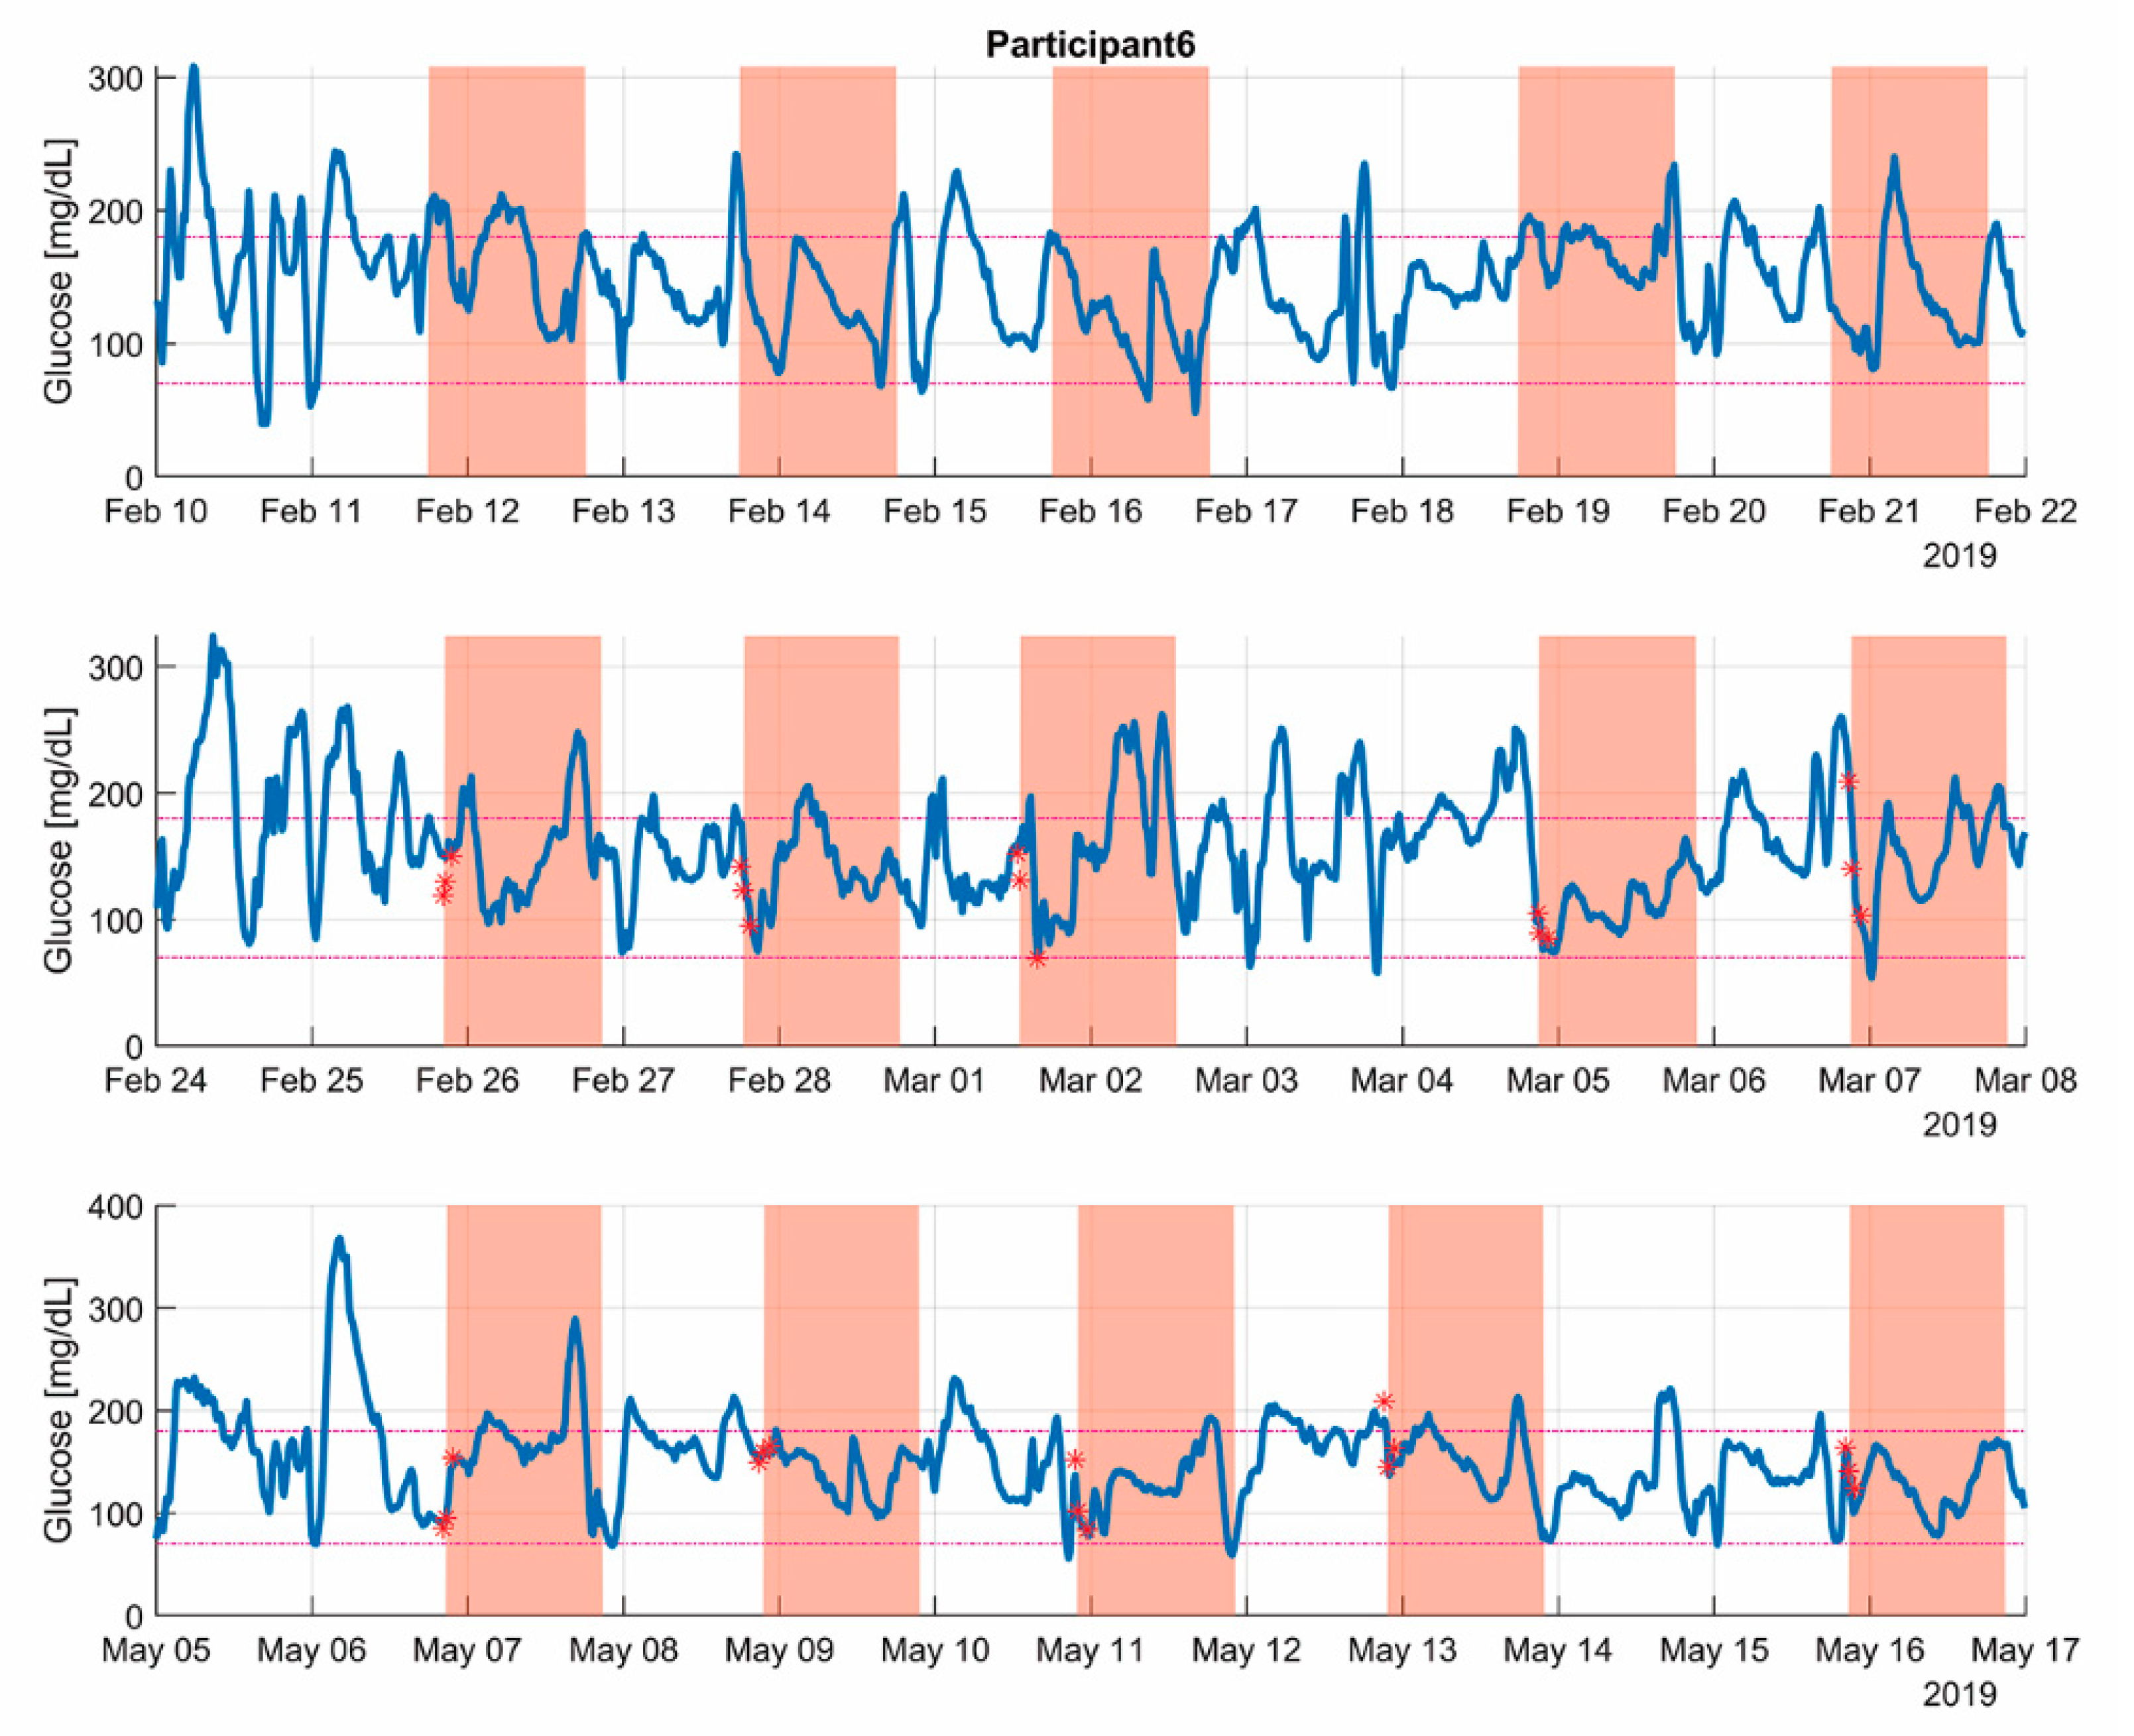
Figure 2 showcases the capillary and isCGM data of the three monitored periods of a single patient. The 24 h post-exercise periods are shadowed to draw attention to the critical parts of each of the stages. Note how the exercise bouts were executed in alternate days, and each day they started at a similar, but not the same, timestamp.
Table 2 shows mean values for each selected parameter for the whole cohort of patients evaluated at 6 h, 12 h, and 24 h after finalizing each exercise session. Level 1 hypoglycemia in the six hours after exercise diminished from 12.3% to 10% at the end of the study. However, this tendency seemed to be inversed after 12 h and 24 h. Time-in-range [TIR, 70–180] mg/dL was reduced from baseline to the end of the study, looking at 6 h, 12 h, and 24 h post-exercise (69% to 62.9%, 70.4% to 57.1%, and 67.2% to 63%, respectively). Time-above-range (TaR, >180 mg/dL) 12 h post-exercise seemed to increase from
baseline across the study (17.9% to 22.4%, and to 25.7%, from
baseline,
first, and
last stage, respectively), and also for the 24 h post-exercise window (20.8% to 27.5%, and to 22.1%, from
baseline,
first, and
last, respectively), but these differences did not show any statistical significance. Mean isCGM glucose values did not show any clear tendency for any of the selected time windows of the study. However, CV was significantly reduced through the study in the first six hours post-exercise from 48% to 43% and to 42%, from
baseline,
first, and
last stage, respectively.
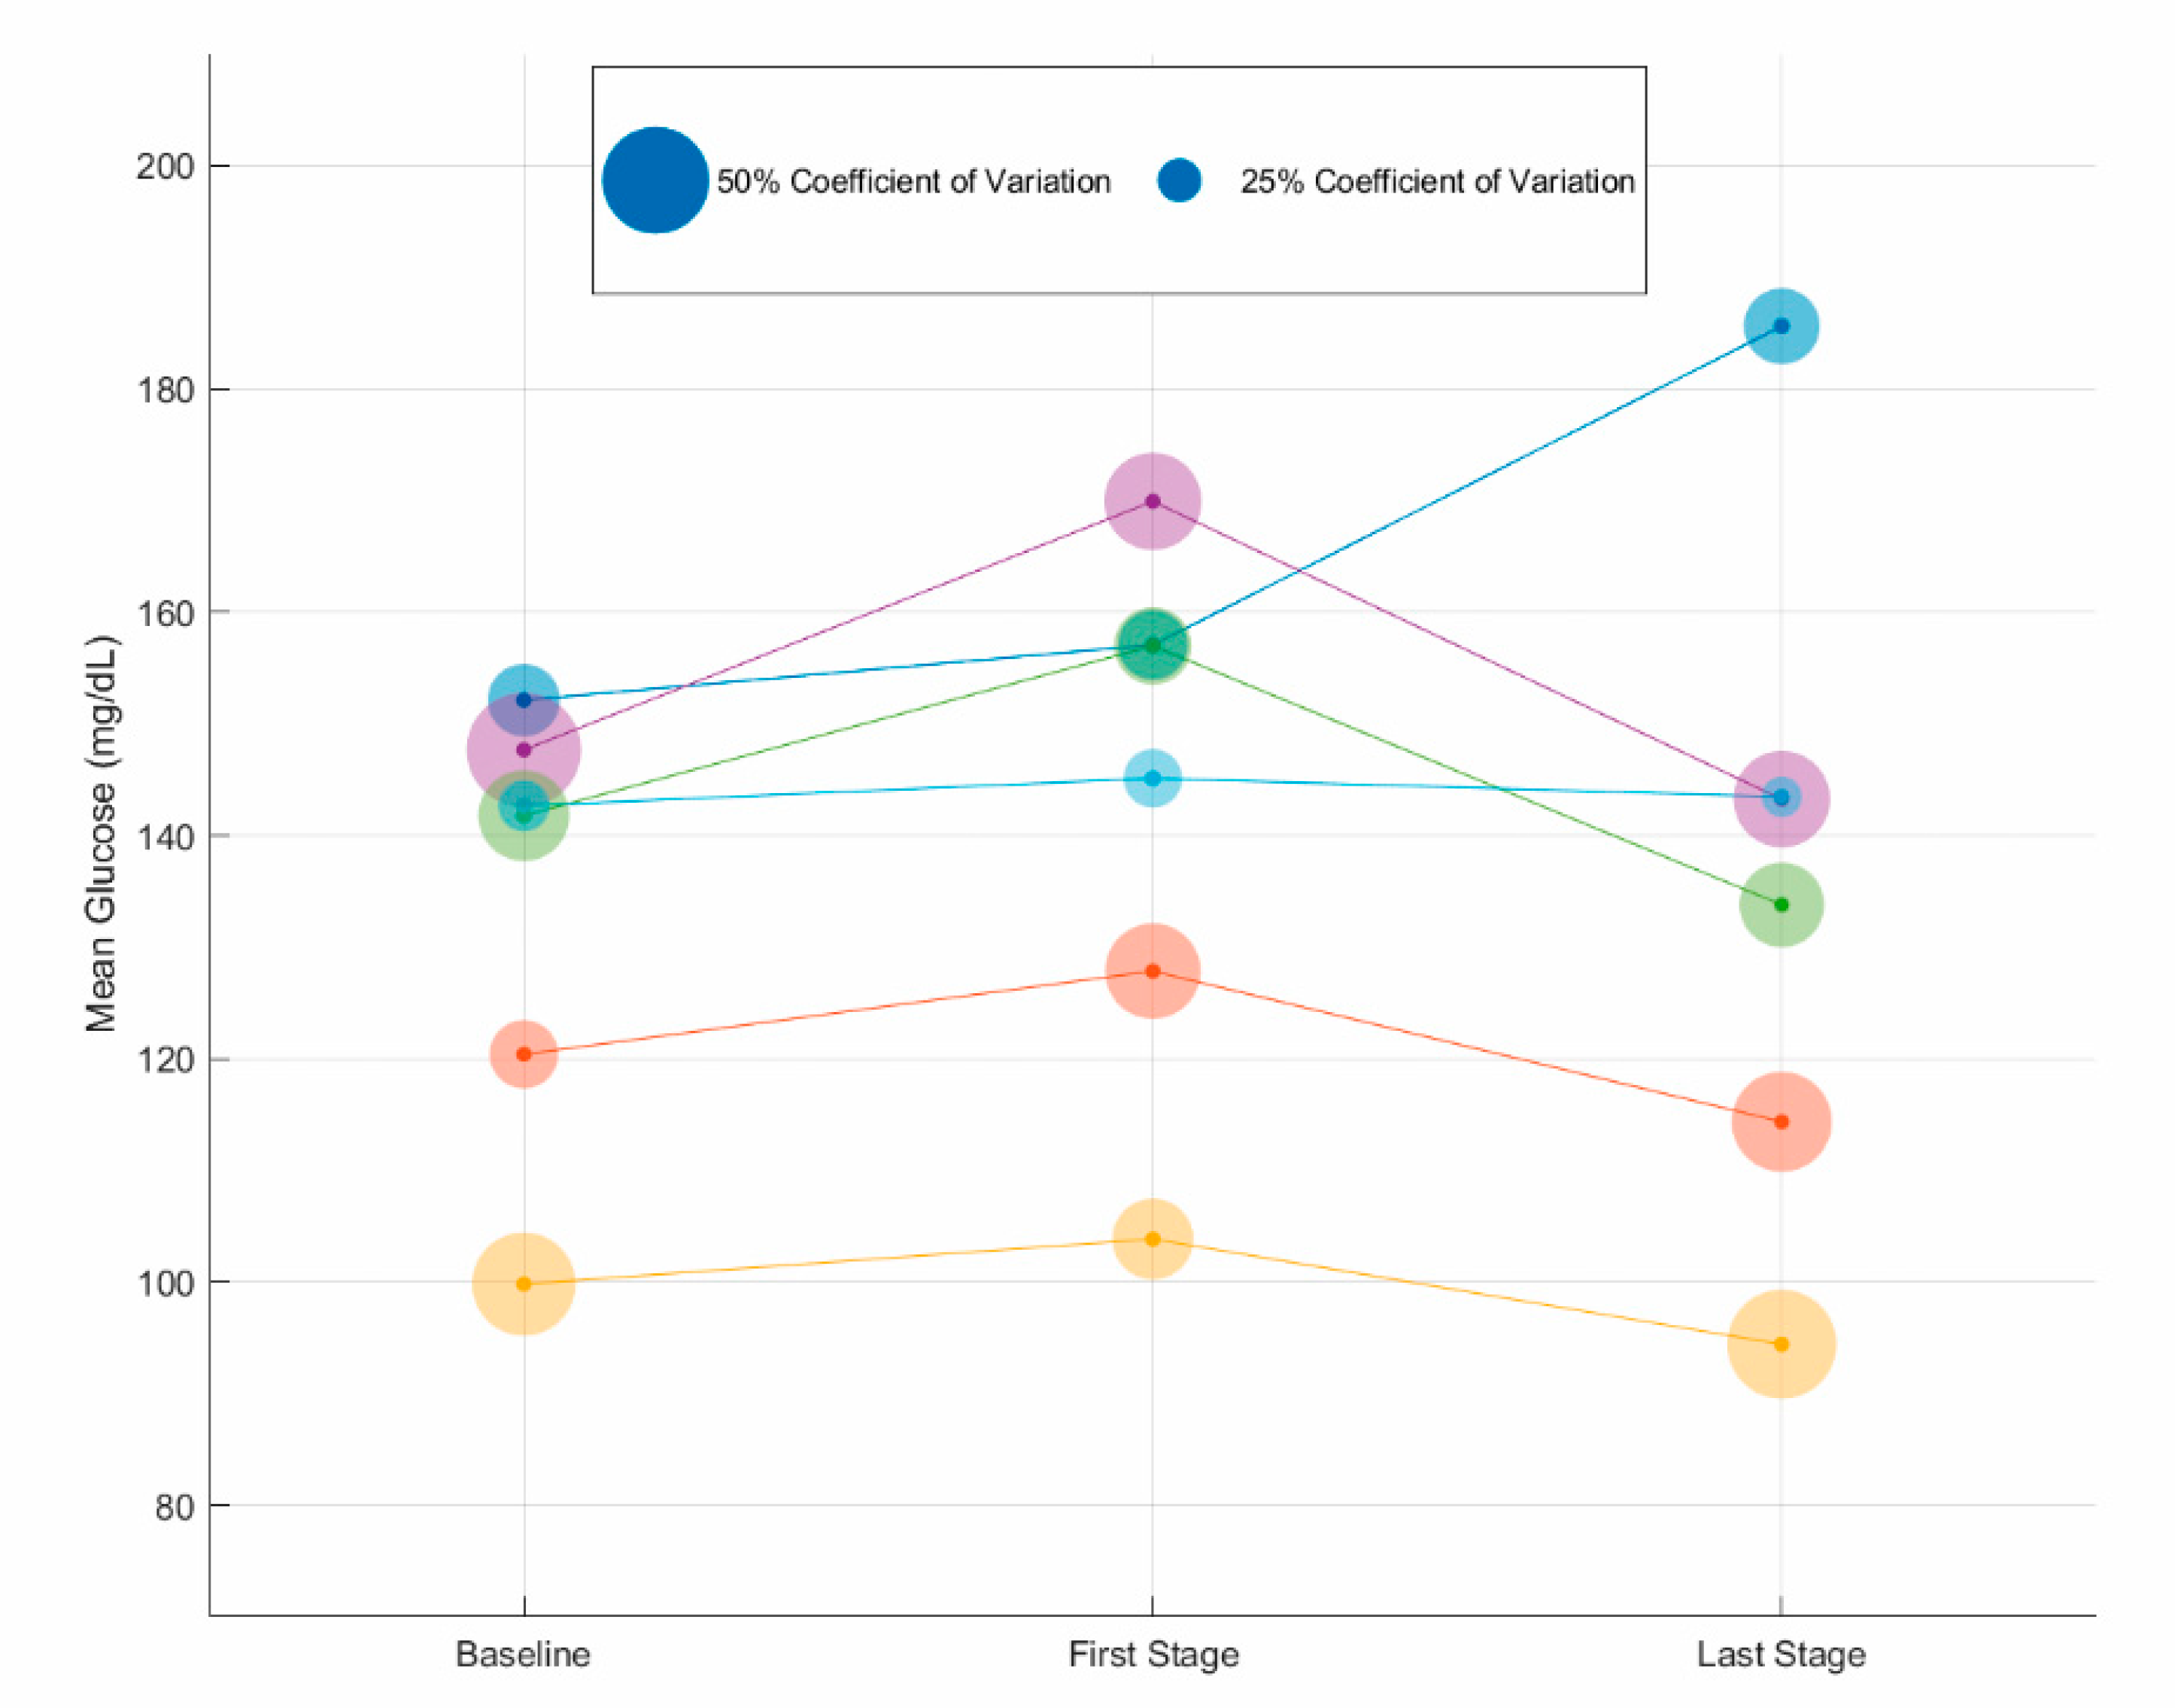
Figure 3 shows changes of individual glucose mean values and glucose variability (CV) based on isCGM registries during the 24 h post-exercise observation period. Mean glucose values increased for all patients initially after the first week of exercise, but diminished in most subjects at the end of the study. However, no statistically significant differences in mean glucose values were observed for the full cohort of patients.
Table 3 shows differences in CBGs between in relation to exercise session (before, immediately after, and one hour later) by stage. In the
first stage (first two weeks after start of the study), CBG decreased immediately after the end of the session by 8.17 mg/dL (95% CI; −6.80–21.14 mg/dL) and even more shortly thereafter (one hour later, by 21.69 mg/dL (95% CI; 5.09–30.30 mg/dL)). However, although numerically the tendency was similar, no significant differences were found in CBG changes in the
last stage (last two weeks of the study).
Finally, HbA1c decreased by 0.4% (95% CI; −0.28–1.08%; p = 0.066) during the study. Four out of six subjects reduced their HbA1c values (range from 0.2 to 1.7%) without getting worse for any patient.
4. Discussion
This pilot study evaluated the influence of HIIT exercise with elastic bands on glycemic control by means of isCGM in adult patients with T1D. Twenty-four-hour isCGM data obtained from FSL showed a gradual improvement in glucose control from the first two weeks (first stage) until the end of the study (last two weeks, last stage), with only minimal changes for the 6 and 12 h post-exercise observation windows. In addition, time in hypoglycemia did not increase significantly in either stage compared to baseline. Moreover, CBGs were reduced shortly after exercising (only statistically significant in first stage), and a tendency for HbA1c improvement was observed after HIIT intervention.
To our knowledge, this study was the first to examine the impact of a HIIT strength program with elastic bands on glycemic control in T1D. The main advantage of using elastic bands is that this training methodology is cheap and can be easily done at home. Before a widespread recommendation for people with T1D, we considered that evaluating safety and efficacy of such a training program was relevant. In addition, since this exercise program is new, comparisons with other types of HIIT on glycemic control in T1D are limited. In one study, TIR 24 h after performing HIIT on a treadmill showed similar results to ours (around 60%), with no differences in TIR at rest [
8]. In contrast, minor differences were observed in time below range (TbR) that was 7.5%, as compared with 10.0% (
first stage) and 14.9% (
last stage) in our study. Similar disparities were observed in TaR, which was 34.2% versus 21.9% and 17.3% (
first and
last stage, respectively) in our study [
8]. These differences may be due to different protocols (HIIT with elastic bands may induce more hypoglycemia), different technology of CGM (Dexcom G4 Platinum), or different insulin strategies and populations.
In relation to short time effects on glucose metabolism (six hours post-exercise), an increase in TaR was observed in the
last stage as compared with
baseline and
first stage (19.3% versus 12.3% and 14.1%, respectively). These observations have been also found in previous studies that showed gradual increases in glucose values after HIIT sessions [
11]. Hormonal changes after exercising, particularly increased production of catecholamines, have been suggested as the main cause of increase of blood glucose levels [
11]. In our study, it is noteworthy that this increment on glucose values was only observed in the
last stage period, and not at the beginning of the intervention. Although catecholamines’ levels were not measured in this study, one possible explanation may be that the greater workloads per session after week 5 resulted in an increased catecholamines secretion rate. This point needs to be verified in future research.
Regarding changes in CBGs during exercise, previous studies of isolated HIIT sessions have shown a reduction of glucose levels within the normal range [
11]. In long-term HIIT interventions, the lowering blood glucose effect of HIIT diminished over time (weeks) [
10]. Our findings were consistent with these studies, by observing an early significant decrease in CBG values for
first stage. This finding suggested a possible metabolic adaptation to exercising over several weeks, preserving normoglycemia and reducing the potential impact of HIIT in inducing hypoglycemia.
Finally, our study showed a tendency to improve HbA1c levels, with a reduction in 4 out of 6 patients without getting worse in any subject. Similarly, a slight improvement has also been observed in other studies with HIIT in people with T1D [
10]. Although the number of patients included in our study was limited, this preliminary finding is important to confirm that HIIT with elastic bands is safe by keeping blood glucose levels in a safe range. It also showed that it is effective by positively influencing HbA1c levels, and thus it can be recommended to people with T1D.
The current study has several strengths. It was the first study in examining the influence of HIIT with elastic bands in glucose control using primarily isCGM as data source and CBG and HbA1c as secondary measurements. Therefore, the impact of HIIT on glucose metabolism was evaluated from different perspectives. Second, based on the results of this study, we are the first to recommend a simple and reproducible HIIT program to be used at home, and more specifically for patients with T1D, by establishing both guidelines for safely performing the exercise program through CBG monitoring and others in relation to carbohydrate adjustments and insulin reductions to prevent hypoglycemia and hyperglycemia. Third, we evaluated and confirmed that patients followed a balanced diet before the intervention. Therefore, dietary modifications were not necessary, thus preventing changes in dietary management that could potentially affect the results of this study.
However, this study also has some limitations. As a pilot study, the few number of patients included limits to the extrapolation of the main results, and only men were included. Future studies should examine the influence of simpler and achievable HIIT programs in larger populations. As also observed in most studies with subjects with T1D, we observed important inter- and intra-individual variabilities. Finally, only a single type of HIIT exercise was evaluated, limiting the comparison of our findings with other HIIT programs or types of exercise.

 ,
, 


