Article

Application of k0-INAA Method in Preliminary Characterization of KRISS Urban Airborne Particulate Matter Certified Reference Material

1
Inorganic Metrology Group, Division of Chemical and Biological Metrology, Korea Research Institute of Standards and Science, Daejeon 34113, Korea
2
Neutron and Radioisotope Application Research Division, Korea Atomic Energy Research Institute, Daejeon 34057, Korea
3
Department of Environmental Sciences, Jožef Stefan Institute, 1000 Ljubljana, Slovenia
*
Authors to whom correspondence should be addressed.
Appl. Sci. 2020, 10(19), 6649; https://doi.org/10.3390/app10196649
Submission received: 27 August 2020 / Revised: 17 September 2020 / Accepted: 21 September 2020 / Published: 23 September 2020

Abstract

:
We report comprehensive elemental composition studies on the average urban airborne particulate matters (PMs) collected in the Greater Seoul area, Korea, in 2019 to identify regional and chronological characteristics of the sample as a candidate for certified reference material (CRM), using k0-based single comparator instrumental neutron activation analysis (k0-INAA). The method was successfully validated by comparing the analysis result of a similar matrix CRM (SRM 1648a urban particulate matter) of National Institute of Standards and Technology, USA, with corresponding certified values. The same methodology was applied to determine various elements in candidate environmental materials for future CRM development, including the urban PMs and incineration ashes, to investigate the possibility of using k0-INAA for certification of relevant reference materials. In total, 46 elements in the urban PM sample were analyzed and their concentration levels were compared with the urban PMs collected in the 1970s in St. Louis, USA. Urban PMs of Korea Research Institute of Standards and Science in 2019 contain significantly lower levels of hazardous elements, such as As, Cd, Cr, Hg, and Pb, as compared to those of the 1970s, which can be attributed to the reduced air pollution by environmental regulation and technological innovation. The potential major source of urban airborne PMs was also discussed.

1. Introduction

Particulate matter (PM) is one of the major air pollutants that poses a threat to human health when harmful substances (i.e., toxic elements) are present in the PM and total mass are increased [1,2,3]. As the frequency and intensity of air pollution caused by PM increase in many parts of the world, including South Korea [4,5], internationally coordinated urgent action is needed to reduce the airborne particulate pollution level. Several countries, such as the United States and Japan, as well as those belonging to the European Union (EU), are pursuing research on measurement standards for the control and regulation of airborne particulate levels based on accurate measurements [6,7,8]. In the EU, the AEROMET (Aerosol Metrology for Atmospheric Science and Air Quality) project is ongoing as one of the EMPIR (European Metrology Programme for Innovation and Research) projects aimed at supporting the fundamental research on air quality regulations and the influence of climate change on human health [9]. The South Korean government is also establishing emergency preparedness for air pollution to identify the major sources of airborne particulates and to evaluate their individual contributions, along with strategic and technical development to reduce anthropogenic emissions [5,10].
Airborne PM is composed of a complex mixture of inorganic and organic substances of natural and anthropogenic origins. The high variability of contributions from local and region-wide sources, depending on the meteorological conditions, makes it even more difficult to accurately evaluate major sources and their contributions [1,5]. Several studies on PM pollution regarding environmental monitoring, source identification, and health effects have been reported based on the determination of the concentration and chemical composition of PMs, but the quality issue of the measurement data has not been sufficiently accessed, raising concern about their reliability [5]. The quality control of measurement data and the establishment of measurement standards to support it are essential to solving the problems of airborne particulate pollution based on robust scientific evidence. It is also important to establish the equivalence of the measurement standards of different countries, considering that airborne particulates are significantly influenced by neighboring countries across borders [11]. In line with this need, several national metrology institutes (NMIs), such as the National Institute of Standards and Technology (NIST, US) and National Metrology Institute of Japan (NMIJ, JP), as well as European Commission Joint Research Centre (JRC, EU), have developed airborne PM certified reference materials (CRMs). These CRMs are disseminated to environmental laboratories, research institutes, and industries to verify their analytical procedure using CRMs [6,7,8]. The Korea Research Institute of Standards and Science (KRISS, KR) has also launched a project called “Establishing National Metrology Infrastructure for Reliable Measurement of Particulate” and is also developing CRMs for airborne PM from different origins that reflect the current air quality in South Korea.
For the characterization of CRMs, NMIs typically use robust analytical methods with less uncertainty and negligible bias, even sacrificing the cost and sample throughput. Isotope dilution-inductively coupled plasma mass spectrometry (ID-ICP/MS) and standard comparator-instrumental neutron activation analysis (SC-INAA) methods are the most widely used methods for certifying elemental content in various matrices [12,13,14]. KRISS has established an ID-ICP/MS method to certify mass fractions of inorganic elements in matrix CRMs and has maintained international equivalence of the measurement through international comparisons [15,16,17,18]. However, it cannot be applied to mono-isotopic elements and requires wet-chemistry-based sample pre-treatments to dissolve the sample matrix, while it is often a difficult challenge to completely dissolve the environmental sample matrix including PMs [19,20,21,22]. INAA is a nondestructive, multi-elemental analysis method based on nuclear properties regardless of the chemical state of elements [19,23,24,25]. It is possible to quantify mono-isotopic elements that cannot be accessed with ID-ICP/MS. The chemical pre-treatment for dissolution of the sample and the potential risk of contamination during the process can be avoided [12,19]. Therefore, the INAA method is the most appropriate and widely used method for elemental quantification of airborne particulates [8,23,24,26,27,28]. In particular, the SC-INAA method is another primary ratio method, complementary to the ID-ICP/MS, which has been used mainly in NMIs, including KRISS, for complicated matrix analysis, such as environmental samples [12]. The SC-INAA method has the advantage of high accuracy and low uncertainty of analysis because it can offset the complicated parameters of the analysis by irradiating and measuring the standard with the sample under the same conditions [12]. However, in SC-INAA, all standards for the elements of interest must be prepared, and the reliability of measurement might be low if the differences in the elemental compositions, shapes, and concentration ranges of the standard and sample matrices are large [12]. In the case of the analysis of airborne PM, SI-traceable pure elemental standard solutions [29] for preparing working standards in the labs are sometimes not available for certain elements of interest. If the sample contains high amounts of aluminum (Al) and uranium (U), the SC-INAA method is likely to cause bias due to isotope interference and nuclear fission reaction [19,30,31]. Therefore, in measuring various elements in a complicated matrix, such as airborne PMs, more accurate results may be obtained when the k0-based INAA (k0-INAA) method is applied, than when the SC-INAA method is adopted [24].
As is well known, the k0-standardization method of INAA uses gold (Au) as a standard, and composite nuclear constants (molar mass, isotopic abundance, cross-section, and absolute gamma-intensity) for nuclides are normalized to Au nuclear data (i.e., k0 factors), which were experimentally determined. The overall uncertainty of the k0-INAA method is relatively large compared to the SC-INAA method because several individual uncertainty factors, such as neutron flux and detector efficiency, must be considered, which are negligible in SC-INAA [24,32,33,34]. Typically, the combined standard uncertainty of the k0-INAA is conservatively 3.5% (k = 1). Nevertheless, the k0-INAA method is suitable for analyzing a sample when it is not easy to make the standard of the same or similar matrix. The method is also capable of analyzing multiple elements simultaneously without the need to prepare specific standards. Therefore, it is the most suitable elemental analysis method for preliminary quantification of elements in the early stages of the development of CRM.
This work is a preliminary study for the development and certification of KRISS urban PM CRM. As a part of the process of developing KRISS urban dust CRM, 46 elements were analyzed using the k0-INAA method. The analysis was validated using NIST Standard Reference Material® (SRM) 1648a urban PM. Another sample with a similar matrix—that is, the KRISS ash CRM candidate—was also analyzed. Some of the elements that are difficult to analyze with the k0-INAA method were analyzed using wavelength dispersive X-ray fluorescence (WD-XRF). The major source of the KRISS urban PMs was preliminarily estimated by comparing the concentration levels of the elements.

2. Materials and Methods
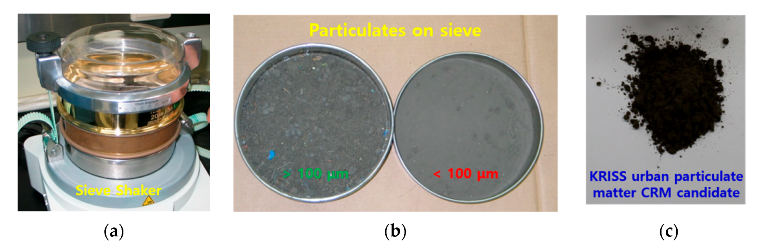
2.1. Sampling

NIST SRM 1648a urban PM is urban dust that was collected from St. Louis, USA, in 1976–1977. More details are given in the NIST certificate [35]. The raw material of KRISS urban dust CRM candidate was the urban dust collected from the air ventilation medium filters of buildings in Seoul (the capital city) and Gyeonggi-do (close to Seoul) in South Korea. The collected dust was a primary sieve sample having a size of <100 μm using a vibratory sieve shaker (Analysette 3 Pro, Fritsch GmbH, Idar-Oberstein, Germany) without the milling process as shown in Figure 1. The KRISS ash CRM candidate (CRM no. 109-08-001) was a sample obtained from an incineration facility in Cheongju, South Korea. The collected sample was ground with an air jet mill (Hosokawa Alpine, fluidized bed opposed jet mill, 100 AFG, Augsburg, Germany). The particle size before grinding was about 300 μm, and the particle size after grinding was about 130 μm. The pulverized sample was homogenized through rotation of a V-mixer for 15 h at a speed of 15 rpm. The samples were aliquoted in 120 mL Amber bottles and then were irradiated with a dose of gamma-ray 60Co at 25 kGy for 25 h.

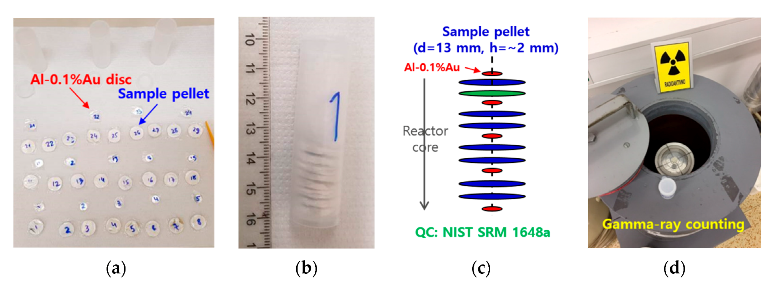
2.2. k0-INAA Experiment

NIST SRM 1648a urban PM, KRISS urban dust CRM candidate, and KRISS ash CRM candidate samples were analyzed in solid form using the k0-INAA method at Jožef Stefan Institute (JSI), Slovenia [36,37]. All the samples were made into pellets in cellulose paper (Whatman® 542, φ 55 mm) as shown in Figure 2a. About 100 mg of each sample was used. The thickness and diameter of each prepared sample as a pressed pellet were about 2.7 mm and 13 mm, respectively. For 12 h long irradiation, nine subsamples for NIST SRM 1648a, six for KRISS urban dust CRM candidate, three for KRISS ash CRM candidate, and five for blank cellulose paper were analyzed. For short irradiation, i.e., 2 min for the samples and 5 min for cellulose paper (blank sample), three additional subsamples were analyzed for each sample. In the case of the KRISS urban dust CRM candidate, the relative standard deviations (RSDs) of mass fractions between subsamples, which represent the homogeneity of the sample, were less than 10% for all elements, except for six elements, including Ag, Au, Cd, Hg, I, and Sn. Those elements with high RSDs were at a level similar to the limit of detection (LOD) of the analysis except for Au. In the case of NIST SRM 1648a and the KRISS ash CRM candidate, the RSDs of elements were less than 10%, excluding four (Au, Cu, W, and Zr) and three (Ba, Cu, and In) elements, respectively. The RSD and LOD of each element for all samples are shown in the Supplementary Materials (Table S1).
Dry mass measurements were carried out using Mg(ClO4)2 desiccant for 48 h by employing 0.5 g of four replicates. The NIST SRM 1648a sample was dried to a constant mass before being weighed for analysis, whereas, for all other samples, a separate sub-sample was taken for dry mass correction from the bottle at the time of analysis [35]. In the case of cellulose paper, moisture content was measured by keeping it in a desiccator for 180 h to reach equilibrium. The dry masses of the samples were as follows: NIST SRM 1648a, 98.63% ± 0.09% (unitless, fdry = 1.0139); KRISS urban dust CRM candidate, 95.60% ± 0.11% (unitless, fdry = 1.0460); KRISS ash CRM candidate, 99.79% ± 0.11% (unitless, fdry = 1.0021); and cellulose paper, 96.59% ± 0.09% (unitless, fdry = 1.0353).
All details of the experimental procedures are available in our previous literature [13,38]. The short irradiation was performed for 2 min to analyze short-lived nuclides; in the case of cellulose paper, it was irradiated for 5 min, because the concentrations of the elements were mostly low. The long irradiation was performed for 12 h to analyze elements having medium/long half-life nuclides. NIST SRM 1648a was used as the quality control (QC) sample for each irradiation, and all samples were irradiated in the carousel facility of the 250 kW TRIGA Mark II reactor of the JSI with a thermal neutron flux of 1.1 × 1012 cm−2·s−1. The f value was 28.43 ± 0.93 (unitless, k = 1), and the α value was −0.0042 ± 0.0020 (unitless, k = 1) [36,37]. The f value is a thermal-to-epithermal neutron flux ratio and α is a parameter describing the epithermal flux that deviated from the ideal 1/E distribution, which were obtained through the Cd-ratio method [32]. The k0 constant, Q0 (resonance integral to 2200 m·s−1 cross-section ratios), Er (effective resonance energy), and T1/2 (half-life) were obtained from the literature [39,40]. A single standard (IRMM-530R, Al-0.1%Au alloy in the form of a disc, 7 mm in dia. and 0.1 mm thick) is irradiated together with each sample to determine the neutron flux in the sample for short irradiation. For long irradiation, two or three samples were allowed between the Al-0.1%Au discs (<1 cm). Figure 2b,c show a sample stacked with Al-0.1%Au discs in a sandwich form for long irradiation. The relative neutron flux was determined according to the relative position of the sample from the Al-0.1%Au disc.
The absolute efficiency (εp) pre-defined three different HPGe detection systems (Figure 2d) that were used to measure the gamma-rays after appropriate cooling times [24,36]. All samples and Al-0.1%Au discs that were irradiated together in the same rabbit were measured using the same detector. The gamma-ray measurement of the sample was carried out at different cooling times to measure the nuclides with different half-lives with minimal or negligible interferences from other nuclides. Each sample was measured 3 times after 3, 7–10, and 20–26 days after long irradiation; and twice at ~10 and ~30 min cooling times after short irradiation. After the peak areas were determined using the HyperLab program (HyperLabs Software, Budapest, Hungary) version 2002 [41,42], the mass fraction and effective solid angle for the defined matrix and dimensions of the pellet were determined using the KayWin® software (k0-ware, Heerlen, The Netherlands) version 2.42 [43].

2.3. WD-XRF Experiment

The major elements in the samples were also determined by the complementary WD-XRF method using a Bruker S8 Tiger WD-XRF spectrometer. The spectrometer consists of an X-ray tube operating at <60 kV and <170 mA, three analyzing crystals (LiF200, PET, and XS-55), and two detectors (scintillation and gas flow proportional counters) [44]. The fusion bead sample preparation method was used, which is known to provide more accurate results than the pressed pellet/powder method by minimizing the matrix and mineral effects [45]. The fusion bead was made by mixing a sample and a lithium tetraborate flux at a 1:10 ratio with 0.5% LiBr as a wetting agent. The sample was kept on top of the flux and heated to 800 °C to remove the carbon content before the fusion mixture process. The fusion mixture went through a full fusion cycle to form a 40 mm diameter glass bead in a platinum (Pt-5%Au) crucible. Each sample was prepared in duplicate and measured three times. The spectrometer was calibrated using Geo-Quant CRMs [46]. To validate the methodology, the NIST SRM 1648a was prepared in the same way as the dust and ash samples. In total, 20 elements (Al, As, Ba, Ca, Cr, Cu, Fe, K, Mg, Mn, Na, Ni, P, Pb, Si, Sr, Ti, V, Zn, and Zr) were determined. S and Cl were analyzed but not considered in the present study, due to potential loss of content during the adopted fusion cycle process.

3. Results and Discussion

3.1. Elemental Composition of Blank (Cellulose Paper) by k0-INAA

In the case of the cellulose paper used for the preparation of pellets, the same batch used for sample preparation was used and analyzed in the same way as that done for the sample. Through the analysis of 46 elements, the mass fraction values of the 12 elements at dry mass basis of the cellulose paper were obtained, and the LOD values were provided for the other elements accordingly (Table 1). All the mass fractions of the elements in Table 2, Tables S1 and S2 were obtained at the dry mass basis subtracting the contribution of the elements present in cellulose paper. The blank contributions for all elements were less than 0.6% (the highest contributing element was Cl) for NIST SRM 1648a and 0.3% (Br contribution) for KRISS urban dust. Br contribution for the KRISS ash CRM candidate was about 7.5%, because Br concentration is relatively low in ash CRM (other elements have contributions of 0.2% or less).

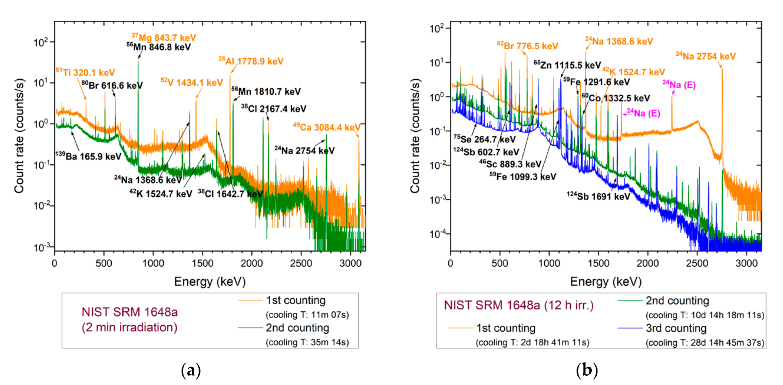
3.2. Validation of the k0-INAA Method Using NIST SRM 1648a Urban PM

To validate the k0-INAA method for elemental analysis in airborne PM at JSI, we analyzed the NIST SRM 1648a urban PM, which provides certified and reference values for mass fractions of several elements. Figure 3 shows the gamma-ray spectra of short-lived nuclides irradiated for 2 min after cooling times of ~11 and ~35 min and those of long-lived nuclides irradiated for 12 h after a cooling time of ~3, ~10, and ~28 days. The corresponding nuclide and gamma-ray energy of several isotopes are indicated in each spectrum for reference. Multiple measurements at different cooling times were conducted to measure the elements with different half-lives, with minimum influence of spectral interferences. Isotopes such as 52V (T1/2 = 3.75 m), 28Al (T1/2 = 2.2414 m), and 51Ti (T1/2 = 5.76 m) have a short half-life time of less than 10 min and should be measured as soon as possible after irradiation. The distance between the detector and the sample should be adjusted so that the dead time is less than 10%. Isotopes with a half-life of 10 min or more are measured after isotopes with a shorter half-life have sufficiently decayed and the background signal has decreased. For example, 27Mg and 56Mn emit gamma-rays at energies very close to each other upon nuclear activation (Eγ = 843.8 keV, Eγ = 846.8 keV, respectively), which may interfere with each other. However, their influence can be reduced by measuring them at different cooling times, as they have different half-life times (27Mg, T1/2 = 9.462 m; 56Mn, T1/2 = 2.579 h). The HyperLab software helps further resolution of residual overlaps of gamma peaks of 27Mg and 56Mn in this energy interval. For the 27Mg isotope, different gamma-ray emissions at 170.7 keV and 1014.4 keV can be used alternatively. However, their emission rates (Iγ = 0.8% and Iγ = 28%, respectively) are relatively lower than 843.8 keV (Iγ = 71.8%), resulting in a significantly weak signal with a concomitant increase of measurement uncertainty. Depending on the specific gamma-ray interferences experienced by different analyte isotopes, such as 75Se (T1/2 = 119.781 d, Eγ = 264.7 keV, Eγ = 279.5 keV) and 203Hg (T1/2 = 46.61 d, Eγ = 279.2 keV), the data obtained at different cooling times have been used to calculate the mass fractions of each element.
JSI has been accredited to the k0-INAA method in accordance with ISO/IEC 17025 (General requirements for the competence of testing and calibration laboratories, International Organization for Standardization, Vernier, GE, Switzerland) since 2009 (Accreditation Certificate LP-090) for analysis of various matrices samples based on concentration range, detection limit, and uncertainty. The elemental mass fraction values labeled # in Table 2 represent non-accredited activities, in accordance with LP-090, beyond the scope of the range of testing or the specified uncertainty.
All details of uncertainty evaluation of k0-INAA method is explained in our previous studies [13,38] and the literature [32]. The expanded uncertainties for mass fraction values represented in Table 1 and Table 2 have a coverage factor k = 2 at 95% confidence level. The combined standard uncertainties (typically, 3.5%) were calculated based on the quadratic summation of a number of parameters such as k0 constant (~1%), Q0 (~1%), f (~1%), α (~1.5%), εp measurement (~2%), and true coincidence correction (~1.5%) of k0-INAA method and the standard deviation of the replicates of each sample. The results obtained by k0-INAA are given in Table 2, where the En score [38,47] of NIST SRM 1648a was used to evaluate the quality of the data. By definition, the En score is a ratio between the difference of the lab result and the assigned value and the square root of the quadratic summation of the expanded uncertainties (k = 2) of the lab and assigned value. According to the literature, satisfactory results are when −1.0 < En < 1.0. Scores of En ≥ 1.0 or En ≤ −1.0 could indicate possible problems in the uncertainty estimations and measurement models, which need to be corrected and evaluated. As can be seen in Table 2, there is good agreement between the data obtained by k0-INAA and certified values by NIST except for Hg (En = 1.07). The slightly higher value of Hg, obtained by 203Hg (Eγ = 279.2 keV), can be explained by a large subtraction due to the interference of Se (26.1 mg/kg, 75Se Eγ = 279.5 keV), whose contribution was about 75%. In Table 2, we also calculated the En score for reference values given by NIST (marked green), but this is given for information only. NIST established certified values using at least two different analytical techniques, while reference values were established by only a single method [35]. It should be mentioned that NIST established certified value for Ce (the only certified value among rare earth elements (REEs)) using INAA and PAA (photon activation analysis) techniques which is potentially influenced by fission of 235U. Unfortunately, mass fraction data of U in NIST SRM 1648a is not available, but we found the content of U to be about 5.4 mg/kg (see Table 2) and Ce data obtained by k0-INAA were corrected for about 3% of U contribution. This may explain a slightly lower value of the En score of Ce (−0.88) obtained by k0-INAA. According to Zeisler [48], INAA procedure at NIST uses multi-elemental solution dried on filter paper (10 μL or 20 μL standard solution on 5 mm diameter filter paper) as a calibration standard. Hence, it may not compensate for the interference of fission products of 235U, if the multi-elemental standard does not include a similar amount of U as in the sample. However, the contribution of fission of 235U may be ignored if only a low amount of U is present in the sample, which is not the case of NIST SRM 1648a.

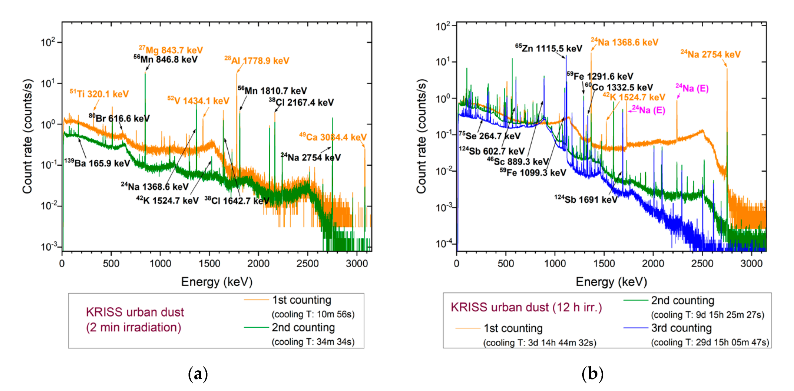
3.3. Analysis of Elemental Compositions in Urban PMs and Incineration Ash

The k0-INAA method was used to analyze several elements simultaneously, including the mono-isotopes in airborne PM and ash samples without chemical treatment. In total, 46 elements were analyzed by the k0-INAA method in NIST SRM 1648a, KRISS urban dust, and KRISS ash CRM candidates. In addition, some of major elements were analyzed using WD-XRF.

3.3.1. Analysis of Elements of Incineration Ash by the k0-INAA Method

The KRISS ash CRM candidate with a similar matrix to airborne PM was analyzed using the k0-INAA method. As this was a study to verify the applicability of the k0-INAA method in the analysis of environmental samples, such as urban PMs, ash CRM candidate was also analyzed as part of the CRM development that is comparison target of urban PM CRM candidate. The analytical method was basically the same as that for the NIST SRM 1648a sample analysis. The ash samples were measured with slightly different cooling and counting times because the concentration levels of elements were slightly different. The concentration levels of the elements were compared with those of NIST SRM 1648a, and the results are shown in Table 2. The gamma-ray spectra of the KRISS ash CRM candidate and blank cellulose paper are shown in the Supplementary Materials (Figures S1 and S2). According to a source distribution study of PMs in Turkey, biomass and wood-burning contributions are dominated by K and Rb, as well as high concentrations of Ca, Mg, and Na [4]. The concentrations of these elements are high because the raw material was collected from an incineration facility. However, the concentrations of As (−84%, percentage difference relative to NIST SRM 1648a), Br (−100%), Cd (−91%), Cr (−40%), and Hg (less than 0.5 mg/kg), generally known as toxic elements, are significantly lower than those in NIST SRM 1648a.

3.3.2. Analysis of Elements of Incineration Ash and Urban PMs by the WD-XRF Method

Some of the chemical fingerprint elements (P, Si, Ni, and Pb) for source identification that are difficult to analyze with the k0-INAA method were analyzed with WD-XRF. The detailed results are shown in Table 3 and were compared to NIST SRM certified values or ID-ICP/MS results. The expanded uncertainties (k = 2) in Table 3 and Table S2 were calculated from combined uncertainty at 1σ included the contribution factors of statistical error (0.5−10%), instrument error (1%), calibration curve error (1%), and fusion bead preparation (2%) [49]. The source apportionment study of metallic elements demonstrated that the generation of Pb was related to a combination of two anthropogenic causes, namely, steel/smelting activity and vehicle emissions [3]. As lead was banned as a fuel additive in the USA in 1996, the Pb concentration in dust seems to have decreased significantly with Br (lead scavenger) concentration [19,50,51]. NIST SRM 1648a urban dust contains 6550 mg/kg of Pb, whereas KRISS urban dust contains only less than 150 mg/kg. Ni and Pb elements are related mainly to the combustion of fossil fuels, and even after the ban on the use of additives, these elements are still present in airborne PM [3,8,19,52,53]. Si is a typical soil component (Earth’s crust) similar to Al, Ca, Fe, and Mg, and its contribution comes from soil-derived particles [1,54]. Therefore, Si has a high mass fraction of over 12% in dust and ash, as shown in Table 3. The main origin of atmospheric P is windblown soils, biogenic emissions, and ash from biomass combustion. It is also known to originate from industrial and mining emissions [55,56]. In KRISS urban dust, the concentration of P is higher than that in NIST SRM 1648a (8410 mg/kg vs. 1100 mg/kg). The P level in KRISS ash is significantly high (70,907 mg/kg) due to the contribution of the incineration process. The atmospheric transport of P is an important mechanism for delivering nutrients to lake ecosystems [55], but it can also cause eutrophication problems when present in excess [57]. The mass fractions of other elements analyzed by WD-XRF are shown in the Supplementary Materials (Table S2) and compared with k0-INAA results. The percentage deviations between two methods are within 10% except few elements (i.e., trace or minor level).

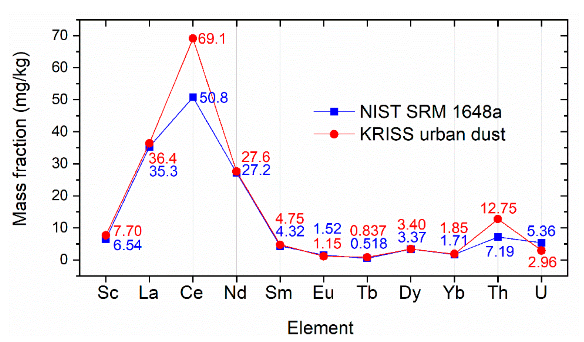
3.4. Comparison of NIST SRM 1648a Urban PM and KRISS Urban Dust CRM Candidate: Element Composition and Source Contribution

In the KRISS urban dust CRM candidate, 46 elements were analyzed using k0-INAA method, and the concentration levels for all elements were compared with those of NIST SRM 1648a (Table 2). NIST SRM 1648a is an urban PM that was collected from St. Louis, USA in 1976–1977 [35]; St. Louis is an industrial area in the state of Missouri [51]. The KRISS urban dust CRM candidate is the dust collected from air-ventilation filters installed on top of the buildings in metropolitan areas (Seoul/Gyeonggi-do City) in South Korea in 2019. The KRISS urban dust sample is a time-integrated sample (no seasonal or temporal variation information) similar to NIST SRM 1648a. The sample does not represent specific areas or sources from which it was collected; rather, it reflects the atmospheric dust of urban areas in South Korea. The sample collection locations are mixed residential, commercial, and industrial areas. Figure 4 shows the gamma-ray spectra of short-lived nuclides irradiated for 2 min after cooling times of ~11 and ~34 m and those of the long-lived nuclides irradiated for 12 h after cooling times of ~3, ~9, and ~29 days.
In the comparison of the mass fractions of the two types of airborne PM, the elements in the KRISS urban dust CRM candidate that showed a high concentration as compared to NIST SRM 1648a are Au (+904%), Cl (+167%), Na (+233%), W (+412%), and Zn (+357%). Of these, Na and Cl are the major ionic species of airborne particulates, and their values seem to indicate the effects of sea salt, biomass burning, and road salt (K element is also 68% high.) [1,4,54]. The high Zn mass fraction appears to be associated with vehicle traffic effects because Zn is known to be associated primarily with engine oil combustion, tire debris, and brake lining [3,52,58]. In addition, Ba, Sb, and Cu are +100%, +64%, and +254% high, respectively. These elements are known to be related to fuel combustion and automotive brake wear emission [3,50,58,59,60]; Ba is particularly used in the form of BaSO4, which is employed as a quantitative marker for vehicular emission [3]. A temporal variation study of airborne particulates in 2015−2016 showed that the concentrations of Zn and Ba are lower during weekends than during weekdays due to road traffic reduction; by contrast, Cu and Pb rise during weekends because of an increase in industrial emissions [58].
The elements in KRISS urban dust CRM candidate as compared to NIST SRM 1648a that showed relatively lower concentrations are Ag (−82%), As (−72%), Br (−89%), Cd (−93%), Cr (−45%), Hg (−70%), Se (−77%), Ta (−84%), U (−45%), and V (−50%). The concentrations of the elements As, Br, Cd, Cr, and Hg, which are generally known to be toxic, are relatively low compared to those in NIST SRM 1648a. According to the air quality guidelines from the World Health Organization [61], the International Agency for Research on Cancer has classified As, Cd, Cr(VI), and Ni as human carcinogens (Group 1) and Pb as probably carcinogenic to humans (Group 2A) [2,58,61,62]. Cd, As, and Pb are particularly known to be associated with industrial activities, such as heavy and metallurgical industry, coal burning, and copper production [2,53,58]. In addition, Cd and Cr are elements of industrial origin that enter the air due to the resuspension of soil dust [52]. Hg comes mostly from industrial use, coal combustion, and waste incineration [60]. Ag is newly introduced to the environment [63]; as photo films disappear, silver emission decreases in the short term. However, predictions indicate that the emission patterns of Ag will change steadily as it is increasingly applied in electronic devices and the textile and plastic industries [64]. The source apportionment study showed that residual combustion sources are Ni and V; As, Se, and Tl are related to coal combustion [1,4,50,54].
The origin of airborne particulates cannot be determined simply from the change of mass fractions of certain elements by several factors, because they are known to contribute in combination [1]. For example, in the case of Pb and Zn, both come from the metal processing industry, but they are also related to automobile emissions [54]. As the source of Cu is vehicle (brake wear) [3,54] and industrial (combustion in smelting furnaces) emissions [53], its exact contributions cannot be easily determined. Among the various elements present in dust, Al, As, Fe, Ti, Mn, etc. originate from not only natural sources (crust, desert, air mass transport, volcanic emission) but also anthropogenic origins [23,60]. A recent source apportionment study revealed that the main anthropogenic sources contributing to the concentrations of toxic metallic elements are vehicle and industrial emissions [3]. Based on these results, this work carefully concluded that relative to that in NIST SRM 1648a (St. Louis is an industrial township in Missouri, USA [51], and NIST SRM 1648a dust was collected in 1976–1977 [35]), the effect of vehicular emission in the KRISS urban dust CRM candidate (collected in 2019) is greater than the effect of industrial activity. In addition, the concentrations of toxic metallic elements seem to decrease in the KRISS urban dust as the use of toxic elements drops due to environmental regulations.
The mass fractions of REEs, U, and Th in the KRISS urban dust CRM candidate obtained through the k0-INAA method were compared with those in NIST SRM 1648a (Figure 5). The REEs, U, and Th are soil/crustal-originated metals, such as Al, Ba, Ca, Mg, and Sr [4]. The presence of REEs is attributed to local crustal contributions when the relative levels are Ce > La > Sm [23,60]. The same trend was observed for NIST SRM 1648a and KRISS urban dust. This result indicated that lanthanide elements originated from natural sources [60]. The mass fractions of REEs in the KRISS urban dust CRM candidate tend to be slightly high relative to those in NIST SRM 1648a, except for the Eu element. In the case of U and Th, the opposite tendency is shown in Figure 5, that is, Th is high in KRISS urban dust, and U is slightly high in NIST SRM 1648a.
It would be interesting to know the concentrations of U, Th, and REEs for observation of natural radioactivity [65] and abundance patterns in the environment [66]; however, their analysis is also important in terms of improving the accuracy of the overall analysis. In SC-INAA, only the elements of interest are analyzed (interference elements are excluded). Thus, correcting the nuclear product or nuclear interference experimentally is not possible. For example, the 235U(n,f) fission products, which contribute to 95Zr, 95Nb, 97mNb, 99Mo, 99mTc, 139Ba, 140La, 141Ce, and 147Nd isotopes, must be corrected [24,30], but their nuclear interference could not be corrected if the U concentration were unknown. In another example, the 26Mg(n,γ)27Mg reaction competes with the 27Al(n,p)27Mg via nuclear isotope interference reaction (threshold reaction with fast neutrons); hence, the amount of Al must be determined to establish the accurate concentration of Mg [19,27,31]. The k0-INAA method is a multi-elemental analysis approach that analyzes interference elements, such as U and Al, together without the need to prepare standards. Hence, the primary nuclear interference can be corrected accurately with this method.

4. Conclusions

The KRISS urban dust CRM candidate and related samples were analyzed using the k0-INAA and WD-XRF method. The proposed method was validated using NIST SRM 1648a urban PM, and the mass fractions of all of the elements obtained by k0-INAA show good agreement with the NIST certified values within their specified uncertainties. The major source of KRISS urban dust was estimated to be traffic emissions, followed by industry emissions based on multi-elemental signature analysis, which showed a different characteristics of elemental composition compared with NIST SRM 1648a. KRISS urban dust CRM, which will be developed based on the results of this study, will provide useful information to CRM users who would prefer to verify their analytical method using CRMs.
Previously, KRISS used only the SC-INAA method, which has the advantage of low uncertainty. However, it cannot correct the nuclear interferences of some elements (e.g., U and Al corrections) that are predominantly present in environmental samples. The k0-INAA method seems to be useful for the analysis of environmental samples, such as airborne PMs, because more than 40 elements can be analyzed simultaneously and no complicated sample preparation is required. Therefore, the k0-INAA method is one of the suitable methods for the analysis of complex matrix CRM, such as airborne PMs, which are challenging to analyze using other analytical methods.

Supplementary Materials

The following are available online at https://www.mdpi.com/2076-3417/10/19/6649/s1, Figure S1. Gamma-ray spectra of KRISS ash CRM candidate after 2 min and 12 h irradiation, Figure S2. Gamma-ray spectra of cellulose paper after 5 min and 12 h irradiation, Table S1. Mass fractions, RSDs, and LODs of samples obtained by k0-INAA, Table S2. Mass fractions of elements in NIST SRM 1648a, KRISS urban dust CRM candidate, and KRISS ash CRM candidate analyzed by WD-XRF and k0-INAA.

Author Contributions

Conceptualization, H.C. and Y.-H.Y.; methodology, H.C., K.B.D., G.M.S., and R.J.; software, H.C., K.B.D., and R.J.; validation, H.C., K.B.D., and R.J.; formal analysis, H.C., K.B.D., M.C.L., and R.J.; investigation, H.C., K.B.D., and R.J.; resources, H.C., K.B.D., M.C.L., and R.J.; data curation, H.C., K.B.D., and R.J.; writing—original draft preparation, H.C.; writing—review and editing, H.C., K.B.D., M.C.L., G.M.S., R.J., and Y.-H.Y.; visualization, H.C.; supervision, H.C., G.M.S., R.J., and Y.-H.Y.; project administration, G.M.S., R.J., and Y.-H.Y.; funding acquisition, G.M.S., R.J., and Y.-H.Y. All authors have read and agreed to the published version of the manuscript.

Funding

The Slovenian co-author would like to thank the Metrology Institute of the Republic of Slovenia (MIRS), as his work contributes to MIRS/IJS Contract No. 6401-5/2009/27 for activities and obligations performed as a Designate Institute as an etalon for the amount of substance/chemical trace elements/in the organic and inorganic materials. This work was supported by KAERI through the Korea Government Project No. MSIT/1711078081, 2019. This work was also supported by the Korea Research Institute of Standards and Science (KRISS) under the project, “Establishing National Metrology Infrastructure for Reliable Measurement of Particulate” grant 19011010.

Acknowledgments

The authors from KAERI & KRISS thank Milena Horvat, Head of the Department of Environmental Sciences at JSI, for her support of the experimental work at JSI funded by the Slovenian Research Agency (ARRS) programme P1-0143.

Conflicts of Interest

The authors declare no conflict of interest.

References

  1. Choi, J.-k.; Heo, J.-B.; Ban, S.-J.; Yi, S.-M.; Zoh, K.-D. Source apportionment of PM2.5 at the coastal area in Korea. Sci. Total Environ. 2013, 447, 370–380. [Google Scholar] [CrossRef]
  2. Jovanović, M.V.; Savić, J.; Kovačević, R.; Tasić, V.; Todorović, Ž.; Stevanović, S.; Manojlović, D.; Jovašević-Stojanović, M. Comparison of fine particulate matter level, chemical content and oxidative potential derived from two dissimilar urban environments. Sci. Total Environ. 2020, 708, 135209. [Google Scholar] [CrossRef] [PubMed]
  3. Alves, D.D.; Riegel, R.P.; Klauck, C.R.; Ceratti, A.M.; Hansen, J.; Cansi, L.M.; Pozza, S.A.; Quevedo, D.M.d.; Osório, D.M.M. Source apportionment of metallic elements in urban atmospheric particulate matter and assessment of its water-soluble fraction toxicity. Environ. Sci. Pollut. Res. 2020, 27, 12202–12214. [Google Scholar] [CrossRef] [PubMed]
  4. Kara, M.; Hopke, P.K.; Dumanoglu, Y.; Altiok, H.; Elbir, T.; Odabasi, M.; Bayram, A. Characterization of PM Using Multiple Site Data in a Heavily Industrialized Region of Turkey. Aerosol Air Qual. Res. 2015, 15, 11–27. [Google Scholar] [CrossRef]
  5. Kim, M.-G.; Lee, S.-J.; Park, D.; Kim, C.-h.; Lee, K.-h.; Hwang, J.-m. Relationship between the actual fine dust concentration and media exposure that influenced the changes in outdoor activity behavior in South Korea. Sci. Rep. 2020, 10, 12006. [Google Scholar] [CrossRef]
  6. Itoh, N.; Inagaki, K.; Narukawa, T.; Aoyagi, Y.; Narushima, I.; Koguchi, M.; Numata, M. Certified reference material for quantification of polycyclic aromatic hydrocarbons and toxic elements in tunnel dust (NMIJ CRM 7308-a) from the National Metrology Institute of Japan. Anal. Bioanal. Chem. 2011, 401, 2909–2918. [Google Scholar] [CrossRef]
  7. Przyk, E.P.; Held, A.; Charoud-Got, J. Development of Particulate Matter Certified Reference Materials (PM10 CRMs); Technical Report; JRC Scientific and Technical Reports: Brussels, Belgium, 2008. [Google Scholar]
  8. Schantz, M.M.; Cleveland, D.; Heckert, N.A.; Kucklick, J.R.; Leigh, S.D.; Long, S.E.; Lynch, J.M.; Murphy, K.E.; Olfaz, R.; Pintar, A.L.; et al. Development of two fine particulate matter standard reference materials (<4 μm and <10 μm) for the determination of organic and inorganic constituents. Anal. Bioanal. Chem. 2016, 408, 4257–4266. [Google Scholar] [CrossRef]
  9. Aerosol Metrology for Atmospheric Science and Air Quality. Available online: https://www.euramet.org/research-innovation/search-research-projects/details/project/aerosol-metrology-for-atmospheric-science-and-air-quality/?L=0&tx_eurametctcp_project%5Baction%5D=show&tx_eurametctcp_project%5Bcontroller%5D=Project&cHash=178428d178423b178493df178420d178426f178428e178421d178427eb178490d178488a178423 (accessed on 25 July 2020).
  10. A Study on the Production Process of Urban Area PM2.5; National Institute of Environment Research, Incheon, Korea. 2010. Available online: http://www.prism.go.kr/homepage/entire/retrieveEntireDetail.do;jsessionid=140886EA144002BE140880A140857D140882E140891B140846A140848E140886B.node140802?cond_research_name=&cond_research_start_date=&cond_research_end_date=&research_id=1480000-201100103&pageIndex=201101697&leftMenuLevel=201100160 (accessed on 25 July 2020).
  11. Squizzato, S.; Masiol, M. Application of meteorology-based methods to determine local and external contributions to particulate matter pollution: A case study in Venice (Italy). Atmos. Environ. 2015, 119, 69–81. [Google Scholar] [CrossRef]
  12. Greenberg, R.R.; Bode, P.; De Nadai Fernandes, E.A. Neutron activation analysis: A primary method of measurement. Spectrochim. Acta B At. Spectrosc. 2011, 66, 193–241. [Google Scholar] [CrossRef]
  13. Cho, H.; Dasari, K.B.; Jaćimović, R.; Zeisler, R.; Sharp, N.E.; Kim, S.-H.; Sun, G.-M.; Yim, Y.-H. Application of the INAA methods for KRISS infant formula CRM analysis: Standardization of INAA at KRISS. J. Radioanal. Nucl. Chem. 2019, 322, 1537–1547. [Google Scholar] [CrossRef]
  14. Yu, L.L.; Browning, J.F.; Burdette, C.Q.; Caceres, G.C.; Chieh, K.D.; Davis, W.C.; Kassim, B.L.; Long, S.E.; Murphy, K.E.; Oflaz, R.; et al. Development of a kelp powder (Thallus laminariae) Standard Reference Material. Anal. Bioanal. Chem. 2018, 410, 1265–1278. [Google Scholar] [CrossRef] [PubMed]
  15. Kim, S.H.; Lim, Y.; Hwang, E.; Yim, Y.-H. Development of an ID ICP-MS reference method for the determination of Cd, Hg and Pb in a cosmetic powder certified reference material. Anal. Methods 2016, 8, 796–804. [Google Scholar] [CrossRef]
  16. Lee, H.-S.; Kim, S.H.; Jeong, J.-S.; Lee, Y.-M.; Yim, Y.-H. Sulfur-based absolute quantification of proteins using isotope dilution inductively coupled plasma mass spectrometry. Metrologia 2015, 52, 619–627. [Google Scholar] [CrossRef]
  17. Kim, S.H.; Lim, Y.; Hwang, E.; Yim, Y.H. Overcoming Spectral Interferences in the Determination of Cadmium in Various Food Materials Using Isotope Dilution Inductively-coupled Plasma Mass Spectrometry. Bull. Korean Chem. Soc. 2015, 36, 936–943. [Google Scholar] [CrossRef]
  18. Lee, J.W.; Heo, S.W.; Kim, H.; Lim, Y.; Lee, K.-S.; Yim, Y.-H. Development of a Nutritional Supplement Certified Reference Material for Elemental Analysis. Mass Spectrom. Lett. 2018, 9, 105–109. [Google Scholar] [CrossRef]
  19. Avino, P.; Capannesi, G.; Rosada, A. Source identification of inorganic airborne particle fraction (PM10) at ultratrace levels by means of INAA short irradiation. Environ. Sci. Pollut. Res. 2014, 21, 4527–4538. [Google Scholar] [CrossRef]
  20. Müller, E.I.; Mesko, M.F.; Moraes, D.P.; Korn, M.d.G.A.; Flores, É.M.M. Chapter 4—Wet Digestion Using Microwave Heating. In Microwave-Assisted Sample Preparation for Trace Element Determination; Erico, M., Moraes, F., Eds.; Elsevier: Amsterdam, The Netherlands, 2014; pp. 99–142. [Google Scholar] [CrossRef]
  21. Kemmouche, A.; Ali-Khodja, H.; Bencharif-Madani, F.; Mahía, P.L.; Querol, X. Comparative study of bulk and partial digestion methods for airborne PM10-bound elements in a high mineral dust urban site in Constantine, Algeria. Int. J. Environ. Anal. 2017, 97, 1132–1150. [Google Scholar] [CrossRef]
  22. Griepink, B.; Tölg, G. Sample digestion for the determination of elemental traces in matrices of environmental concern. Pure Appl. Chem. 1989, 61, 1139–1146. [Google Scholar] [CrossRef]
  23. Avinoa, P.; Capannesi, G.; Rosada, A. Heavy metal determination in atmospheric particulate matter by Instrumental Neutron Activation Analysis. Microchem. J. 2008, 88, 97–106. [Google Scholar] [CrossRef]
  24. Salma, I.; Zemplén-Papp, É. Instrumental neutron activation analysis for studying size-fractionated aerosols. Nucl. Instrum. Methods Phys. Res. A 1999, 435, 462–474. [Google Scholar] [CrossRef]
  25. Schwela, D.; Okhoya, C.N.; Markowicz, A.; Santos, F.L. Particle Air Pollution Monitoring with Nuclear Analytical Techniques: Challenges and Opportunities. Available online: http://fs.teledos.gr:2206/%3ERESEARCH%20PUBLICATIONS/NUCLEAR%20TECHNOLOGY%20-%20ENGINEERING/Elemental%20Analysis/Particle%20air%20pollution%20monitoring%20with%20nuclear%20analytical%20techniques.%20Paper.%20Schwela,%20Okhoya,%20Markowicz,%20Santos.pdf (accessed on 25 July 2020).
  26. Otoshi, T. Particulate Matter and Neutron Activation Analysis. In Proceedings of the 2001 Workshop on the Utilization of Research of Reactors, Beiling, China, 5–9 November 2001. [Google Scholar]
  27. Lestiani, D.D.; Santoso, M. Analytical Methods INAA and PIXE Applied to Characterization of Airborne Particulate Matter in Bandung, Indonesia. Atom Indones. 2011, 37, 52–56. [Google Scholar] [CrossRef]
  28. Dams, R.; Robbins, J.A.; Rahn, K.A.; Winchester, J.W. Nondestructive Neutron Activation Analysis of Air Pollution Particulates. Anal. Chem. 1970, 42, 861–867. [Google Scholar] [CrossRef] [PubMed]
  29. Chalk, S.J. International Union of Pure and Applied Chemistry (IUPAC), Compendium of Chemical Terminology, 2nd ed. (The “Gold Book”). 2019. Available online: https://goldbook.iupac.org/terms/view/S05924 (accessed on 3 August 2020).
  30. De Corte, F.; Lierde, S.V. Determination and evaluation of fission k0-factors for correctionof the 235U(n,f) interference in k0-NAA. J. Radioanal. Nucl. Chem. 2001, 248, 97–101. [Google Scholar] [CrossRef]
  31. Kennedy, G.; Galinier, J.-L.; Zikovsky, L. Measurement of some primary nuclear interferences in neutron activation analysis with a SLOWPOKE reactor. Can. J. Chem. 1986, 64, 790. [Google Scholar] [CrossRef] [Green Version]
  32. De Corte, F.; Simonits, A. Vade Mecum for k0-users. DSM. Research 1994. Available online: http://www.kayzero.com/VADE%20MECUM%20FOR%20k0%20KayWin%20V3.pdf (accessed on 3 August 2020).
  33. Simonits, A.; De Corte, F.; Hoste, J. Single-comparator methods in reactor neutron activation analysis. J. Radioanal. Chem. 1975, 24, 31–46. [Google Scholar] [CrossRef]
  34. De Corte, F. The k0-Standardization Method: A Move to the Optimization of Neutron Activation Analysis. Habilitation Thesis, University of Gent, Gent, Belgium, 1987. [Google Scholar]
  35. Certificate of Analysis, Standard Reference Material (SRM) 1648a, Urban Particulate Matter; National Institute of Standard and Technology: Gaithersburg, MD, USA, 18 September 2015.
  36. Jaćimović, R.; Smodiš, B.; Bučar, T.; Stegnar, P. k0-NAA quality assessment by analysis of different certified reference materials using the KAYZERO/SOLCOI software. J. Radioanal. Nucl. Chem. 2003, 257, 659–663. [Google Scholar] [CrossRef]
  37. Jaćimović, R. Comparison of relative INAA and k0-INAA using soil and sediment reference materials. J. Radioanal. Nucl. Chem. 2014, 300, 663–672. [Google Scholar] [CrossRef]
  38. Dasari, K.B.; Cho, H.; Jaćimović, R.; Sun, G.-M.; Yim, Y.-H. Chemical Composition of Asian Dust in Daejeon, Korea, during the Spring Season. ACS Earth Space Chem. 2020, 4, 1227–1236. [Google Scholar] [CrossRef]
  39. Jaćimović, R.; De Corte, F.; Kennedy, G.; Vermaercke, P.; Revay, Z. The 2012 recommended k0 database. J. Radioanal. Nucl. Chem. 2014, 300, 589–592. [Google Scholar] [CrossRef]
  40. k0 Database 2019. 2019. Available online: http://www.kayzero.com/k0naa/k0naaorg/Nuclear_Data_SC/Nuclear_Data_SC.html (accessed on 20 August 2019).
  41. Simonits, A.; Östör, J.; Kálvin, S.; Fazekas, B. HyperLab: A new concept in gamma-ray spectrum analysis. J. Radioanal. Nucl. Chem. 2003, 257, 589–595. [Google Scholar] [CrossRef]
  42. HyperLab 2002 System, Installation and Quick Start Guide; HyperLabs Software: Budapest, Hungary, 2002.
  43. User’s Manual for Reactor Neutron Activation Analysis (NAA) Using the k0 Standardization Method, Version 2; Kayzero for Windows (KayWin®): Heerlen, The Netherlands, November 2005.
  44. Anagnostopoulos, D.F. X-ray emission spectroscopy optimization for chemical speciation in laboratory. Spectrochim. Acta B At. Spectrosc. 2018, 148, 83–91. [Google Scholar] [CrossRef]
  45. Sieber, J.R. Matrix-independent XRF methods for certification of standard reference materials. JCPDS Int. Cent. Diffr. Data 2002 Adv. X-Ray Anal. 2002, 45, 493–504. [Google Scholar]
  46. Fluxana Certified Reference Materials. Available online: https://fluxana.com/products/reference-materials/crm-catalogs (accessed on 3 August 2020).
  47. ISO 13528:2015. Statistical Methods for Use in Proficiency Testing by Interlaboratory Comparisons, 2nd ed.; ISO: Genève, Switzerland, 2015. [Google Scholar]
  48. Zeisler, R. Investigations by INAA for the development of Natural Matrix Standard Reference Materials® (SRMs) suitable for small sample analysis. J. Radioanal. Nucl. Chem. 2010, 245, 81–85. [Google Scholar] [CrossRef]
  49. Rousseau, R.M. Detection limit and estimate of uncertainty of analytical XRF results. Rigaku J. 2001, 18, 33–47. [Google Scholar]
  50. Almeida, S.M.; Ramos, C.A.; Marques, A.M.; Silva, A.V.; Freitas, M.C.; Farinha, M.M.; Reis, M.; Marques, A.P. Use of INAA and PIXE for multipollutant air quality assessment and management. J. Radioanal. Nucl. Chem. 2012, 294, 343–347. [Google Scholar] [CrossRef]
  51. Chutke, N.L.; Ambulkar, M.N.; Aggarwal, A.L.; Garg, A.N. Instrumental neutron activation analysis of ambient air dust particulates from metropolitan cities in India. Environ. Pollut. 1994, 85, 67–76. [Google Scholar] [CrossRef]
  52. Parvizimehr, A.; Baghani, A.N.; Hoseini, M.; Sorooshian, A.; Cuevas-Robles, A.; Fararouei, M.; Dehghani, M.; Delikhoon, M.; Barkhordari, A.; Shahsavan, S.; et al. On the nature of heavy metals in PM10 for an urban desert city in the Middle East: Shiraz, Iran. Microchem. J. 2020, 154, 104596. [Google Scholar] [CrossRef]
  53. Liu, Z.; Zhou, J.; Zhang, J.; Mao, Y.; Huang, X.; Qian, G. Evaluation for the heavy metal risk in fine particulate matter from the perspective of urban energy and industrial structure in China: A meta-analysis. J. Clean. Prod. 2020, 244, 118597. [Google Scholar] [CrossRef]
  54. Thurston, G.D.; Ito, K.; Lall, R. A source apportionment of U.S. fine particulate matter air pollution. Atmos. Environ. 2011, 45, 3924–3936. [Google Scholar] [CrossRef] [Green Version]
  55. Brahney, J.; Mahowald, N.; Ward, D.S.; Ballantyne, A.P.; Neff, J.C. Is atmospheric phosphorus pollution altering global alpine Lake stoichiometry? Glob. Biogeochem. Cycles 2015, 29, 1369–1383. [Google Scholar] [CrossRef] [Green Version]
  56. Mahowald, N.; Jickells, T.D.; Baker, A.R.; Artaxo, P.; Benitez-Nelson, C.R.; Bergametti, G.; Bond, T.C.; Chen, Y.; Cohen, D.D.; Herut, B.; et al. Global distribution of atmospheric phosphorus sources, concentrations and deposition rates, and anthropogenic impacts. Glob. Biogeochem. Cycles 2008, 22, GB4026. [Google Scholar] [CrossRef] [Green Version]
  57. Wang, S.M.; Zhu, Q.H.; Zhang, B.; Gao, X. Concentration distribution and composition of phosphorus in street dust from small towns in Yongchuan, Chongqing. Adv. Mat. Res. 2013, 689, 556–560. [Google Scholar] [CrossRef]
  58. Ramírez, O.; Sánchez de la Campa, A.M.; Sánchez-Rodas, D.; de la Rosa, J.D. Hazardous trace elements in thoracic fraction of airborne particulate matter: Assessment of temporal variations, sources, and health risks in a megacity. Sci. Total Environ. 2020, 710, 136344. [Google Scholar] [CrossRef] [PubMed]
  59. Negral, L.; Suárez-Peña, B.; Zapico, E.; Fernández-Nava, Y.; Megido, L.; Moreno, J.; Marañón, E.; Castrillón, L. Anthropogenic and meteorological influences on PM10 metal/semi-metal concentrations: Implications for human health. Chemosphere 2020, 243, 125347. [Google Scholar] [CrossRef] [PubMed]
  60. Mejía-Cuero, R.; García-Rosales, G.; Longoria-Gándara, L.C.; López-Reyes, M.C.; Ávila-Pérez, P. Application of Neutron Activation Analysis for Determination of As, Cr, Hg, and Se in Mosses in the Metropolitan Area of the Valley of Toluca, Mexico. J. Chem. 2015, 2015, 278326. [Google Scholar] [CrossRef] [Green Version]
  61. Air Quality Guidelines for Europe, 2nd ed.; World Health Organization: Geneva, Switzerland, 2000.
  62. Agents Classified by the IARC Monographs, International Agency for Research on Cancer volume 1–127. Available online: https://monographs.iarc.fr/agents-classified-by-the-iarc/ (accessed on 4 August 2020).
  63. Ayrault, S.; Senhou, A.; Moskura, M.; Gaudry, A. Atmospheric trace element concentrations in total suspended particles near Paris, France. Atmos. Environ. 2010, 44, 3700–3707. [Google Scholar] [CrossRef]
  64. Eckelman, M.J.; Graedel, T.E. Silver Emissions and their Environmental Impacts: A Multilevel Assessment. Environ. Sci. Technol. 2007, 41, 6283–6289. [Google Scholar] [CrossRef]
  65. Sheppard, S.C.; Evenden, W.G. Critical compilation and review of plant/soil concentration ratios for uranium, thorium and lead. J. Environ. Radioact. 1988, 8, 255–285. [Google Scholar] [CrossRef]
  66. Nance, W.B.; Taylor, S.R. Rare earth element patterns and crustal evolution—I. Australian post-Archean sedimentary rocks. Geochim. Cosmochim. Acta 1976, 40, 1539–1551. [Google Scholar] [CrossRef]
Figure 1. Picture of (a) sieve shaker; (b) >100 μm and <100 μm sieved KRISS urban dust CRM candidate; (c) powder form of KRISS urban dust CRM candidate (<100 μm) for analysis.
Applsci 10 06649 g001
Figure 2. Image of (a) prepared sample pellets and Al-0.1%Au discs; (b) rabbit for irradiation; (c) arrangement of samples and Al-0.1%Au discs in rabbit; (d) gamma-ray counting system at JSI.
Applsci 10 06649 g002
Figure 3. Gamma-ray spectra of NIST SRM 1648a urban PM irradiated for (a) 2 min and (b) 12 h.
Applsci 10 06649 g003
Figure 4. Gamma-ray spectra of KRISS urban dust CRM candidate irradiated for (a) 2 min and (b) 12 h.
Applsci 10 06649 g004
Figure 5. Comparison of mass fractions of REEs, U, and Th in NIST SRM 1648a urban PM and KRISS urban dust CRM candidate.
Applsci 10 06649 g005
Table 1. Elemental mass fractions (above LODs) of cellulose paper analyzed by k0-INAA and their LODs.
El.Mass Fraction ± Expanded Uncertainty (mg/kg, k = 2)LOD (mg/kg)El.Mass Fraction ± Expanded Uncertainty (mg/kg, k = 2)LOD (mg/kg)
Ag 0.030La 0.002
Al1.63 ± 0.420.09Mg1.74 ± 0.6511.07
As 0.0063Mn0.0387 ± 0.00360.0045
Au0.00014 ± 0.000110.00005Mo 0.023
Ba 0.68Na16.4 ± 3.10.1
Br0.175 ± 0.0240.008Nd 0.04
Ca 32.9Rb 0.23
Cd 0.05Sb0.0025 ± 0.00040.0010
Ce 0.03Sc 0.001
Cl28.2 ± 3.80.4Se 0.03
Co 0.009Sm0.00017 ± 0.000050.00015
Cr0.232 ± 0.0500.056Sn 1.4
Cs 0.006Sr 2.5
Cu 0.27Ta 0.002
Dy 0.002Tb 0.002
Eu 0.0007Th 0.0041
Fe3.77 ± 0.6693.76Ti 0.85
Ga 0.037U 0.0014
Hf 0.005V 0.0070
Hg 0.017W 0.013
I 0.028Yb 0.0021
In 0.0005Zn0.190 ± 0.0500.059
K 3.3Zr 3.4
Table 2. Comparison of the mass fractions of elements determined by k0-INAA in NIST SRM 1648a urban PM, KRISS urban dust CRM candidate, and KRISS ash CRM candidate.
El.NIST SRM 1648a Urban PMKRISS Urban Dust CRM CandidateKRISS Ash CRM Candidate
k0-INAA NIST ValuesEn (k = 2)k0-INAAk0-INAA
Mass Fraction ± Expanded Uncertainty (mg/kg, k = 2)Cert., Ref. or Inf. Values (mg/kg)$ Mass Fraction ± Expanded Uncertainty (mg/kg, k = 2)§ % Dev. (KRISS/NIST)$ Mass Fraction ± Expanded Uncertainty (mg/kg, k = 2)§ % Dev. (KRISS/NIST)
Ag6.94 ± 0.506.0 ± 0.31.601.27 ± 0.18−82%20.3 ± 1.5192%
# Al33,528 ± 240234,300 ± 1300−0.2849,359 ± 384747%10,6021 ± 7457216%
As124.9 ± 8.8115.5 ± 3.90.9834.7 ± 2.5−72%19.4 ± 1.4−84%
Au0.028 ± 0.006N/A-0.279 ± 0.115904%4.08 ± 0.3214563%
# Ba680 ± 57N/A-1361 ± 102100%1917 ± 233182%
Br520 ± 37502 ± 100.4757.8 ± 4.1−89%2.17 ± 0.18−100%
Ca56,422 ± 407458,400 ± 1900−0.4442,076 ± 3186−25%48,097 ± 3929−15%
# Cd76.3 ± 5.573.7 ± 2.30.445.45 ± 1.50−93%7.22 ± 0.82−91%
Ce50.8 ± 3.854.6 ± 2.2−0.8869.1 ± 5.836%99.1 ± 7.495%
# Cl4729 ± 3344543 ± 470.5512,642 ± 930167%LOD = 112-
Co17.3 ± 1.317.93 ± 0.68−0.4219.1 ± 1.410%16.8 ± 1.2−3.0%
Cr397 ± 29402 ± 13−0.16219 ± 18−45%238 ± 17−40%
Cs3.38 ± 0.243.4 ± 0.20.064.67 ± 0.3338%5.30 ± 0.3857%
# Cu682 ± 90610 ± 700.63854 ± 10025%2054 ± 252201%
# Dy3.37 ± 0.30N/A-3.40 ± 0.420.9%3.95 ± 0.4817%
Eu1.52 ± 0.11N/A-1.15 ± 0.09−24%1.32 ± 0.11−13%
Fe38,162 ± 276739,200 ± 2100−0.3039,139 ± 29972.6%39,446 ± 28383.4%
# Ga17.5 ± 1.3N/A-LOD = 18.1-24.6 ± 2.541%
Hf4.15 ± 0.305.2-7.40 ± 0.5378%4.74 ± 0.3514%
Hg1.49 ± 0.141.323 ± 0.0641.070.447 ± 0.074−70%LOD = 0.5-
# I20.5 ± 3.5N/A-27.2 ± 5.233%LOD = 18-
# In0.986 ± 0.077N/A-1.08 ± 0.0810%0.547 ± 0.091−45%
K9986 ± 76310,560 ± 490−0.6316,739 ± 148668%29630 ± 2470197%
La35.3 ± 2.639 ± 30.9436.4 ± 2.93.1%55.3 ± 4.056%
# Mg7992 ± 7088130 ± 120−0.1910,331 ± 73329%18,834 ± 1916136%
# Mn790 ± 56790 ± 44−0.01682 ± 52−14%1170 ± 8248%
Mo18.4 ± 1.3N/A-25.9 ± 2.041%26.0 ± 1.941%
Na4295 ± 3084240 ± 600.1714,302 ± 1033233%8499 ± 60198%
Nd27.2 ± 2.2N/A-27.6 ± 2.31.4%35.2 ± 3.429%
Rb48.1 ± 3.551.0 ± 1.5−0.7695.3 ± 6.998%114 ± 8137%
Sb44.6 ± 3.245.4 ± 1.4−0.2373.3 ± 5.264%9.78 ± 0.71−78%
Sc6.54 ± 0.476 to 120-7.70 ± 0.5918%8.12 ± 0.5824%
Se26.1 ± 1.928.4 ± 1.11.066.01 ± 0.49−77%2.13 ± 0.15−92%
Sm4.32 ± 0.314.3 ± 0.30.044.75 ± 0.3410%6.80 ± 0.5558%
# Sn151 ± 13N/A-138 ± 17−8.4%146 ± 13−2.9%
Sr226 ± 18215 ± 170.43LOD = 94.2-416 ± 3184%
Ta6.47 ± 0.49N/A-1.01 ± 0.08−84%1.22 ± 0.10−81%
Tb0.518 ± 0.037N/A-0.837 ± 0.06062%0.723 ± 0.05240%
Th7.19 ± 0.517 to 107-12.7 ± 0.977%15.6 ± 1.3116%
# Ti3855 ± 3154021 ± 86−0.513815 ± 335−1.0%4712 ± 35222%
U5.36 ± 0.39N/A-2.96 ± 0.29−45%94.6 ± 6.91665%
# V131 ± 9127 ± 110.2964.9 ± 5.0−50%74.1 ± 5.1−44%
# W5.55 ± 0.544.6 ± 0.31.5428.4 ± 2.2412%14.5 ± 1.1160%
Yb1.71 ± 0.13N/A-1.85 ± 0.147.8%1.70 ± 0.12−0.9%
Zn4623 ± 3344800 ± 270−0.4121,126 ± 1578357%2852 ± 207−38%
Zr155 ± 16N/A-314 ± 29102%226 ± 2046%
The values represented as N/A are not available. Among the values provided by NIST, the black color values are the certified values, the green values are the reference values, and the blue values can be used as information only. $ Gray colored characters represent LODs of elements not presents above the detection limit of k0-INAA method. § The percentage (%) deviation calculated as (KRISS k0-INAA value–NIST 1648a k0-INAA value)/NIST 1648a k0-INAA value × 100. # The values labeled with # are not accredited according to the Accreditation Certificate LP-090.
Table 3. Mass fractions of elements in NIST SRM 1648a urban PM, KRISS urban dust CRM candidate, and KRISS ash CRM candidate analyzed by WD-XRF and ID-ICP/MS.
E1.NIST SRM 1648a Urban PMKRISS Urban Dust CRM CandidateKRISS Ash CRM Candidate
WD-XRFNIST Certified ValuesWD-XRFWD-XRFID-ICP/MS
Mass Fraction ± Expanded Uncertainty (mg/kg, k = 2)
P8410 ± 588N/A1100 ± 17770,907 ± 3686N/A
Si124,500 ± 6400 128,000 ± 4000138,000 ± 7070182,360 ± 9243N/A
Ni90 ± 1581.1 ± 6.890 ± 16110.46 ± 2995.2 ± 6.7
PbN/A6550 ± 330<150164.9 ± 27145.2 ± 2.0
The values represented as N/A are not available. Among the values certified by NIST, the mass fraction value of Si is the reference value, and the others are certified values.

