1. Introduction
A smart grid is a cyber–physical System (CPS) where physical processes, such as power demand and supply, are controlled and monitored from the cyber domain through advanced computation and communication technologies with humans in the loop [
1]. The advancement in information and communication technology facilitates efficient grid operations, such as controlling load, distributed generation, resource allocation, and state monitoring through advanced metering infrastructure (AMI). The increase in the deployment of smart meters [
2] enables various features such as demand response (DR) through which power engineers control the power demand and supply of a wider geographical area remotely. However, the dependency of the grid’s functionalities such as DR on the cyber domain makes it susceptible to cyber–physical attacks (CPA) [
3,
4]. Power engineers deploy security resources, such as intrusion detection systems [
5,
6] or patch the grid’s cyber functions [
7,
8], to protect its cyber domain. However, recent attacks [
3,
4] show such resource allocation is not sufficient. Although it is necessary to deploy security resources in the cyber domain, it is also vital to prevent attacks even when cyber systems are compromised, in order to cover the worst-case scenario.
Over the last decade, researchers have focused on understanding the dynamics and evaluating the resilience of the grid in the presence of CPA [
7,
8,
9,
10,
11,
12,
13,
14,
15,
16,
17,
18]. They demonstrated how a cyber-attack propagates to the physical world and destabilize the grid by manipulating power demand and supply. AlMajali et al. [
11] presented the load drop attack to perform a transient sensitivity analysis of the power grid that changes the frequency (beyond a threshold) in a zip code causing generators to trip. Soltan et al. [
19] show how an adversary controlling a high wattage IoT devices botnet degrades the resilience of the grid. A similar kind of attack is presented by Dabrowski et al. [
15] where they increase the power demand by remotely activating the Central Processing Unit (CPUs), Graphical Processing Units (GPUs), etc. By performing contingency simulations in the Power World simulator [
9,
10,
15,
19] or using other power models [
12], these approaches demonstrated how a cyber-attack on the grid impacts its resilience.
While performing contingency analysis, most researchers assume that a cyber system of the grid is compromised, and they analyze its impact on the physical system. Very few [
20,
21,
22,
23] focused on designing a system that prevents malicious commands and maintains the grid’s resilience even when a cyber system is compromised. Consider an adversary that compromises the DR server. They send malicious commands to perform load curtailment or load shedding in a zip code to manipulate power demand, thus destabilizing the grid. As compared to [
22,
23], our motive in this paper is to prevent a compromised cyber system from sending legitimate commands that will put the grid in an unsafe state and start cascading failures.
Ryutov et al. [
24] presented a server that provides a security mechanism to monitor and control load as per the security policies during normal operations as well as in the presence of load-altering attacks. The limitation of this approach is that it does not consider the undesired malicious commands that will not physically put the grid in an unsafe state but increase the operational cost in terms of customer dissatisfaction. Moreover, it does not discuss the following points: (1) a more general case where power utility (PU) is compromised and sends malicious commands to destabilize the grid; (2) a different combination of attacks to trick system administrator and how to prevent them using policy server; and (3) the factors that need to be considered for the implementation of a policy server. We address these gaps in this paper by designing an intelligent system that evaluates whether commands issued by a cyber system, which may or may not be compromised, place the grid in an unsafe state.
In this paper, we present an intelligent governor for the smart grid system (IGNORE) to limit the success of attacks when a grid’s cyber system has been compromised and leveraged by an adversary to mount attacks on the physical system.
IGNORE is based on the concept of the security reference monitor. The security reference monitor is a concept to enforce security policies before taking any action in the system to make sure any action is not a violation of the system policy. Therefore, the governor is a component that serves to protect a system from attacks that are more severe and frequent than is acceptable by enforcing security policies on the actions of the system’s higher-level functions.
A higher-level function of a smart grid refers to an application-level service that serves a wider motive in the system and without which system is not complete. For instance, the demand response function is important for the day-to-day resilience of the system. It allows the power utility to control customers’ load on-demand in response to power fluctuations. A governor may contain modules corresponding to each higher-level function. Each module consists of security policies that need to be enforced. A security policy is a set of rules that partition the state of a system into a set of authorized or secure states, and a set of unauthorized or non-secure states [
25]. It defines what actions a governor should take to make sure the system is in a safe state. A governor not only maintains the safety properties in the case of attacks originated from compromised components in the system but also prevents attacks from the subversion of the local system.
The underlying principle for generating a governor’s security policies is the requirement and safety property. The requirement property is based on the need for certain commands in the system at a specific time, and the safety property ensures that the system will be in a safe state after implementing the commands. Based on these properties, IGNORE evaluates whether commands issued by a cyber system are required as well as safe in/for the system.
In a smart grid, if an adversary compromises a demand response automation server (DRAS), they send malicious commands to perform un-safe load shedding (or curtailment) in a region. The governor for demand response prevents such attacks by evaluating whether load shedding (or curtailment) commands are required and safe for the system.
In order to understand how to design a governor system for a cyber–physical function, we narrow the focus of this paper to understanding its application in a smart grid domain. We describe the methodology to build IGNORE and present its usefulness in the smart grid infrastructure by designing a governor for its DR function. Moreover, we describe new attack categories, how the governor prevents those attacks, and what attacks are not prevented.
We are among the first to design a system to prevent a subset of malicious power supply and load altering attacks from a compromised cyber function in a grid.
Our key contribution is to understand how to design a governor for the grid’s DR functionality, prevention of different attacks, and factors that should be considered by power engineers while developing this system, and to show its effectiveness through empirical results. This work sheds light on how a higher-level function of a smart grid is protected by analyzing the system’s cyber and physical aspects even when some parts of the cyber system are compromised.
The rest of this paper is organized as follows:
Section 2 provides a description of where the governor is useful.
Section 3 provides a brief introduction to the DR functionality.
Section 4 presents attacks on the DR.
Section 5 introduces the methodology to design a governor system and
Section 6 presents the DR governor. In
Section 7, we present the test system which includes a conceptual overview of DR and power system modeling that is used to perform experiments. Furthermore, we demonstrate attacks on the grid and show how the governor prevents those attacks. In
Section 8, we discuss a set of administrator’s response when an attack is detected by the governor.
Section 9 discusses the limitations of our work.
Section 10 discusses how to protect the governor. Finally, in
Section 11, we provide concluding remarks and ideas for future work.
2. Governor Concept
In this section, first, we provide the fundamental concept of the governor and, second, we discuss the various attack scenarios in different CPS where a governor can/cannot be used and how.
The concept of the security reference monitor allows a system to provide security to its functionality in order to operate at the boundary of a trusted and untrusted domain [
25]. It has the following properties: it cannot be bypassed and altered and can be verified and tested. The governor is based on the concept of the reference monitor, which is responsible for evaluating the commands that are issued by the system’s higher-level function in regard to whether they are required and safe for the local system. It makes such a decision based on the state information it maintains through communication with other governors and the system’s components.
Table 1 discusses various scenarios where a governor is useful and why.
In Attack 3, an adversary has compromised a botnet of microwaves and network printers, and the attacker sends turn on/off commands remotely. Such an attack is not possible to be prevented by a governor since devices do not involve a feedback loop before initiating or closing their service. It is difficult for a governor to decide whether commands are legitimate because commands are originated from the legitimate compromised server. For similar reasons, Attack 4 is not possible to be prevented by a governor, where there is an adversary-compromised smart meter to control distributed energy resources (DERs) and end devices in a home. Since an adversary has compromised a system through they (legitimately) control edge devices, either through a cyber system or mobile app, it is difficult to detect whether commands issued are required and safe for the system or the device itself.
In the case of a thermostat (Attack 1), it decides whether to turn on/off the heat based on the current temperature. If a customer physically specifies the rule on the device to not turn off the heat if the temperature is below X and an adversary sends a malicious command remotely to turn it off, this type of attack can be prevented by the governor. The governor placed on the device containing the temperature sensor will enforce the security policy to not to turn off the heat if the temperature is below X. For a similar reason, Attack 2 can be prevented since a circuit breaker takes action based on the current readings from the system. In these scenarios, we place the governor near the edge devices and enforce a security policy to prevent attacks that control their functionality directly.
In some cases, a governor can be used to prevent attacks at the locations from where commands are originated based on the state information. For instance, in Attack 5 and 6, DRAS in the cyber domain sends load curtailment commands to the customers who have enrolled in the DR functionality to curtail load in response to contingency. An adversary compromises the DRAS server and sends malicious load curtailment commands. The governor placed adjacent to DRAS will capture these commands and enforce a security policy before allowing commands to go through. It checks whether load curtailment command is required and safe for the system based on the state information it maintains. In this scenario, a governor is placed where commands are originated, not near the edge devices.
All these attack scenarios elucidate that it is possible to prevent those attacks where commands are issued from a compromised cyber domain that is responsible for controlling functionality, and end devices must have a feedback loop to make a decision.
3. Background
In this section, we provide background information regarding DR function. For more details, refer to [
31,
32,
33,
34,
35,
36,
37,
38].
Power utility (PU) maintains two types of reserves, namely, regulating and contingency reserves [
32]. The regulating reserve is used in response to regular load changes, whereas the contingency reserve is used in response to generation losses. Both reserves are composed of spinning and non-spinning reserves. The spinning reserve is the generation capacity that is synchronized to the power system and can be used without any further delay—for instance, load shedding via DR. The non-spinning reserve is an unattached capacity to the grid but can be made available in a specific period, such as in combustion turbines, or power storage units. The normal frequency range in the US is 60 Hz. If a power utility is unable to supply power to meet peak demand, the grid’s frequency will start decreasing. Moreover, if frequency crosses the under-protection threshold, the protection relays disconnect generators, and this may lead to cascading failures [
39,
40].
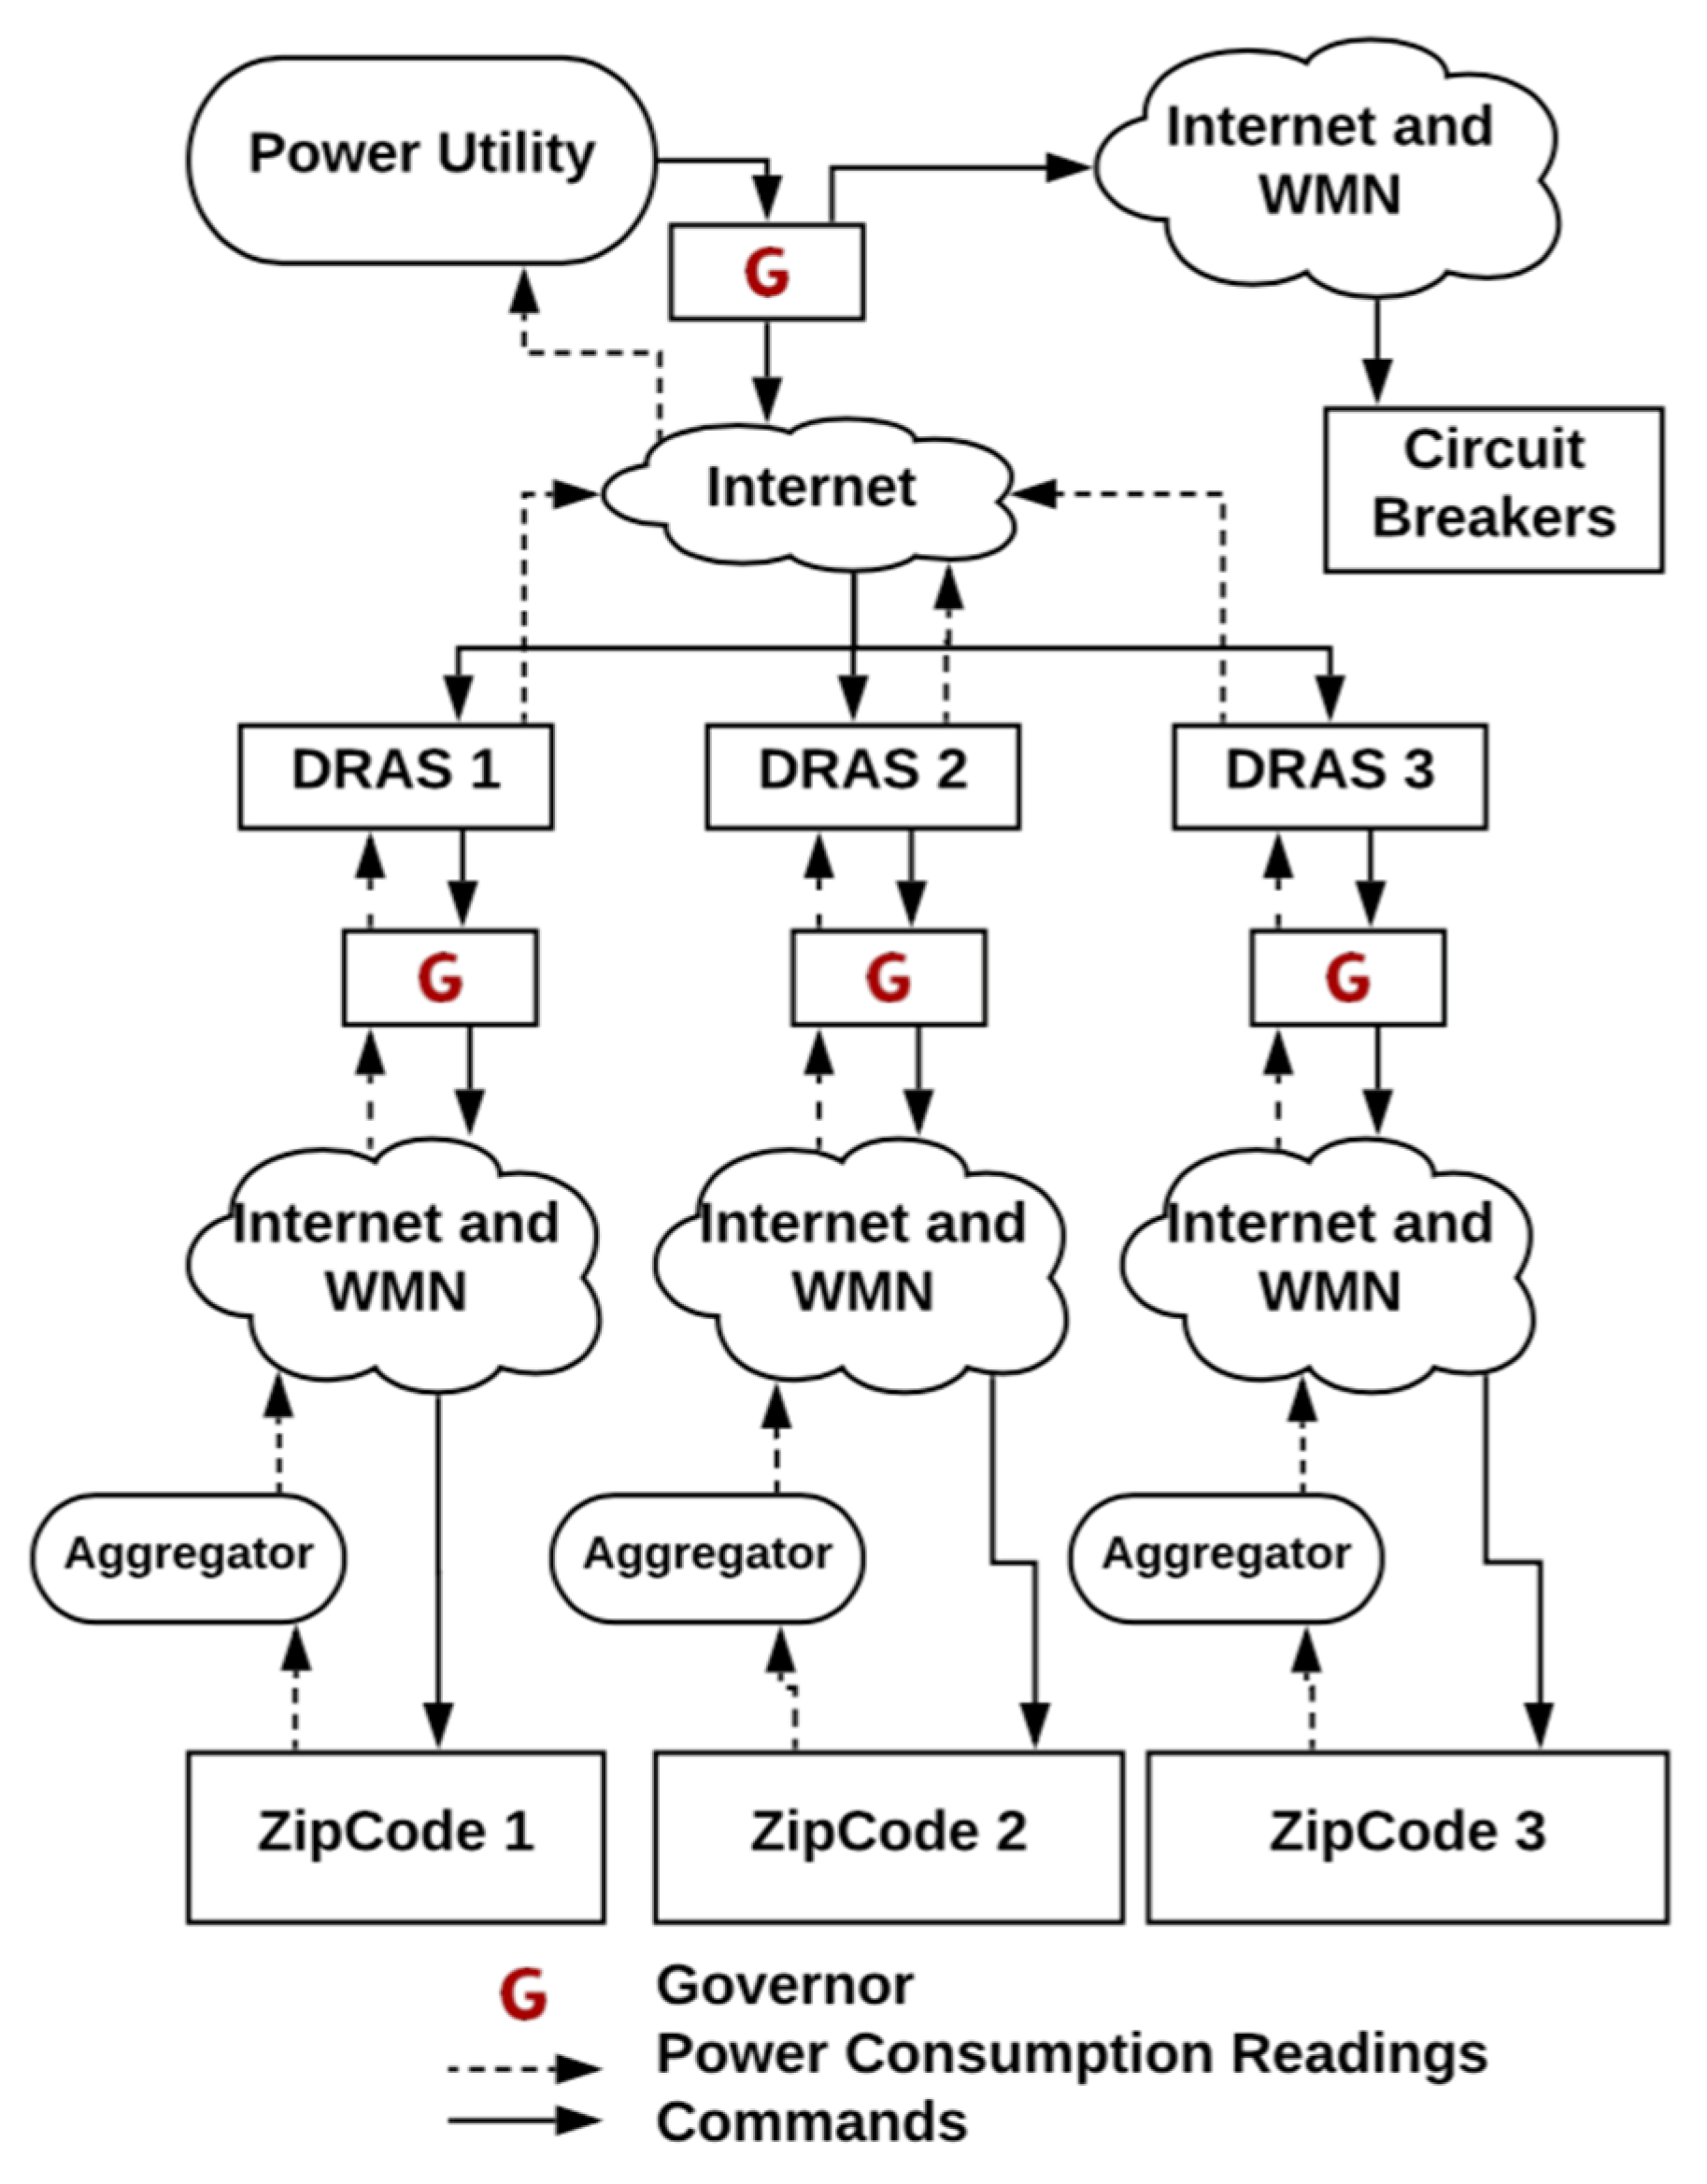
DR is the smart grid technology that involves customers to adapt their electricity consumption from normal consumption patterns in response to contingencies. PU implements DRAS to perform DR functions in various areas. Each DRAS is assigned a set of zip codes and receives power consumption readings from those areas via aggregate load servers. PU and DRAS issue DR/AMI commands (see
Figure 1) to perform load curtailment, send price signals, and control DER. PU responds when contingency occurs in an area and response needs to be taken in a different area. DRAS responds when a response needs to be taken in the same area during contingency. If DRAS is not able to mitigate the contingency, it requests PU to take action. Then, PU issues DR/AMI commands to DRAS of a different area. DRAS computes the percentage of customers (who are enrolled in the DR program) to issue commands so that area frequency is within the safe operational range.
4. Attack via Demand Response
In this section, we discuss the threat model and different attack scenarios that originate from the compromised DR functionality to manipulate power demand and supply. Although an adversary performs attacks to compromise the confidentiality and availability [
37,
38], the description of such attacks are out of the scope of this paper.
4.1. Threat Model
An adversary scans the business network endpoints accessible over the internet to find their vulnerabilities. They perform a social engineering attack via spear-phishing emails to gain information regarding the credentials of employees. Once they know the credentials, they impersonate employees and enters the business network. Here, they compromise various systems of the grid’s business network [
41] and discover which system is responsible for the DR functionality and power supply (as similar to the Ukraine Power grid attack [
3]). They gain control over those systems with the primary motive to manipulate the power demand and supply at a strategic time by leveraging the information from the independent system operator (ISO) website [
42]. We assume an adversary has already compromised a cyber system of PU and DRAS from where they send malicious commands to manipulate the power demand and supply remotely in different areas. Their motive is to either destabilize the grid or increase the operational cost by performing irrelevant load shedding or curtailment, increasing power supply via DER units, and disconnecting circuit breakers that connect generators to the grid. These attacks can cause large-scale cascading blackouts as in the cases of Arizona in 2011 [
40] and India in 2012 [
43].
4.2. Manipulation of Power Supply
Case 1: Distributed energy resources (DER) manipulation: An adversary has compromised DRAS to send malicious commands to X% of smart meters in an area to a) disconnect DERs from the grid when it is required, or b) dispatch DER power when it is not required.
The adversary leverages power demand and supply information from the ISO website to decide the timing of this attack to cause maximum damage. By controlling DER functionality, the adversary controls the power dispatch to manipulate area frequency.
Case 2: Disconnect circuit breaker: An adversary has compromised a cyber system in a PU to send malicious disconnect commands to X% of breakers with the aim of disconnecting generators from the grid.
Circuit breakers, controlled by relays, are used to automatically protect the system from high fault currents. Relays make a decision to either open or close a breaker based on processing measurements such as voltage level, power flows, and area frequency. If an adversary modifies the settings of the relay, the grid becomes susceptible to CPAs. By disconnecting circuit breakers, the attack disconnects a generator from the grid, thereby reducing the power generation and supply in an area that incurs a cost to a PU in terms of exhausting contingency resources to satisfy a reduced generation.
4.3. Manipulating Power Demand (Load)
Case 3: Malicious load curtailment: An adversary has compromised DRAS or cyber system in PU to send malicious commands to X% of smart meters in an area to perform irrelevant load curtailment.
Load curtailment is a DR function to request customers who are enrolled in the DR program, and they participate to reduce their power consumption in response to contingency. It is treated as a regulating reserve. PU has the power supply and consumption information of all areas, and DRAS has information about its own area. If there is any contingency, such as low power generation or high power demand, they know how much load to curtail from a specific area. The DRAS server decides the number of customers in its area and how much load each customer should curtail on a rotating basis [
32]. This satisfies two objectives: (1) fairness, since the load is spread across all the customers, and (2) the impact of load curtailment on a customer is reduced. Once decided, it sends load curtailment commands to all customers.
Case 4: Malicious load shedding: An adversary has compromised DRAS or cyber system in PU to send malicious commands to X% of smart meters in an area to perform irrelevant load shedding.
Load shedding is used to reduce the load in response to contingency where the grid is not able to provide generation to satisfy demand. This functionality is used in extreme conditions where there is a huge generation loss in an area. It is treated as a contingency reserve. DRAS decides the number of customers in a zip code to send disconnect signals to shed the load.
4.4. Area-Wise Attacks
We examine six variations of the manipulation of load attacks, which are based on the following factors: contingency, response, and attack (CRA). These factors state in which area contingency occurs, in which area power utility responds to that contingency, and, finally, in which area an adversary performs an attack. Suppose X and Y represent the two areas shown in
Figure 1.
Table 2 shows six different attack scenarios, which follow the threat model described in
Section 4.1.
Attack 1: Suppose A% generation loss occurs in area X. Since a response is taken in the same area, it is taken by DRAS X. DRAS X asks customers to curtail B% of the load to maintain area frequency within secure limits. An adversary leverages the information about the contingency and issues extra C% load curtailment commands from compromised DRAS X.
Attack 2: Similar to Attack 1, but here, an adversary issues C% load curtailment commands from compromised DRAS Y in area Y, which is different from X.
Attack 3: This is a combination of Attack 1 and 2, where an adversary issues load curtailment command in both areas X (C%) and Y (D%).
Attack 4: Suppose A% generation loss occurs in area X. Since a response is taken in area Y, it is taken by PU which issues commands to DRAS Y. Then, DRAS Y asks customers to curtail B% of the load to maintain area frequency within secure limits. An adversary issues C% load curtailment commands from compromised DRAS X in area X.
Attack 5: Similar to Attack 4. An adversary issues extra C% load curtailment commands from compromised DRAS Y in area Y.
Attack 6: This is a combination of Attack 1 and 5, where the system responds in both areas X and Y, and an adversary issues malicious load curtailment command in both area X (C%) and Y (D%).
The primary idea behind different attack scenarios is that DRAS provides local safety, checking whether there is any contingency in an area it is responsible for. If yes, it automatically sends load curtailment or shedding commands. It is unaware of the scenario in another area and, thus, it can be leveraged by a malicious entity to perform complex attacks that are hard to detect and stop.
5. IGNORE
We present the intelligent governor for the smart grid system (IGNORE) to prevent attacks from a compromised cyber system that is leveraged by an adversary to mount attacks on the physical system. We discuss what a governor is, what the actions taken by a governor are and, finally, the methodology to design a governor for a grid’s higher-level function.
5.1. The Governor and Its Properties
The governor is a component that serves to protect the smart grid from attacks that are more severe and frequent than is acceptable by enforcing security policies on the actions of the system’s higher-level functions. It acts as a reference monitor that enforces security policies. It defines what actions a governor should take to make sure the system is in a safe state. The governor receives state information from different components and can interact with other governors in order to make a decision. Most importantly, it provides local safety first.
The underlying principle for generating security policies for a higher-level function is the requirement and safety property. For instance, load shedding is used as a contingency reserve, and commands must be issued when there is a generation loss or huge peak demand. If there is no contingency in the system, shedding commands are not required. This forms the requirement policy. For the safety policy, the administrator must check after implementing the load shedding in an area; the area frequency must not go beyond the lower- or upper-frequency threshold limit. The system administrator should understand the functionality for which a governor is designed and then perform sensitivity analysis to drive security policies, which will be enforced by the governor.
5.2. Methodology to Design a Governor
Specify a higher-level function that a governor should protect, even if cyber components that support this function are compromised.
Identify the set of actions issued by cyber components that are responsible for the function.
Understand and specify the impact of the set of actions on the smart grid through sensitivity analysis. The sensitivity analysis is utilized to understand up to what point a system is resilient to the changes in a specific function. It draws a boundary between the safe and unsafe zone when certain system parameters change due to changes in a function.
Understand and state the scenarios when those actions are required and safe in/for the system.
List the set of rules to describe the safety and requirement policy that the governor should evaluate for each action.
Specify how the governor will evaluate commands and from where it will receive information about the system to perform an evaluation.
The governors should be placed near the command issuing entity. For instance, DRAS and PU in the case of DR.
Describe how the governor will be protected from cyber-attacks and how it updates the secure policy modules remotely so that system administrators can add more functional modules. The protection of a governor from cyber-attacks is out of the scope of this paper. We assume that the system administrator follows standard approaches to protect the cyber system [
34,
44].
6. IGNORE for Demand Response
In this section, we design a governor for the DR functionality of the grid.
6.1. Governor Design
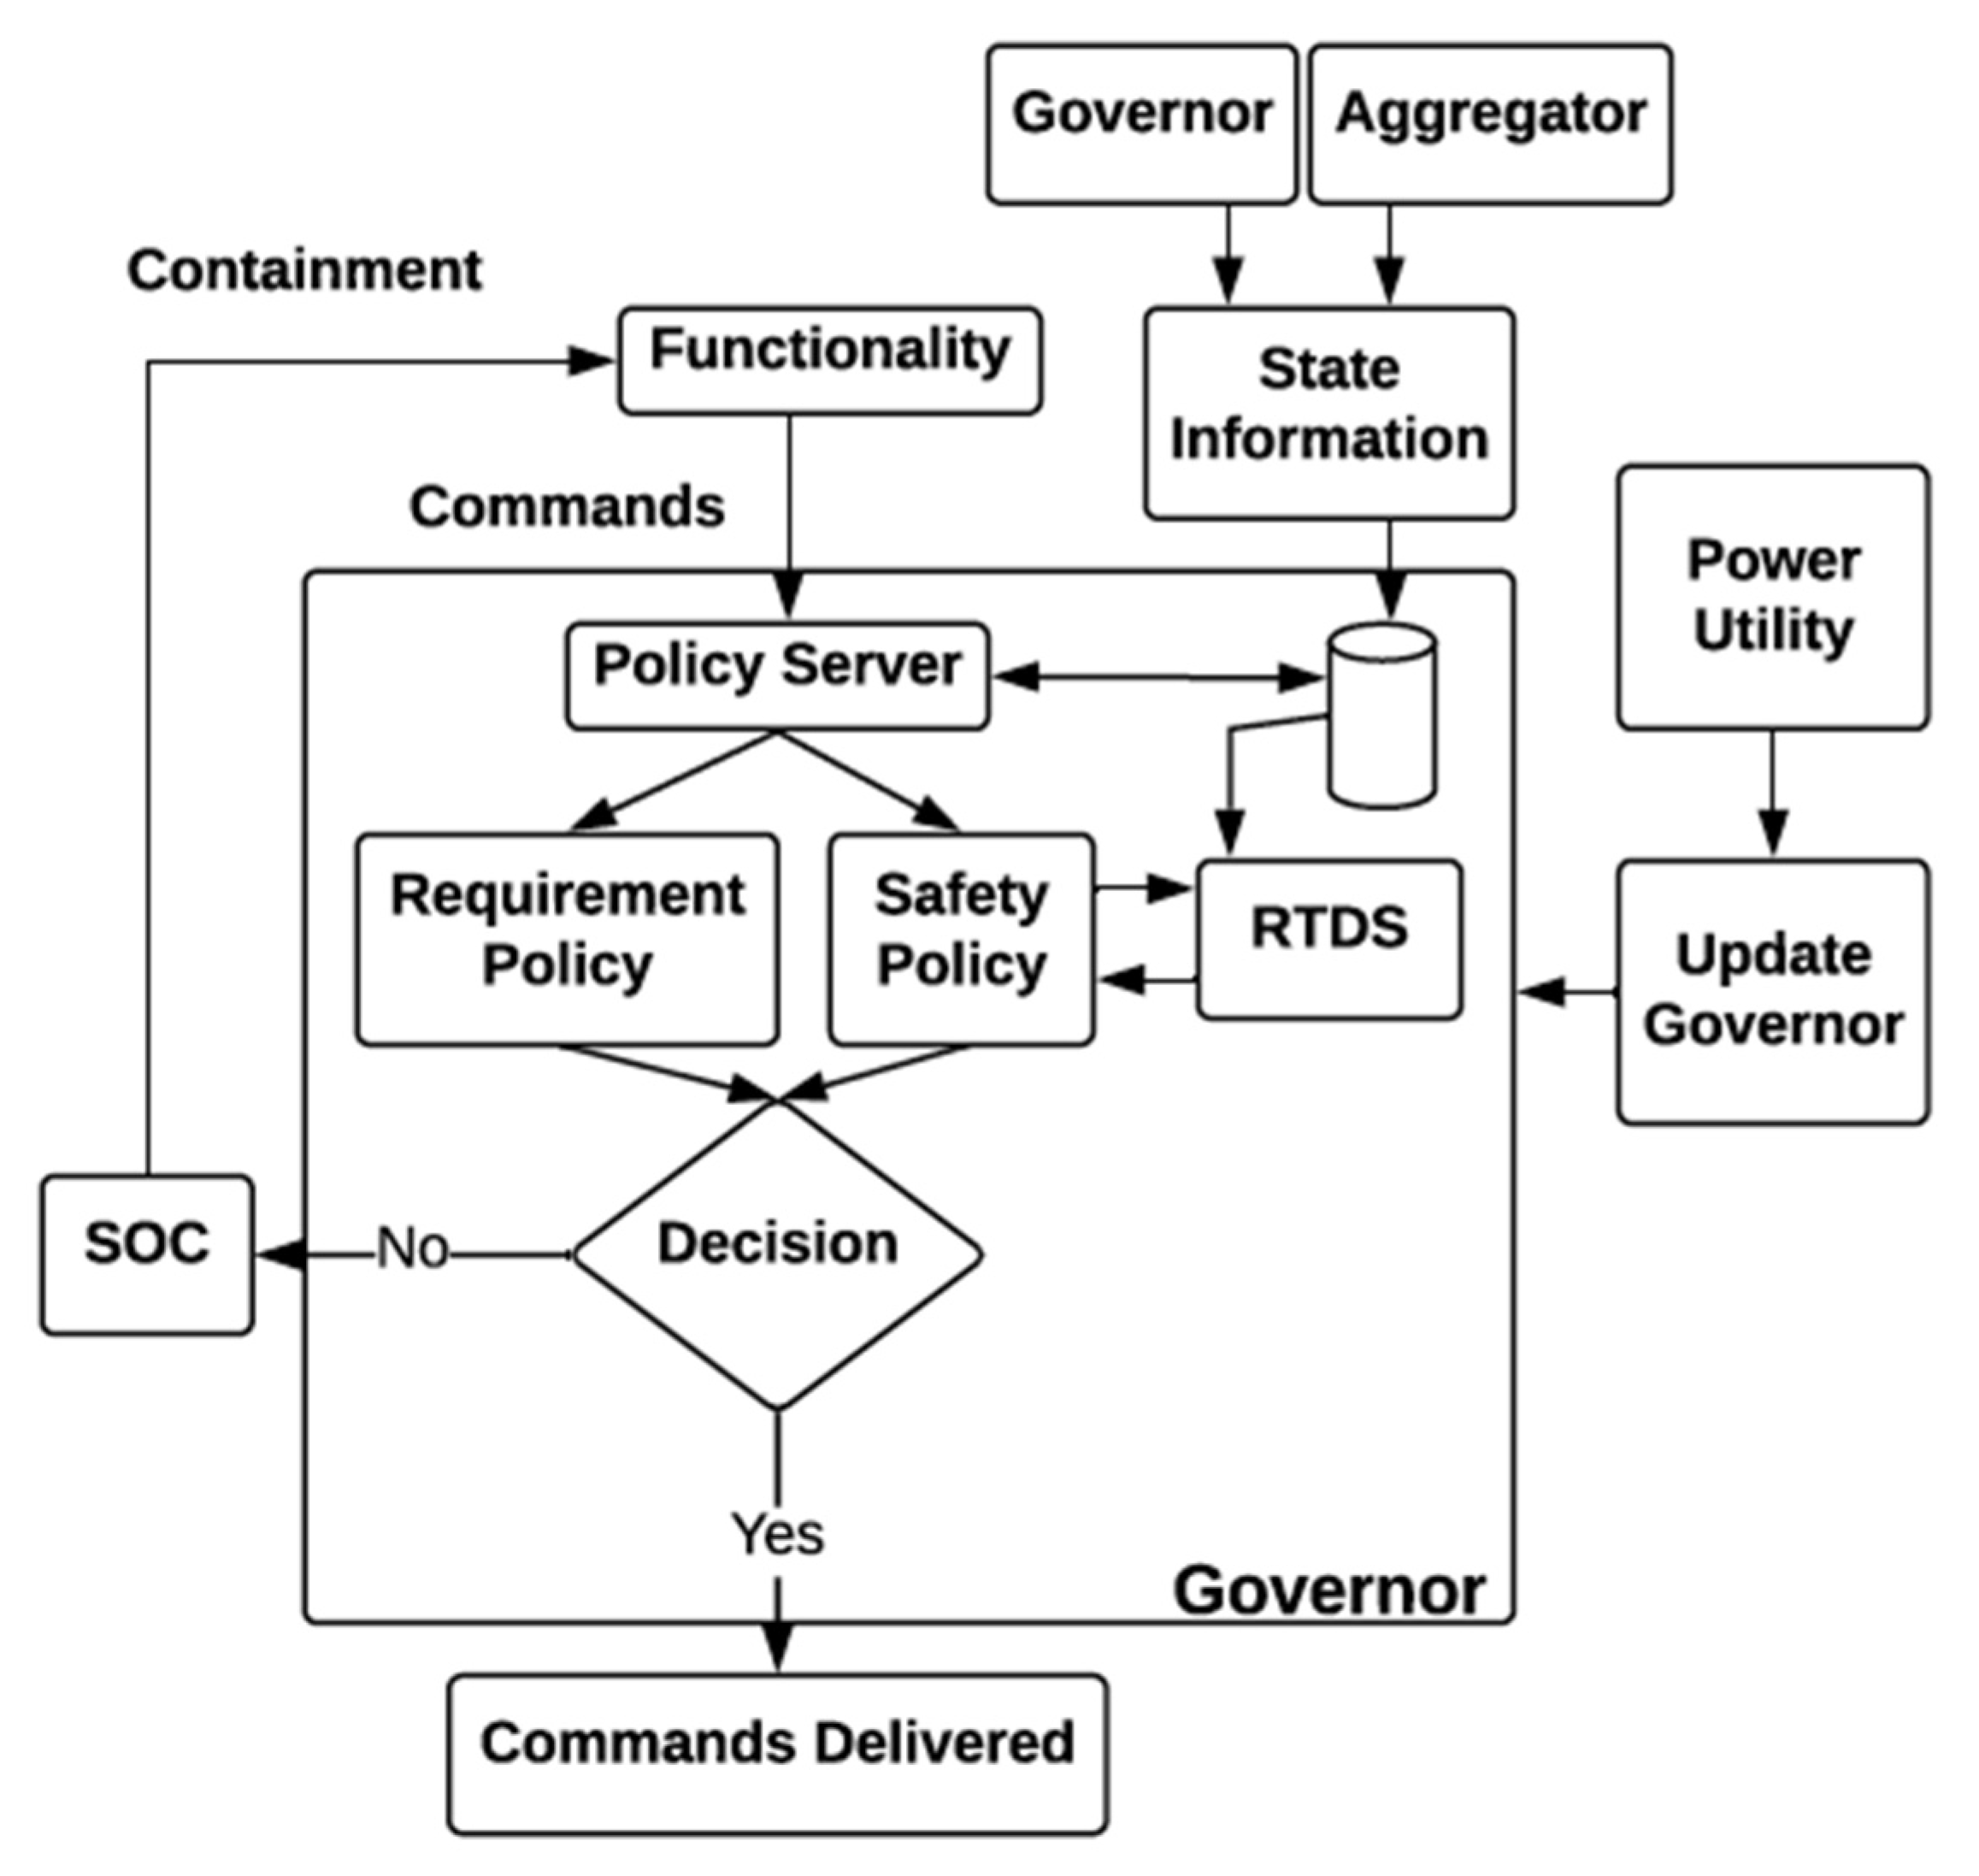
The governor consists of a policy server, power simulator for sensitivity analysis, and a database (see
Figure 2).
First, we need to decide where to place the governor for DR functionality. Since commands are either issued by DRAS or power utility (PU), we place governors close to each DRAS and another at PU (see
Figure 1). The policy server receives commands through a designated input port from the DR server. It cannot accept commands from other functionalities. It interacts with the database from where it gathers the state information about the local power system. The state information is collected from the aggregators which provide the power demand and supply information, the parent governor (PU governor shown in
Figure 2), and contingency information from PU. All DRAS governors send their decision to the PU governor.
The governor is distributed at different levels because commands are issued by different systems. The primary motive of the governor is to prevent malicious commands from reaching end systems. The PU governor prevents commands at a higher level, as it has the state information at various areas. The DRAS governor is closer to the local area and therefore it is important to evaluate commands locally. By implementing the governor for DR, we prevent all those attacks that are originated from compromised DRAS or the PU sub-system. If an adversary is able to control home devices directly (such as in [
19]), the governor is unable to prevent those attacks.
Second, the policy server verifies commands against two policies: requirement and safety. Requirement policy checks: (1) verification of whether customers to whom commands are sent have enrolled in the DR program and (2) verification of whether a set of commands are required to be implemented. The safety policy checks whether the power system will be in a safe state after implementing those commands. The safety policy makes use of a real-time power simulation tool, RTDS (real-time power system digital simulator) [
45], to make decisions. RTDS is used extensively in the industry to understand a grid’s behavior in the presence of contingencies. In this paper, we use the academic version of the Power World simulator to compute the safety condition for a sample grid described in
Section 7.
Third, after evaluating the commands, the governor either allows commands to go through or blocks commands since they are malicious. In the latter case, it notifies the security operations center (SOC) about the malicious commands so that power engineers start the containment procedure for the DR area to prevent an attack from propagating to other parts of the system. How SOC performs containment is out of the scope of this paper, but we discuss administrator responses in
Section 8.
Finally, PU is responsible for updating the governor’s software securely. We provide details of how to protect the governor system in
Section 10. In the next sub-section, we present governor rules.
6.2. Governor Rules
We present PU and DRAS governor rules to prevent attacks described in
Section 4. We state commands issued by PU and DRAS and specify rules evaluated by the governor.
6.2.1. Power Utility Governor Rules
PU issues DR commands either when a contingency occurs in an area and response is to be taken in a different area, or when DRAS is not able to maintain power demand and supply.
Command 1: LOAD_CURTAILMENT (L Mega Watts (MW) load to curtail to DRAS Y).
Rule 1.1: Required Policy
Steps:
PU issues this command to DRAS Y.
The PU governor verifies whether there is any contingency that led to reduced generation in some areas or hikes in demand based on the state information collected in the database.
If there is contingency, ALLOW. It signs the command and forwards it to DRAS Y; otherwise, DISALLOW.
Rule 1.2: Safety Policy
Steps: Checked by the DRAS Y governor using the safety policy in Rule 5.2.
Command 2: LOAD_SHEDDING (L MW load to shed to DRAS Y).
Rule 2.1: Required Policy
Steps:
PU send this command to DRAS Y.
The PU governor verifies whether there is any contingency that led to reduced generation in some areas or hikes in demand based on the state information collected in the database.
If there is contingency, ALLOW. It signs the command and forwards it to DRAS Y; otherwise, DISALLOW.
Rule 2.2: Safety Policy
Steps: Checked by the DRAS Y governor the using safety policy in Rule 6.2.
Command 3: DER_DISPATCH (L MW dispatch from DERs to DRAS Y).
Rule 3.1: Required Policy
Steps:
PU send this command to DRAS Y.
The PU governor verifies whether there is any contingency that led to reduced generation in some areas or hikes in demand based on the state information collected in the database. It knows whether to use DER to increase generation for some time.
If yes, ALLOW. It signs the command and send it to DRAS Y; otherwise, DISALLOW.
Rule 3.2: Safety Policy
Steps: Checked by the DRAS Y governor using the safety policy in Rule 4.2.
6.2.2. DRAS Governor Rules
DRAS issues DR commands when contingency occurs and response is taken in the same area. If DRAS is not able to maintain power demand and supply, it asks PU to take action. DRAS computes the percentage of customers (who are enrolled in DR program) on a rotating basis [
32] to send commands in order to mitigate contingency.
Command 4: DER_DISPATCH (X% of customers in area Y).
Rule 4.1: Required Policy
Steps:
The DRAS governor verifies whether the command is issued by PU. If PU issued this command, the PU governor would have verified the need of the command and signed it before sending it to DRAS.
The DRAS governor will verify the signature of the PU governor and ALLOW the command. If the command is not signed by the PU governor, that means it is originated from DRAS; jump to step 3.
The DRAS Y governor needs to check whether generation loss occurred or is about to occur in area Y. The DRAS Y governor receives information about the power supply and demand from local aggregators and about any contingency in all areas from the PU governor. Therefore, using the state information, the DRAS Y governor verifies whether there is (or will be) any generation loss in area Y.
If yes, it will ALLOW dispatching of the power to compensate the generation loss; otherwise DISALLOW.
Rule 4.2: Safety Policy
Steps:
Since the command is required to be implemented because of generation loss in area Y, the governor checks whether it is safe to execute. In area Y, the governor has power consumption readings, power supply readings, and the area frequency from aggregators.
It evaluates whether the power supply increase from X% DERs in that area will put the area frequency in a safe state. Each area has a certain power supply PS(t) that can be increased for a certain period before area frequency crosses the over-protection frequency threshold.
If the increase in supply is less than PS(t), it is safe—ALLOW; otherwise, DISALLOW.
Command 5: LOAD_CURTAILMENT (X% of customers in area Y; LX load to curtail at each customer; L MW load to be curtailed signed by the PU governor).
Rule 5.1: Required Policy
Steps:
If generation loss occurs in area X and load curtailment needs to be performed in area Y, the command must be issued by PU, jump to step 2. If generation loss occurs in area Y and load curtailment needs to be performed in the same area, jump to step 3.
PU issued the signed load curtailment command to DRAS Y. When DRAS Y issues commands to all customers, the DRAS Y governor captures these commands and verifies the signature of the PU governor for the recent timestamp and verifies the total load that has to be curtailed using the signed information. If , ALLOW; otherwise, DISALLOW.
By leveraging the state information from the database, the DRAS Y governor determines whether there is any contingency in the same area. If there is no contingency in the same area, discard the commands.
If there is contingency in area Y, each governor has Z% (in addition to the generation loss) to which it will allow load drop commands to go through. This will provide the maximum load that can be dropped. Let Z = 10%. If contingency is of 20% generation loss, the governor has a load drop allowance of 20–30%.
Rule 5.2: Safety Policy
Steps:
Note: The P(t) value for a time period is computed by the RTDS in reality. In this paper, we compute P(t) via Power World sensitivity analysis (described in
Section 7.2).
Command 6: LOAD_SHEDDING (X% of customers in area Y to shed load; L MW load to be curtailed and signed by the PU governor)
Rule 6.1: Required Policy
Steps:
If generation loss occurs in some areas and load shedding needs to be performed in area Y, the command must be issued by PU; jump to step 2. If generation loss occurs in area Y where commands are issued, jump to step 3.
PU issued the signed command to DRAS Y. The DRAS Y governor will verify the signature of the PU governor for the recent timestamp and verify the total load needs to be shed using the signed information. If it holds, ALLOW; otherwise, DISALLOW.
If there is no contingency in the same area, discard the commands. If there is contingency in the area, it will compare the generation loss plus Z% with the total percentage of load to be dropped.
Rule 6.2: Safety Policy:
Steps:
The governor has the information about the load of X% customers in area Y;. Verify the total load shed by disconnecting X% customers in area Y for a given time period with P(t).
If D(t) < P(t), ALLOW; otherwise, DISALLOW.
Rule 7: Customer Policy for the DRAS Y Governor.
Steps:
The DRAS governor checks whether customers have enrolled in the DR program.
Customers to whom commands are sent should not be hospitals or critical infrastructure where power supply is required all the time.
If customers have not enrolled in the DR program and commands are sent to critical infrastructure, DISALLOW; otherwise, ALLOW.
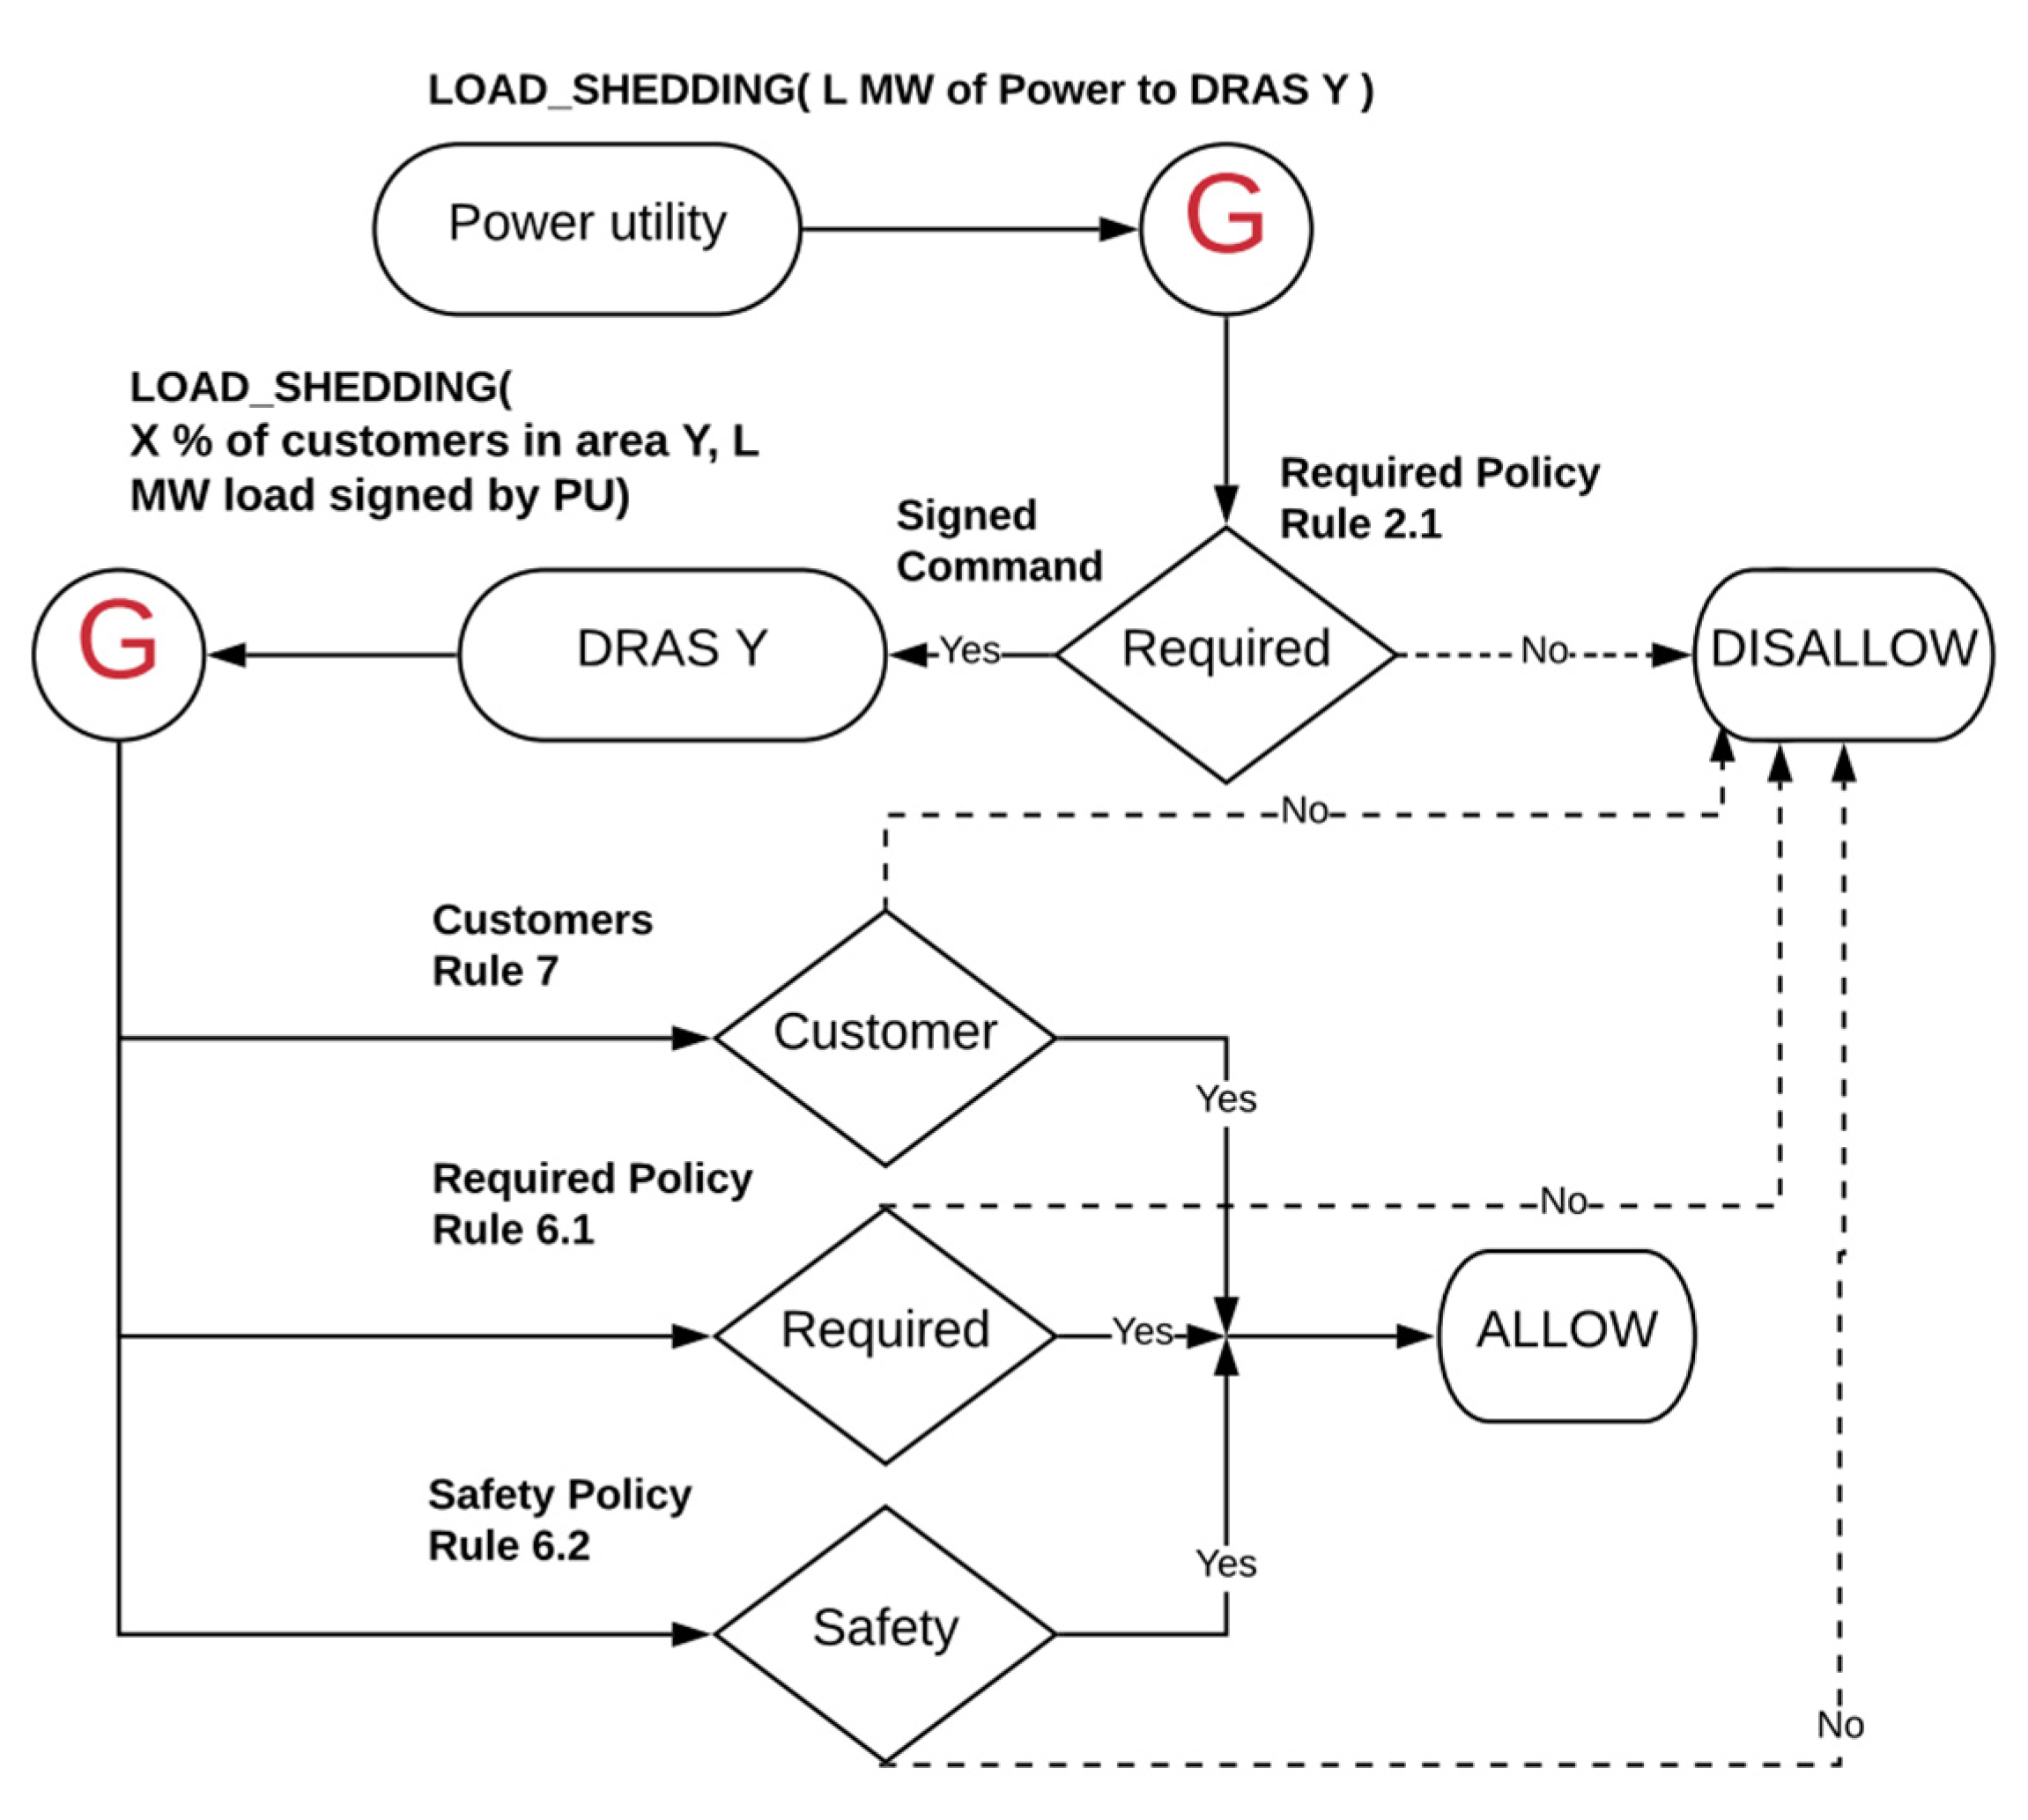
6.2.3. Load Shedding Attack Use Case
Suppose an adversary has already compromised a DR cyber system in PU. They send malicious load shedding commands to DRAS Y to shed L MW of the load from area Y. In the absence of the PU governor, commands are delivered to DRAS Y. DRAS Y computes the total number of customers to send load shedding commands based on the power consumption of each customer. Again, in the absence of the DRAS governor, the commands are delivered to all customers. The customers are disconnected from the grid and load drop occurs, which can make the grid unstable.
Now consider the case when PU and DRAS governors are present. The command goes through the PU governor, and it evaluates whether this command is required or not according to Rule 2.1. The PU governor verifies whether there is any contingency in the system that led to reduced generation in some areas, or whether there is a hike in demand. If it is required, ALLOW. It decides, using the rotating policy, to which DRAS to send the command. It signs the command and sends it to DRAS Y. Here, DRAS Y computes the total number of customers to send the load shedding command in its area based on the total load from each customer (assuming each customer has the same load requirement). The commands are captured by the governor, and it evaluates for all customers Rule 7, Rule 6.1 (required policy) and Rule 6.2 (safety policy) simultaneously. If any policy says NO, the commands are discarded. See
Figure 3 for the flow chart of the load shedding command.
7. Experimental Demonstration
In this section, we demonstrate the effectiveness of the IGNORE system for preventing load-altering attacks through compromised DRAS or PU cyber systems. Our results are based on computer simulations. First, we explain the physical system modeling. Second, we explain the simulation methodology and attack use-cases. Finally, we demonstrate the effectiveness of the DR governor by providing simulation analysis.
7.1. Power Grid Simulation Setup
We use the academic version of the Power World simulator to perform a transient stability analysis of the grid. We use the IEEE 9-bus system [
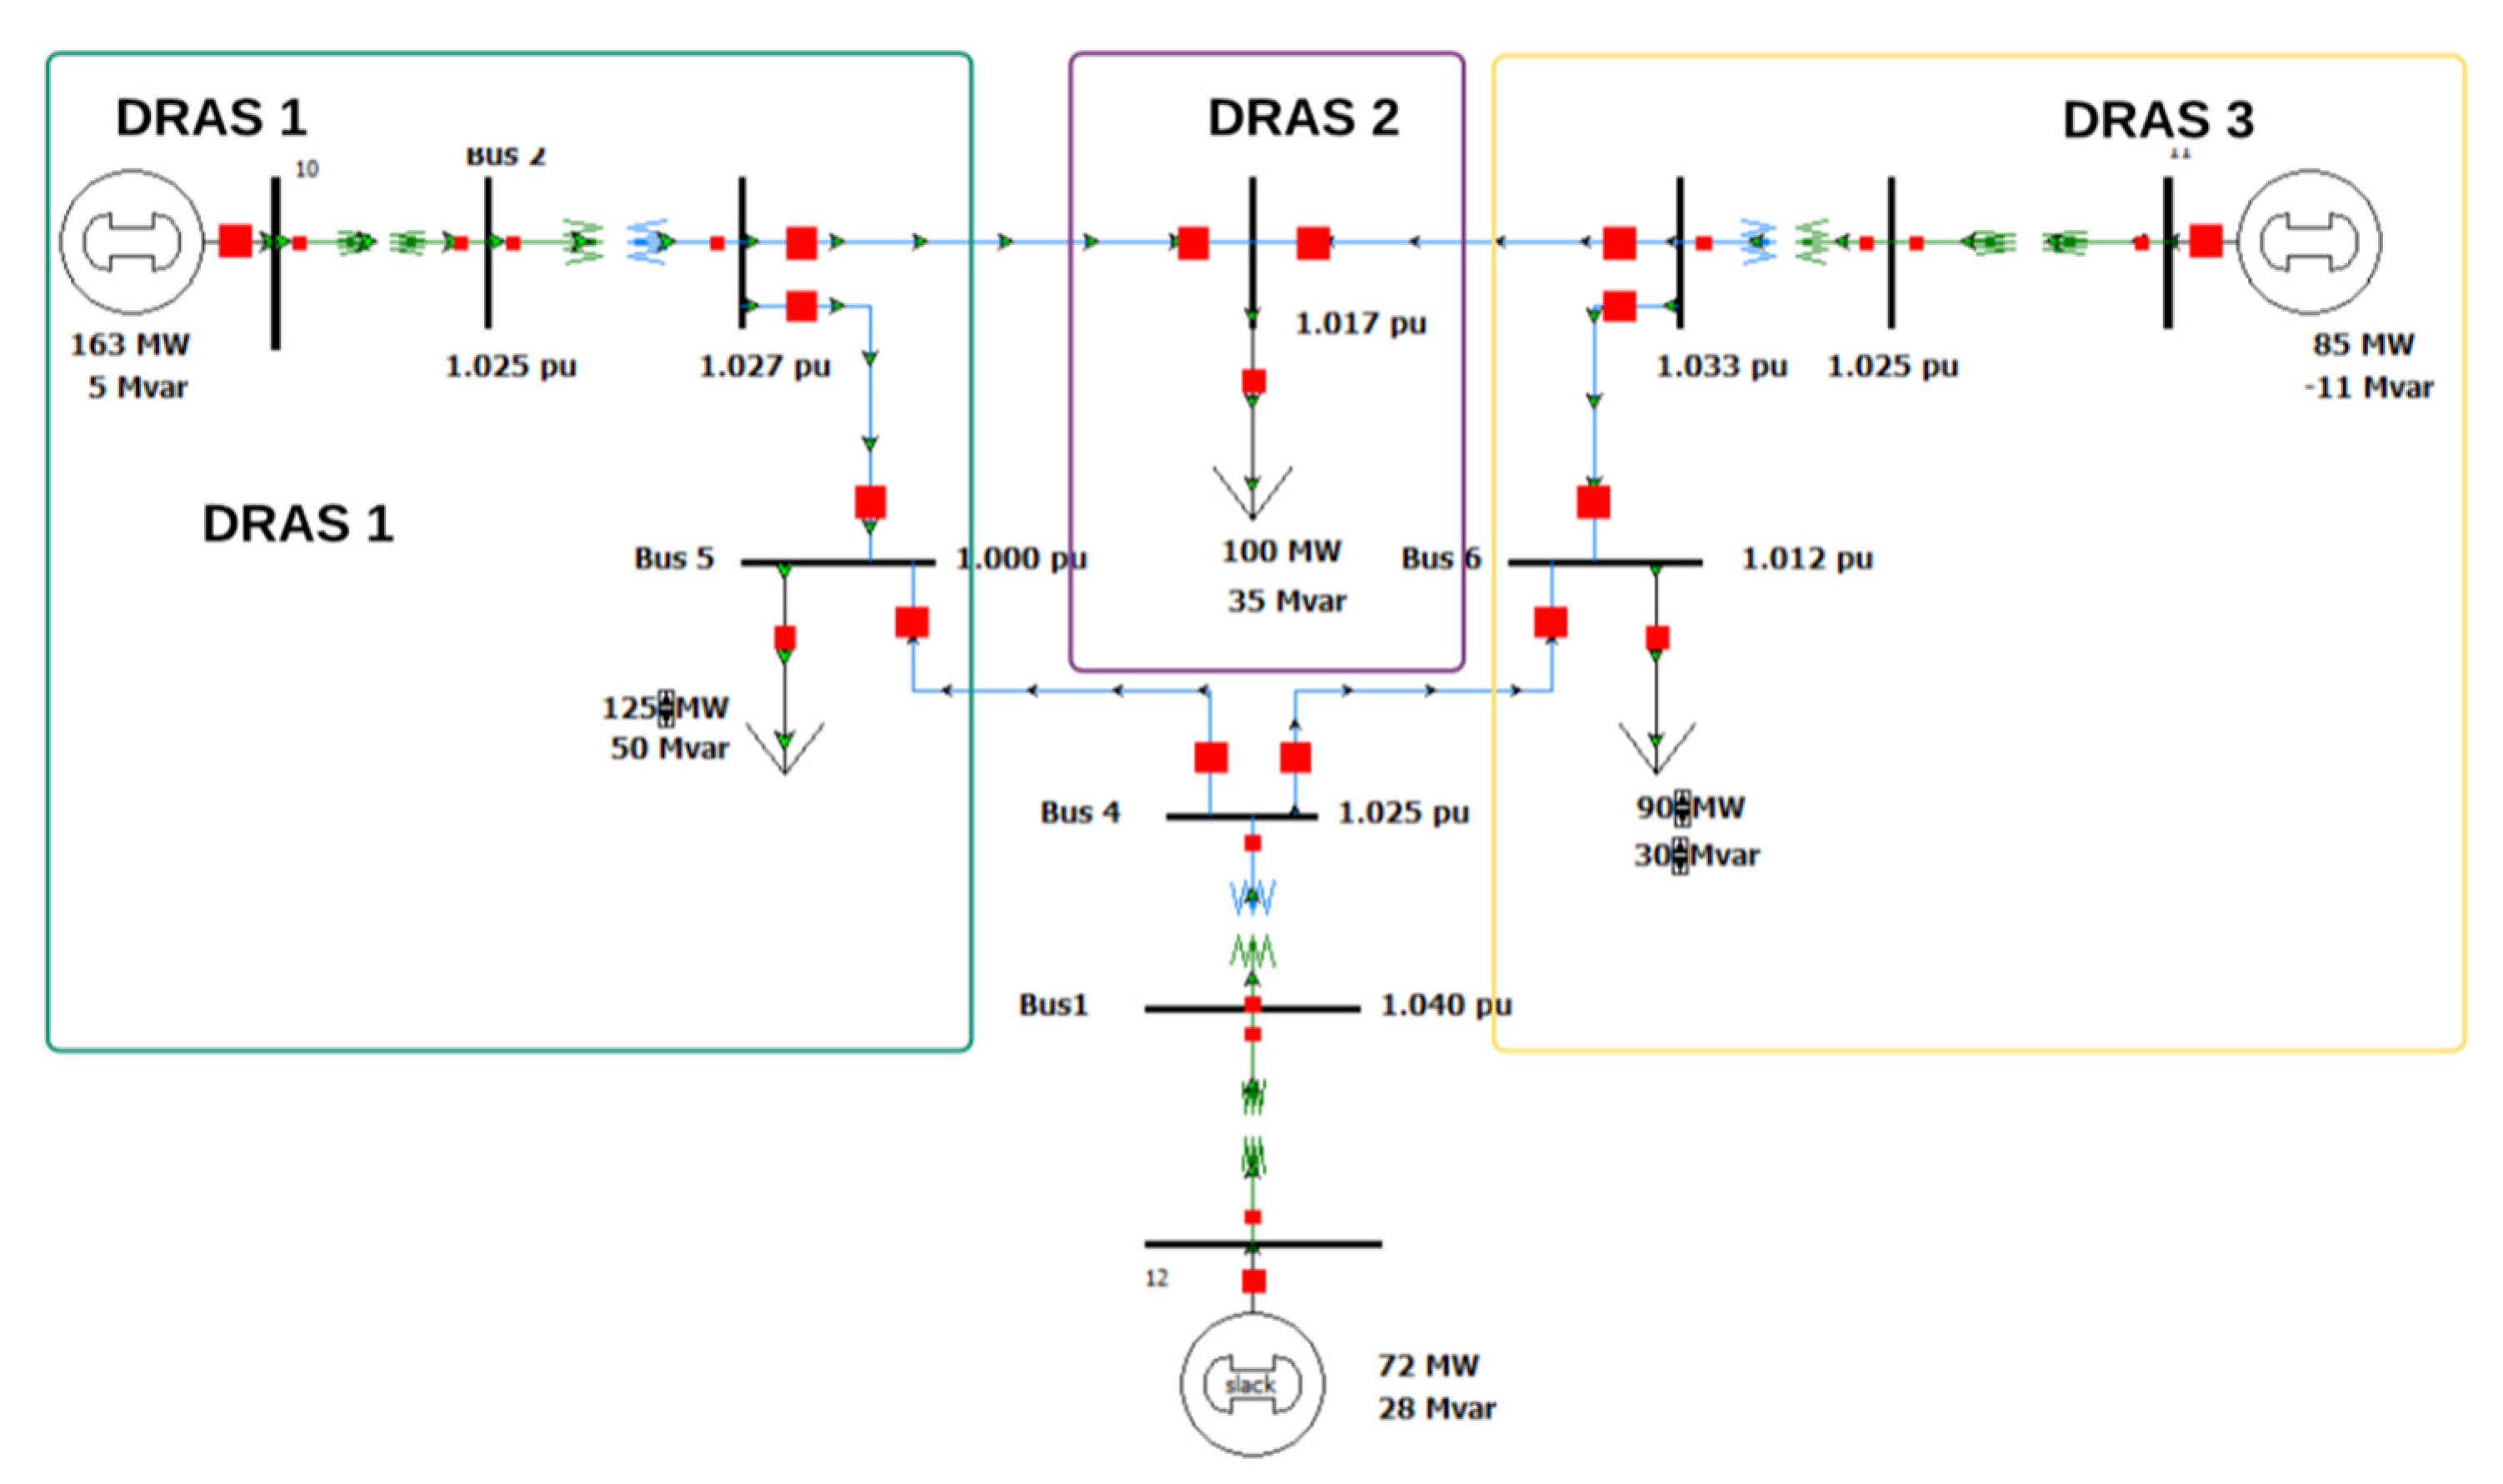
46] to represent the power grid because it has frequently been used as a benchmark in the industry to perform transient stability analysis. It represents a simple approximation of the Western System Coordinating Council (WSCC) with nine buses and three generators. We divide the 9-bus grid into different areas controlled by DRAS shown in
Figure 4. DRAS 1 is responsible for zip code 1 (see
Figure 1) which is modeled as the load on bus 5. DRAS 2 is responsible for zip code 2 which is modeled as the load on bus 8. Finally, DRAS 3 is responsible for zip code 3 which is modeled as the load on bus 6. Bus 1 is a slack bus for providing base power supply to the system. Generators on bus 2 and 3 are responsible for providing power to specific zip codes in which they are present and to zip codes modeled as the load on bus 8.
We model zip codes using zip code 90057, which is a highly populated neighborhood in central Los Angeles [
47]. We gained information regarding zip code 90057 power consumption data from industrial, commercial and residential customers. The values of percentages and average load in kilowatts (kW) were derived from average numbers for the entire Los Angeles Department of Water and Power (LADWP) service area, and they are reported by the US Energy Information Administration. We used the neighborhood data in
Table 3 to model all zip codes.
Consider bus 5 of the IEEE 9-bus system which has a load of 125 MW and is modeled as zip code 1. According to
Table 3, one neighborhood has an average load of 689.16 kW. Therefore, the total number of neighborhoods in zip code 1 is approximately 181.
Table 4 represents the number of neighborhoods (#NH) modeled on each load bus. Each meter is modeled as a residential, commercial or industrial customer in a neighborhood. Since one neighborhood contains 349 houses (
Table 3), 181 neighborhood contains 63,169 houses.
Table 4 illustrates that the load on bus 5 (zip code 1) is produced by 181 neighborhoods, which contains 63,169 residential, 8869 commercial and 362 industrial customers.
7.2. Safety Policy
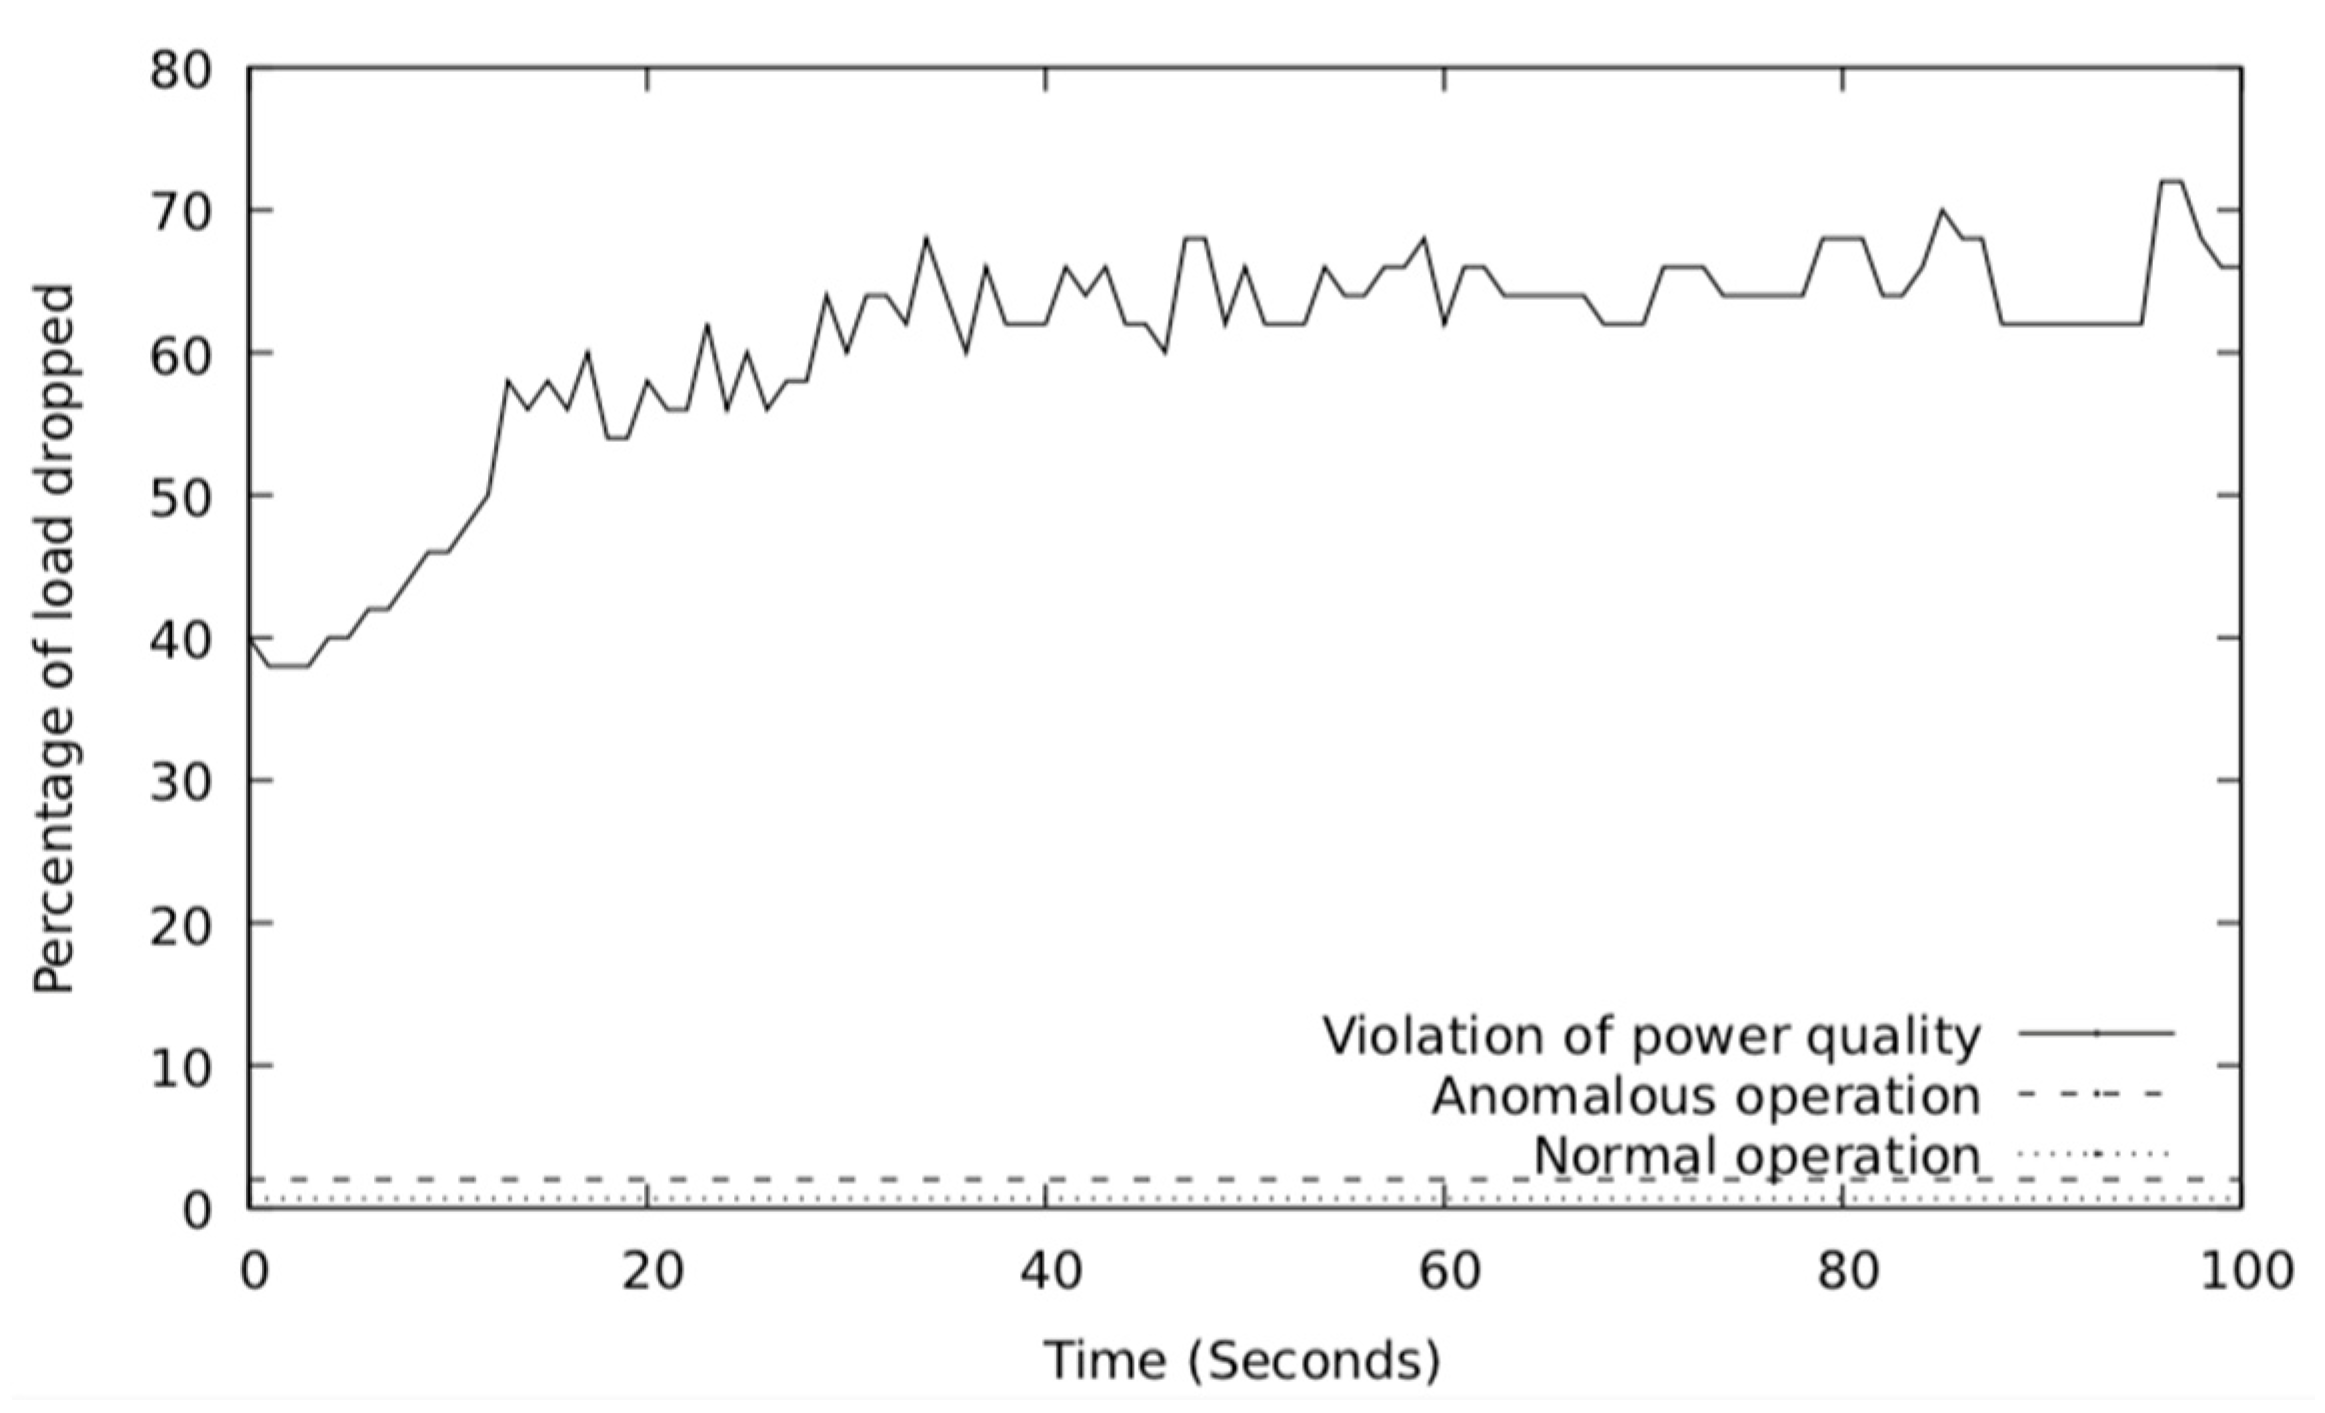
In regard to the safety policy of the load shedding or curtailment commands, the governor compares the percentage of the load to be curtailed or shed, that is, the load drop, with the maximum percentage of the total load that can be dropped before the system destabilizes.
Figure 5 represents the boundary of power quality violation, which shows that if the percentage of load drop occurring over a certain duration of time goes beyond the boundary, area will not be in a safe region. We use this as the safety policy. The graph changes over time based on the power demand and power supply. The governor must compute and update the P(t) graph based on the state information. In real-world power system, RTDS must be used since it is a fast real-time power simulation tool used to perform sensitivity analysis.
7.3. Simulation Methodology
The total demand in the IEEE 9-bus model is 315 MW, which is satisfied by three generators by supplying 320 MW. For experimental purposes, we use the percentage of these values for the generation loss or load drop. Suppose 70% of generation loss occurs in zip code 1 and utility performs load shedding to shed 40% of the load in the same area. We model this scenario by reducing 70% of generation from gen 2 and then reduce 40% of the load from bus 5. Then, we perform transient stability analysis and plot the frequency to understand whether the system is stable or not. We demonstrate the stability of the system in the presence of a load shedding attack in two cases where (1) the governor is not present, and the (2) governor is present. We run every simulation for 300 seconds and plot an area frequency curve.
7.4. Base Cases
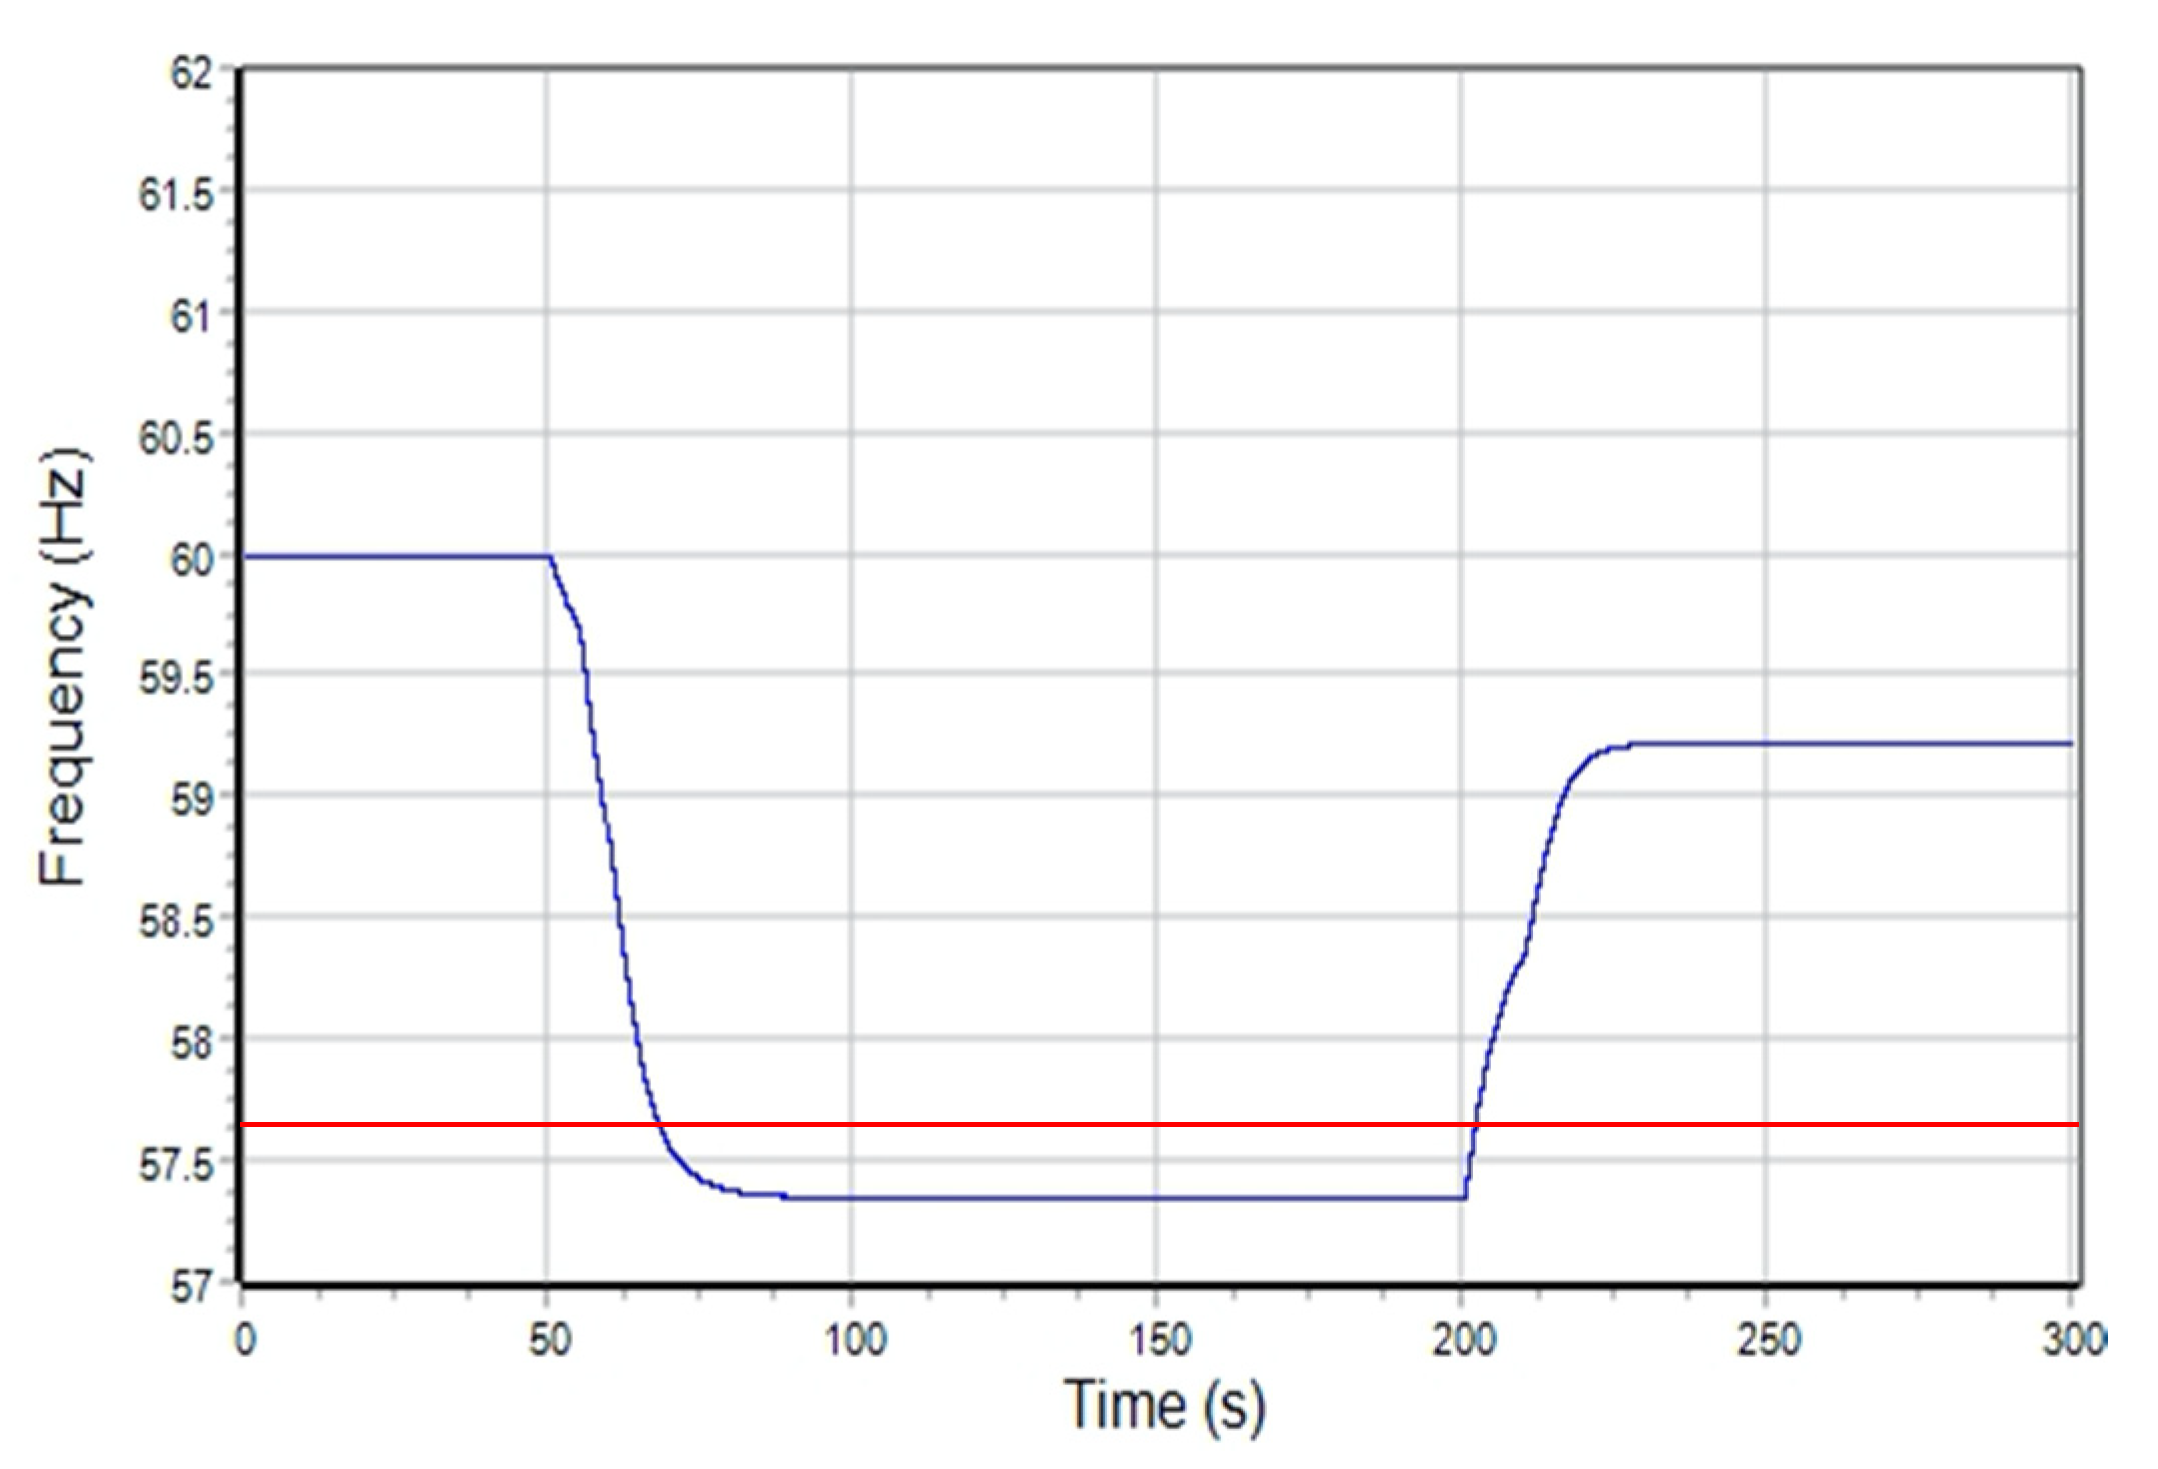
In order to show how the frequency of the system behaves in the presence of contingencies as a base case, we simulate the generation loss and load shedding performed by PU in the absence of the governor and attacks. The initial generation from the generators in the WSCC model at bus 10 and bus 11 is 163 MW and 83 MW, respectively.
Suppose during a hot summer day the power demand is at its peak and the system must satisfy the demand by providing a relevant generation. If there is a sudden increase in load, more power will flow through lines, which may result in line overloads and ultimately, line tripping. This is because power flow is computed according to Kirchhoff’s law, which does not have any capacity constraint. Once line starts tripping, lines connecting the generators to the grid will trip and, thus, generation loss occurs. To model this scenario, we reduce the generation on bus 10 by 20% at the 50s, 50% at 55s and bus 11 by 45% at 60s. After some time, we restore the generation of bus 10 by 45% at 200s and bus 11 by 40% at 210s.
Figure 6 shows how frequency deviates from its normal state (60 Hz), moves to a contingent state and, finally, goes beyond the under-frequency threshold of 57.60 Hz.
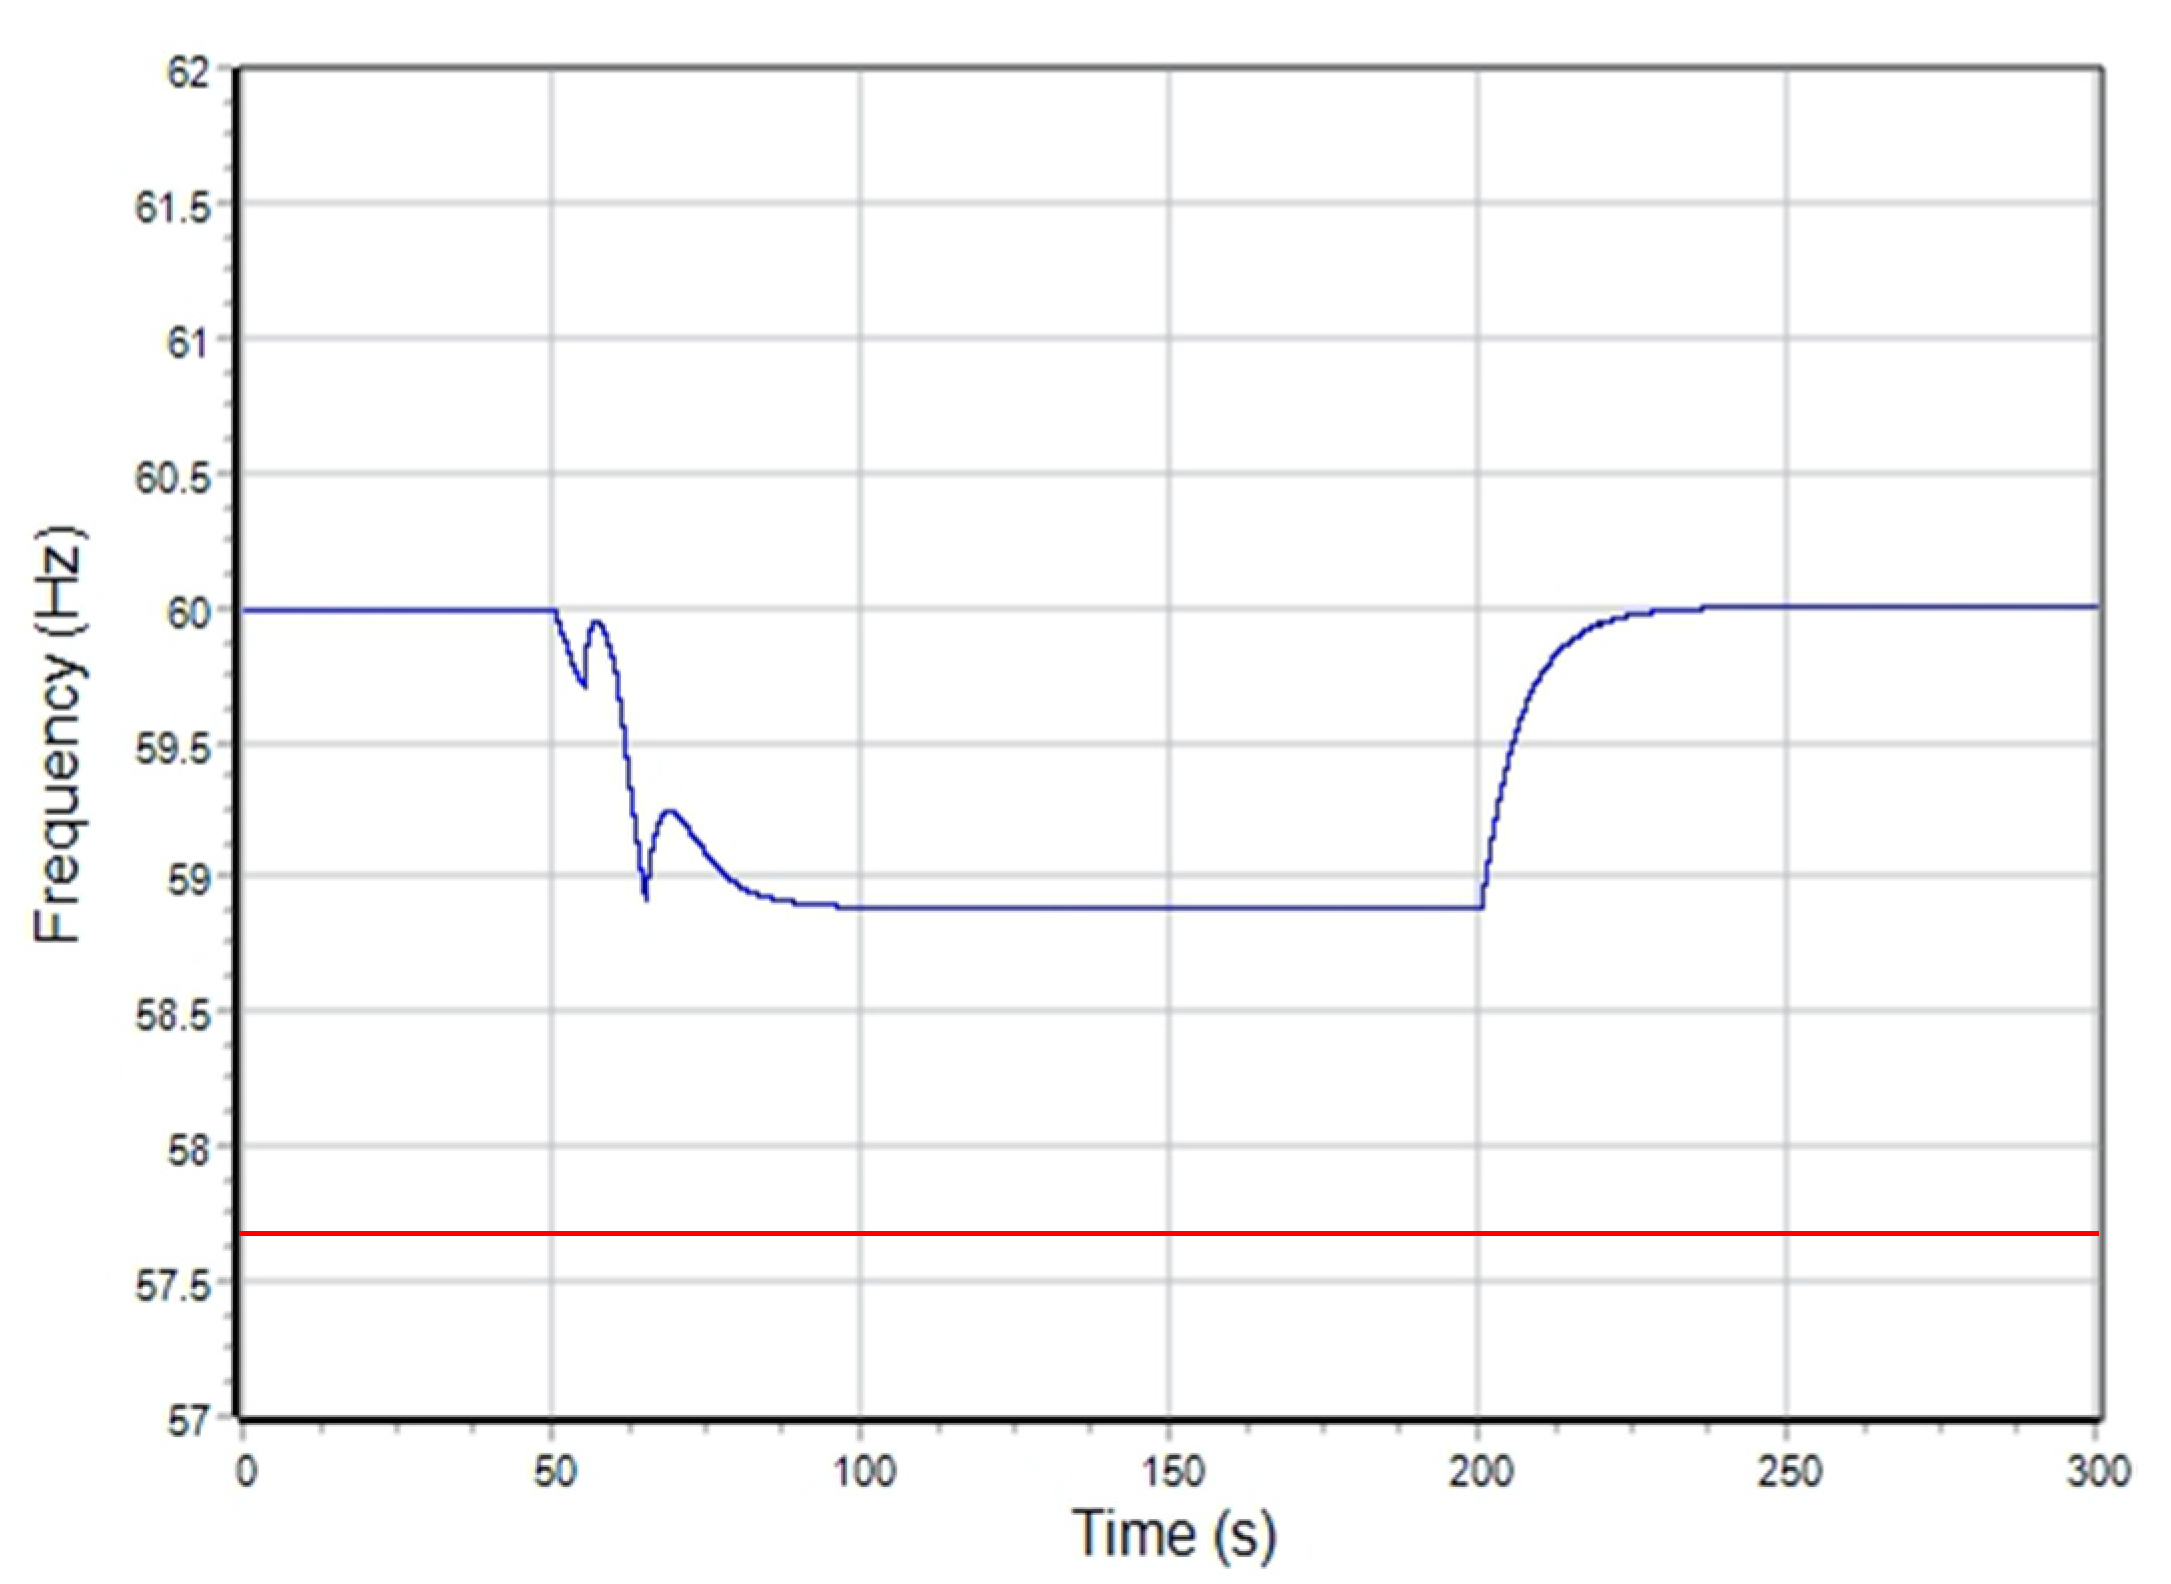
In the above case, PU does not perform load shedding to bring frequency to the normal state. Let us examine what occurs when utility performs the load shedding in the above simulation. PU knows about the generation loss; it sends a load shedding command to DRAS 1 and 2 to reduce the load by 40% in each area. DRAS 1 and 2 receive the load shedding command and compute the number of meters to send the load shedding command using
Table 1 and
Table 2. DRAS 1 is responsible for controlling the load at bus 5, which is 125 MW and 40% of 50 MW load means. Similarly, DRAS 2 is responsible for bus 8, and it must shed 40 MW of the load. Suppose DRAS 1 sheds 30 MW of load from residential meters and 20 MW from commercial meters. DRAS 1 sends load shedding commands to 70.88% of residential meters and 26.49% of commercial meters. Similarly, DRAS 2 sheds 30 MW of load using residential meters and 10 MW from commercial meters. Therefore, DRAS 2 sends commands to 88.48% of the residential meters and 16.53% of the commercial meters.
Figure 7 presents the frequency curve over time for the load shedding scenario during generation loss. The load shedding signals from DRAS 1 reached 55, and this is why we see an increase in frequency. Due to the loss of generation on bus 11, the frequency drops. At 65 s, the load shedding commands from DRAS 2 leads to an increase in frequency and prevents the frequency from dropping further. After a certain duration, when generation is restored, the frequency goes back to normal.
7.5. Load Shedding Attack—Without a Governor
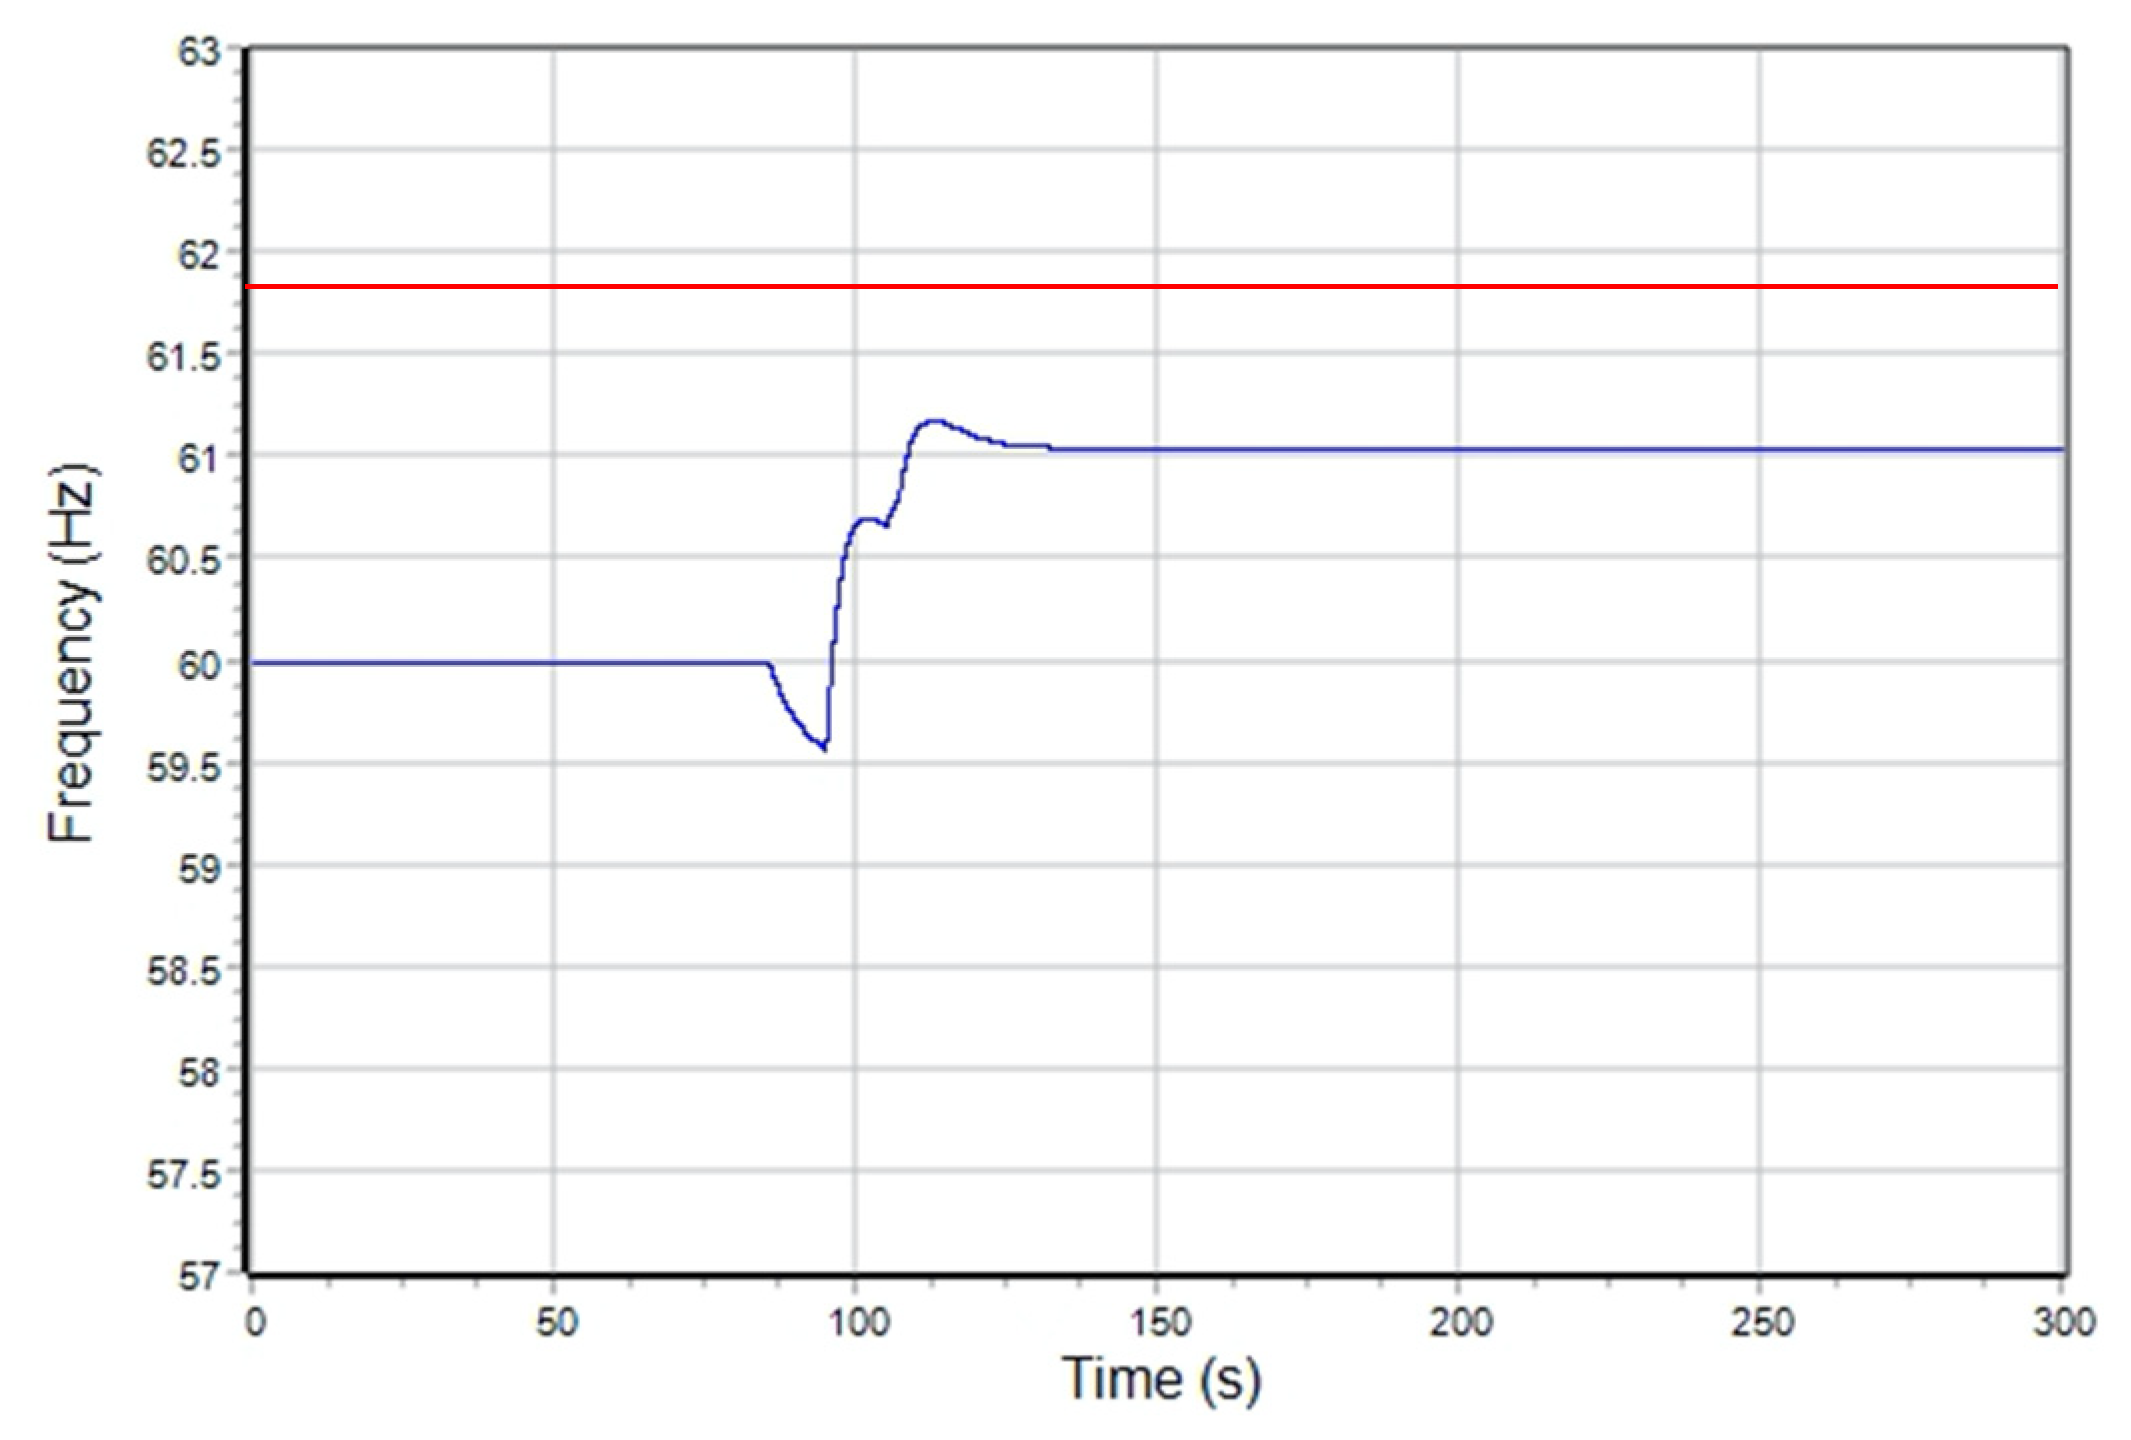
Suppose in DRAS 1 area, 20% of generation loss (32.6 MW) occurs, and PU sends load shedding signals to reduce 30% of power consumption on load bus 5. An adversary leverages this information and performs irrelevant load shedding. In the first case, an adversary sends load shedding signals from compromised DRAS 1,2,3 to 70.88% of residential meters and 43.06% of commercial meters in DRAS 1, 44.41% in DRAS 2 and 58.98% in DRAS 3 to reduce 20% (additional load), 15% and 20% of the load, respectively.
Figure 8 shows when generation loss occurs at 85 s, area frequency drops. However, relevant and irrelevant load shedding signals cause frequency to increase above the normal value but within the over-frequency threshold of 61.8 Hz. In this case, customers were forced to shed load when it was not required. This will cause dissatisfaction with this service and cause customers to start sending requests for power outage if it occurs regularly.
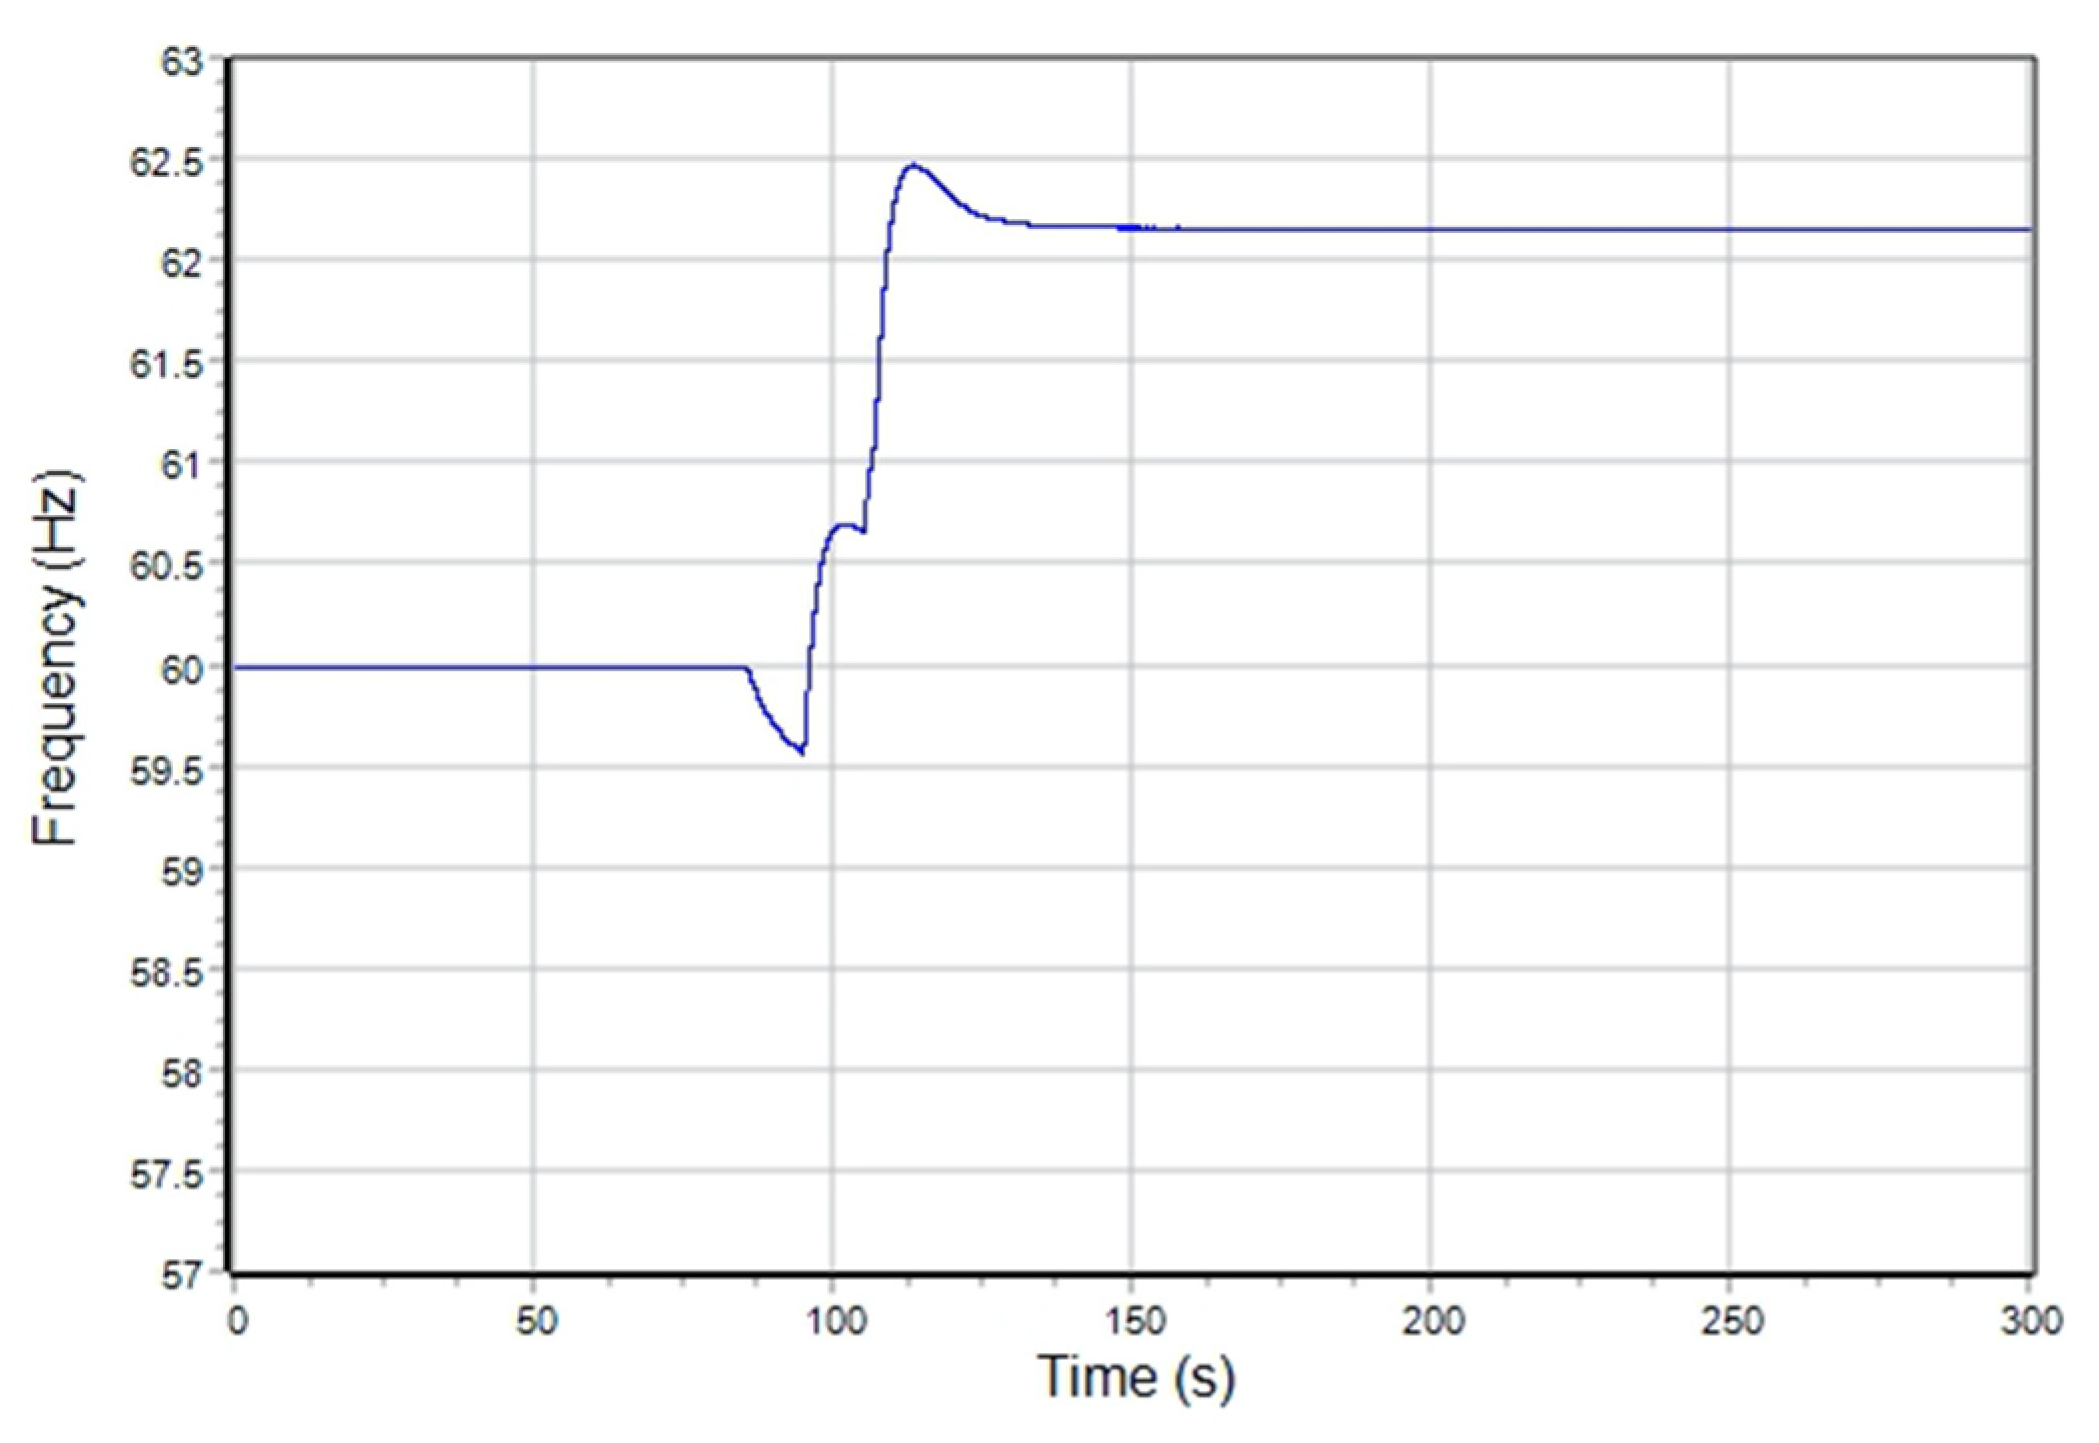
In the second case, an adversary sends irrelevant load shedding commands from compromised DRAS 1,2,3 to reduce 20% (additional load), 45% and 60% of the load, respectively, with the main aim of destabilizing the system. DRAS 1 recovers load from 70.88% of residential meters and 43.06% from commercial meters in its area. DRAS 2 recovers 30 MW from 98.96% residential meters and 10.5 MW from 19.36% commercial meters, and DRAS 3 recovers 30 MW from 88.48% residential meters and 30 MW from 49.61% commercial meters.
Figure 9 shows that when generation loss occurs at 85 s, area frequency drops. However, shedding commands cause frequency to increase beyond the over-frequency threshold of 61.8 Hz at 110 s. Once the area frequency goes beyond the secure threshold, generators trip and further generation loss occurs.
7.6. Load Shedding Attack—With a Governor
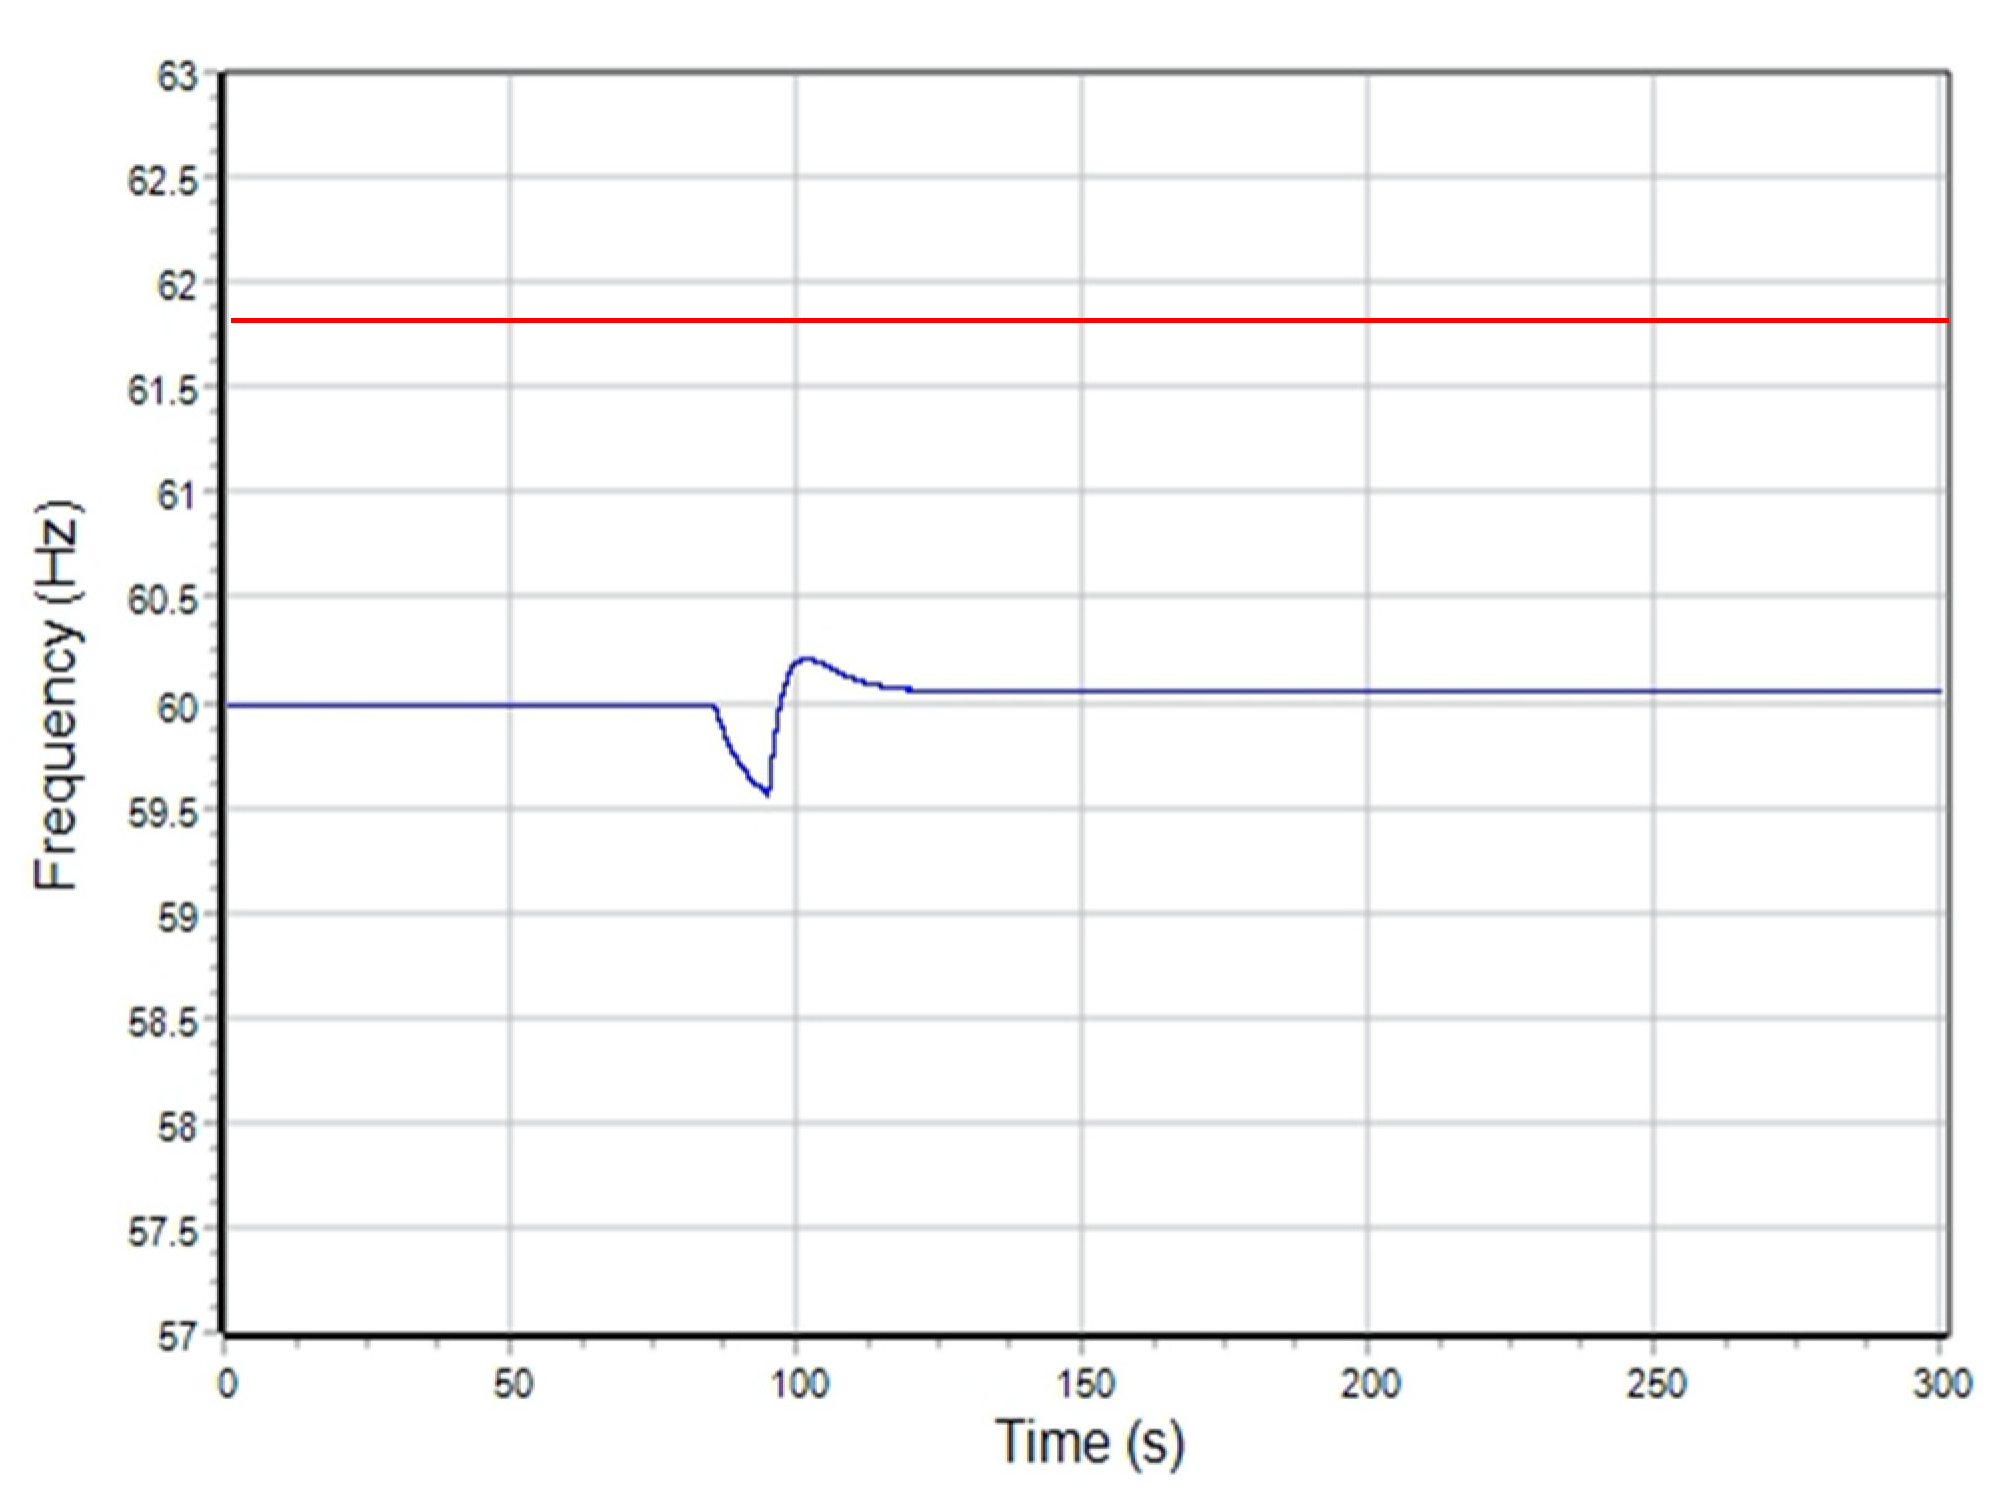
Suppose in DRAS 1 area, 20% of generation loss (32.6 MW) occurs, and DRAS 1 sends load shedding signals to reduce 30% of the load on bus 5. Since commands are not originated from PU, generation loss might occur in the same area where the command is issued. An adversary sends load shedding commands on bus 5, 6, and 8 to reduce the load by 20%, 15%, and 20%, respectively. The main purpose of the attacker is to disconnect customers from the grid and increase the cost of the utility in terms of customer dissatisfaction and customer reconnection. DRAS 1,2,3 governors provide local safety by verifying safety and the requirement policy (Rule 6).
DRAS 1 governor requirement policy: This checks whether there is any contingency in area 1; if yes, the total load shed should be in the range of total generation loss of 20 to 30% according to Rule 6.1. In this case, 50% of the load drop commands are issued on bus 5 in response to 20% of generation loss in zip code 1; it will only allow 30% of the load to drop, and it allow commands accordingly. The rest is discarded. In the simulation, as an administrator, we issue 30% load drop commands, but in reality, the administrator will issue commands that they think is the incorrect response for the system and, accordingly, they will adjust the Z value. DRAS 1 governor safety policy: this checks the total load to be dropped; in this case, it is within limits of the safety policy according to
Figure 5. Since the 30% load drop is below the threshold, it will be allowed. DRAS 2 and 3: since there is no generation loss in these areas and the commands are not originated from PU, DRAS 2 and 3 governors will discard these commands.
Figure 10 presents the area frequency curve where attack commands are blocked by the governor, wherein DRAS 1-relevant commands are allowed (allowed by DRAS 1) and irrelevant 15% and 20% load drops are blocked by DRAS 2 and 3, respectively.
If commands had originated from PU, although load shedding occurs in zip code 1, generation loss would have occurred in another area. PU issues the command to DRAS 1. The PU governor would verify and sign the command using Rule 2.1 and forward it to DRAS 1. The DRAS 1 governor verifies the sign of the PU governor and the total load needs to be shed using Rule 6.1. If the commands are valid, it verifies whether it is safe to execute commands using the safety property rule (Rule 6.2). If it is safe, it will allow commands. If the governor is not present, the grid destabilizes in
Figure 9; otherwise, it occurs as in
Figure 10.
7.7. Analysis of Special Cases
In this section, we show how the governor prevents area-wise attacks discussed in
Section 4.4, and how to upgrade governor rules for two special cases: (1) when a critical infrastructure in an area requires power supply irrespective of whether the other area is stable or not, and (2) how to prevent load shedding attacks where the attacker reduces the load shedding command to cause overloading instead of performing extra shedding.
Area-wise Attacks. We assume that generation loss contingency (GLC) occurs, and the load shedding attack (LSA) is prevented by the governor in all cases. Cases are represented by attack number (CRA).
Attack 1 (X;X;X): An adversary performs LSA in the same area X where GLC occurs, and DRAS X responds to mitigate the contingency. He DRAS X governor verifies the command issued by DRAS X according to Rule 6 since it knows about the state information (and GLC) and verifies whether this command is required and safe for the local system X.
Attack 2 (X;X;Y): GLC occurs in area X; the system responds in the same area, but an adversary performs LSA in area Y. If compromised, DRAS Y issues LSA commands; it will be detected by the DRAS Y governor since there is no contingency in area Y, and, therefore, it will disallow commands and notify SOC. If commands are issued by PU to DRAS Y, the PU governor will detect this malicious command since it knows that the DRAS X governor has already taken action in X, and there is no need to perform any further action. If DRAS X cannot mitigate GLC, it asks PU to take a certain action, and this request goes through the DRAS X governor. Finally, the DRAS X governor verifies the request and forwards it to PU and the PU governor. The PU command will be verified according to Rule 2.
Attack 3 (X;X;X,Y): GLC occurs in area X; the system responds in the same area, but an adversary performs LSA in both areas X and Y. When an adversary issues LSA commands in X, it will be detected by the DRAS X governor according to Rule 6. In the case of Y, LSA commands are verified similarly as in the case of Attack 2.
Attack 4 (X;Y;X): GLC occurs in area X; the system responds in a different area: area Y. This is the case when DRAS X requests PU to perform load shedding since it cannot mitigate GLC. DRAS X issues the request, and it goes through the DRAS X governor which will verify it and send it to PU and the PU governor for the state information update. PU will issue commands to DRAS Y, and it will be verified by the PU governor which knows that the contingency is to be mitigated by issuing commands in area Y. However, LSA occurs in X. When DRAS X issues a malicious command, it will be captured by the DRAS X governor, and it is discarded because it knows that DRAS X issued a request to PU.
One of the limitations of the governor is that if an attacker performs an LSA attack first in the case of GLC before DRAS X issues a command to PU, the DRAS X governor will allow commands if they are safe for the system according to Rule 6. In any case, the governor will not allow commands that will destabilize the system. PU must anticipate future generation loss and send state information to DRASs so that they can take action quickly.
Attack 5 (X;Y;Y): GLC occurs in area X; the system responds in area Y where LSA occurs. PU issues a command to DRAS Y on the request of DRAS X, and they are verified by the PU governor. The DRAS Y governor verifies whether the commands (both malicious and legitimate) is required based on the signature of PU and whether it is safe for the local system.
Attack 6 (X;X,Y;X,Y): Suppose 20% GLC occurs in X, the systems responds in X,Y, and an adversary performs LSA in X,Y. DRAS X decides to perform 20% LS in X and requests PU to perform 10% LS in Y. In X, if an adversary adds Z% of extra LS commands, it will be verified by the DRAS X governor. Moreover, it will verify the request that is sent to PU and the PU governor. In Y, PU issues a command to DRAS Y through the PU governor. The PU governor will verify the percentage of the request based on its state information, and if an attacker performs an attack through DRAS Y, it will be verified by the DRAS Y governor since it knows how the exact percentage of load needs to be shed based on the state information received from the PU governor.
Critical Infrastructure Scenario. Suppose a generation loss occurs in area X where a critical infrastructure (such as a hospital) is present and DRAS X cannot supply enough power to the hospital by shedding load in just area X. In this case, it requests PU to perform shedding in one of the adjacent areas because it is necessary to supply power to the hospital. We assume that the hospital has already used its power backup storage and DRAS X does not have enough storage to satisfy hospital demand. PU performs load shedding in another area: area Y. If the percentage of the load to be shed is within the threshold limits, the governor will allow commands to go through according to Rule 2 and Rule 6. However, if it is more than the threshold limit, it will not be allowed. We need to update the rule to accommodate this edge case. In such a case, the governor will disconnect area X from the rest of the grid and perform load shedding so that over-frequency changes do not cascade to the rest of the grid. Therefore, it will be able to shed load and supply power to the hospital.
Reduce Load Shedding Attack. Suppose in DRAS 1 area, 20% of generation loss (32.6 MW) occurs, and in order to maintain frequency above the under-frequency threshold, DRAS 1 must send load shedding signals to reduce 30% of the load on bus 5. Since we have assumed that DRAS 1 has already been compromised, an adversary reduces the percentage of load shedding to be performed in the region in order to cause overloading. With the current governor rules, the governor cannot detect an attack, and it will allow commands to go through. We need to update the rule for this scenario. For the percentage of contingency, in reality, RTDS will simulate the minimum percentage of the load L(t) to be shed so that frequency is above the under-frequency threshold. In the safety rule, the governor checks whether the percentage of the load shed is within the lower bound L(t) and upper bound P(t). If yes, it will allow commands; otherwise, it notifies the SOC. Similarly, we can update rules for other DR functions.
8. Administrator Response
When malicious or unwanted commands are detected and stopped by the governor, it will notify a grid’s SOC so that the administrator can take certain steps to prevent the propagation of an attack to other parts of the system.
Although it depends on the state of the system and the type of attack detected by the governor, we provide general actions that can be implemented by the administrator. One of the options is to disconnect the impacted area from the rest of the grid so that attack cannot propagate to neighboring regions. Another method is to perform a periodic vulnerability assessment of the cyber system of that region in which an attack is detected by the governor to understand the vulnerability status and prioritize its cyber systems for patch management. Finally, resources, such as sufficient power storage, distributed renewable resources, etc., can be deployed in that region to provide power backup in the case of contingency. In the future, it will be important to focus on understanding what specific actions an administrator should take during various attacks detected by the governor and in the given state of the system.
9. Limitations
This study has some limitations in terms of what kind of attacks cannot be prevented by the governor, and potential new threats added to the grid. We assume system administrators follow and implement widespread security practices provided by the National Institute of Standards and Technology (NIST) [
34,
44] to secure smart grid cyber systems and communication channels.
Attacks not Prevented. The governor does not prevent Distributed Denial of Service (DDoS) attacks, false data injection attacks, and privacy attacks. An adversary can perform a DDoS attack on the communication infrastructure to prevent relevant load shedding commands to reach customers causing the frequency to drop beyond the under-frequency threshold. In the case of false data injection attacks, if an adversary modifies commands between DRAS governor to customers, the governor will not detect those changes since commands have already left the governor. If commands are modified anytime between PU to DRAS or from DRAS to DRAS governor, the governor will detect it. The question arises about what occurs when an attack occurs on the communication channel. For integrity attacks, security mechanisms (Hash Message Authentication Code (HMAC), digital signature) should be used to protect the data-in-transit and Secure Socket Layer (SSL)/Transport Layer Security (TLS) to protect the communication channel. These basic approaches to protect the network should be implemented in the system. For denial-of-service attacks, this is the limitation of this approach. If all the bandwidth is consumed by the attack traffic, it would be difficult for the governor system to perform its operation. If the governor system is not responsive due to an attack, then the system should fail-safe to a state in which cyber–physical commands cannot be exploited. For example, the system may halt all “smart” functionalities like DR and remote disconnect and fall back to traditional operations like load shedding. We understand that this fail-safe mechanism could be an attack path to halt smart functionalities, however, this case demonstrates the importance of protecting the governor system itself.
Potential Threats Added. Potential threats are added when a governor is compromised by an adversary. There will be no point of verification, and all malicious commands will be executed in the system. The governor can be used to make a malicious request to PU. Moreover, a malicious governor can send incorrect information to the PU governor which will make use of this information in making further decisions for different areas. Therefore, we need to protect the governor from becoming compromised, and we describe some measures in
Section 10.
General Limitations. We used the WSCC IEEE 9-bus model to demonstrate attacks on the power system assuming attackers have already compromised the cyber system. The amplitude of the presented attacks may not reflect the real world scenarios but represents how attacks can be conducted on the physical system. Power engineers must simulate such scenarios with and without a governor considering the details of both cyber and power systems. Moreover, we do not consider power storage, such as batteries used by the utility, to satisfy demand in the case of generation loss in some areas.
10. Governor Protection
The following question arises: what if a governor is compromised? The governor is based on the concept of the security reference monitor that cannot be by-passed or altered. Therefore, we need to protect the governor from becoming compromised.
The governor should be implemented with trusted platform module so that nobody can tamper with the governor server. The set of rules that the governor implements must either be physically installed on the device or must use Virtual Private Network (VPN) to connect to the device to perform an update. It should be updated at regular intervals to avoid any vulnerabilities. In no case is a governor allowed to communicate with any other device. The system to control governors must be separate from DRAS and PU, so that the governor system can independently perform its functions if they are compromised.
The governor must have designated ports to accept the state information from aggregators, power units, and other PU governor. It does not communicate on any other port and discards all unknown connections. In the case of detection of contingency it, it will notify the SOC center about the irrelevant commands. To provide scalability and fault tolerance, multiple replica servers of the governor system should be implemented. The scalability is important to verify a large number of commands at the DRAS governor. The discussion regarding means to update software in multiple replicas is beyond the scope of this paper.
11. Conclusions and Future Work
We presented an intelligent governor system to prevent attacks on a smart grid, even when a cyber system is already compromised, and empirically demonstrated the effectiveness of the approach by designing the governor system for DR functionality of the grid. The DR governor prevents attacks that are originated from the compromised DRAS or PU and tries to manipulate the power demand–supply. The governor verifies the requirement and safety policy of all commands that are issued from PU and DRAS. We show how the DR governor prevents attacks that destabilize the grid or increase the cost of the administrator in terms of customer dissatisfaction, attacks that are targeted on the circuit breakers, and DER units. Through the governor, it is possible to prevent attacks where commands are issued from a compromised cyber domain that is responsible for controlling functionality, and end devices are not directly controlled.
Moreover, we discuss where to place the governor in relation to where it receives the state information, how it computes the safety policy, and how rules are applied. We recommend power engineers to carefully choose the Z value based on their learning of the system over time so that the governor should at least allow a relevant percentage of commands to pass through so that system is in a stable state. It is important to have a little more load drop where there is generation loss so that it prevents generator overloading. We hope our work educates power engineers regarding how to implement such a system in a smart grid in order to make it more secure and resilient against CPAs. This work sheds light upon how higher-level functions are protected by analyzing the cyber and physical aspects of a system. Future work should focus on extending and demonstrating the functionality of the governor to protect different higher-level functions of the grid. Moreover, we would like to apply the concept of the governor to other cyber–physical systems such as autonomous cars [
48,
49,
50,
51]. It would be interesting to see how it can be applied to such an autonomous system where a feedback loop mechanism is required to make sure commands that are executed by the controller are required and safe for the local system. Another possible application for governor systems that we will consider for future work is gas and oil pipelines.


