1. Introduction
Italy is the country with the highest number of cultural heritage structures in the world. As well as the fifty-three UNESCO World Heritage Sites, the official online database “Vincoli in rete” (VIR) [
1], launched in 2012 by the Italian government and currently under development, reports more than 12,000 archaeological sites and monuments, as well as about 200,000 architectural heritage properties distributed all over the country.
One of the main issues concerning the Italian cultural heritage is definitely its seismic risk. The most valuable buildings are often located in medium–high hazard territories that, even recently, have been shaken by severe earthquakes able to produce catastrophic damage scenarios. Among these, the 2009 L’Aquila [
2,
3,
4], the 2012 Emilia [
5], and the 2016 Central Italy earthquakes [
6] are certainly worth mentioning.
Moreover, these buildings were built without any type of design regulation and present significant sources of vulnerability, often exacerbated by the various transformations that have occurred over the centuries [
7,
8,
9,
10].
In addition to the fact that some of these buildings often host a high number of people, they present a high architectonic value and contain precious artworks that need to be protected in order to avoid irremediable losses.
Among these buildings, a large proportion of the immovable Italian cultural heritage is made of fortified architecture. Indeed, more than 3800 castles, 1000 fortresses, and 4400 towers are currently listed in the VIR database, but, according to other unofficial statistics, there are more than 20,000 fortified properties in the country. Indeed, fortified constructions represent a significant part of the national architectural heritage and need to be analyzed as a particular class of construction from the seismic vulnerability standpoint.
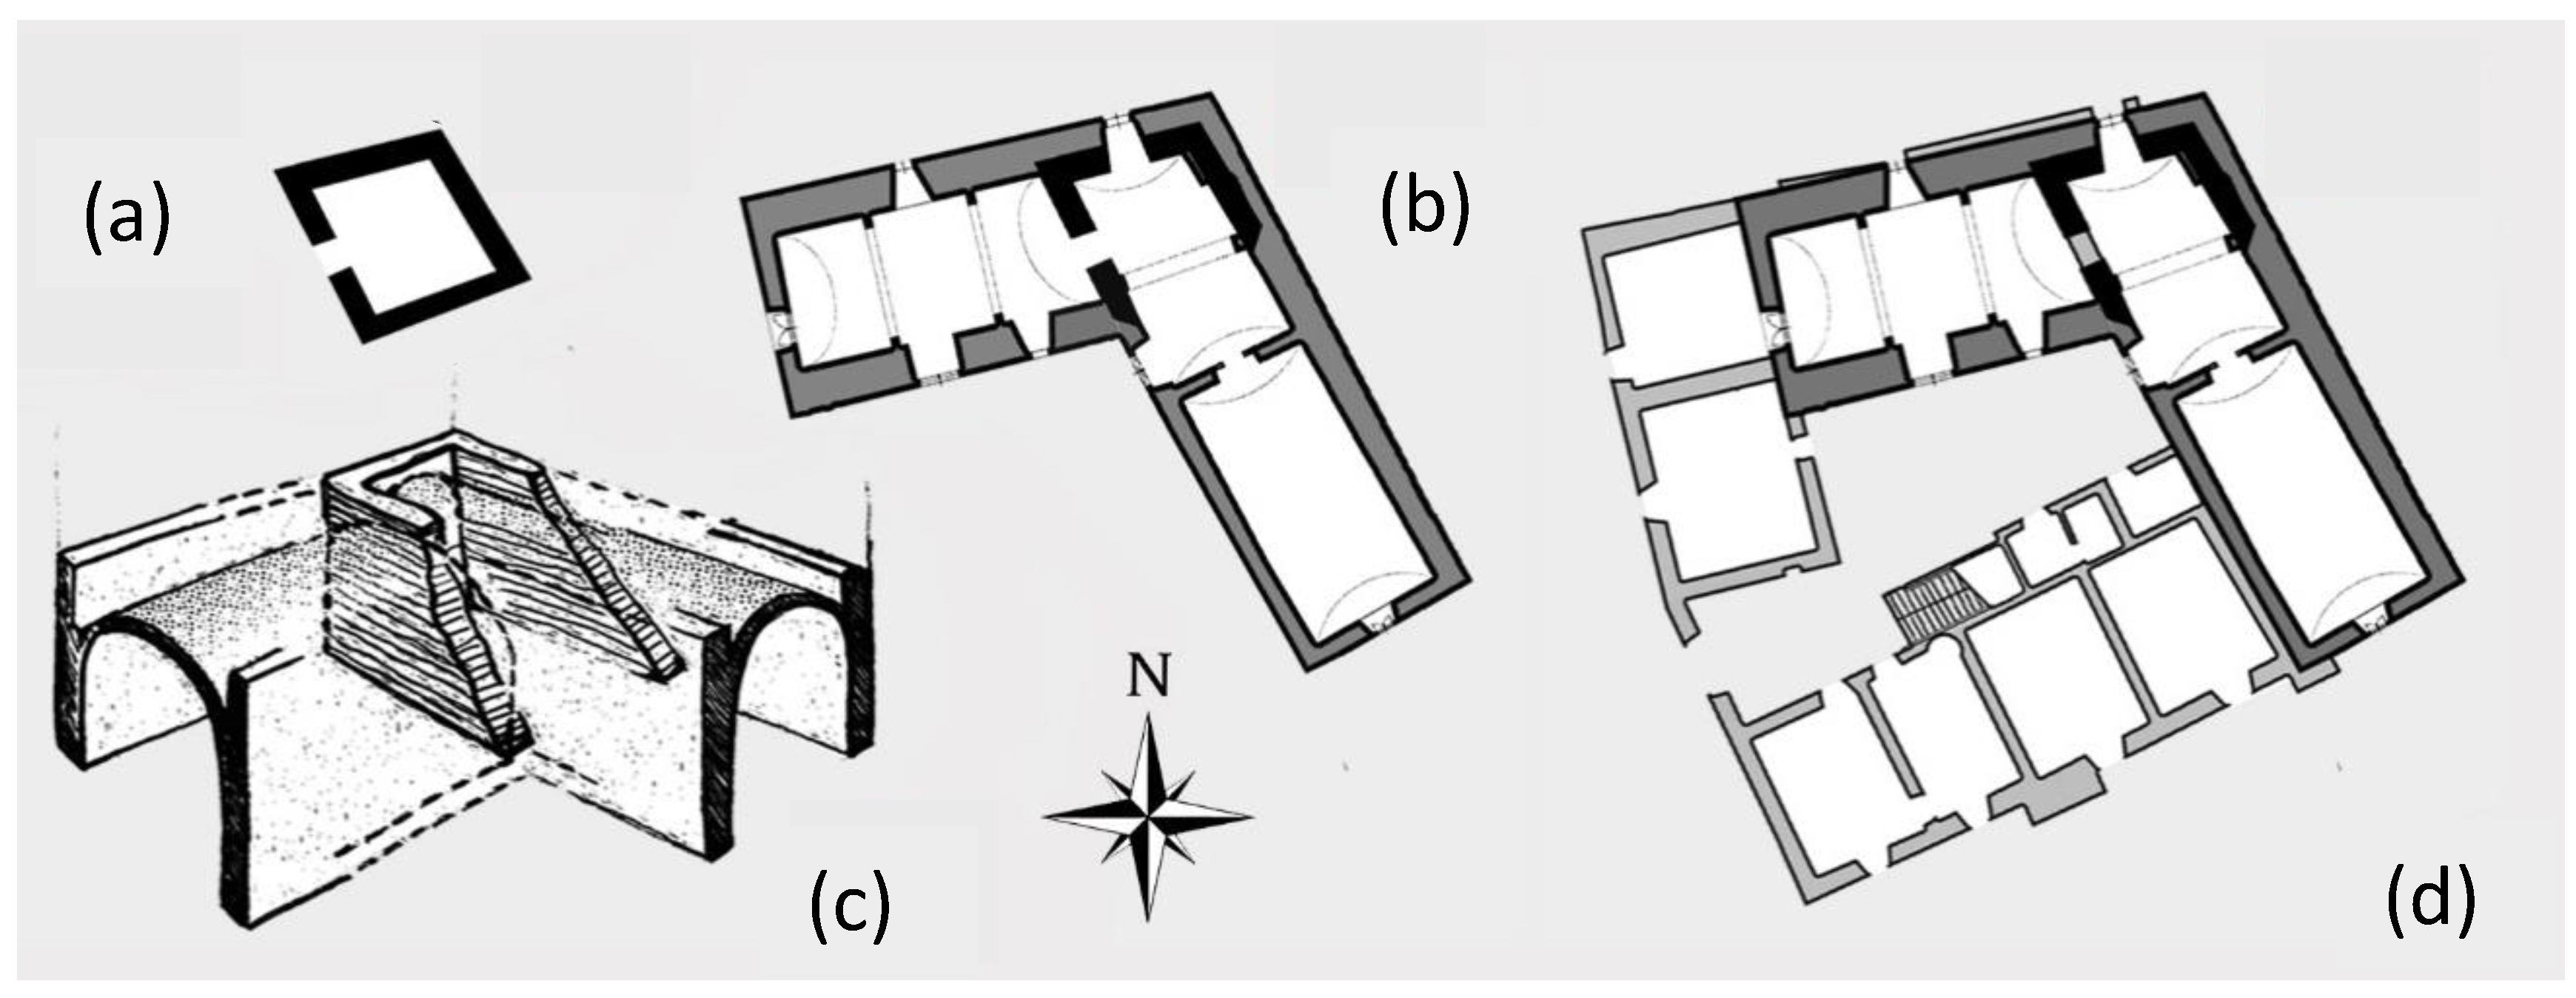
Castles and fortress were generally built for residential and/or military purposes and are characterized by massive structures conceived for defensive purposes. Nowadays, large parts of the existing castles are the results of manipulations carried out over the centuries to adapt them to residential functions [
11]. Consequently, many transformations can be observed in the internal spatial distribution and, most of all, in the opening position.
According to recent studies [
12,
13], the seismic vulnerability of castles and fortresses depends not only on the in-plane and out-of-plane capacity of the masonry walls, floors, and vaults, as for ordinary buildings, but it is also affected by the non-regularities, both in plane and in elevation, the corner positions of the towers—which are often not continuous and not aligned with the perimeter walls—and the different heights and slenderness of the curtain walls. In addition, their seismic capacity is also affected by the behavior of specific elements, for instance merlons, corbels, and outstanding elements such as spires that must be carefully evaluated [
14]. Cattari et al. [
13] found that the most recurrent fragilities are related to (i) the tower-to-perimeter wall interactions; (ii) the behavior of the main body of the tower (i.e., at the base of the tower due to combined compressive and bending cracks); (iii) in-plane and out-of-plane failures of the tops of towers, (e.g., flexural or shear cracks in the merlons, overturning of the merlons, mechanisms affecting the bell gable piers, etc.); and (iv) damage mechanisms involving the roof (e.g., due to the roof thrust in the tower corners).
As a matter of fact, the seismic behavior of castles is characterized by local collapse mechanisms rather than global failures and their detection is not straightforward.
Among the different methods and modeling approaches for the assessment of historic constructions subjected to seismic actions [
15,
16,
17,
18,
19,
20,
21,
22,
23,
24,
25,
26,
27], this study focused on force-based assessment (FBA) and computational RBLA [
28,
29,
30,
31,
32].
FBA is the verification approach chosen by the majority of codes in most countries, and also chosen by practitioners [
29]. FBA approaches analyze the equilibrium condition of a given failure mechanism at the onset of motion to find the value of the collapse load multiplier and the corresponding ground acceleration associated with its activation. For this reason, FBA is also described as linear kinematic analysis in several technical standards and scientific papers (e.g., Reference [
22]). The FBA procedure works as follows: for a given masonry assemblage subjected to gravity and seismic loads, the first step is to identify all the potential collapse mechanisms likely induced by lateral loads (e.g., the overturning or vertical bending of a façade, the corner overturning etc.). Each collapse mechanism is then usually idealized into an assemblage of rigid blocks that interact with each other at their contact interfaces, under the assumption of infinite compressive strength and no-tension, frictional interfaces. Each rigid block is then subjected to vertical downward forces, which represent the permanent and variable vertical loads, and to a lateral load that is expressed as the product of the vertical forces and of the unknown collapse multiplier. The latter is calculated by analyzing the equilibrium condition of the failure mechanism, e.g., using simple analytical models which stem from the application of classic theorems of limit analysis and, in general, from the application of the virtual work principle. Collapse load multipliers are then used to evaluate the ground acceleration that activates the mechanism, as discussed in detail in
Section 3. It is worth noting that a crucial aspect of FBA is the proper identification of all the potential collapse mechanisms and their individual calculation according to linear kinematic analysis. The final goal of FBA is to find the most vulnerable collapse mechanism among them all, which is the one characterized by the lowest value of ground acceleration. According to the current practices [
22,
29,
33], the analyst defines a priori a set of potential collapse mechanisms according to his own expert judgement and the damage observed after seismic events of the past, as well as on the basis of the behavior of similar constructions during earthquakes (i.e., referring to a consolidated abacus of damage). Indeed, subjective judgment plays an important role in the whole evaluation process and this is a critical aspect of the current practice when analytical formulations are adopted, which might limit the application, especially in the case of non-standard construction with complex three-dimensional assets.
Conversely, the approach adopted in this study relies on the automatic detection of the potential collapse mechanisms of a masonry construction. To this end, we used the in-house software code LiABlock_3D [
34], which is based on the rigid block modeling approach for the linear kinematic analysis of three-dimensional masonry structures. The software was validated in previous studies [
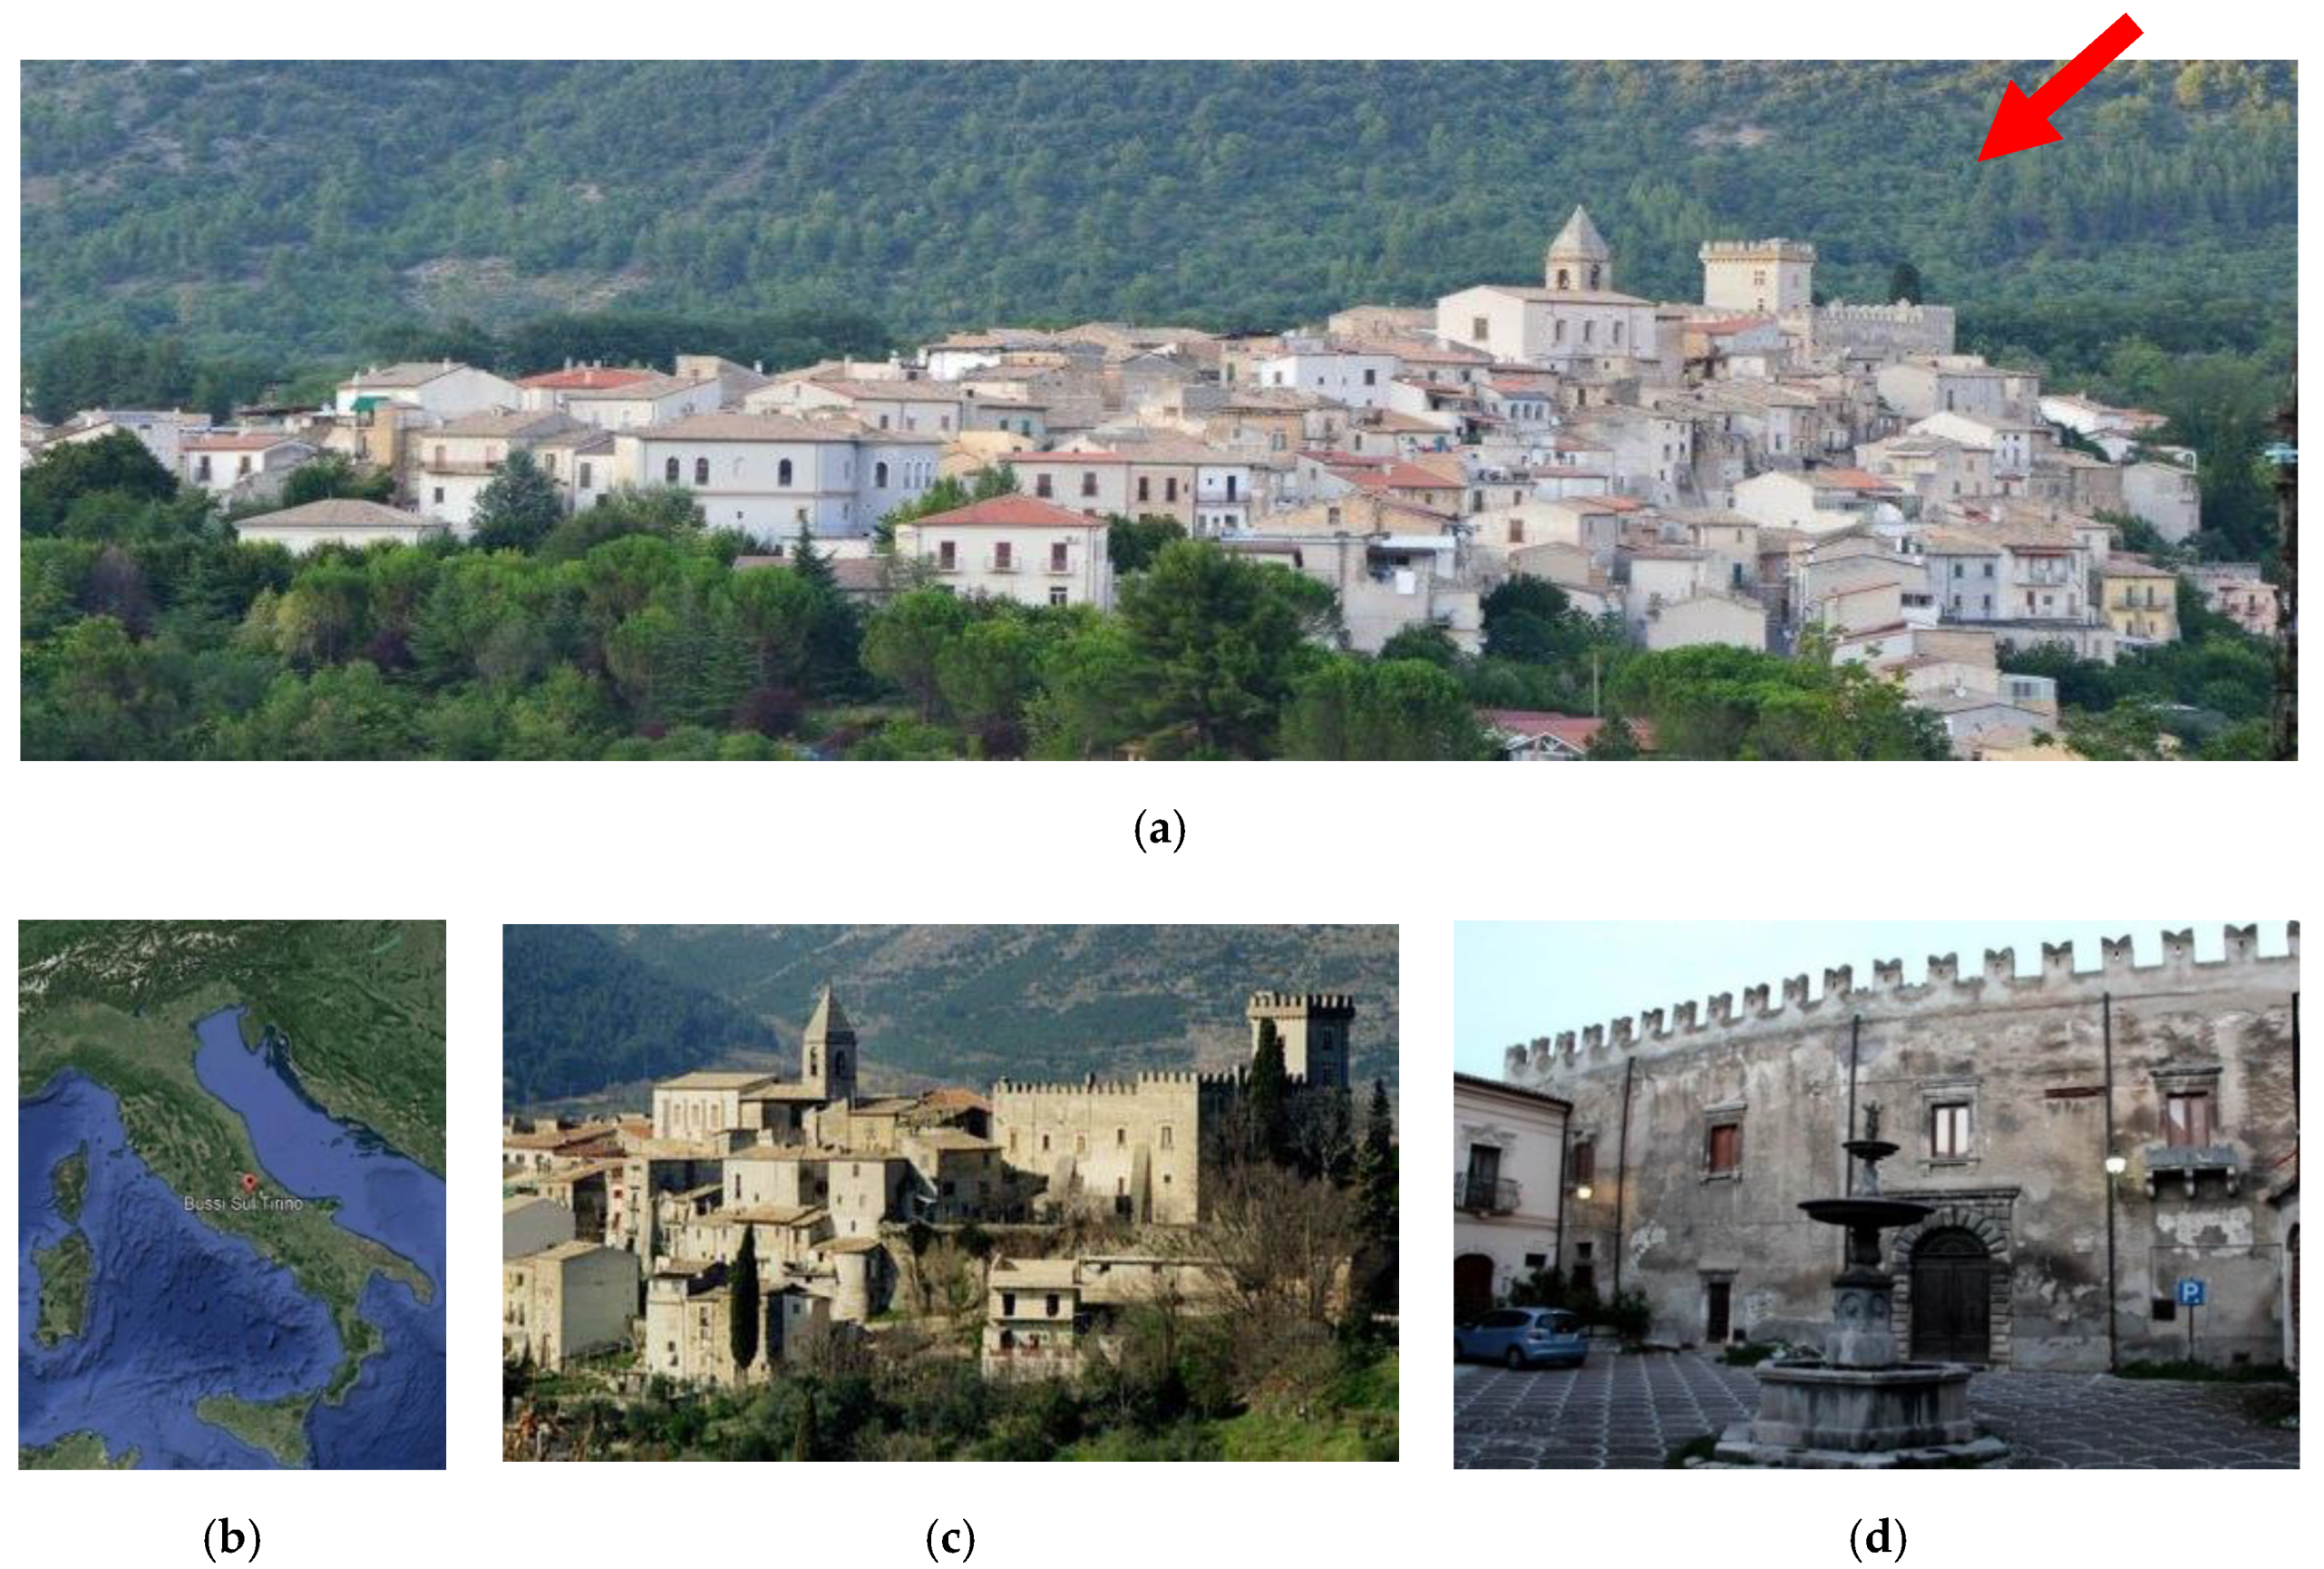
35,
36,
37], and was herein applied to an entire structural unit of a historic construction, the castle of Bussi sul Tirino (Abruzzo, Italy).
The main goals were to explore to what extent numerical rigid block models can be conveniently used to identify the most important fragilities of historic masonry constructions, to evaluate the effectiveness of the structural interventions, and to provide a solid basis for the selection of the optimal retrofitting solution according to the minimum intervention principle.
It is worth noting that the major advantages of the proposed approach and software code compared are (i) the use of few input data to build the numerical model—essentially related to the geometry of the construction and few properties of the material; (ii) the possibility of reproducing specific features of the construction, as for any kind of discrete model, e.g., the bonding condition of orthogonal walls, the recesses in the walls, and others; (iii) the automatic detection of collapse mechanisms that are not defined a priori, but rather are the results of numerical analysis; (iv) the possibility of identifying very complex mechanisms, which simultaneously may involve in-plane and out-of-plane collapses, triggering the failure of large parts of the construction; (v) the computational efficiency of the software that, conversely to similar rigid-block-based models, has a low computational demand, which is recognized to be the main limitation for the large-scale employment of RBLA [
22].
Considering that the focus of the present study was also the quantitative evaluation of the effectiveness of interventions, a novelty introduced in the paper is the development of a specific module to calculate the participating mass ratio associated with the failure mechanisms and collapse load multiplier.
All this considered, the paper is arranged as follows. In
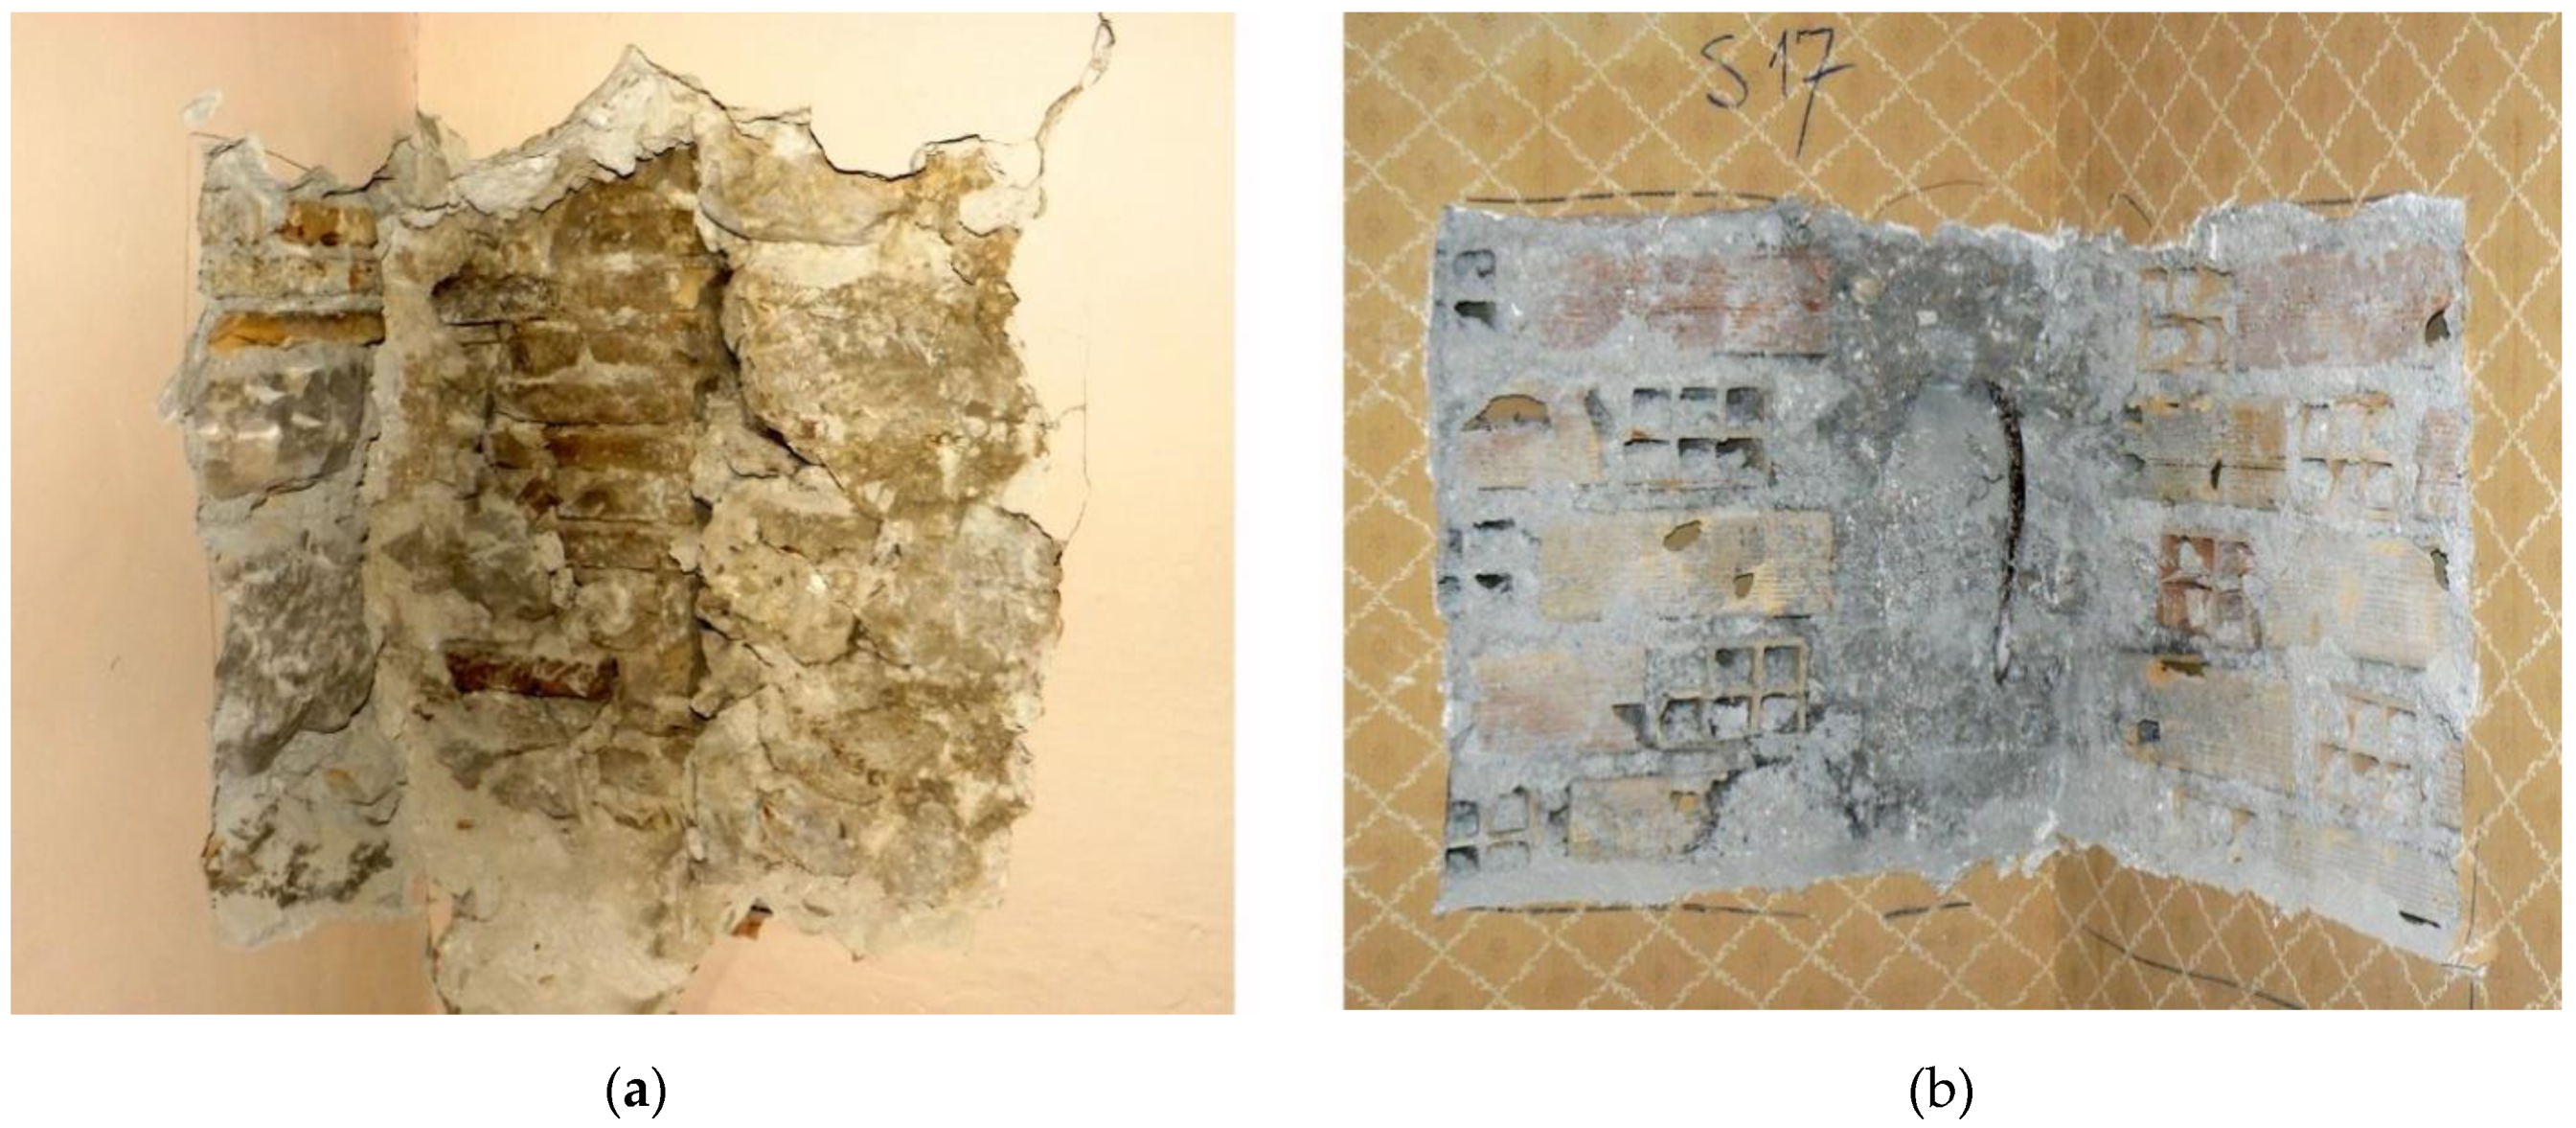
Section 2, the knowledge acquisition path for the castle is described. Historical analysis, an in situ survey, and the results of visual inspections and laboratory tests are reported. The transformations carried out through the centuries were clearly identified, together with the past and current damage due to seismic events that hit the castle, including recently. The information gained in this previous step was then used to set up a consistent and realistic numerical model of the structure under investigation.
Section 3 is devoted to an explanation of the implemented analysis techniques, with a detailed description of the potential that the LiABlock_3D software was able to offer, while
Section 4 presents the numerical model of a castle wing.
Section 5 describes the initial analysis that was carried out of the mechanisms involving the simplest macro-elements by implementing both the LiABlock_3D software and some hand-made calculations. Verification and sensitivity to the rigid block size were also confirmed. The software was then used, as described in
Section 6, to analyze mechanisms with a higher level of complexity and, based on the obtained results, the effectiveness of three possible retrofitting interventions was evaluated in terms of seismic safety indices.
3. Force-Based Assessment Using 3D Rigid Block Limit Analysis
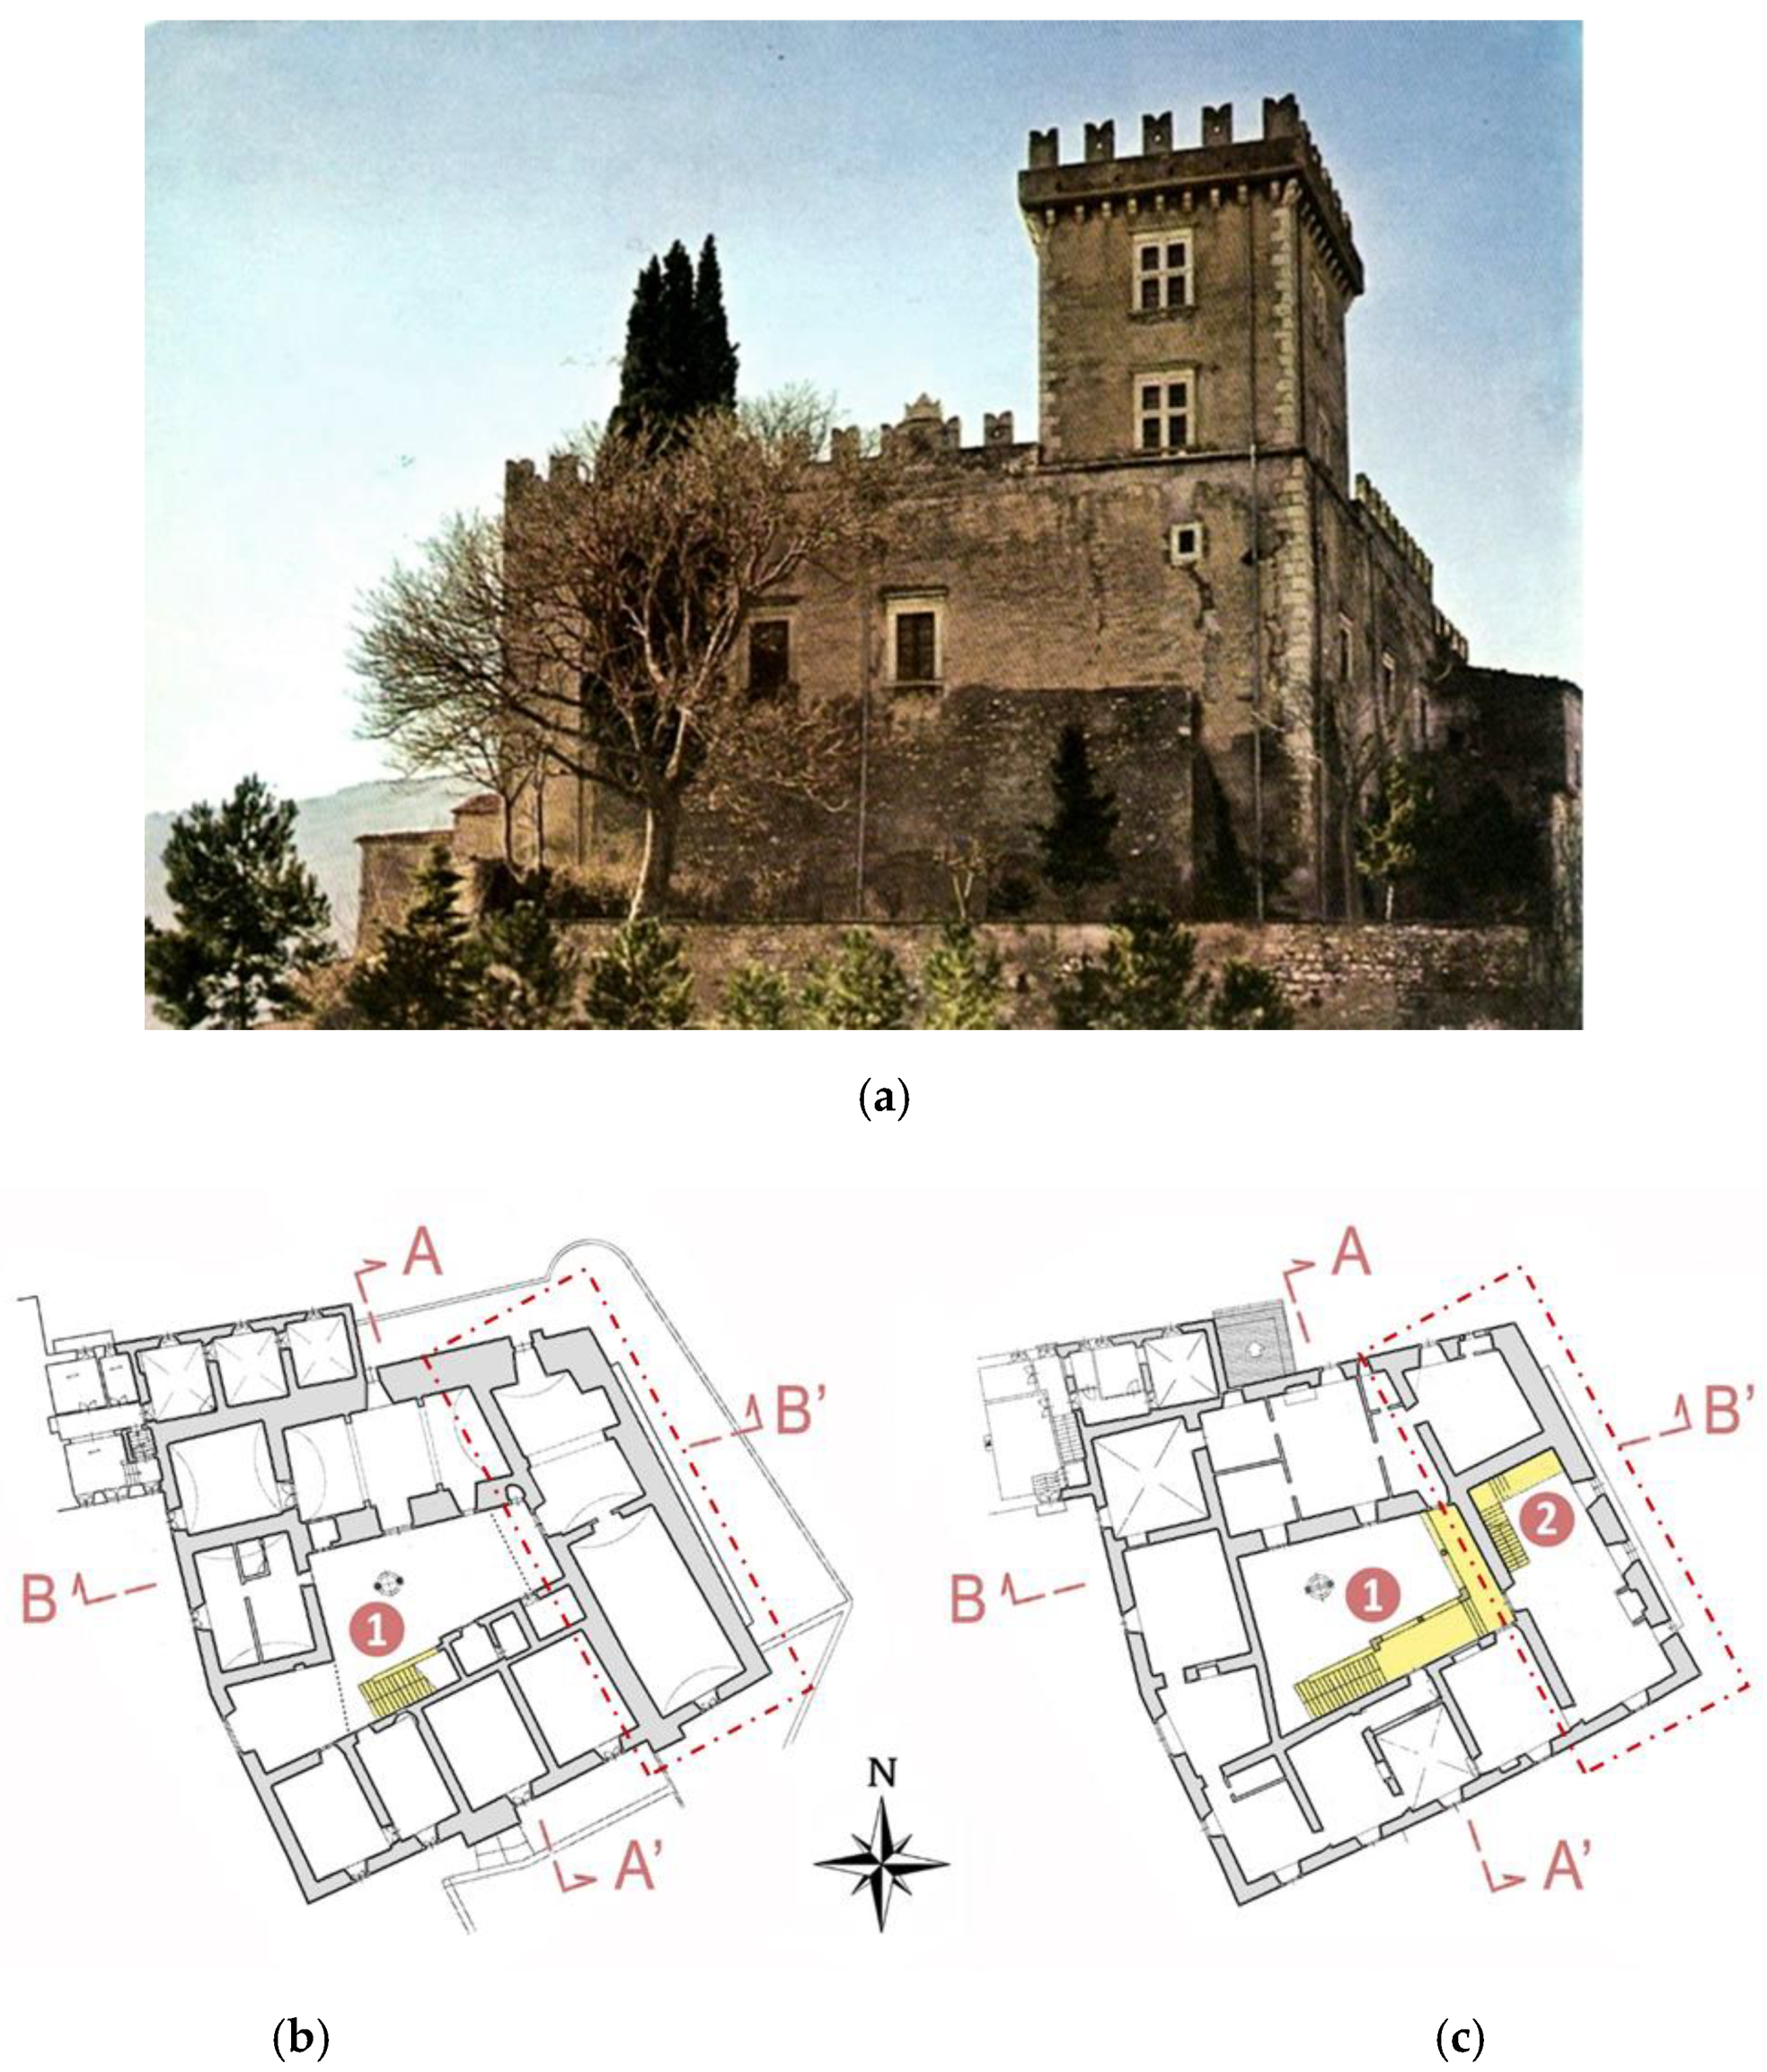
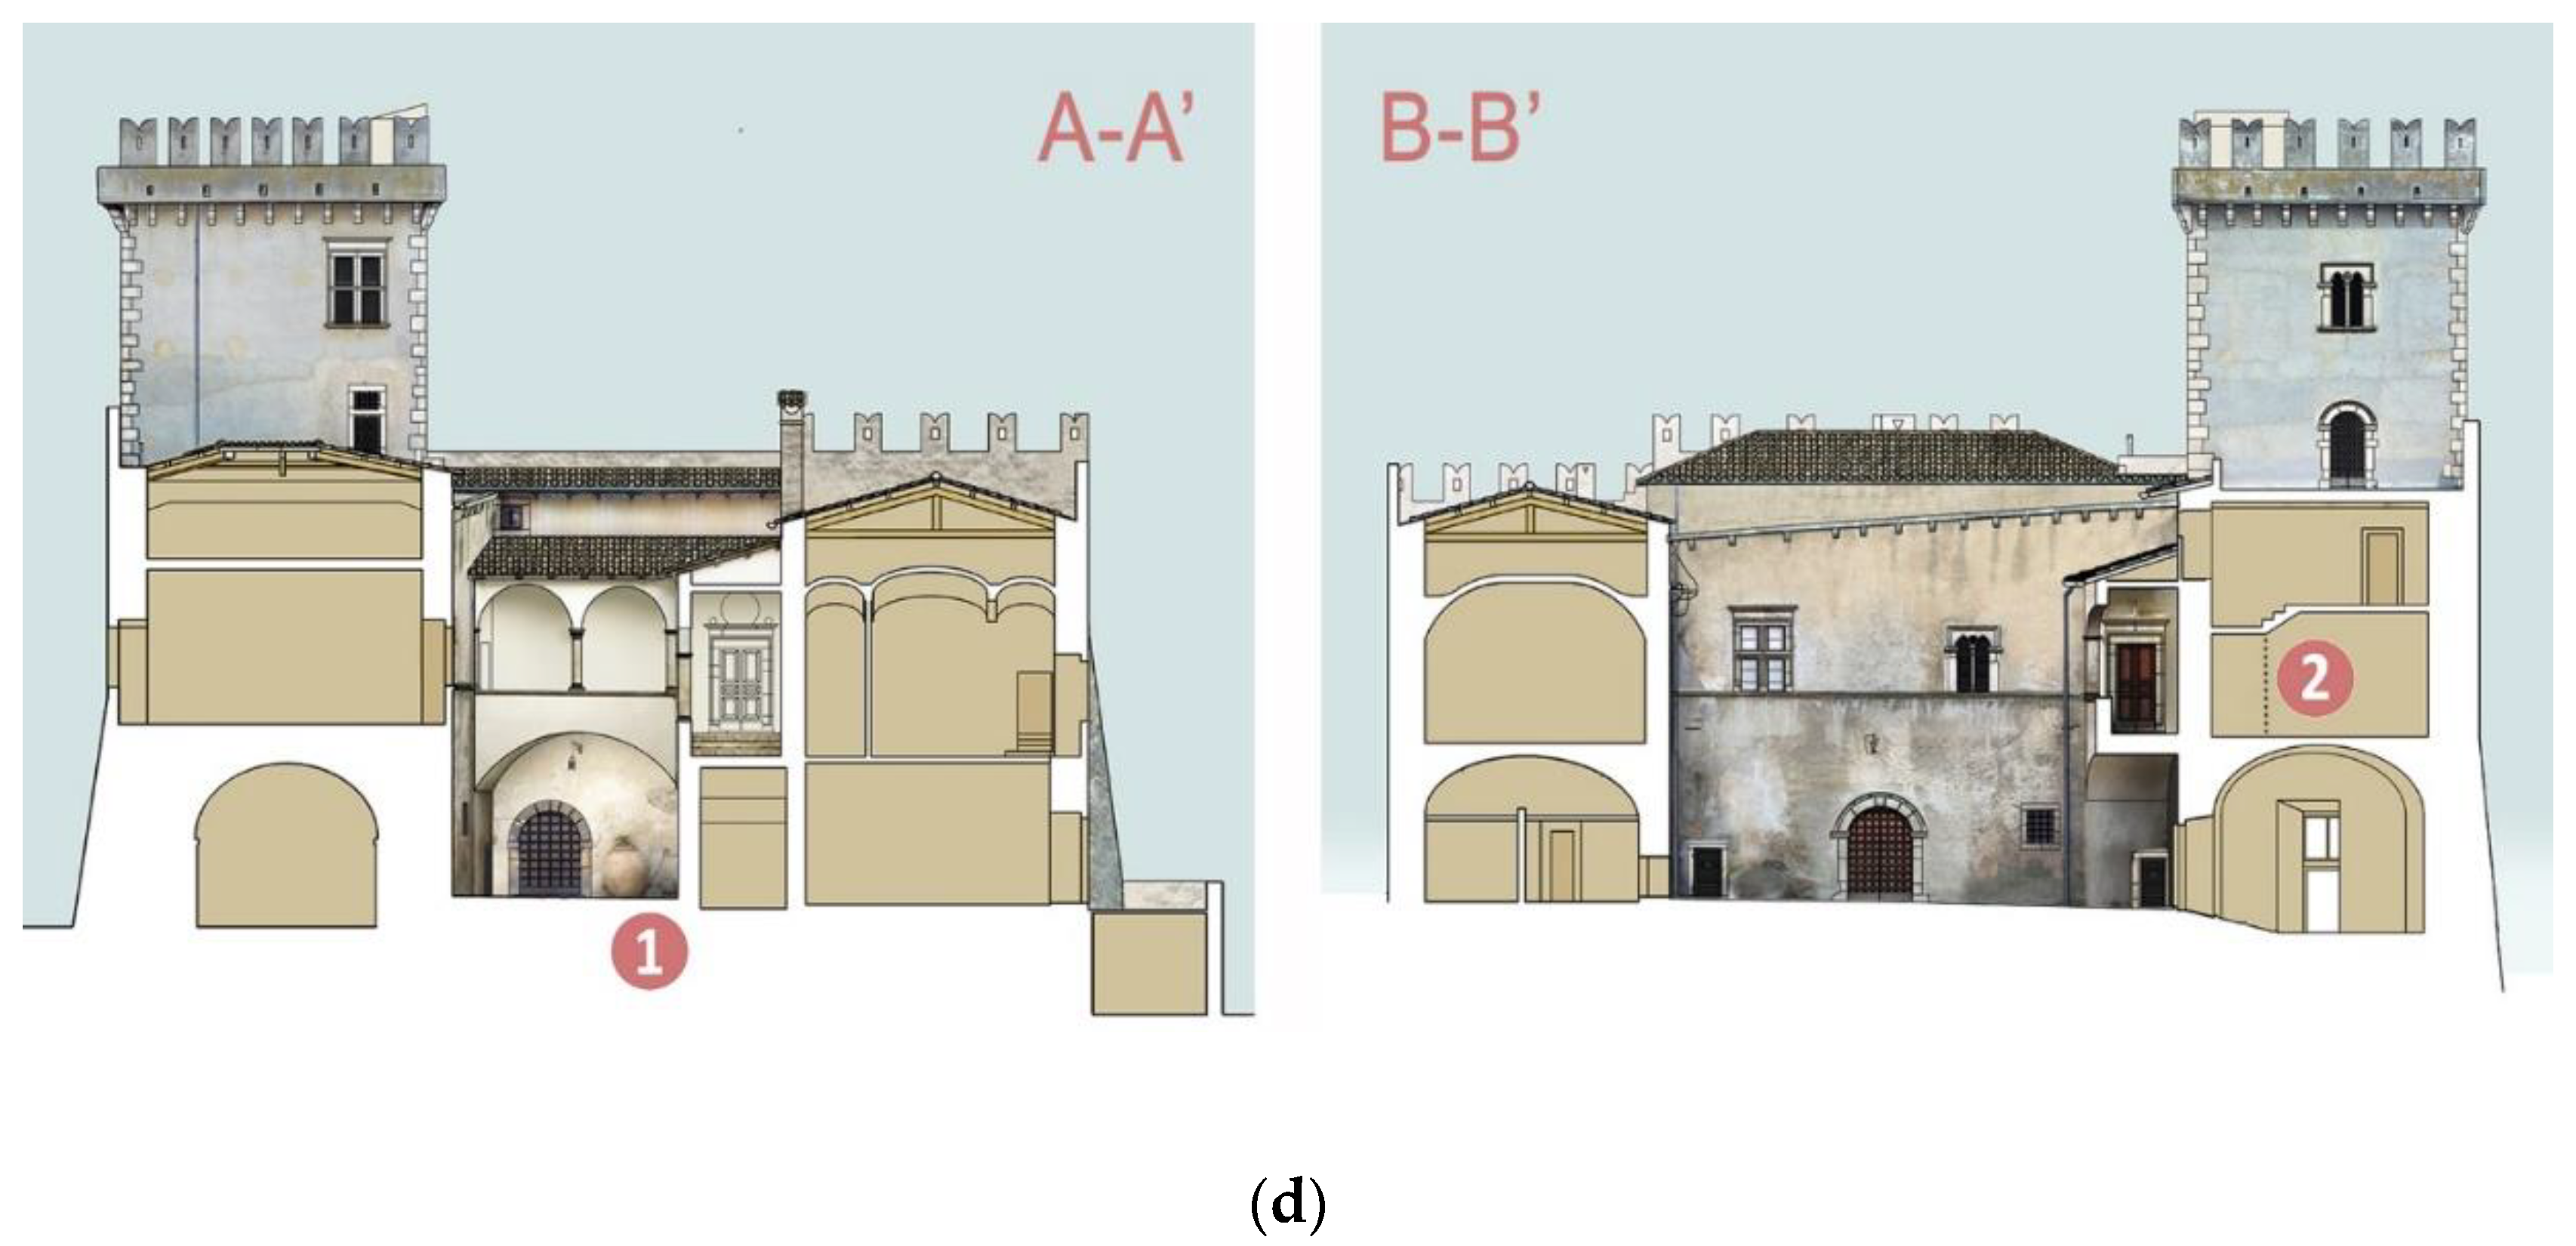
Following the historical analysis and the results of the in situ investigations, it was possible to ascertain that the whole castle is made of separate units that, apart from hammering phenomena, work autonomously. The seismic behaviors of these parts are primarily affected by local mechanisms that are usually triggered for very low levels of ground acceleration.
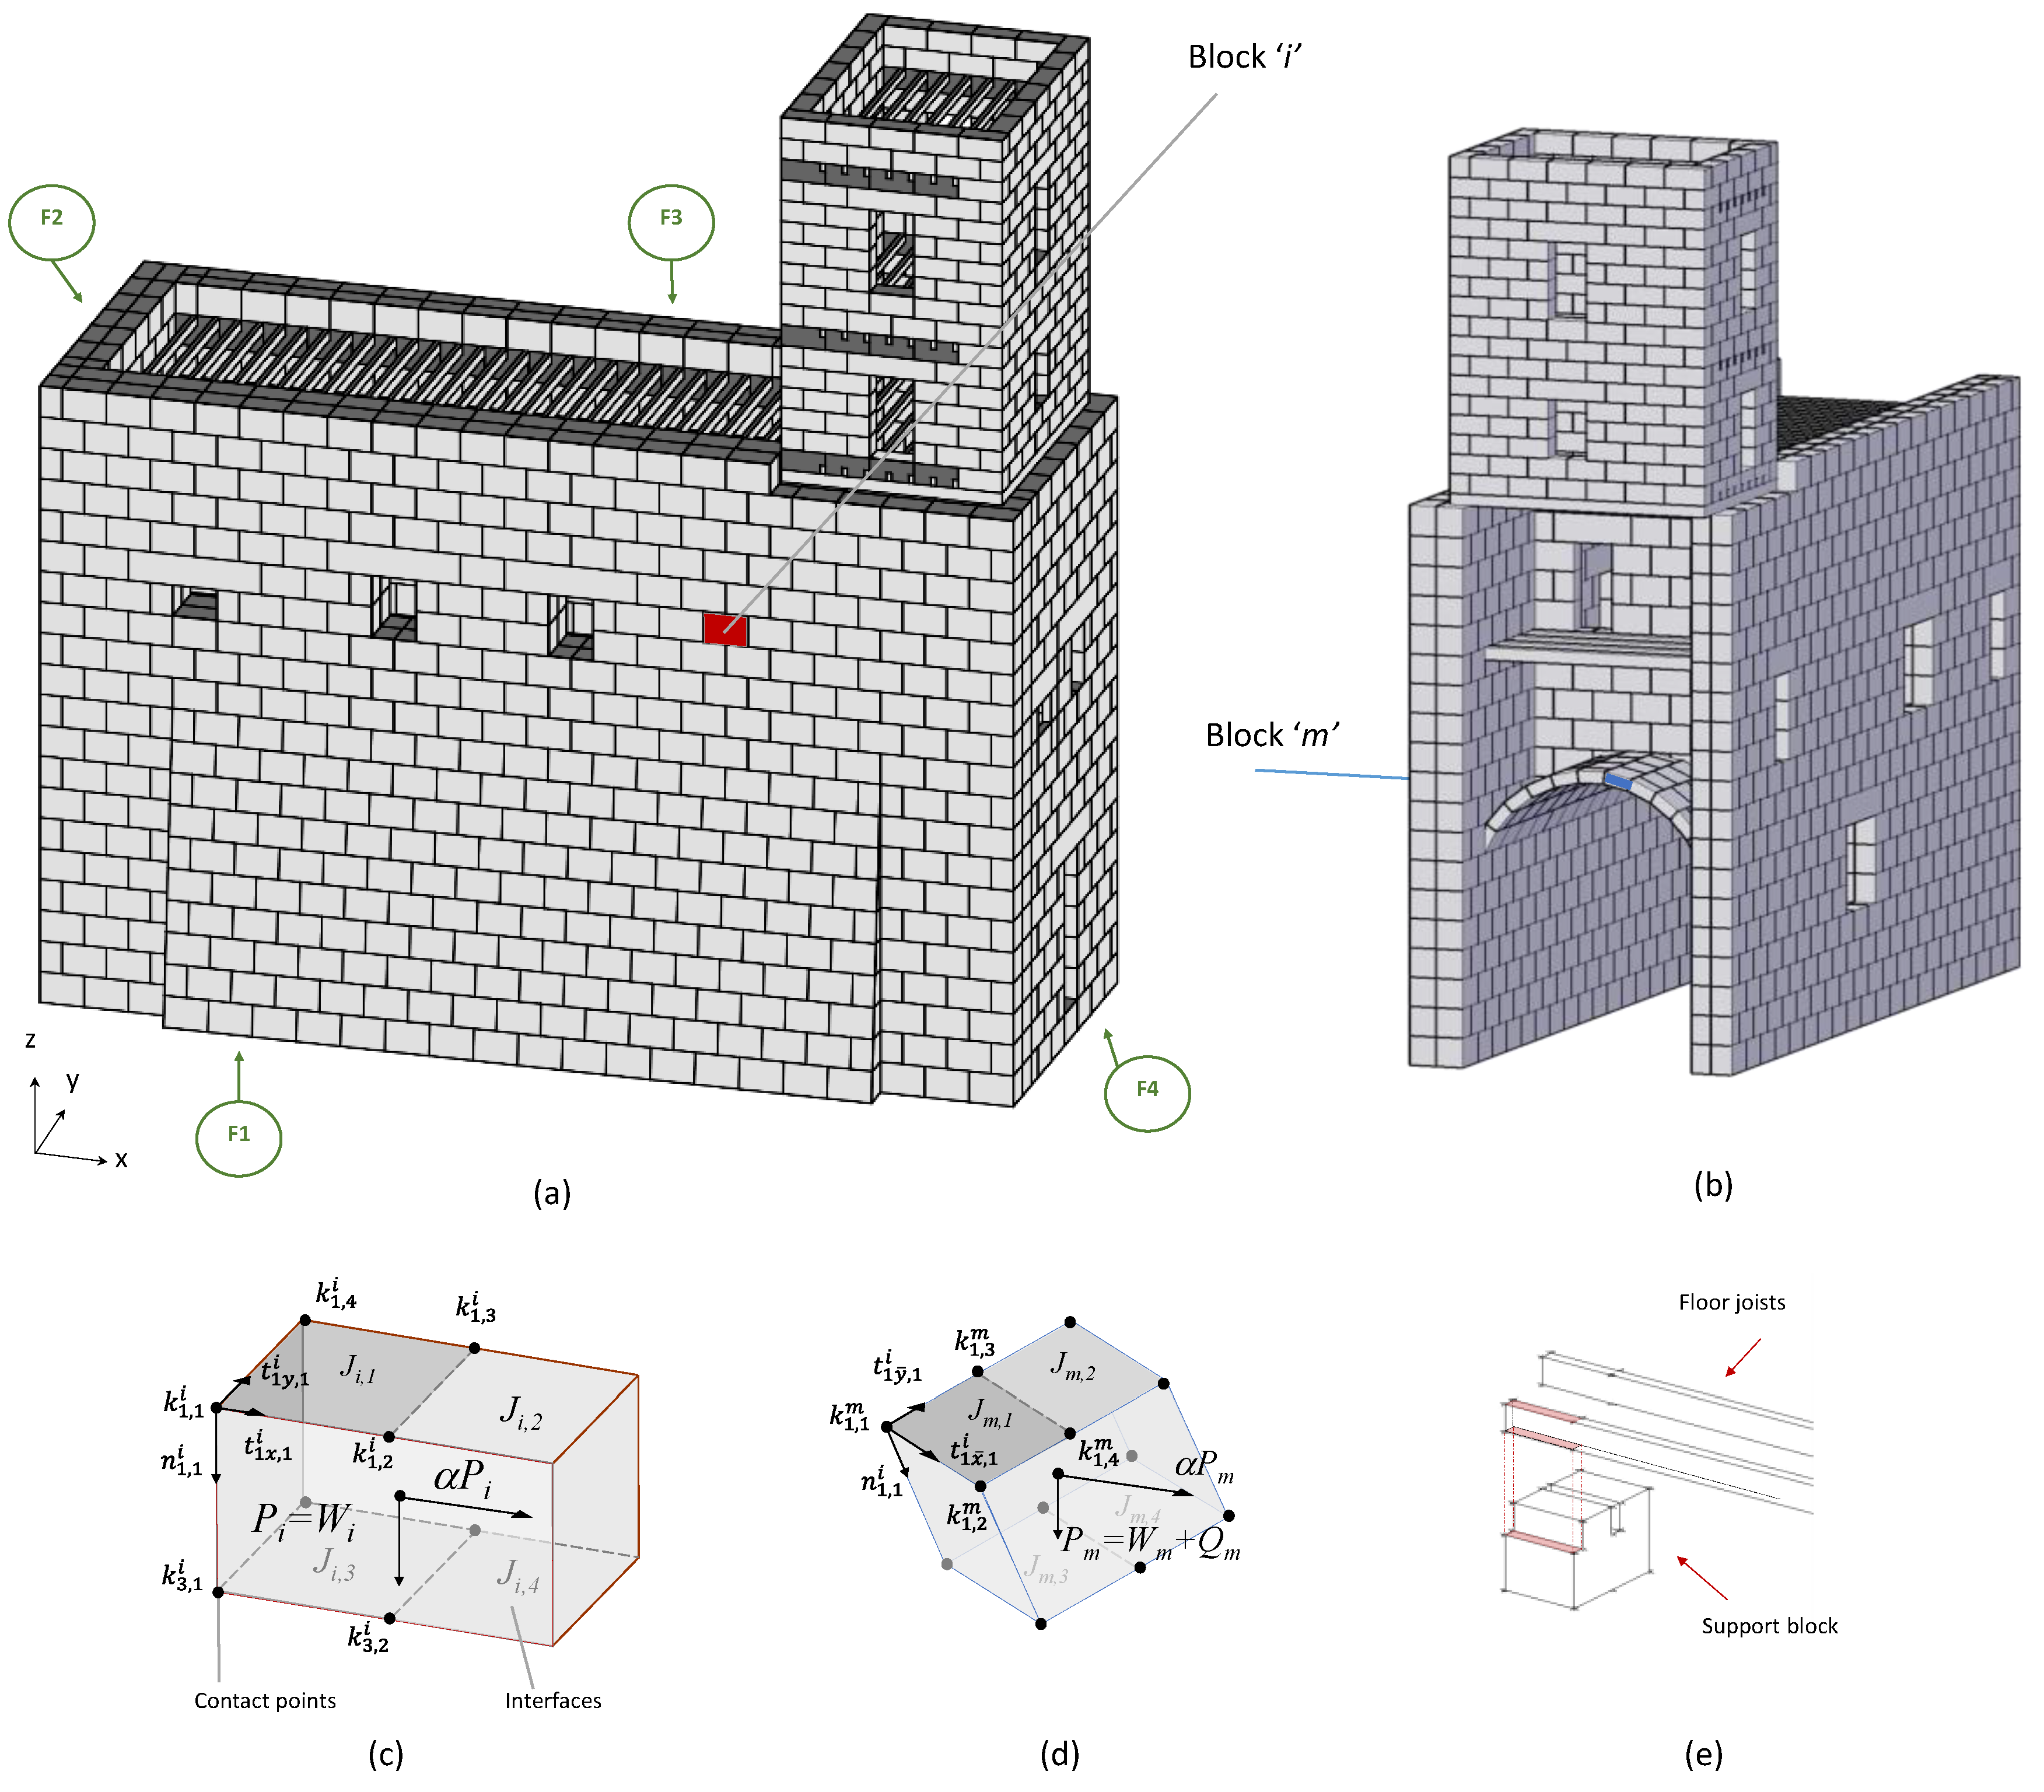
With this in the mind, the most important structural unit, namely the castle wing containing the main hall and the tower (see red mark in
Figure 4b,c), was analyzed using LiABlock_3D, an in-house software tool developed at the University of Naples for the structural analysis of masonry structures under variable loads and settlements [
34].
Within this framework, LiABlock_3D executes linear kinematic analysis of masonry structures represented by rigid blocks, which interact at polygonal contact interfaces. A no-tension friction behavior is assumed at contact interfaces. The inputs required to build the numerical model are the discretization of the 3D geometry of the construction and a few other mechanical parameters, namely the materials’ unit weights and the friction coefficients.
Thanks to the intrinsic features of discrete modeling, the numerical model reproduced the real bond pattern of masonry walls. As such, diatons and transversal connections between the walls, as well as the effect of iron ties could be easily introduced into the model where these existed.
As for the mathematical formulation behind LiABlock_3D, the software implements the lower-bound problem of limit analysis:
where
x is the vector of the internal static variables at contact interfaces;
A is the equilibrium matrix;
fD is the vector of dead loads that includes, by default, the self-weight
Wi of each rigid block applied at its centroid, other downward vertical loads
Qi (i.e., to consider the variable loads on floors, roof, etc.), and other permanent loads
Fi (e.g., to simulate the effect of a chain).
fL is the vector of live loads expressed as the sum of block self-weights
Wi and vertical loads
Qi.
C is the convex cone yield function matrix, which represents the failure conditions under the assumptions of (i) infinite compressive strength, (ii) tensionless behavior, and (iii) shear failure governed by a Coulomb-type criterion with isotropic friction and cohesionless behavior.
Live loads can be applied to the whole assemblage or to a selection of rigid blocks in any direction along the global coordinate axes. Live loads are multiplied by an unknown scalar multiplier α, the load factor that activates the local mechanism under investigation.
As for numerical analysis for seismic vulnerability assessment, live loads are usually applied to the whole assemblage of rigid blocks and a set of analyses is carried out to analyze both the in-plane and out-of-plane behaviors of the rigid block assemblage along the principal directions of the wall cross sections.
The output provided by the code are the plots of the collapse mechanisms and the corresponding load factors. Two different solutions are provided for each analysis: (i) an initial approximate solution, obtained in a very short time, under the simplified assumption of associative behavior, which involves dilatancy in sliding according to the normality rule, and (ii) a refined—more cumbersome—solution according to the non-associative sliding behavior that usually provides a lower, hence safer, load factor. Details about the theoretical background behind LiABlock_3D, and a more comprehensive discussion of the failure criteria, the loading conditions, the solution procedures, and comparison with similar tools are provided in Reference [
34].
Within the present study, a novel module of the software was developed to calculate the participating mass ratio
e* and the spectral acceleration
a0* activating the mechanism, starting from the formulation provided in Reference [
33], according to the following equations.
where
N is the number of blocks
k involved in the mechanism;
is the virtual displacement of the live loads
α(
Wk +
Qk) acting on the centroid of the block
k;
the non-associative collapse load multiplier given by LiABlock_3D;
FC is the confidence factor, herein equal to 1.35, as prescribed by Reference [
33] when the historical analysis of the building, the geometric survey, and limited in situ investigations were carried out.
In order to better stress the effects induced by the different applied retrofitting interventions, the results of the analysis were also compared in terms of seismic safety index
Iss defined in Reference [
32] as the ratio between the seismic capacity at the life safety limit state (
PGAcap) and the seismic demand (
PGAdem) defined by Equations (3)–(5).
where
is the spectral acceleration given by LiABlock_3D according to Equation (2);
q is the behavior factor equal to 2;
S is the soil category factor equal to 1 for stiff soils;
Se(
T1) the spectral acceleration for the elastic design;
ψ(
Z) the first mode of vibration factor, conventionally assumed to be equal to
Z/
H,
H being the building height above the ground and
Z the height at which the collapse mechanism is triggered; and
γ is the modal participation factor equal to 3
N/(2
N+1),
N being the number of floors.
Within this paper, the values of
q,
S,
ψ(
Z),
γ, and
T1 were calculated as in Reference [
33]. The values of the variable Z were easily obtained from the plot of each collapse mechanism given by the software. Indeed, it is the height between the ground and the course of the blocks that are located at the bottom of the failure mechanism. It is worth noting that LiABlock_3D easily returned the virtual displacements
δ(x,k) related to each collapse mechanism because, thanks to the adopted position for the limit analysis problem in terms of mathematical programming, kinematic variables were obtained directly from the Lagrange multipliers of the optimal solution to the static problem. Further details on this aspect can be found in Reference [
49].
4. Rigid Block Model of the Castle
A 3D discrete model, built in a CAD environment, was developed for the unit of the castle under investigation. The structural unit has a rectangular plan of 23 m × 7 m with a height of 15 m. The tower extends beyond the roof by 8 m. Starting from the three-dimensional drawings, the first step consisted of electing the relevant parts of the construction to be taken into account, in order to generate a response able to represent the real structural behavior. In the present case, a full model of the analyzed wing of the castle—including the multi-leaf walls, the barrel vaults at ground floor, and all the floors—was implemented.
A second important decision concerned the sizes and the shapes of the rigid blocks to be assumed for bricks, stones, lintels, voussoir elements, etc.
As for the sizes, rigid blocks were characterized by an average size three times larger than the average size of the real stones, which gave an acceptable compromise between the effectiveness of the model in capturing the actual structural behavior—for example in reproducing the exact crack patterns—and the computational costs of the analyses, as is addressed in more detail in the next section. From this perspective, some preliminary evaluations were carried out, proving that this dimensioning of rigid blocks allowed local failures to be reproduced in critical parts such as around the openings, at the vault support height, etc.
As far as the shape of the elements was concerned, the rigid blocks closely reproduced the shapes of the real stones, at a scale ratio of three to one. Rectangular and trapezoidal rigid blocks were defined to reproduce the different elements composing the numerical model (e.g., the regular stones, lintels, voussoirs, and timber joists of floors).
For the model of the studied castle, horizontal contacts for each block and vertical contacts separating adjacent leaves on the vertical plane were modeled. Other vertical contacts (e.g., vertical contacts in the thickness of the wall) were excluded from the analysis, considering that the benefit in terms of accuracy of results did not compensate for the higher computational costs produced by involving a larger number of variables. Indeed, previous studies [
49] revealed that the activation of all vertical contacts may lead to an overestimation of the collapse load multiplier, especially in the case of out-of-plane failures. Thus, in the interests of safety, they were excluded from the current model.
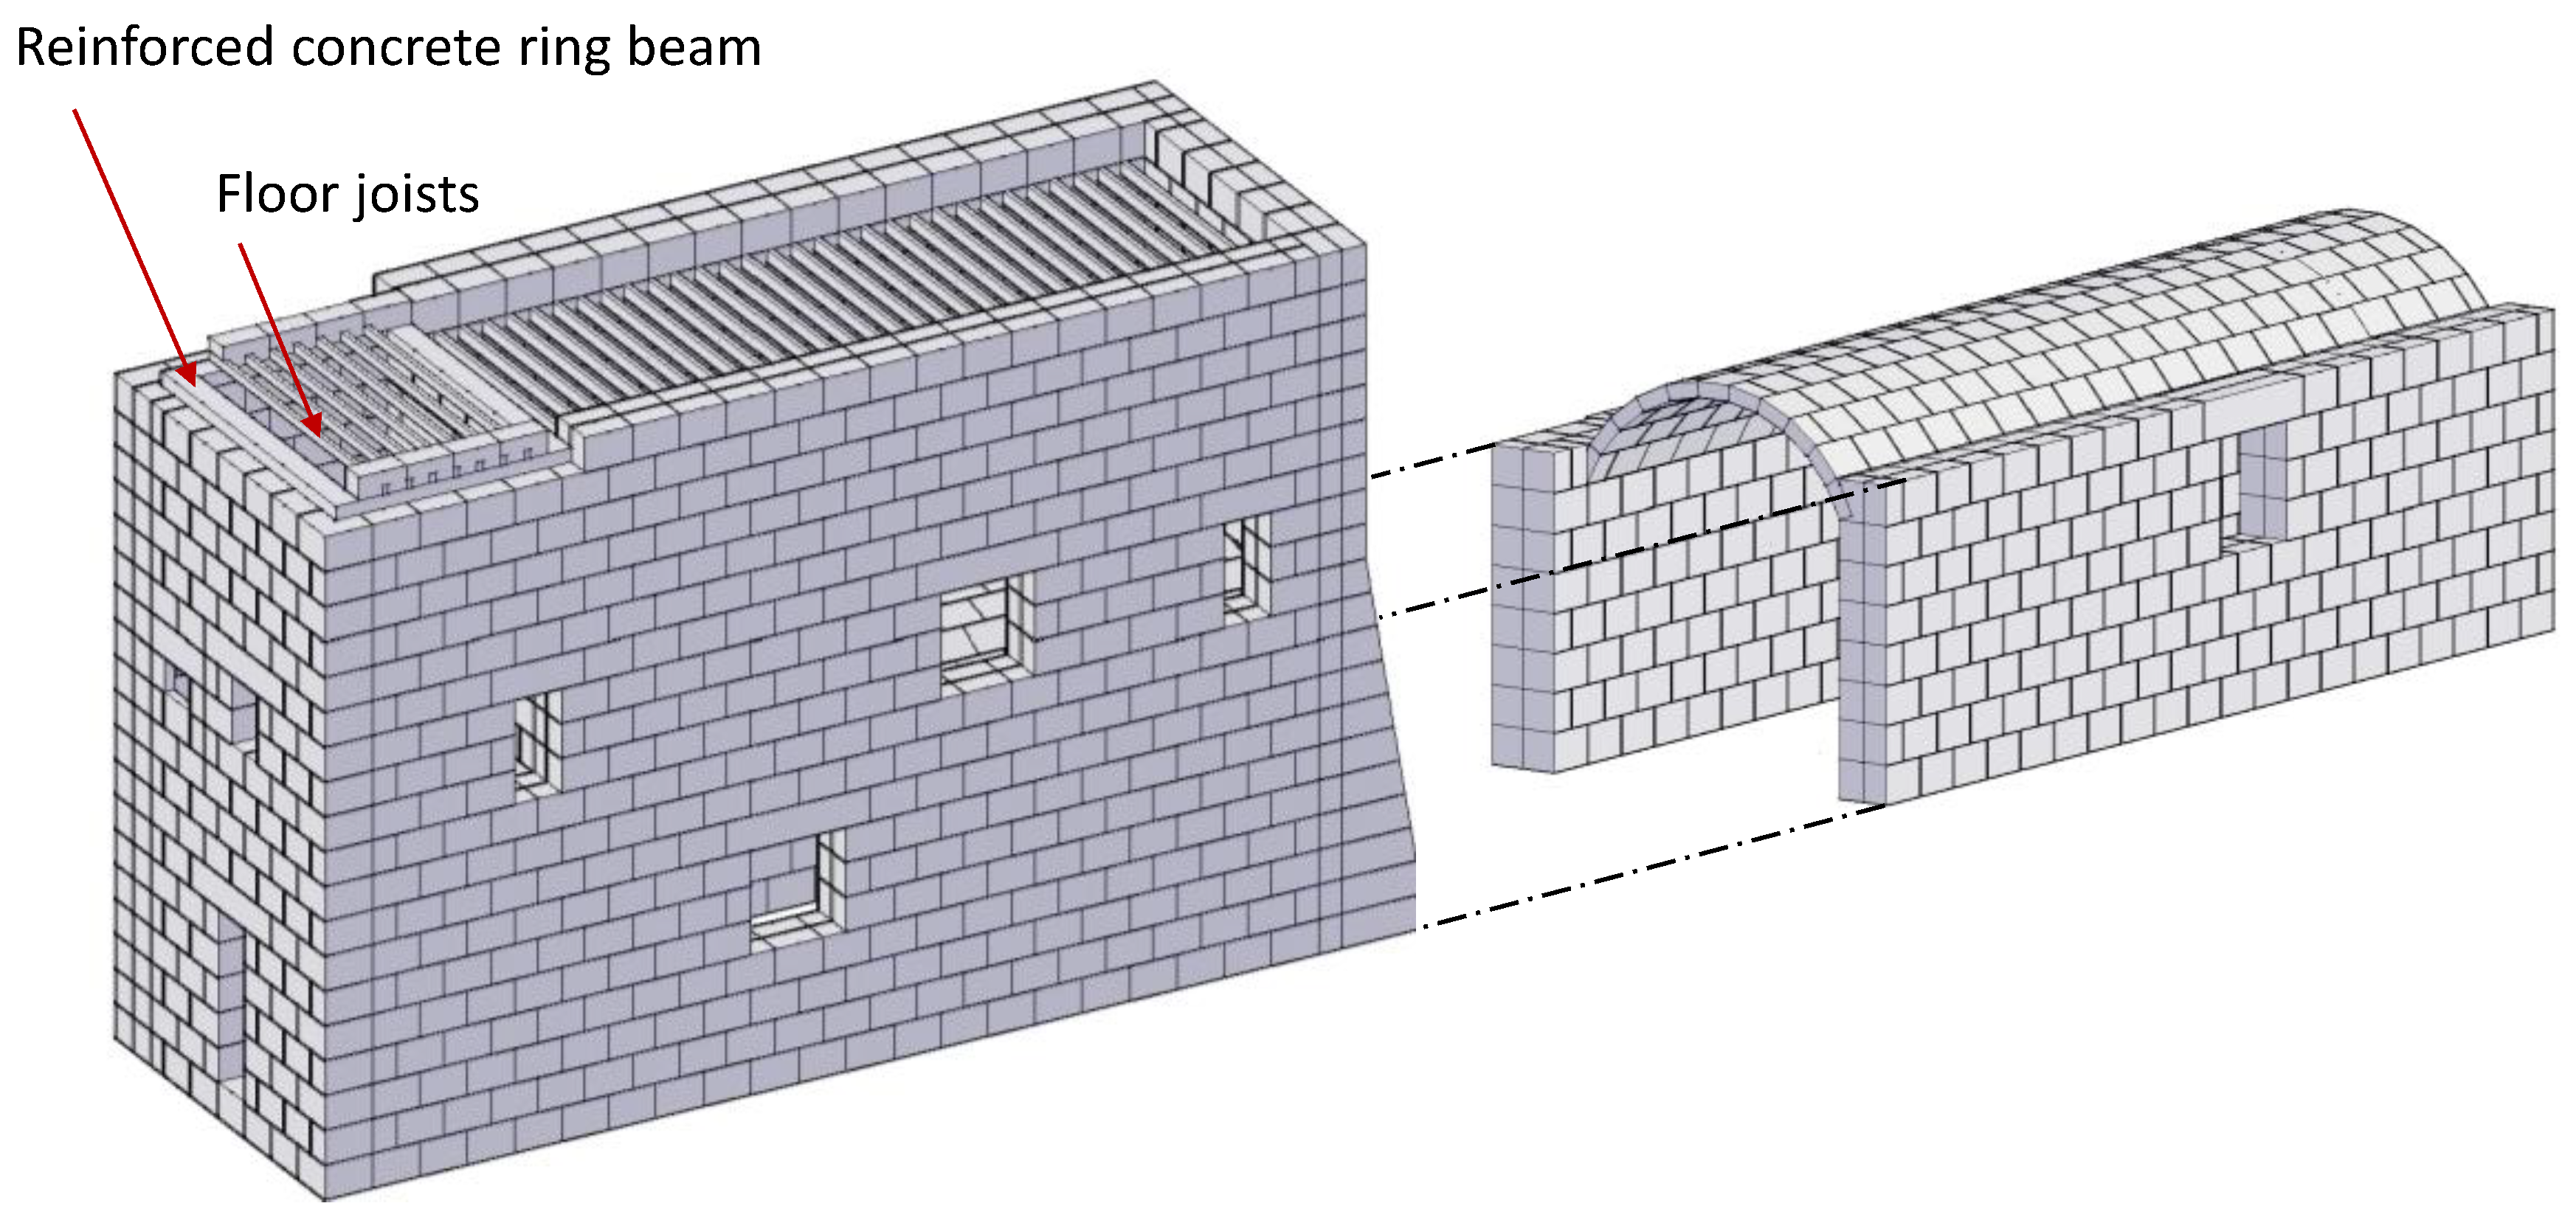
The numerical model of the selected structural unit of the castle included four external façades, the tower, the barrel vault of the ground floor, the internal walls, and the floors (timber and reinforced concrete slab at the first and second floors, respectively). Floors were modeled through joists connecting masonry blocks.
Figure 6 displays some exterior and interior views of the numerical model.
As for the loading conditions, the rigid blocks belonging to the façades were loaded by their self-weight only. The rigid blocks representing the floor joists and/or the voussoirs were also loaded by imposed loads equal to 2.0 kN/m
2 for internal floors and 4.0 kN/m
2 for roofs, which are the numerical values commonly adopted for the residential category of use according to Reference [
33].
Figure 7 reports some details of the numerical model.
5. Verification and Sensitivity Analysis
In a first step, a set of numerical analyses was carried out on a limited number of macro-elements of the construction and compared with the analytical results. A sensitivity analysis was then carried out considering three different sizes of rigid blocks, to validate the assumptions made for the discretization of the whole 3D model.
Therefore, in the first phase, the four façades of the castle were considered as independent macro-elements and composed of walls with two leaves without transversal connections between them, as in the real building.
Each façade was composed by a set of regular rigid blocks characterized by a depth of 1050 mm and a height of 750 mm. For each course, the block thickness corresponded to the overall thickness of a single leaf of the real structure, while the width and length were three times larger than the real elements. To ensure proper support around the windows, each lintel was modeled as a single rigid block extending a half-block around the openings (with an overall depth given by the sum of the opening and the length of a half-block).
The four façades were analyzed with LiABlock_3D for the live loads active along the in-plane and out-of-plane directions. For this purpose, a friction coefficient of 0.577 (which is the value of friction coefficient recommended by Reference [
33]) and a block unit-weight of 19 kN/m
3 were considered.
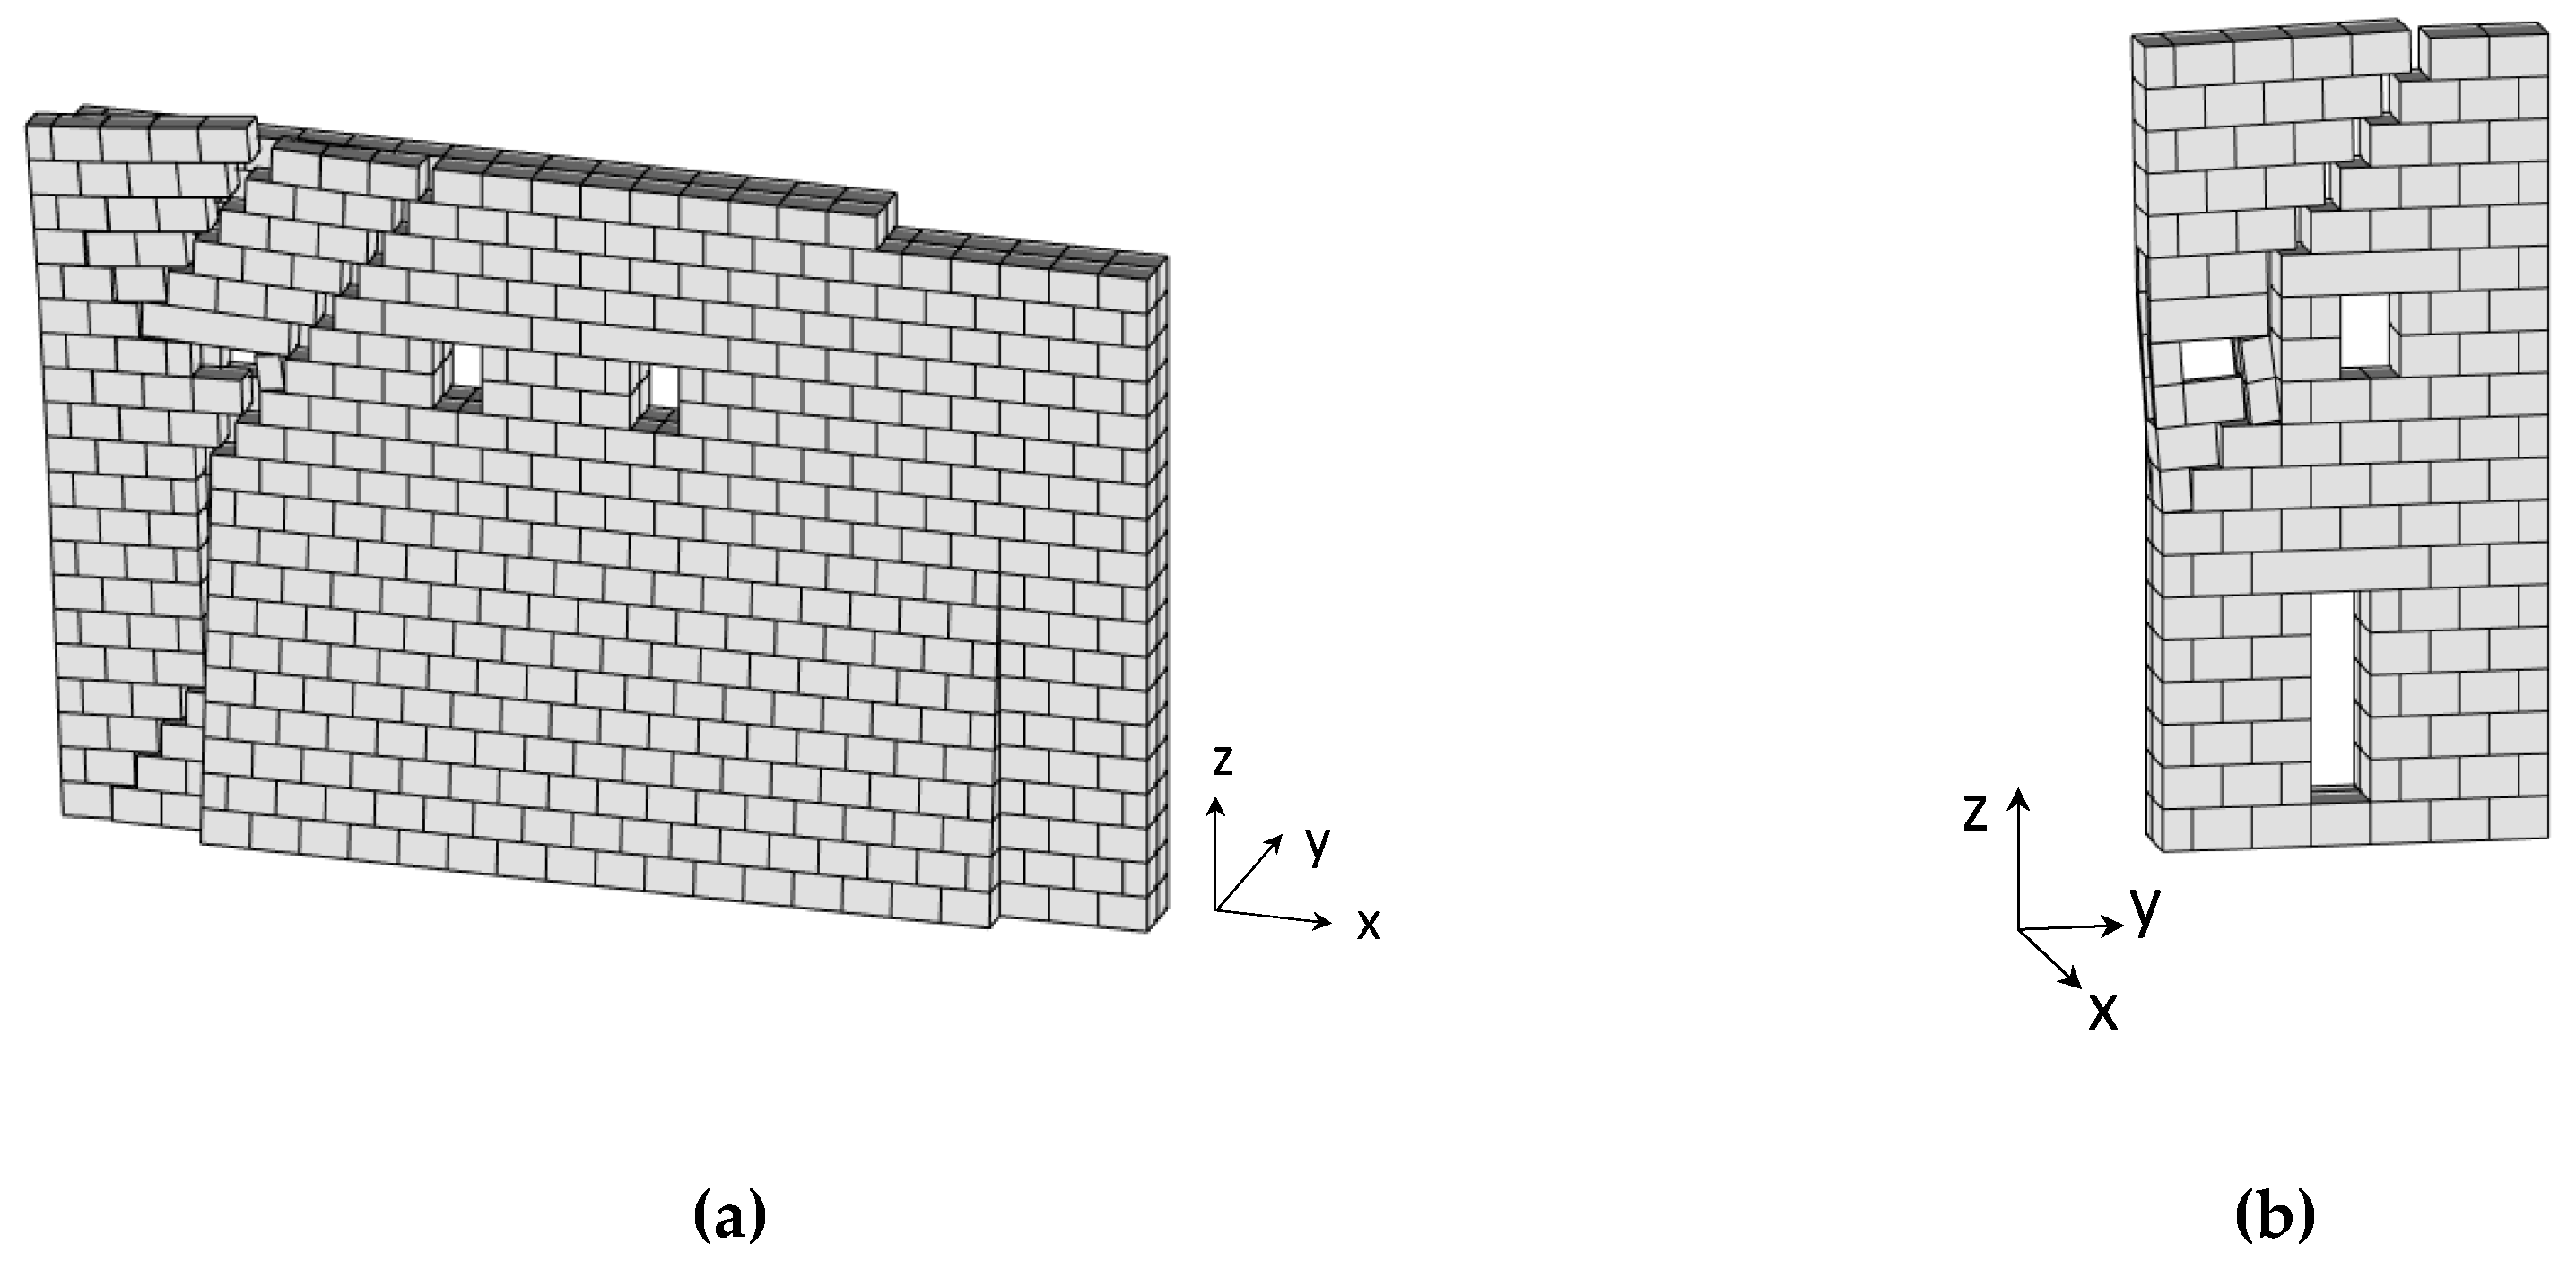
As expected, the most vulnerable mechanisms were the ones activated for out-of-plane loading actions. A global overturning mechanism was generally observed, due to the lack of transversal connections between the leaves. For in-plane loads, the mechanisms were triggered due of the presence of openings or following the variation of the wall thickness due to the presence of the buttress (see
Figure 8). It is worth noting that a major benefit provided by LiABlock_3D is to immediately return the first local mechanisms that are activated by live loads acting in the wall plane. Conversely, analytical methods would require several hypotheses to be formulated concerning the slope of the failure plane, thus requiring a huge number of calculations that are not necessary when the LiABlock_3D software is used.
Table 1 reports the comparison between the load factors for the out-of-plane mechanisms, calculated by applying LiABlock_3D according to both the associative and the non-associative friction behavior, and by carrying out hand-made calculations according to a conventional linear kinematic analysis. It is interesting to note that the analytical solution was included within the two load factors given by the software in the cases of associative and non-associative behaviors. This was mainly due to the fact that the numerical models took into account the friction behavior on the vertical contacts between the two leaves, which is usually neglected in analytical calculations, leading to an overall increase of resistance.
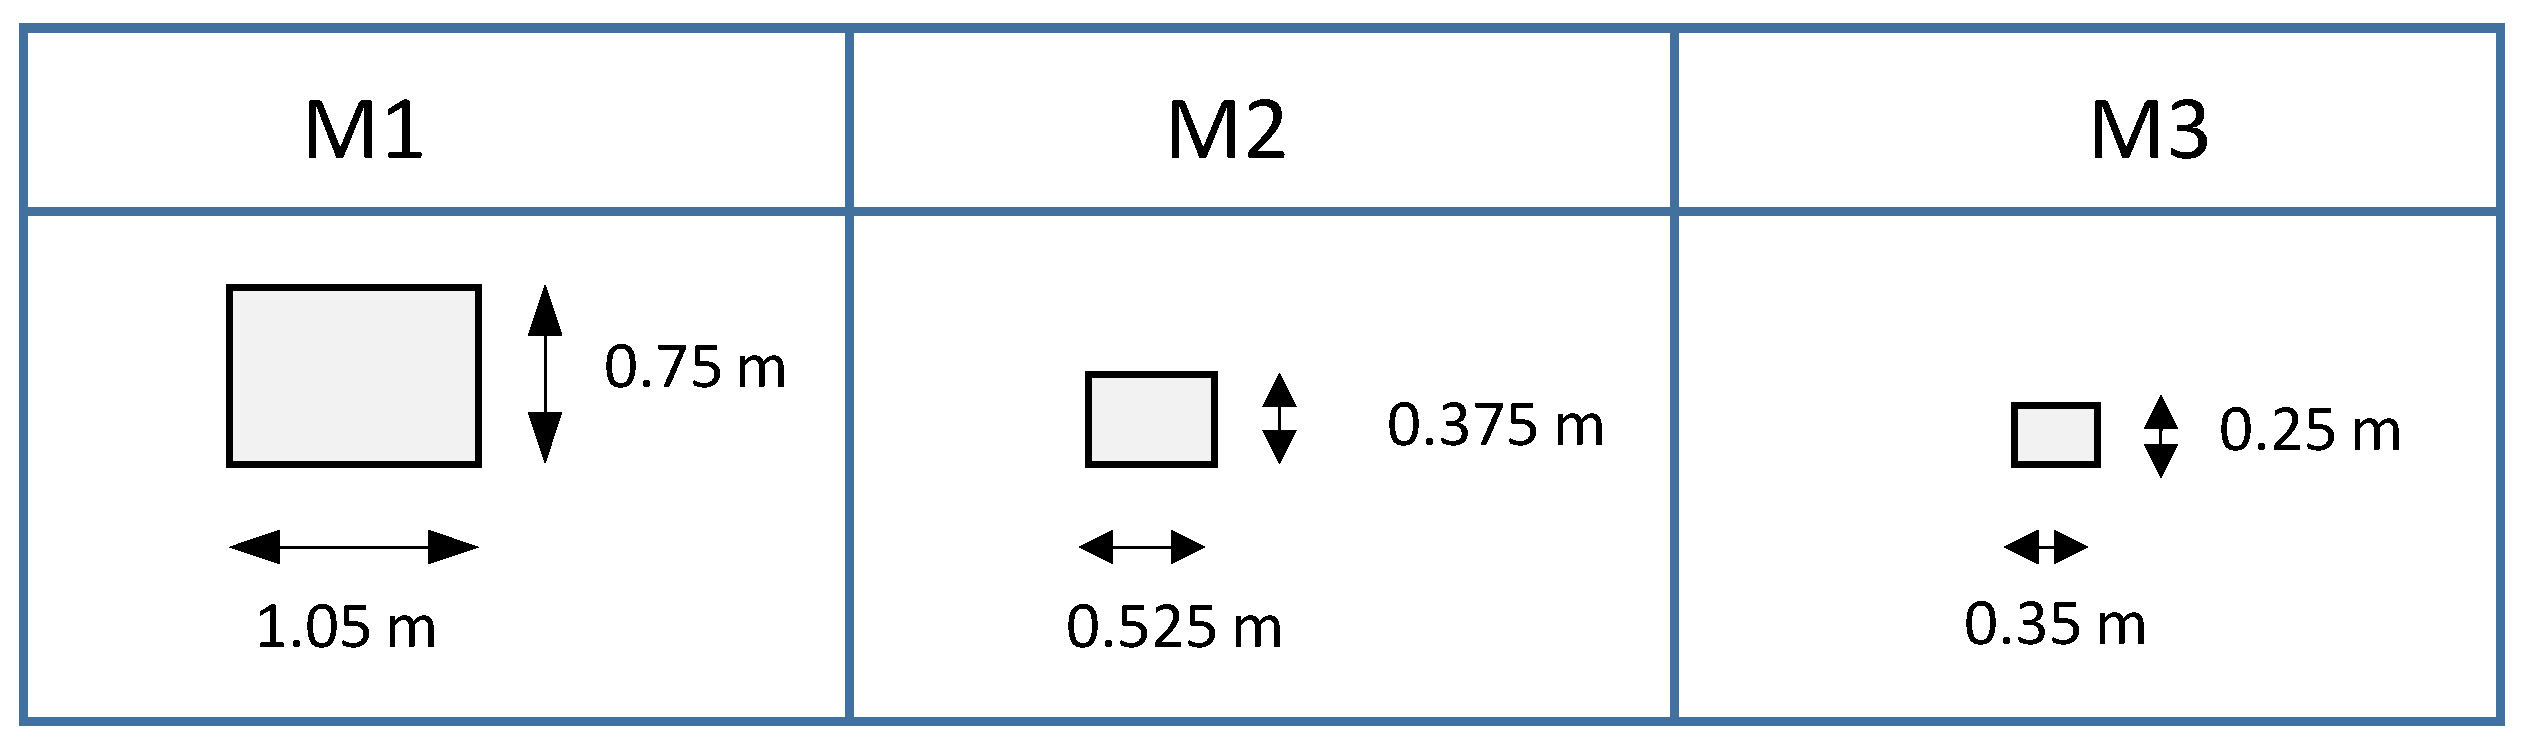
A mesh sensitivity analysis was carried out on the F3 façade (see label in
Figure 9). Three block dimensions were considered: a coarse mesh M1 with rigid blocks three times larger than the real ones, refined meshes M2 and M3 with rigid blocks width and length two and three times smaller than the first one respectively.
The block thickness, as in this case, was equal to the thickness of a single leaf. The F3 façade wasanalyzed for in-plane live loads and out-of-plane loads, considering, in this case, a restraint at the edge of the walls.
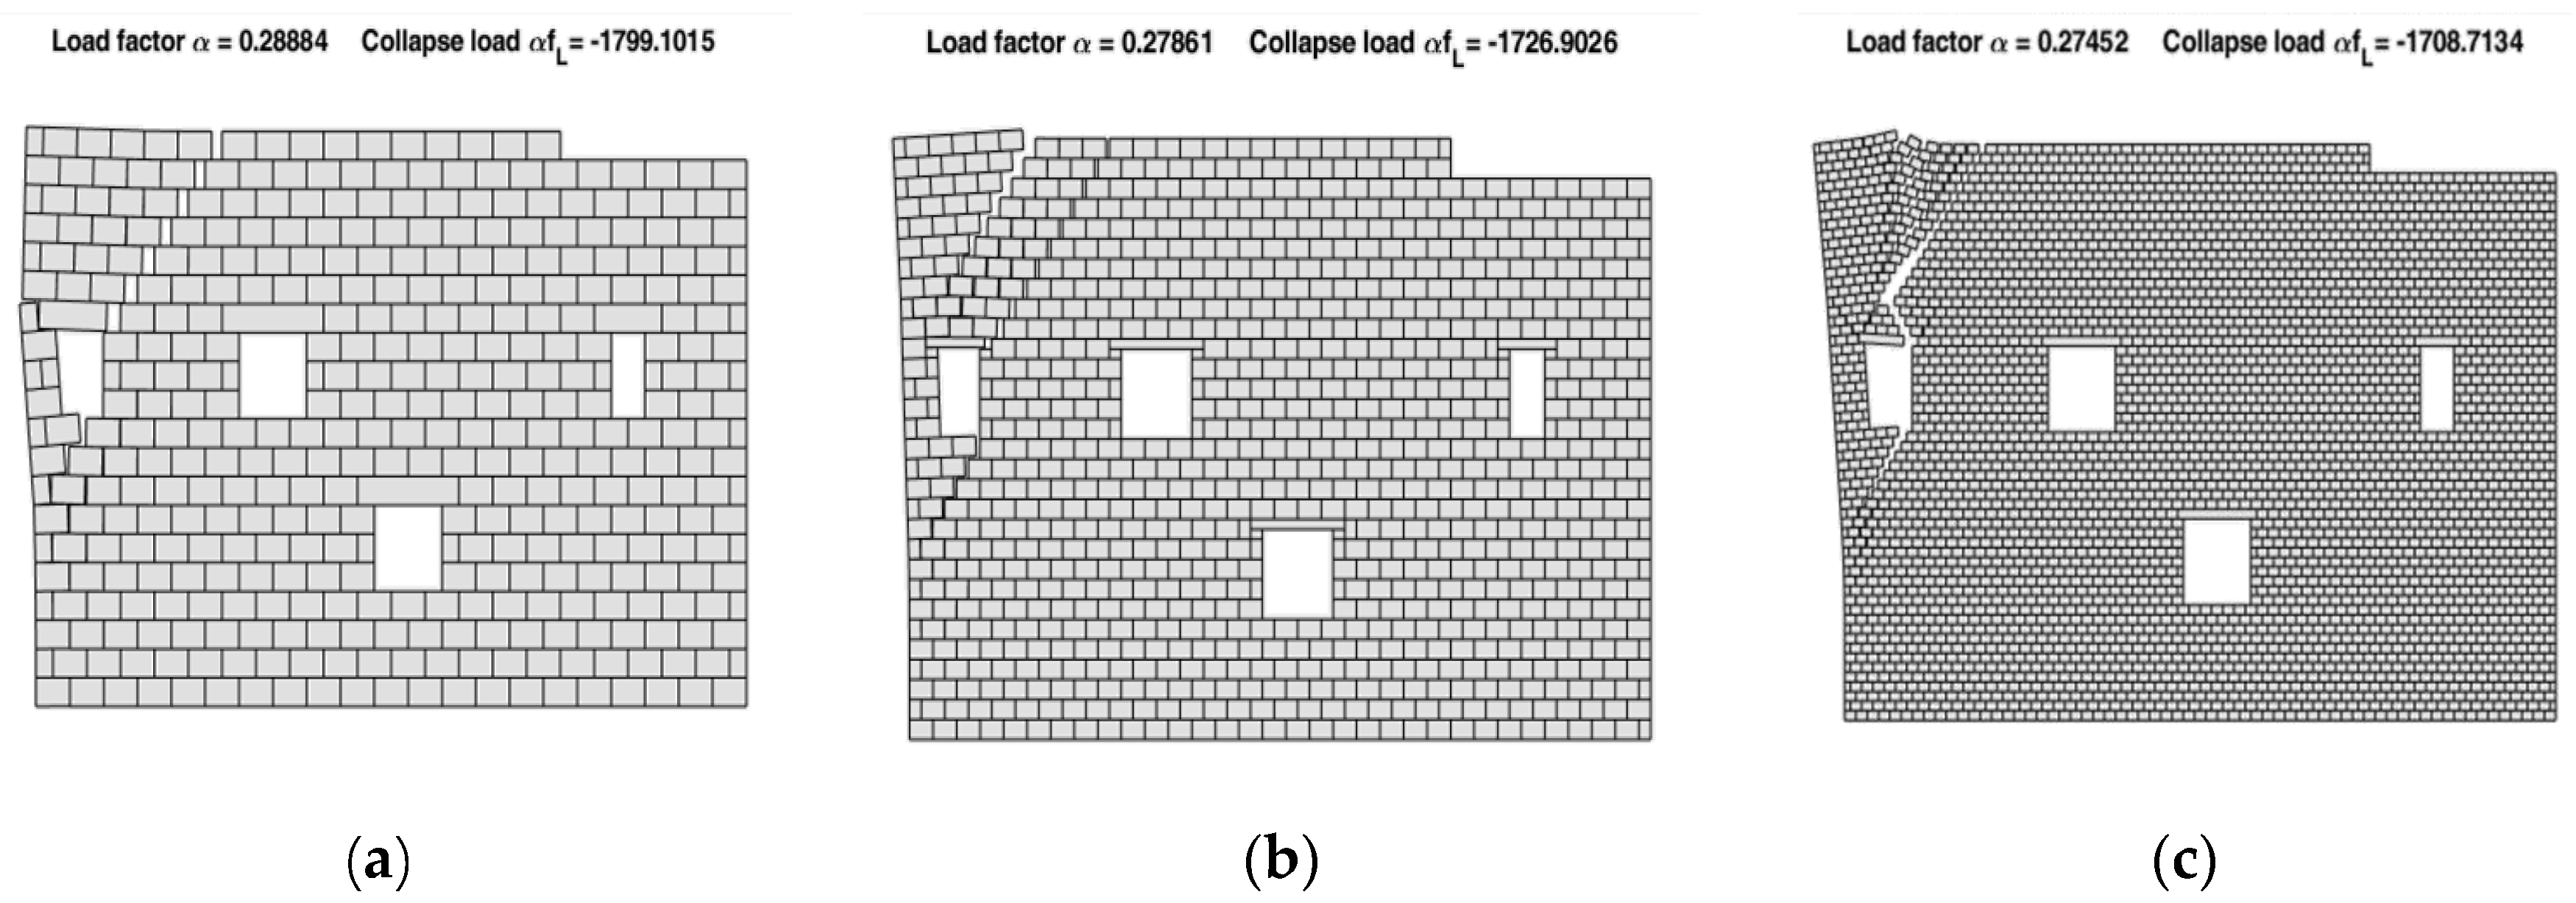
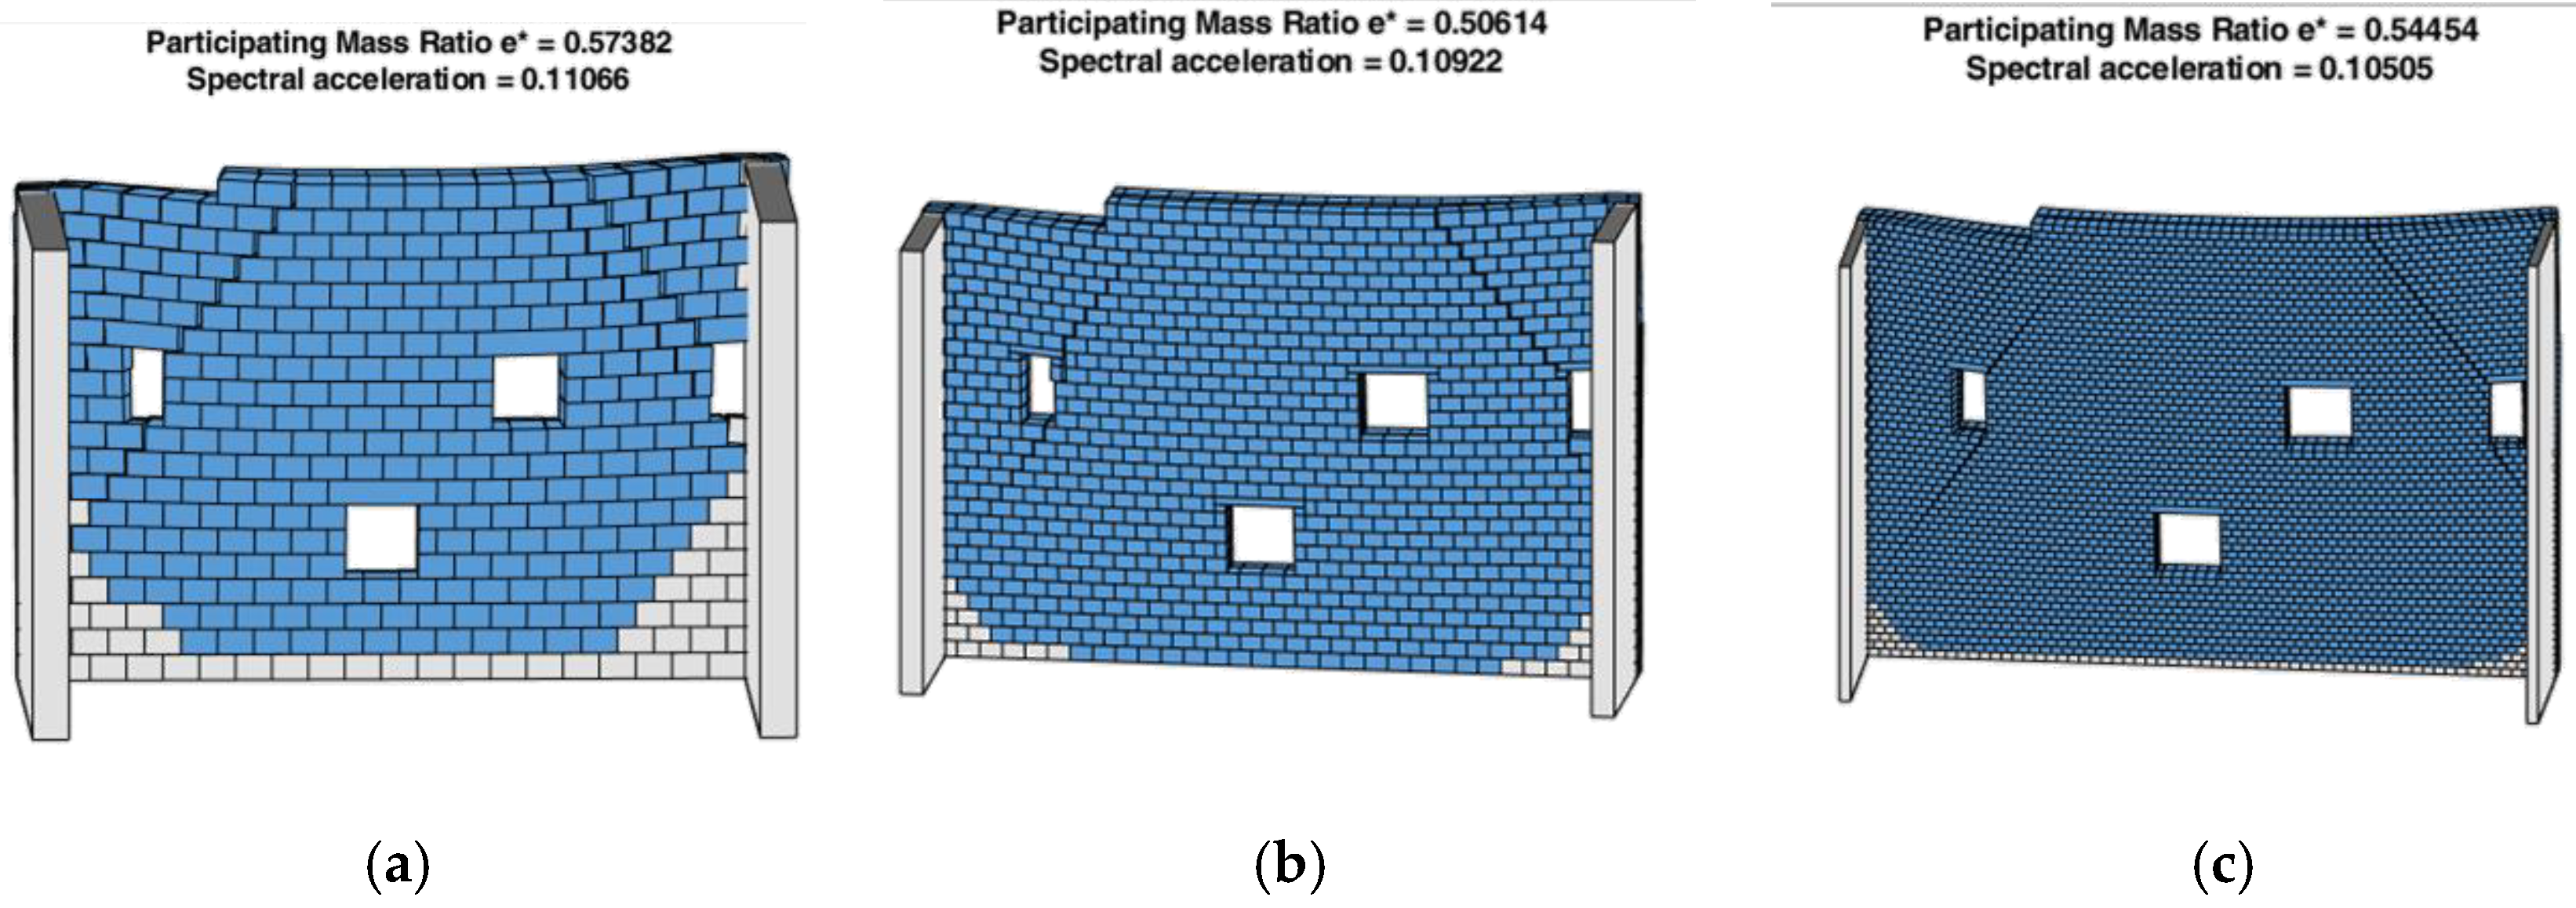
Figure 10 and
Figure 11 show the in-plane and out-of-plane collapse mechanisms for the coarse and refined models.
The participating mass ratio module, which was developed for the first time for the study presented in this paper, provided the participating mass ratio
e* and the spectral acceleration
a0* activating the mechanism.
Table 2 reports the results for the out-of-plane collapse mechanisms.
6. Numerical Analysis of the Structural Unit and Assessment of Strengthening Interventions
The global model of the castle wing included 2792 rigid blocks and 31,668 contacts.
Table 3 presents a summary of the model parameters required as inputs.
The structural response was analyzed for four loading conditions (LC1–LC4).
For each load case, rigid blocks were loaded at the centroid by two forces, a vertical downward force
Pi and a horizontal force
αPi directed (respect to the coordinate system of
Figure 12), respectively, along the positive x-axis for the first load case (LC1); negative x-axis for LC2; positive y-axis for LC3; and negative y-axis for LC4.
Four structural configurations were then analyzed, considering the castle wing in its present condition and supposing three types of potential structural retrofit interventions. The main goal was to evaluate the actual capacity of the construction at the “life safety” (LSL) limit state, which is the ultimate limit state corresponding to extensive damage to structural and non-structural components, to detect the most vulnerable collapse mechanisms and, on the basis of the obtained information, to best identify the most appropriate mitigation measures.
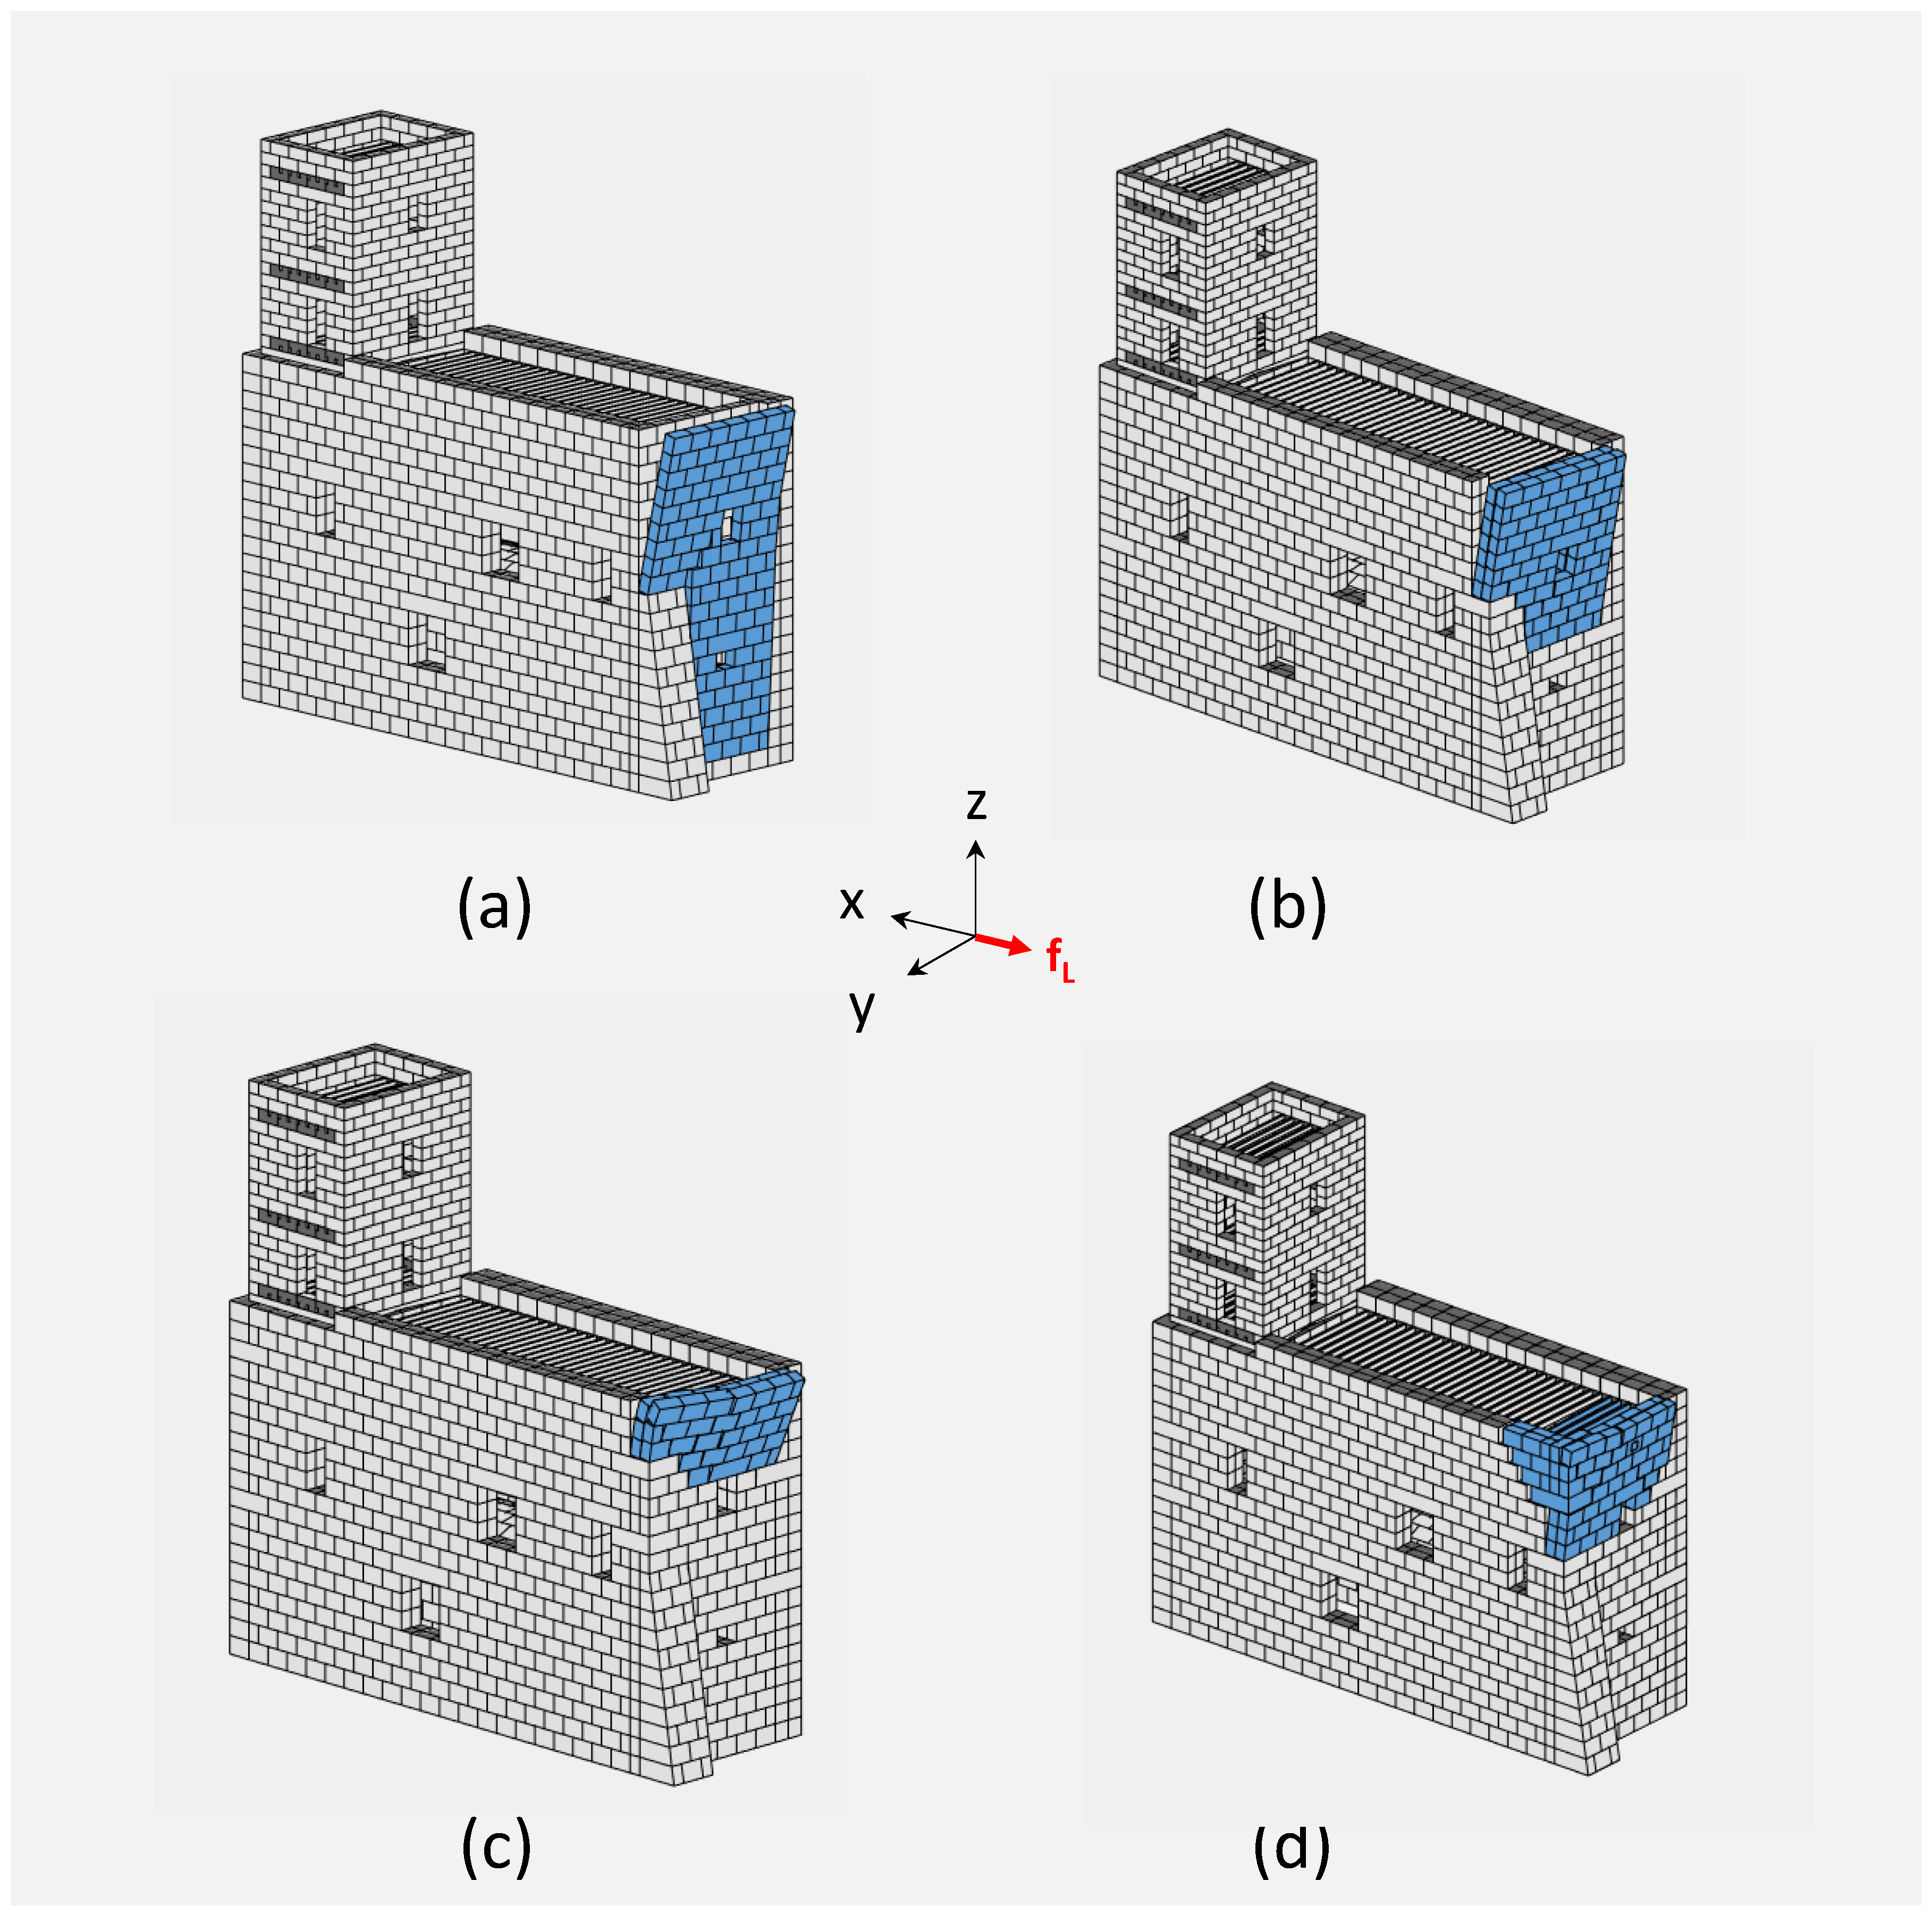
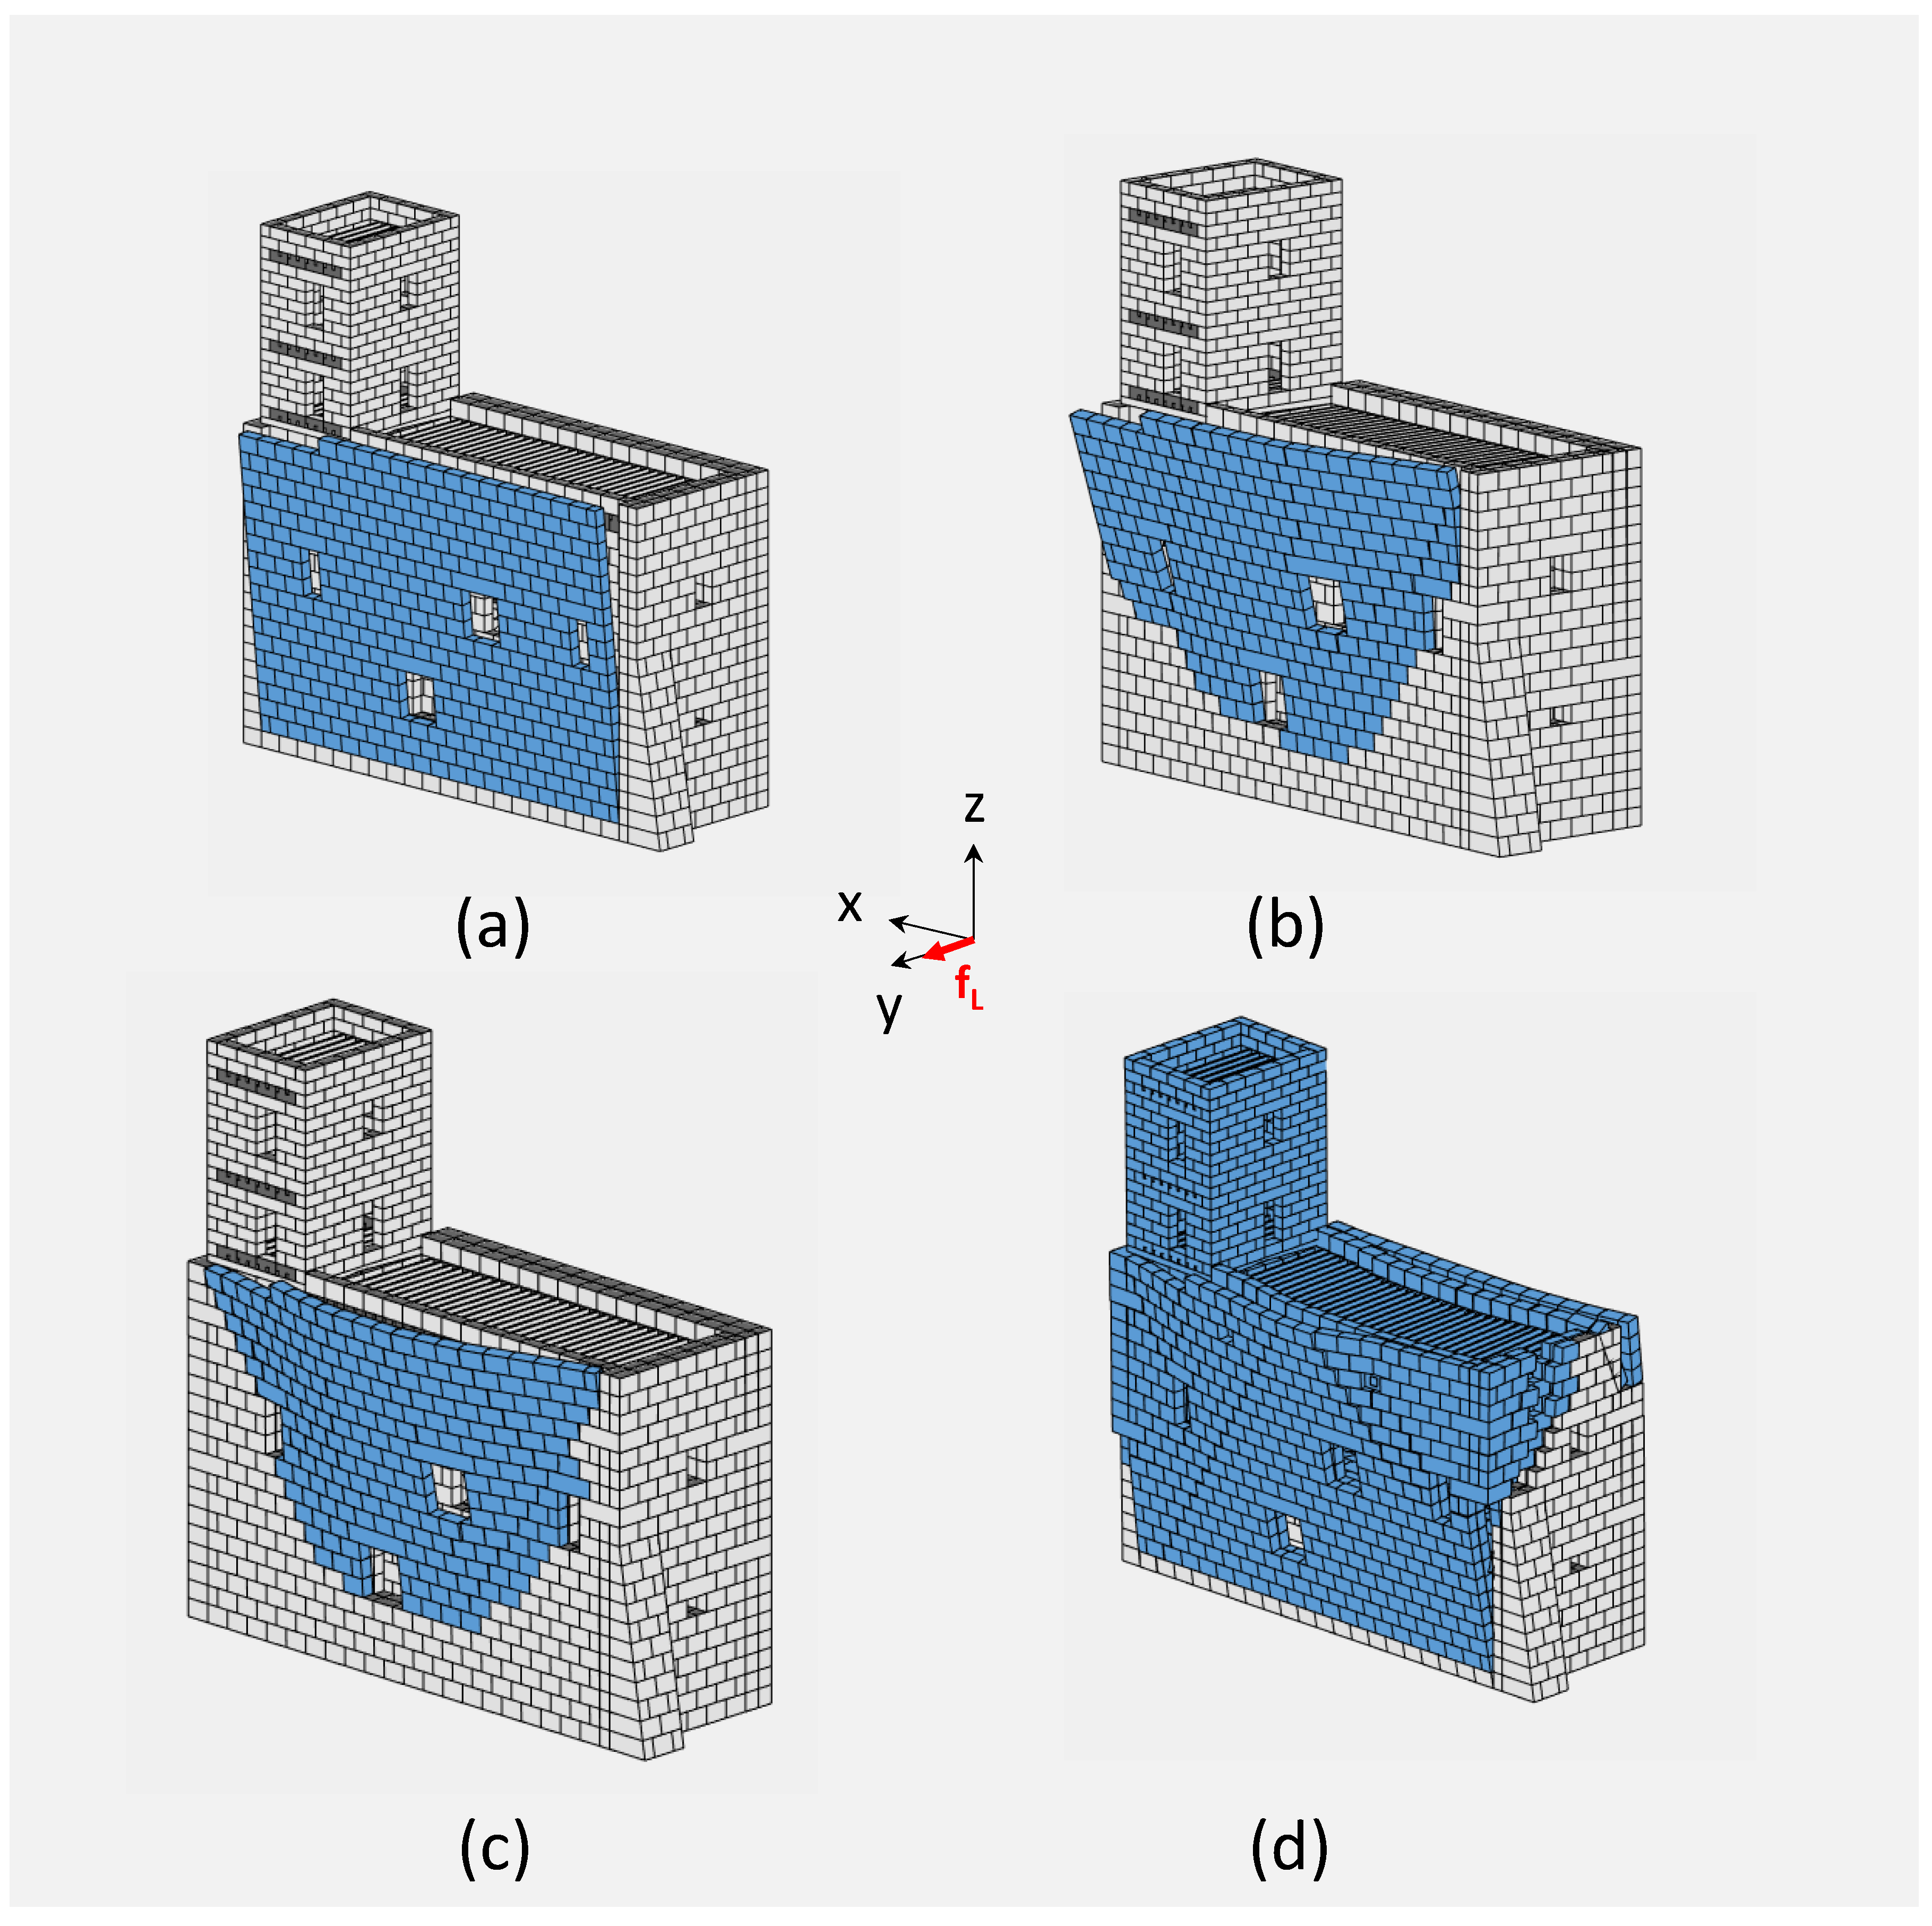
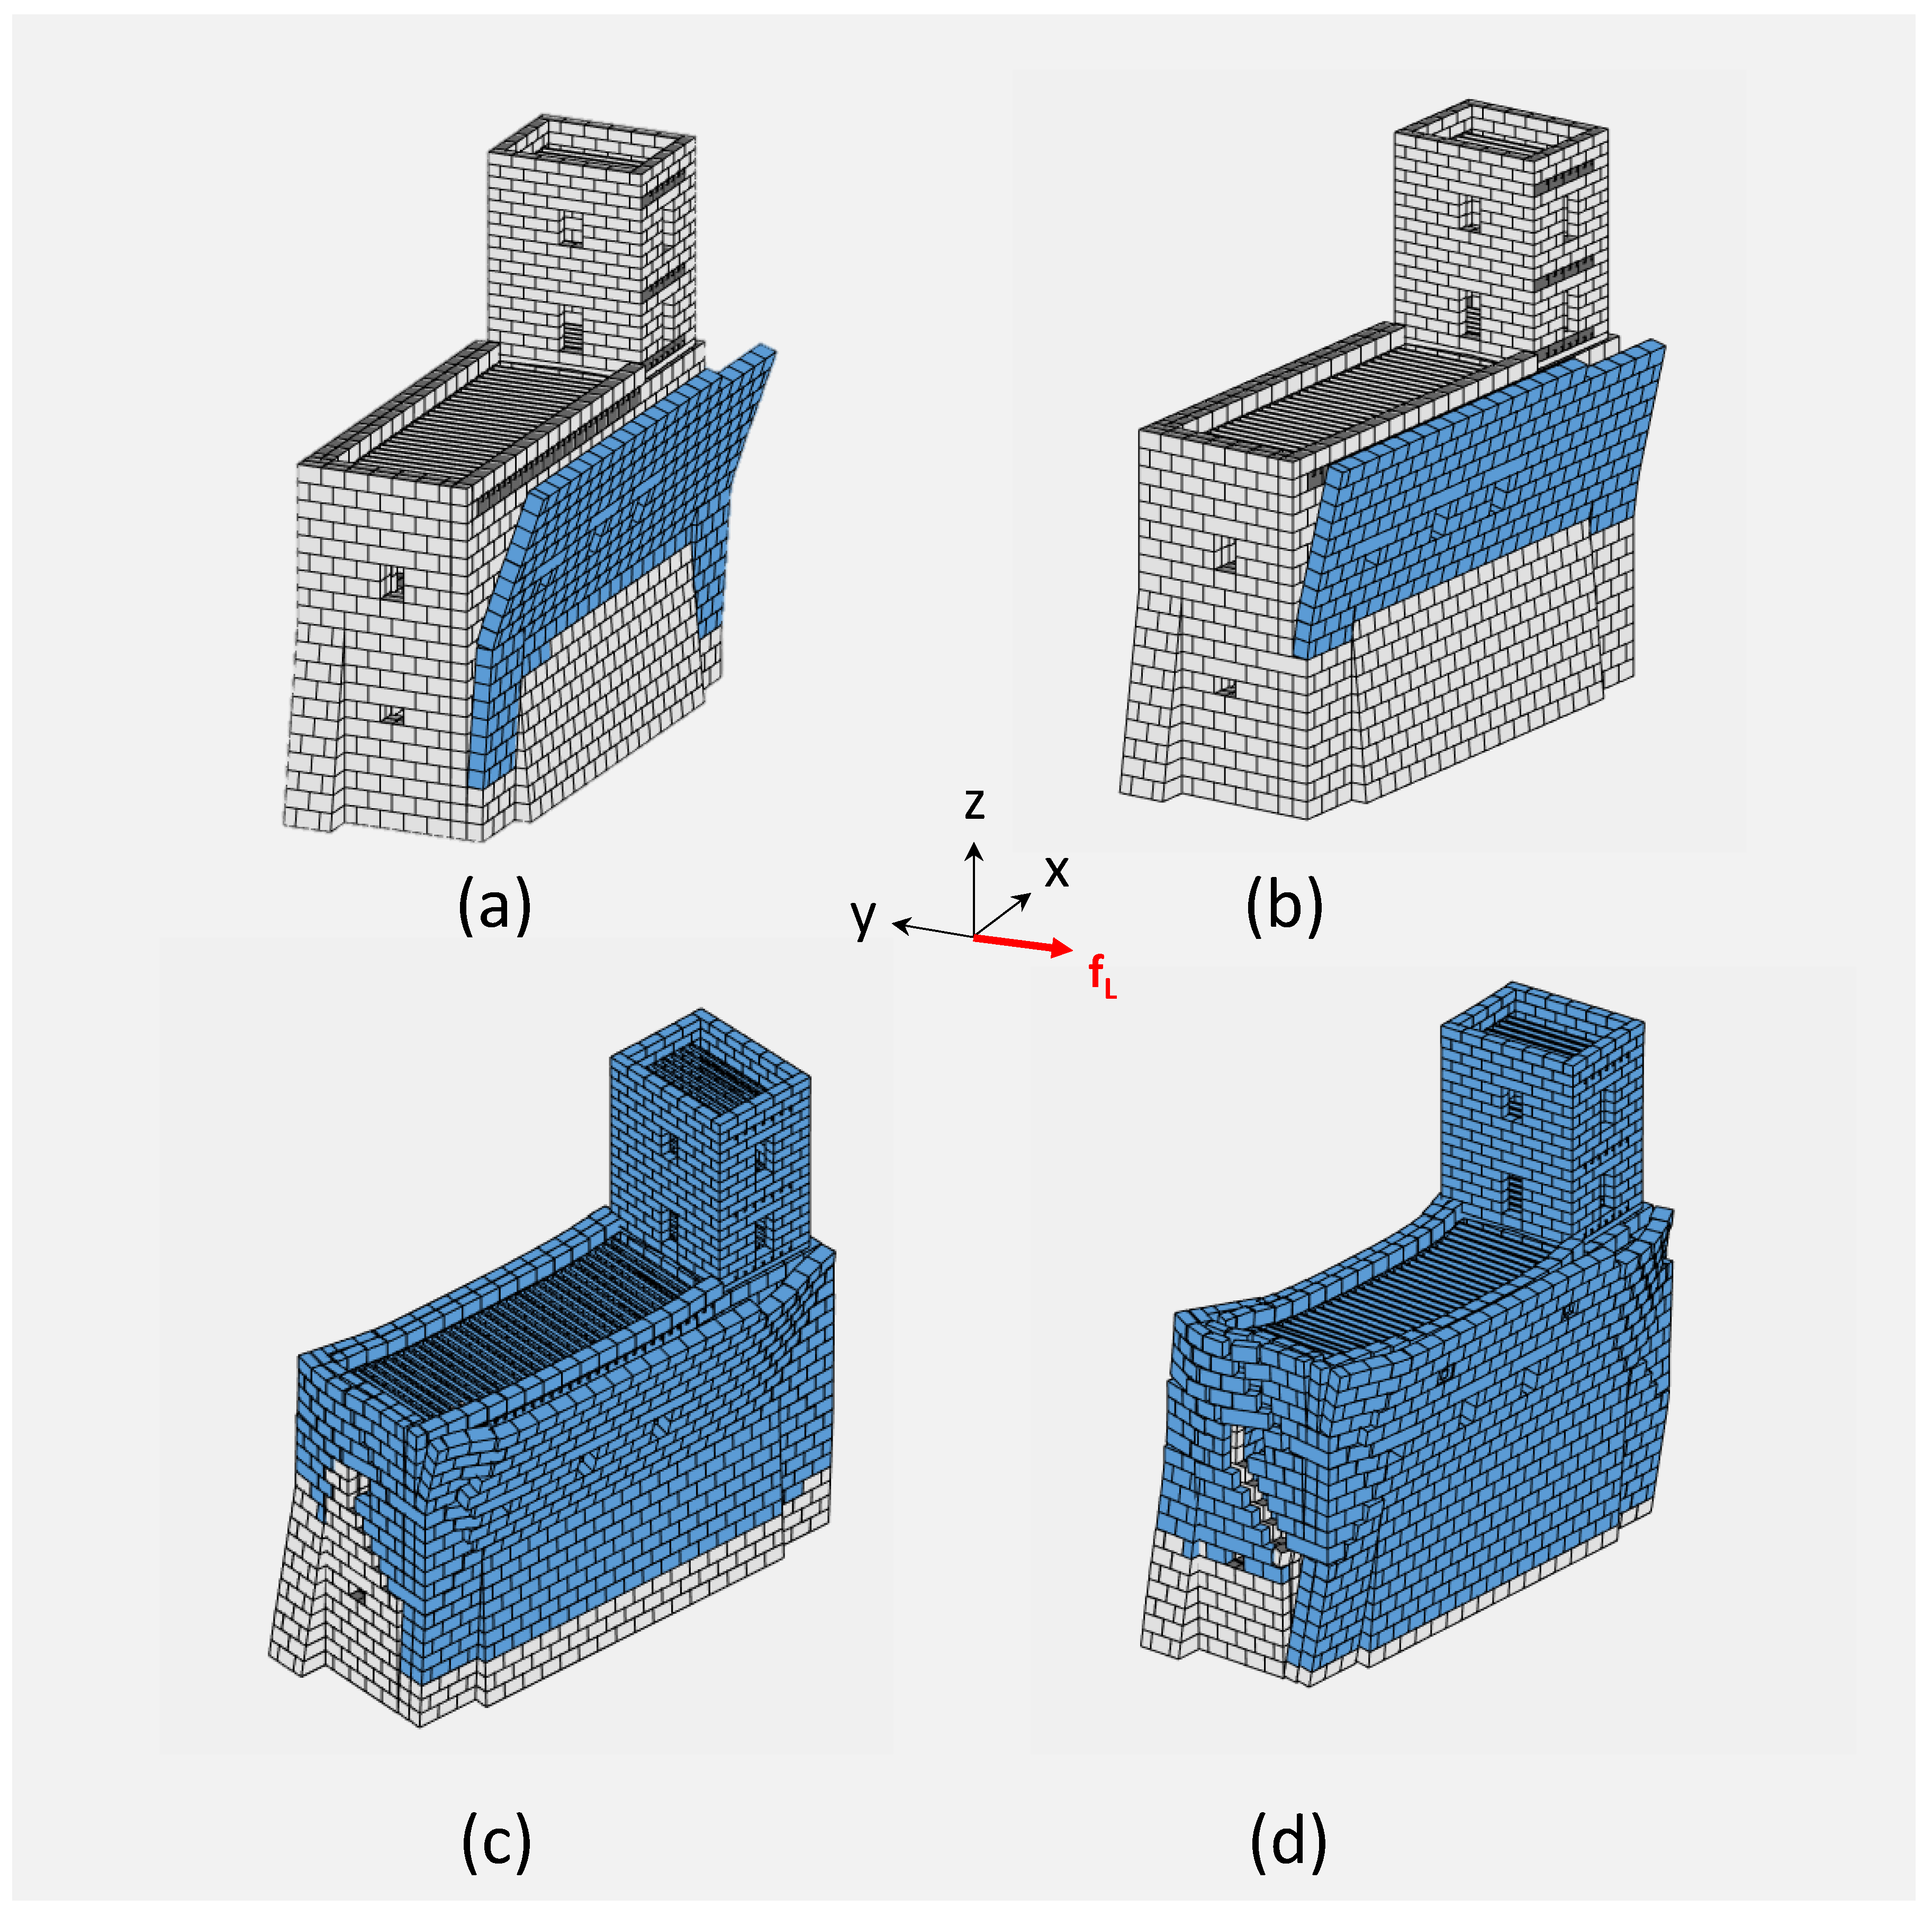
Sixteen numerical analysis were carried out: the four structural configurations were analyzed for the four load cases. In order to immediately compare the effect of the proposed retrofit interventions, the following four figures report the results of the analyses of the four structural configurations grouped by load case.
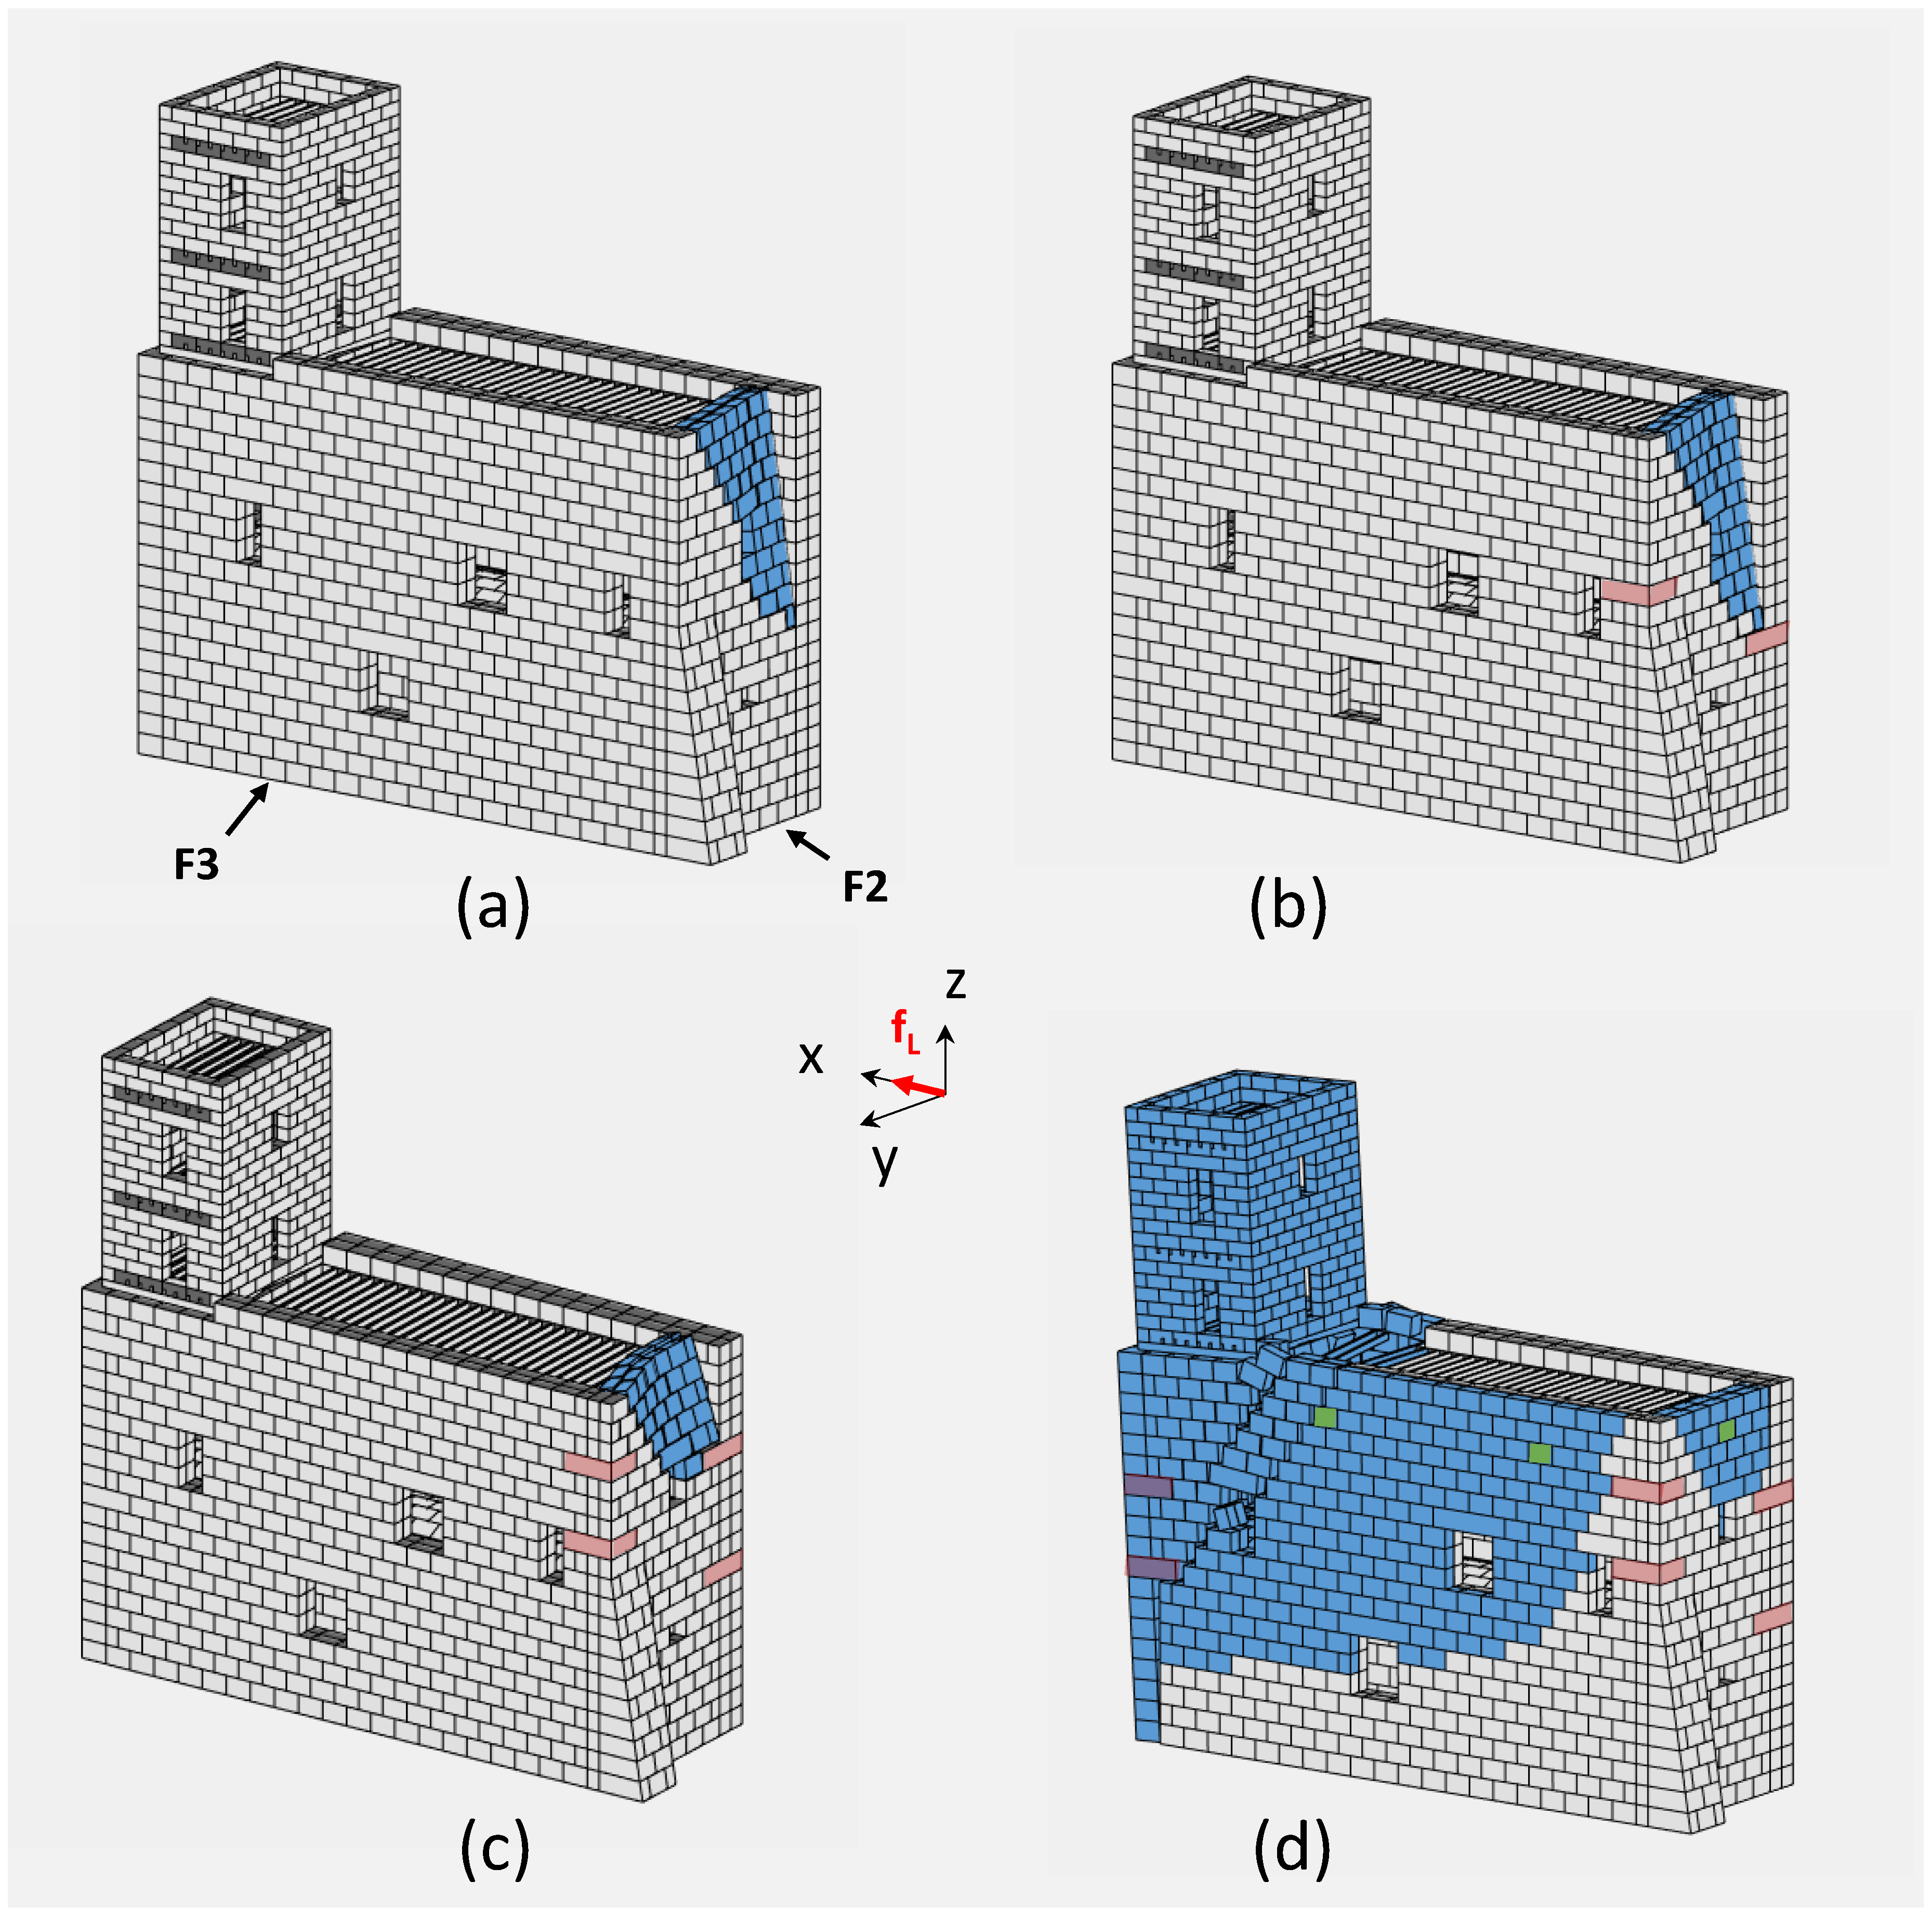
Generally speaking, it was possible to observe that the responses of the castle wing in its present condition (
Figure 12,
Figure 13,
Figure 14 and
Figure 15a) essentially involved out-of-plane failures of the façades due to overturning or delamination for very low seismic demands (see
Table 4 for the obtained results). This was mainly due to the lack of connections between the transversal walls. With reference to the façade F2 and the load case LC1 (
Figure 13a), the collapse mechanism detected by the software was a complex inward overturning of the superior part of the walls. In this case, the mechanism developed at the second floor only, because, at the first floor, the presence of the whole vault provided a lateral stiffness to the model that prevented any displacement of the walls above the height of the vault. In contrast, at the second floor, the timber floor was modeled by means of joists only. No slab was introduced in the model. As such, the joists transferred the floor loads to their supporting rigid blocks but they did not provide any lateral stiffness to the second story, so the façade F2 was free to move in the inward direction. It is worth noting that the same façade, F2, presented a completely different behavior for the load case LC2 due to the presence of the buttress. Following the results of the analysis in the present condition, the first non-invasive intervention (R1, visible in
Figure 12,
Figure 13,
Figure 14 and
Figure 15b) was considered by inserting corner quoins between all the façade walls at the first floor (red quoin blocks in
Figure 12b). In this case, the overturning of the upper part of the walls was observed for load cases LC2 and LC4 (loads along the x-axis and the negative y-direction). As for load case LC3, (positive y-direction), the identified collapse mode involved a combination between the out-of-plane overturning of the upper part of the façade and, in some cases (
Figure 14b), out-of-plane bending with a vertical cylindrical plastic hinge.
As for the second retrofitting intervention (R2), additional quoins (red blocks in
Figure 13c) were inserted at the level of the second floor (
Figure 12,
Figure 13,
Figure 14 and
Figure 15c). In such a case, similar but more limited collapse mechanisms were observed in the load cases LC1 and LC3 (along the x-axis and positive y-direction). Conversely, the analysis for LC2 and LC4 (negative x-, y-axes) revealed a quite different behavior of the construction, which tended to experience global collapse mechanisms.
As for the last retrofitting intervention (R3), in addition to the aforementioned quoins, a set of ties was applied. Those were modeled in LiABlock_3D through the insertion of washer-bearing plates (green blocks in
Figure 12d) modeled as special rigid blocks of null volume and active vertical contacts at the interface between the façade and the plate itself. Constant horizontal forces, equal to the ties’ failure load, were applied to the bearing plates, so as to simulate the effect of tie forces.
Figure 12d and
Figure 13d report the collapse mechanisms for the load cases LC1 and LC2 (along the x-axis) where a single tie force was applied to the washer-bearing plates located on the F2 and F4 façades.
Figure 14d and d highlights the failure modes for the load cases LC3 and LC4 (live loads along the y-axis), considering the effects of two ties applied to the four plates located on the F1 and F3 façades. In such case, global mechanisms were obtained with a damage distribution along the whole structure.
In
Table 4, the collapse load multipliers for each load case and retrofitting interventions are reported. In the same table, the percentage increments are also listed, proving the effectiveness of the applied devices.
It is interesting to note that the average time required to obtain the refined solution for each analysis was below 10 min, using a 4.0 GHz Intel Core i7-6700 k Processor with 32.0 GB of RAM.
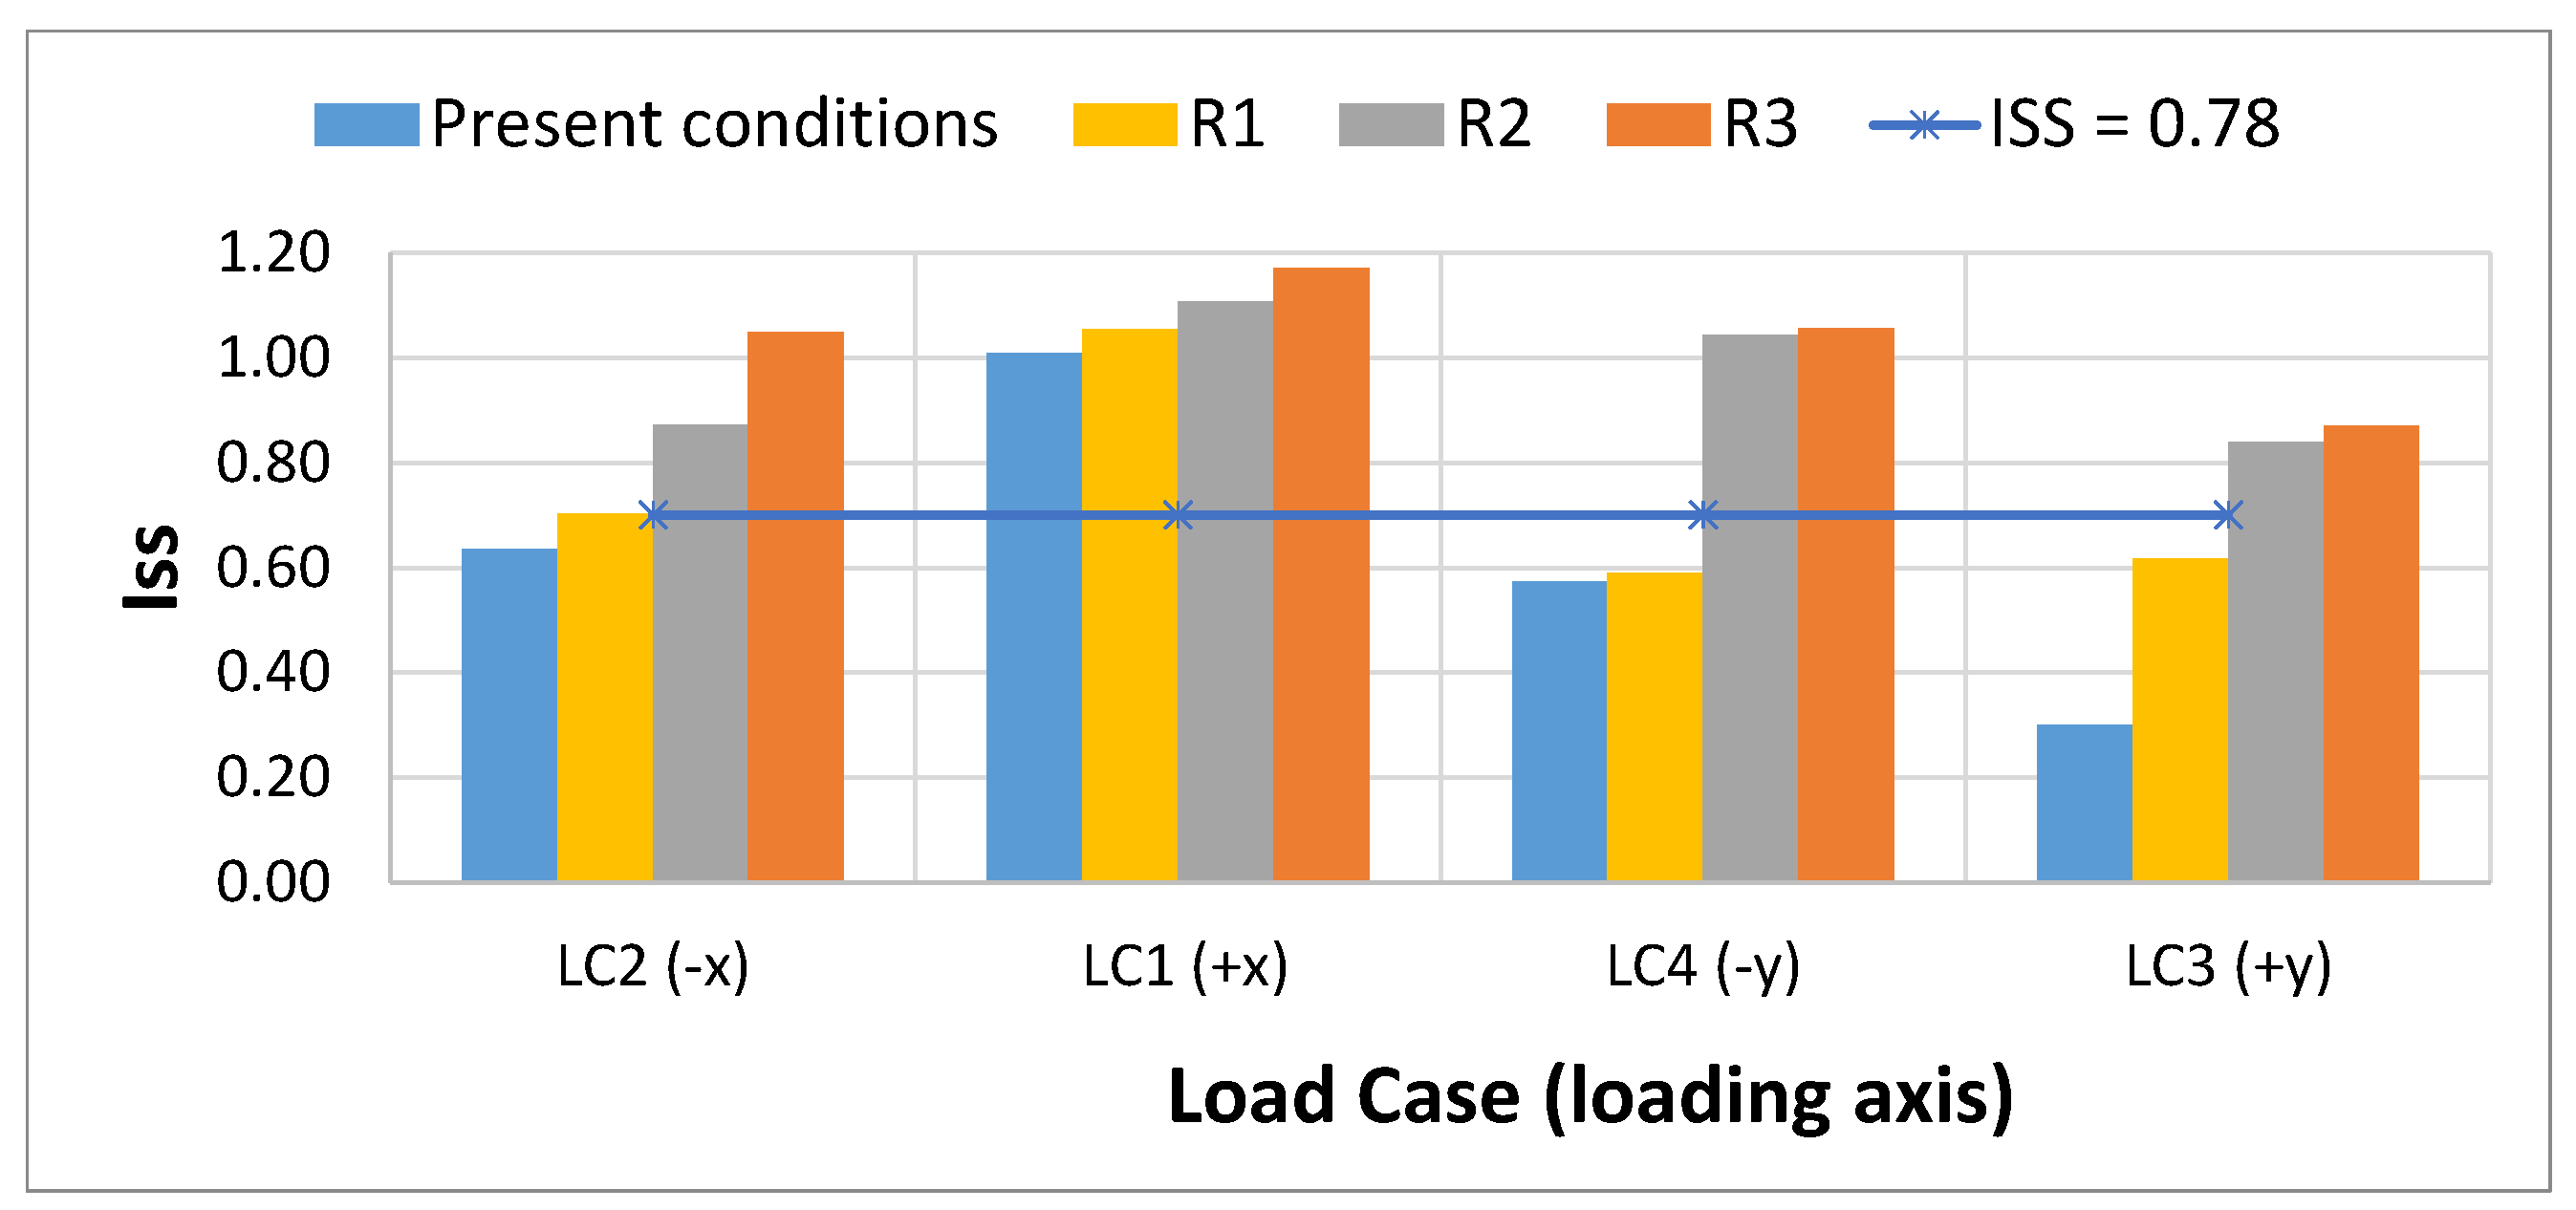
Finally, a comparison in terms of seismic safety index is carried out. In particular, assuming a value of
T1 equal to 0.38 s (according to the simplified formulation
T1 = 0.05*
Z3/4), the spectral acceleration for the elastic design at the castle location corresponding to the main period of the castle was equal to 0.55 g.
Figure 16 reports the seismic safety indexes for the whole set of analyses carried out.
As it is possible to observe, all the applied retrofitting interventions allowed incremental increases of the structural capacity of the castle unit under investigation and, although the seismic safety indexes were less than 1 for the majority of cases, the retrofit R3 allowed the minimum value of 0.78 to be achieved, which is considered acceptable in cases of historic construction [
32].
7. Conclusions
An application of 3D limit equilibrium analysis is presented in the paper for the seismic capacity assessment of a historic masonry castle. The aim of the study was to show the potential of this approach when numerical analysis tools are used as an alternative to classic analytical formulations based on macro-elements.
Starting from an in-depth knowledge acquisition path of the structure under investigation, a clear understanding of the construction features and details (e.g., the interlocking between the walls, the irregularities in the wall elevation, etc.) was obtained. On that basis, a rigid block numerical model was implemented that closely reproduced the real assemblage of the construction using an in-house software tool.
The analysis revealed that failure mechanisms, the relevant collapse load multipliers, and strengthening interventions can be conveniently assessed when the behavior of an entire structural unit is investigated. The routine implemented for the evaluation of the participating mass ratio showed that spectral and ground accelerations could be easily derived on the basis of the calculated failure modes even in the case of complex and combined collapse mechanisms. Additionally, thanks to the discrete nature of the numerical model, it was shown that the design of the local retrofit intervention could be easily implemented (i.e., enhancing the connection of the wall by the use of quoins) and evaluated so as to provide guidance for the choice of the optimal retrofit intervention, which is a question of compromise between safety and preservation requirements. It is worth noting that the methodology proposed in the paper provides an insight into the structural capacity only. Within the field of cultural heritage preservation and conservation, other fundamental requirements must be taken into account. Indeed, the selection of an optimal retrofit intervention must be based on the achievement of several preservation and conservation requirements, apart from the structural capacity, in order to respect the historic and cultural value of the constructions, as well as the economic constraints.


 ,
, 


