Article

Demand Control Strategies of a PCM Enhanced Ventilation System for Residential Buildings

Department of Built Environment, Division of Architectural Engineering, Aalborg University, Thomas Manns Vej 23, DK-9220 Aalborg Øst, Denmark
*
Author to whom correspondence should be addressed.
Appl. Sci. 2020, 10(12), 4336; https://doi.org/10.3390/app10124336
Submission received: 31 May 2020 / Revised: 17 June 2020 / Accepted: 18 June 2020 / Published: 24 June 2020
(This article belongs to the Special Issue Energy Storage in Buildings and Building Facilities)

Abstract

:
A ventilated window system enhanced by phase change material (PCM) has been developed, and its energy-saving potential examined in previous works. In this paper, the ventilation control strategies are further developed, to improve the energy-saving potential of the PCM energy storage. The influence of ventilation airflow rate on the energy-saving potential of the PCM storage is firstly studied based on an EnergyPlus model of a sustainable low energy house located in New York. It shows that in summer, the optimized ventilation airflow rate is 300 m3/h. The energy-saving of utilizing a ventilated window with PCM energy storage is 10.1% compared to using a stand-alone ventilated window, and 12.0% compared to using a standard window. In winter, the optimized ventilation airflow rate is 102 m3/h. The energy-saving of utilizing a ventilated window with PCM energy storage is 26.6% compared to using a stand-alone ventilated window, and 32.8% compared to using a standard window. Based on the optimized ventilation airflow rate, a demand control ventilation strategy, which personalizes the air supply and heat pump setting based on the demand of each room, is proposed and its energy-saving potential examined. The results show that the energy savings of using demand control compared to a constant ventilation airflow rate in the house is 14.7% in summer and 30.4% in winter.

1. Introduction

To decrease the high energy consumption of the building sector, especially from space heating/cooling, it is essential to adopt renewable energy and highly energy-efficient building equipment for both new and existing buildings. Renewable energy such as solar energy is usually intermittent energy and highly dependent on outdoor weather conditions, which makes thermal energy storage (TES) more important during the implementation.
Phase change material (PCM) as TES for building applications is gaining increasing research interest. The PCM has been proved to be effective for building energy conservation, when integrated into building constructions such as floors [1,2], roofs [3], ceilings [4,5], walls [6], and windows [7]. It has also been proved to be effective for building energy conservation and contributes to building energy flexibility for building ventilation systems, such as cooling units [8,9,10] and double skin facades [11,12].
The ventilated window (VW), which was developed by Liu et al. [12], proved to function poorly in cooling a building space during summer, and insufficient for heating the space during winter. Instead, a PCM-enhanced ventilated window (PCMVW) was developed and tested by Hu et al. [13,14], as seen in Figure 1. It includes a PCM heat exchanger under the ventilated window(VW). The PCM energy storage and heat exchanger is made by parallel PCM plates in a wooden frame and a glass surface [15,16]. The VW is made by a double layer glass in the outer panel and a single layer glass in the inner panel, which forms a ventilation cavity to allow airflow to go through the window [12]. Compared to the VW and standard window (SW) with fan ventilation, the PCMVW decreases the room air conditioning energy demand by pre-treating the ventilation air, e.g., pre-cools the ventilation air during summer and pre-heats the ventilation air during winter.
Investigation of the energy performance of buildings with PCM applications is commonly done by modeling. EnergyPlus as a whole building energy simulation program has been used and proved to be accurate by many researchers concerning PCM modeling in building systems, as the works shown in [17,18,19,20,21,22,23]. Compared to other building simulation programs, the Energyplus software has the advantage of combining the PCM applications with various building facilities in a single building system. Moreover, the modeling of PCM in Energyplus has been well developed, including Conduction Finite Difference (CondFD) heat balance algorithm, changeable PCM properties along with temperature and PCM temperature hysteresis. The PCM temperature hysteresis was neglected in building modeling for a long period until recently when several researchers included it in building energy calculation [24,25].
The aforementioned researchers have all successfully modeled PCM in building ventilation systems. However, those models are all based on simple building models and ventilation strategies, and there are not many works concerned directly with the demand control operation, where the building is divided into small sub-thermal zones, and the air conditioning of each room is controlled based on the real-time demand of the room.
Diaconu [25] studied different occupancy patterns and ventilation strategies on the energy-saving potential of buildings with a PCM-enhanced wall system and found out that the occupant pattern, which is directly associated to the HVAC set point, has a big influence on the energy-saving potential. However, those occupancy patterns are based on the assumption that the building is one thermal zone with one function, and the ventilation strategies are quite simple, and the demand of the room is not considered accordingly in the ventilation strategies.
This study is a continuous work based on previous works and their research limits. This paper proposes and examines different ventilation control strategies based on a low energy residential house built after the German passive house standard. The house is located in New York, US. It includes the influence of different ventilation airflow rates as well as a demand control strategy on the energy-saving potential of the PCM energy storage. First, the energy consumption of the house with PCMVW is compared to the house with VW and SW under different ventilation airflow rates in summer and winter, respectively; the energy demand of the house with PCMVW under constant ventilation airflow rate is then compared to it under demand controlled ventilation strategy.

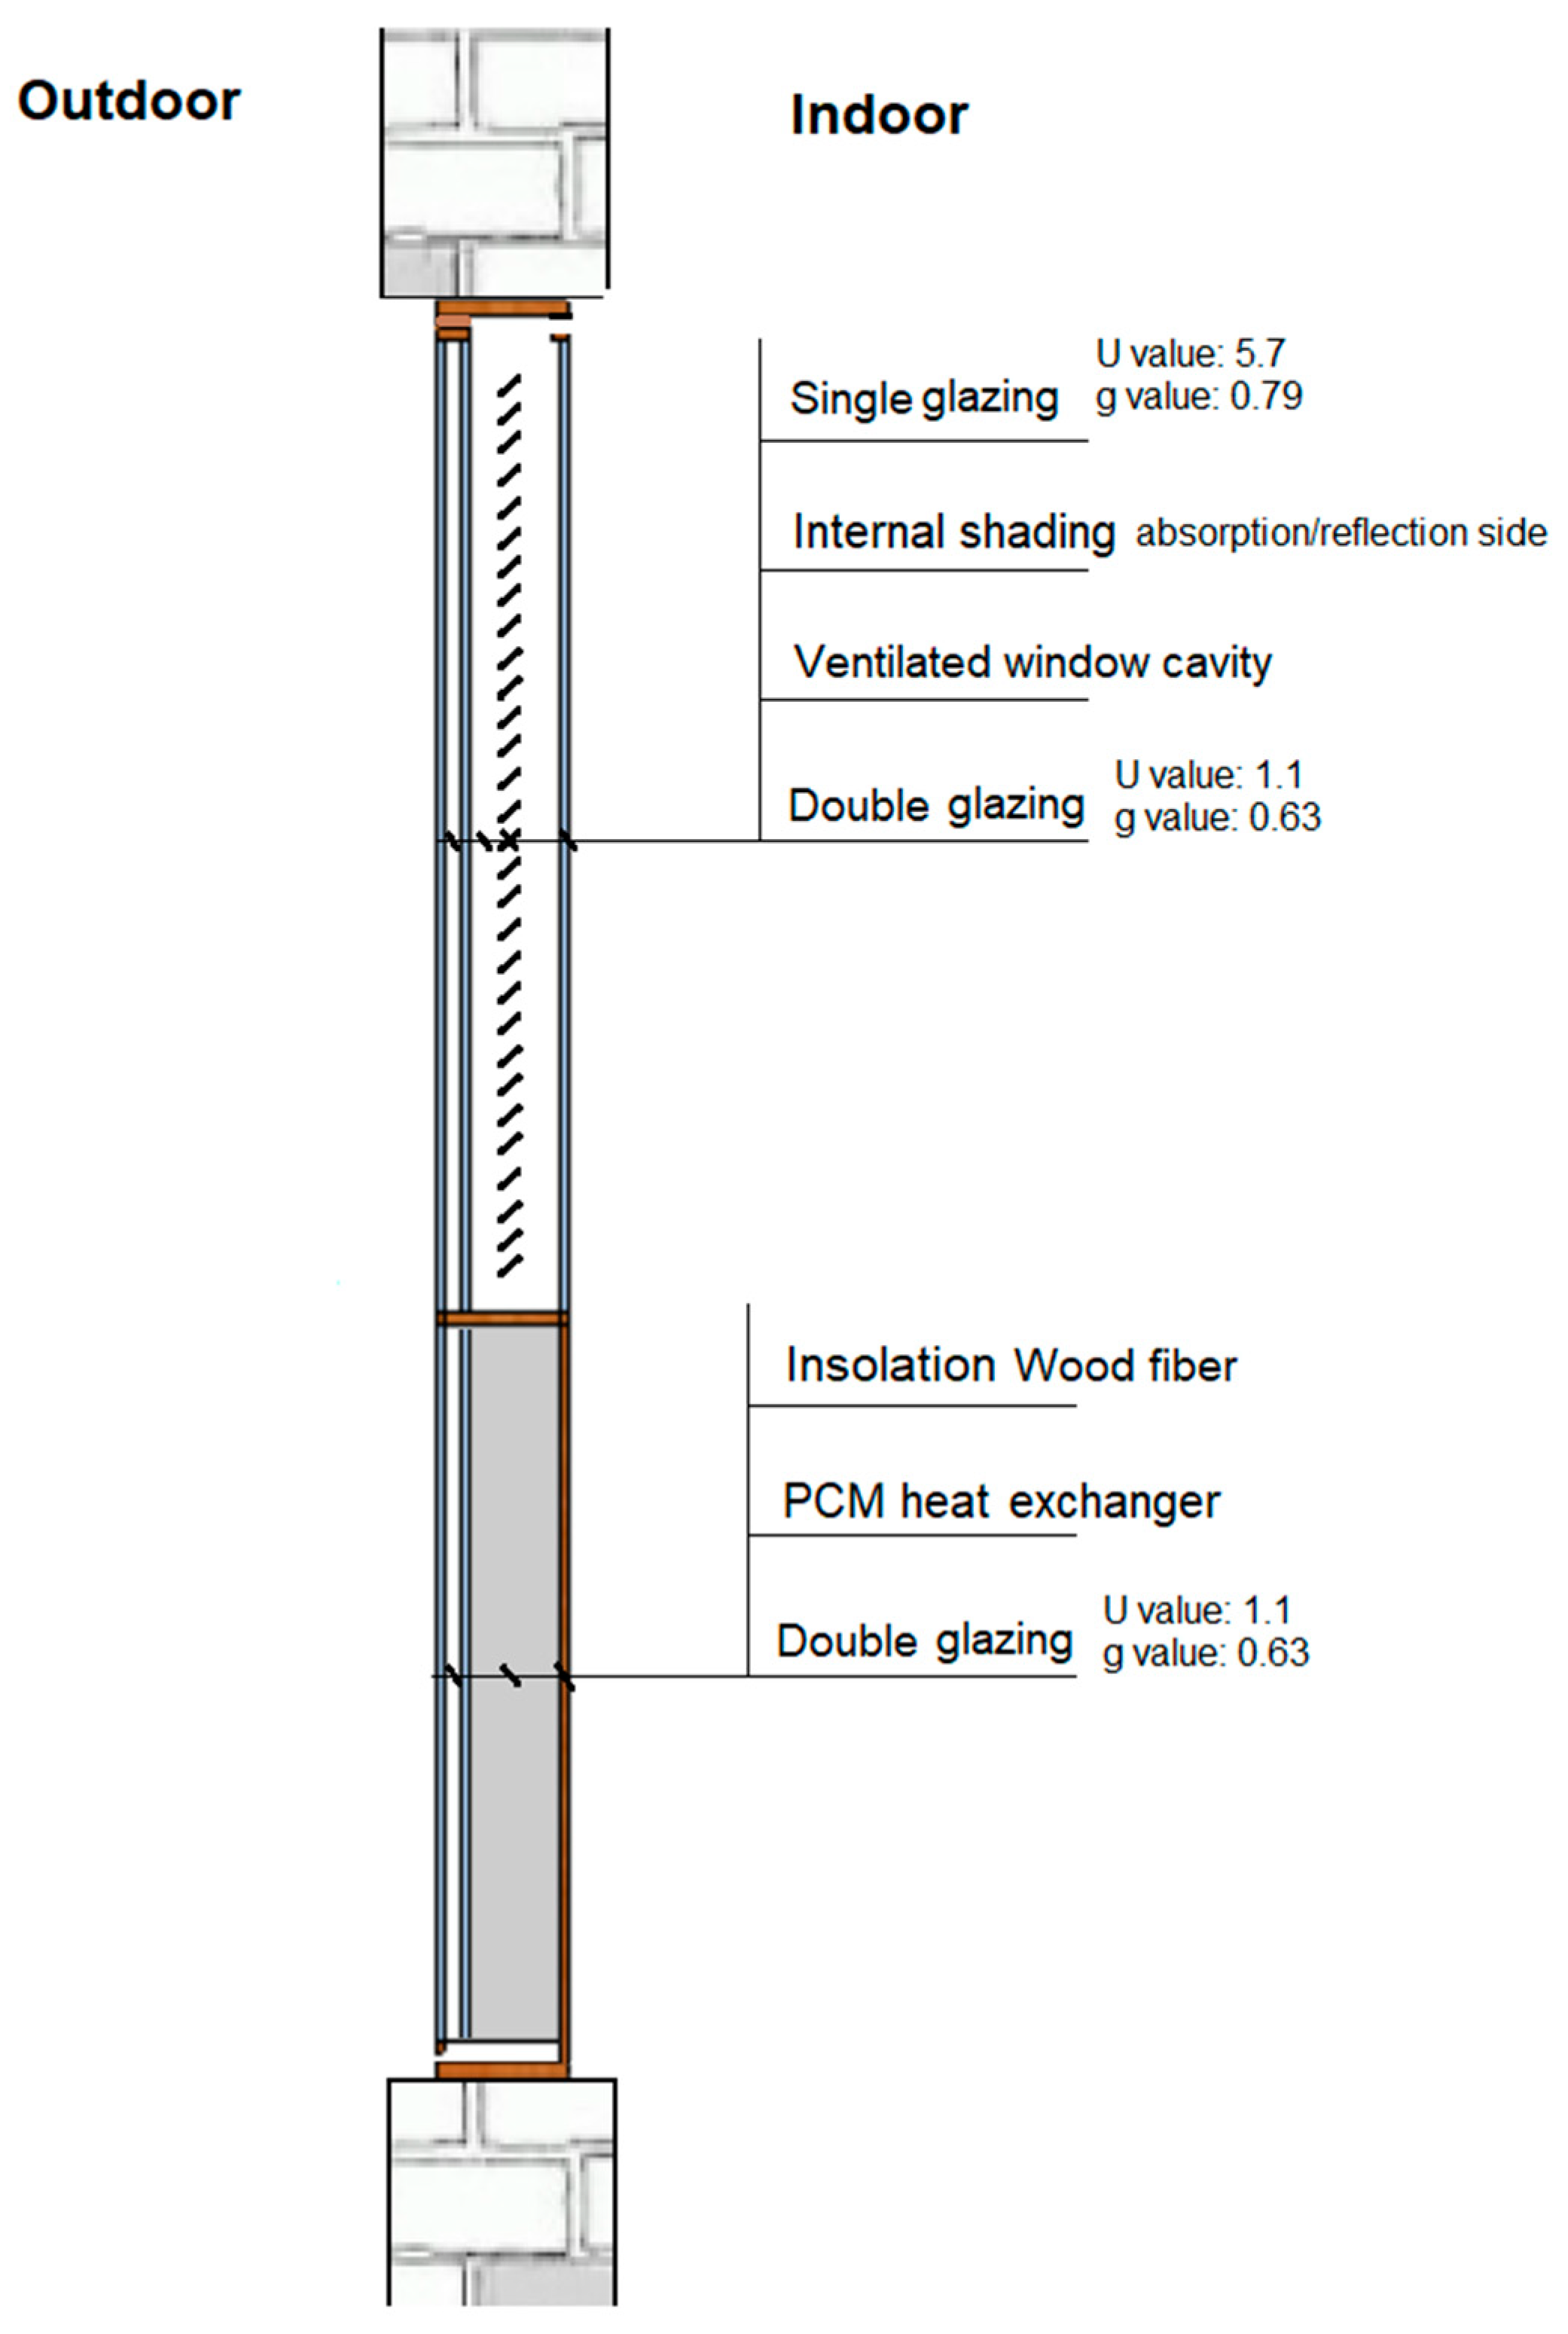
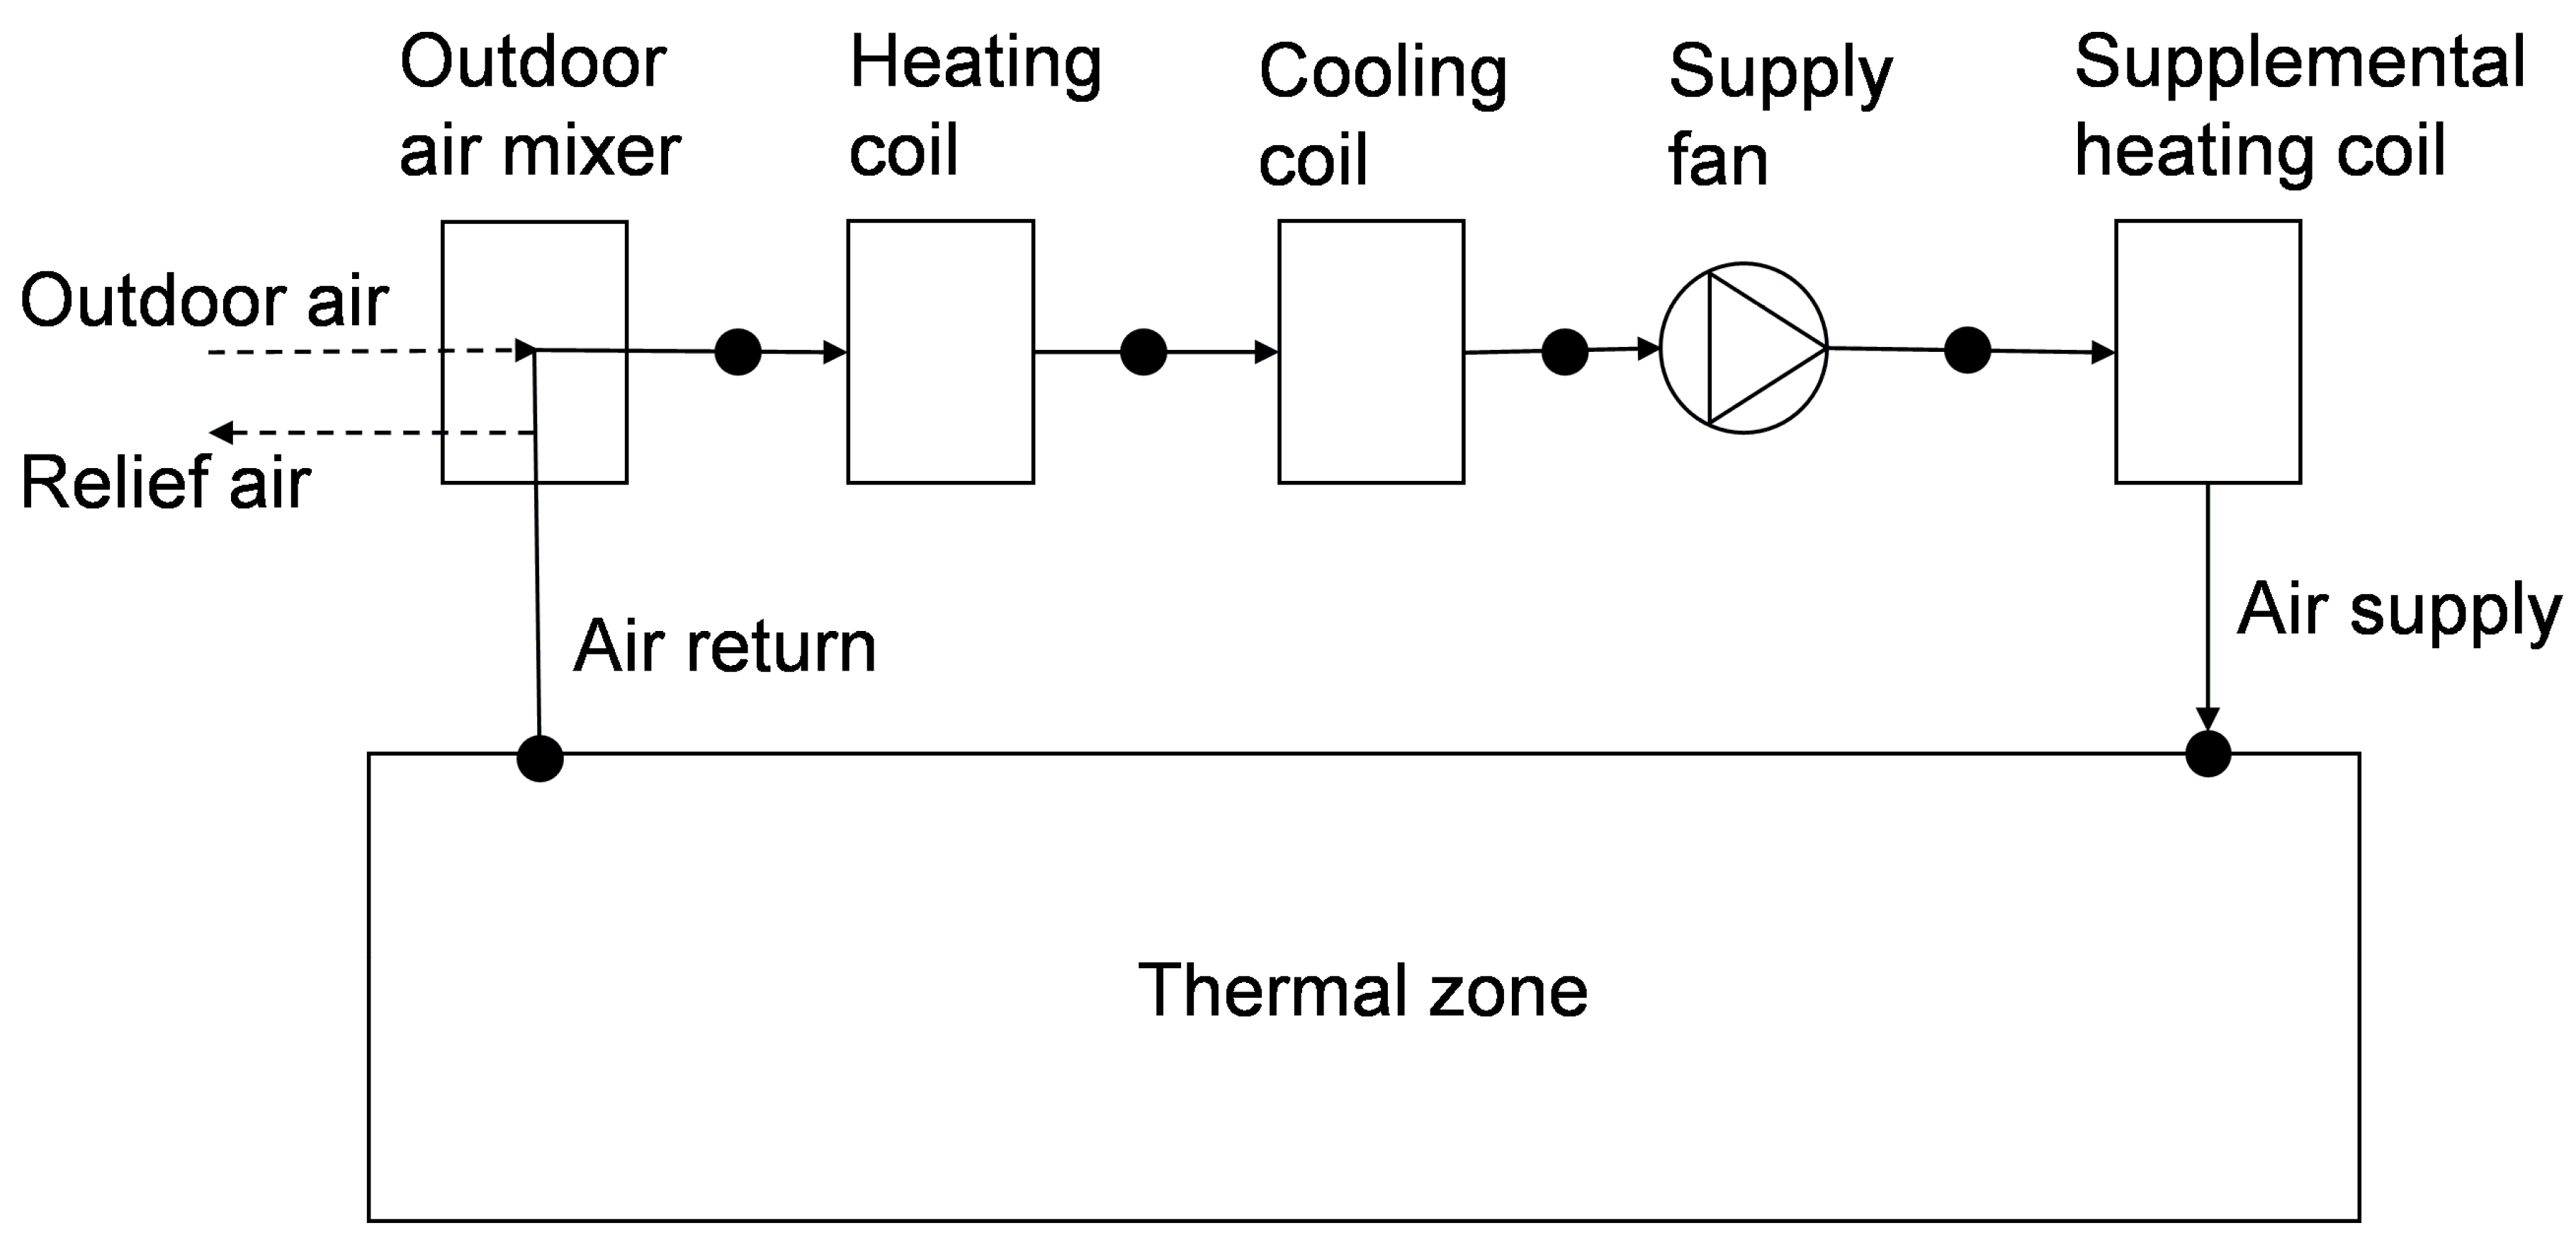
2. System Description

A single floor low energy family house located in New York is studied and modeled in Energyplus. The housing project aims at reducing the embodied carbon footprint for building materials and reaching high indoor environmental quality and thermal comfort with low energy consumption, by applying PCM-enhanced ventilated window and demand control ventilation strategy. The house is built using sustainable straw panel walls and thermal bridging free foundations. The thermal properties of the constructions are given in Table 1. The details of the constructions can be found in [26].
The house uses a PCM energy storage for ventilation pre-cooling/heating for building energy conservation. Each bedroom is equipped with a PCM enhanced ventilation window (PCMVW). The living room is installed with one PCMVW and two PCM energy storage façades. The PCM façade adds extra thermal storage to the room, due to the high energy demand of the room. Figure 2 shows the position of the PCMVW and the PCM panels.
The working principles of the PCMVW and PCM façade are described below:
In summer, the PCM energy storage works as a cooling unit, to provide cooler air to the indoor environment during the day. The working principle of the PCMVW during summer is shown in Figure 3, which includes three ventilation modes:
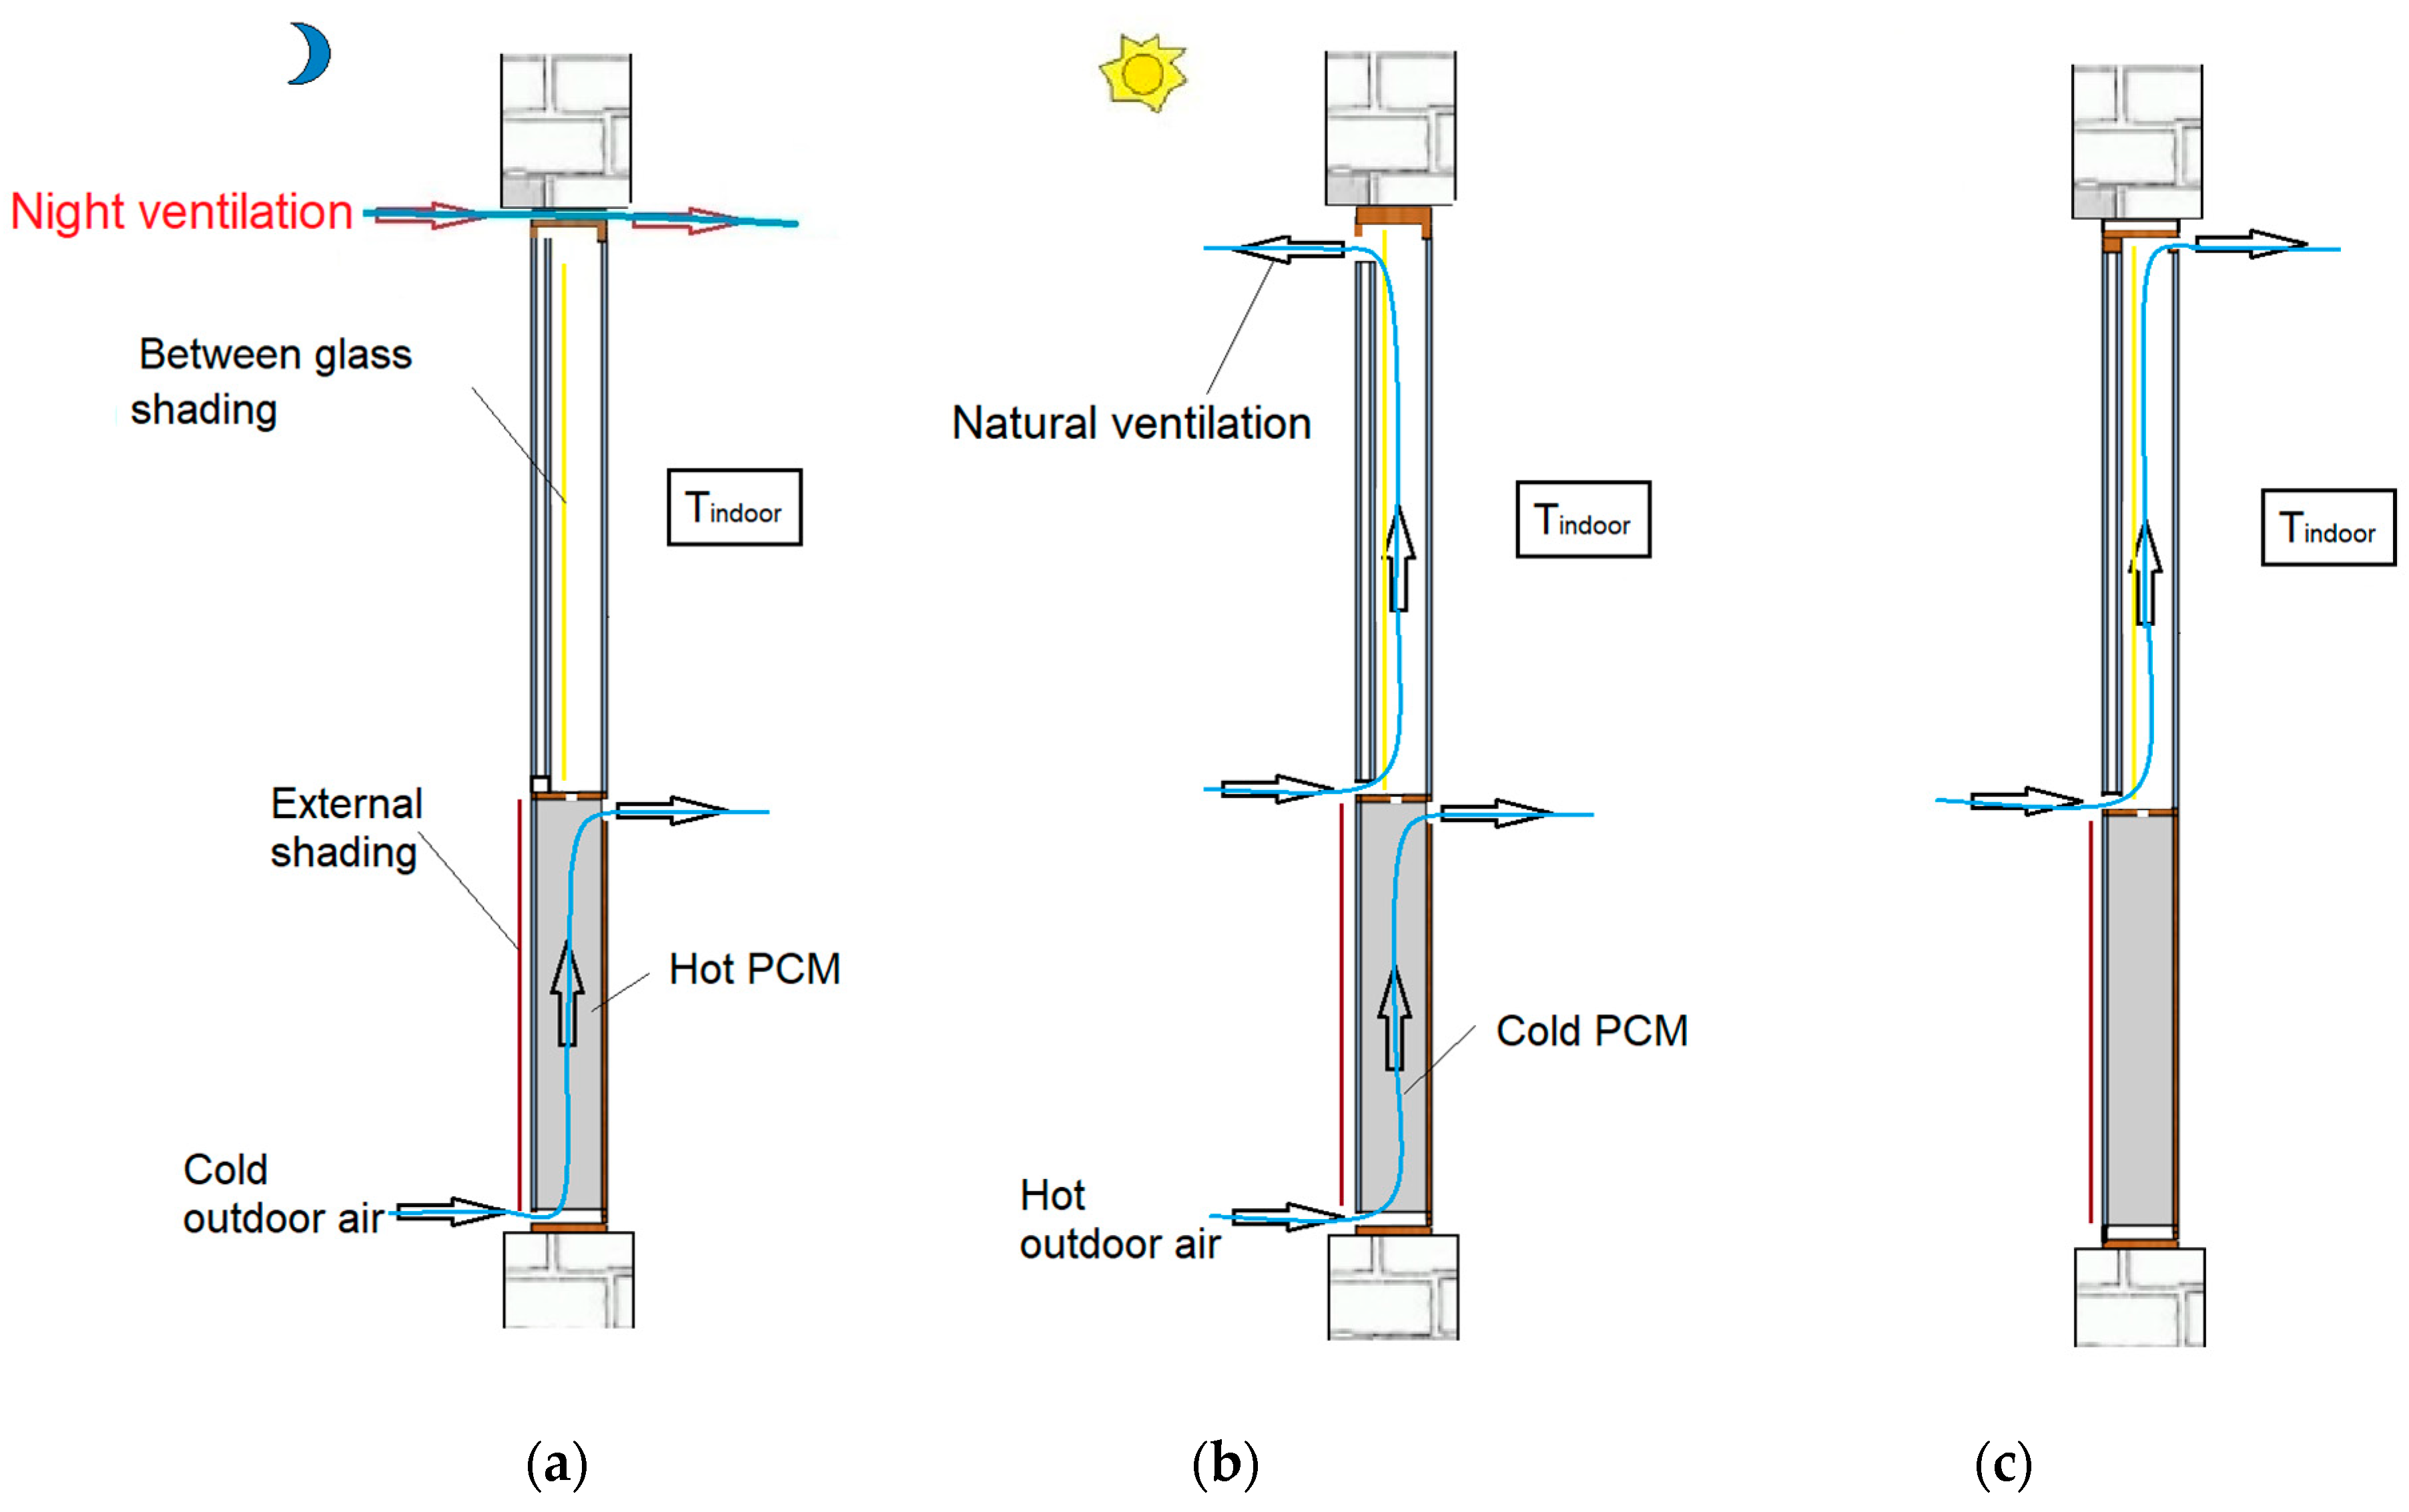
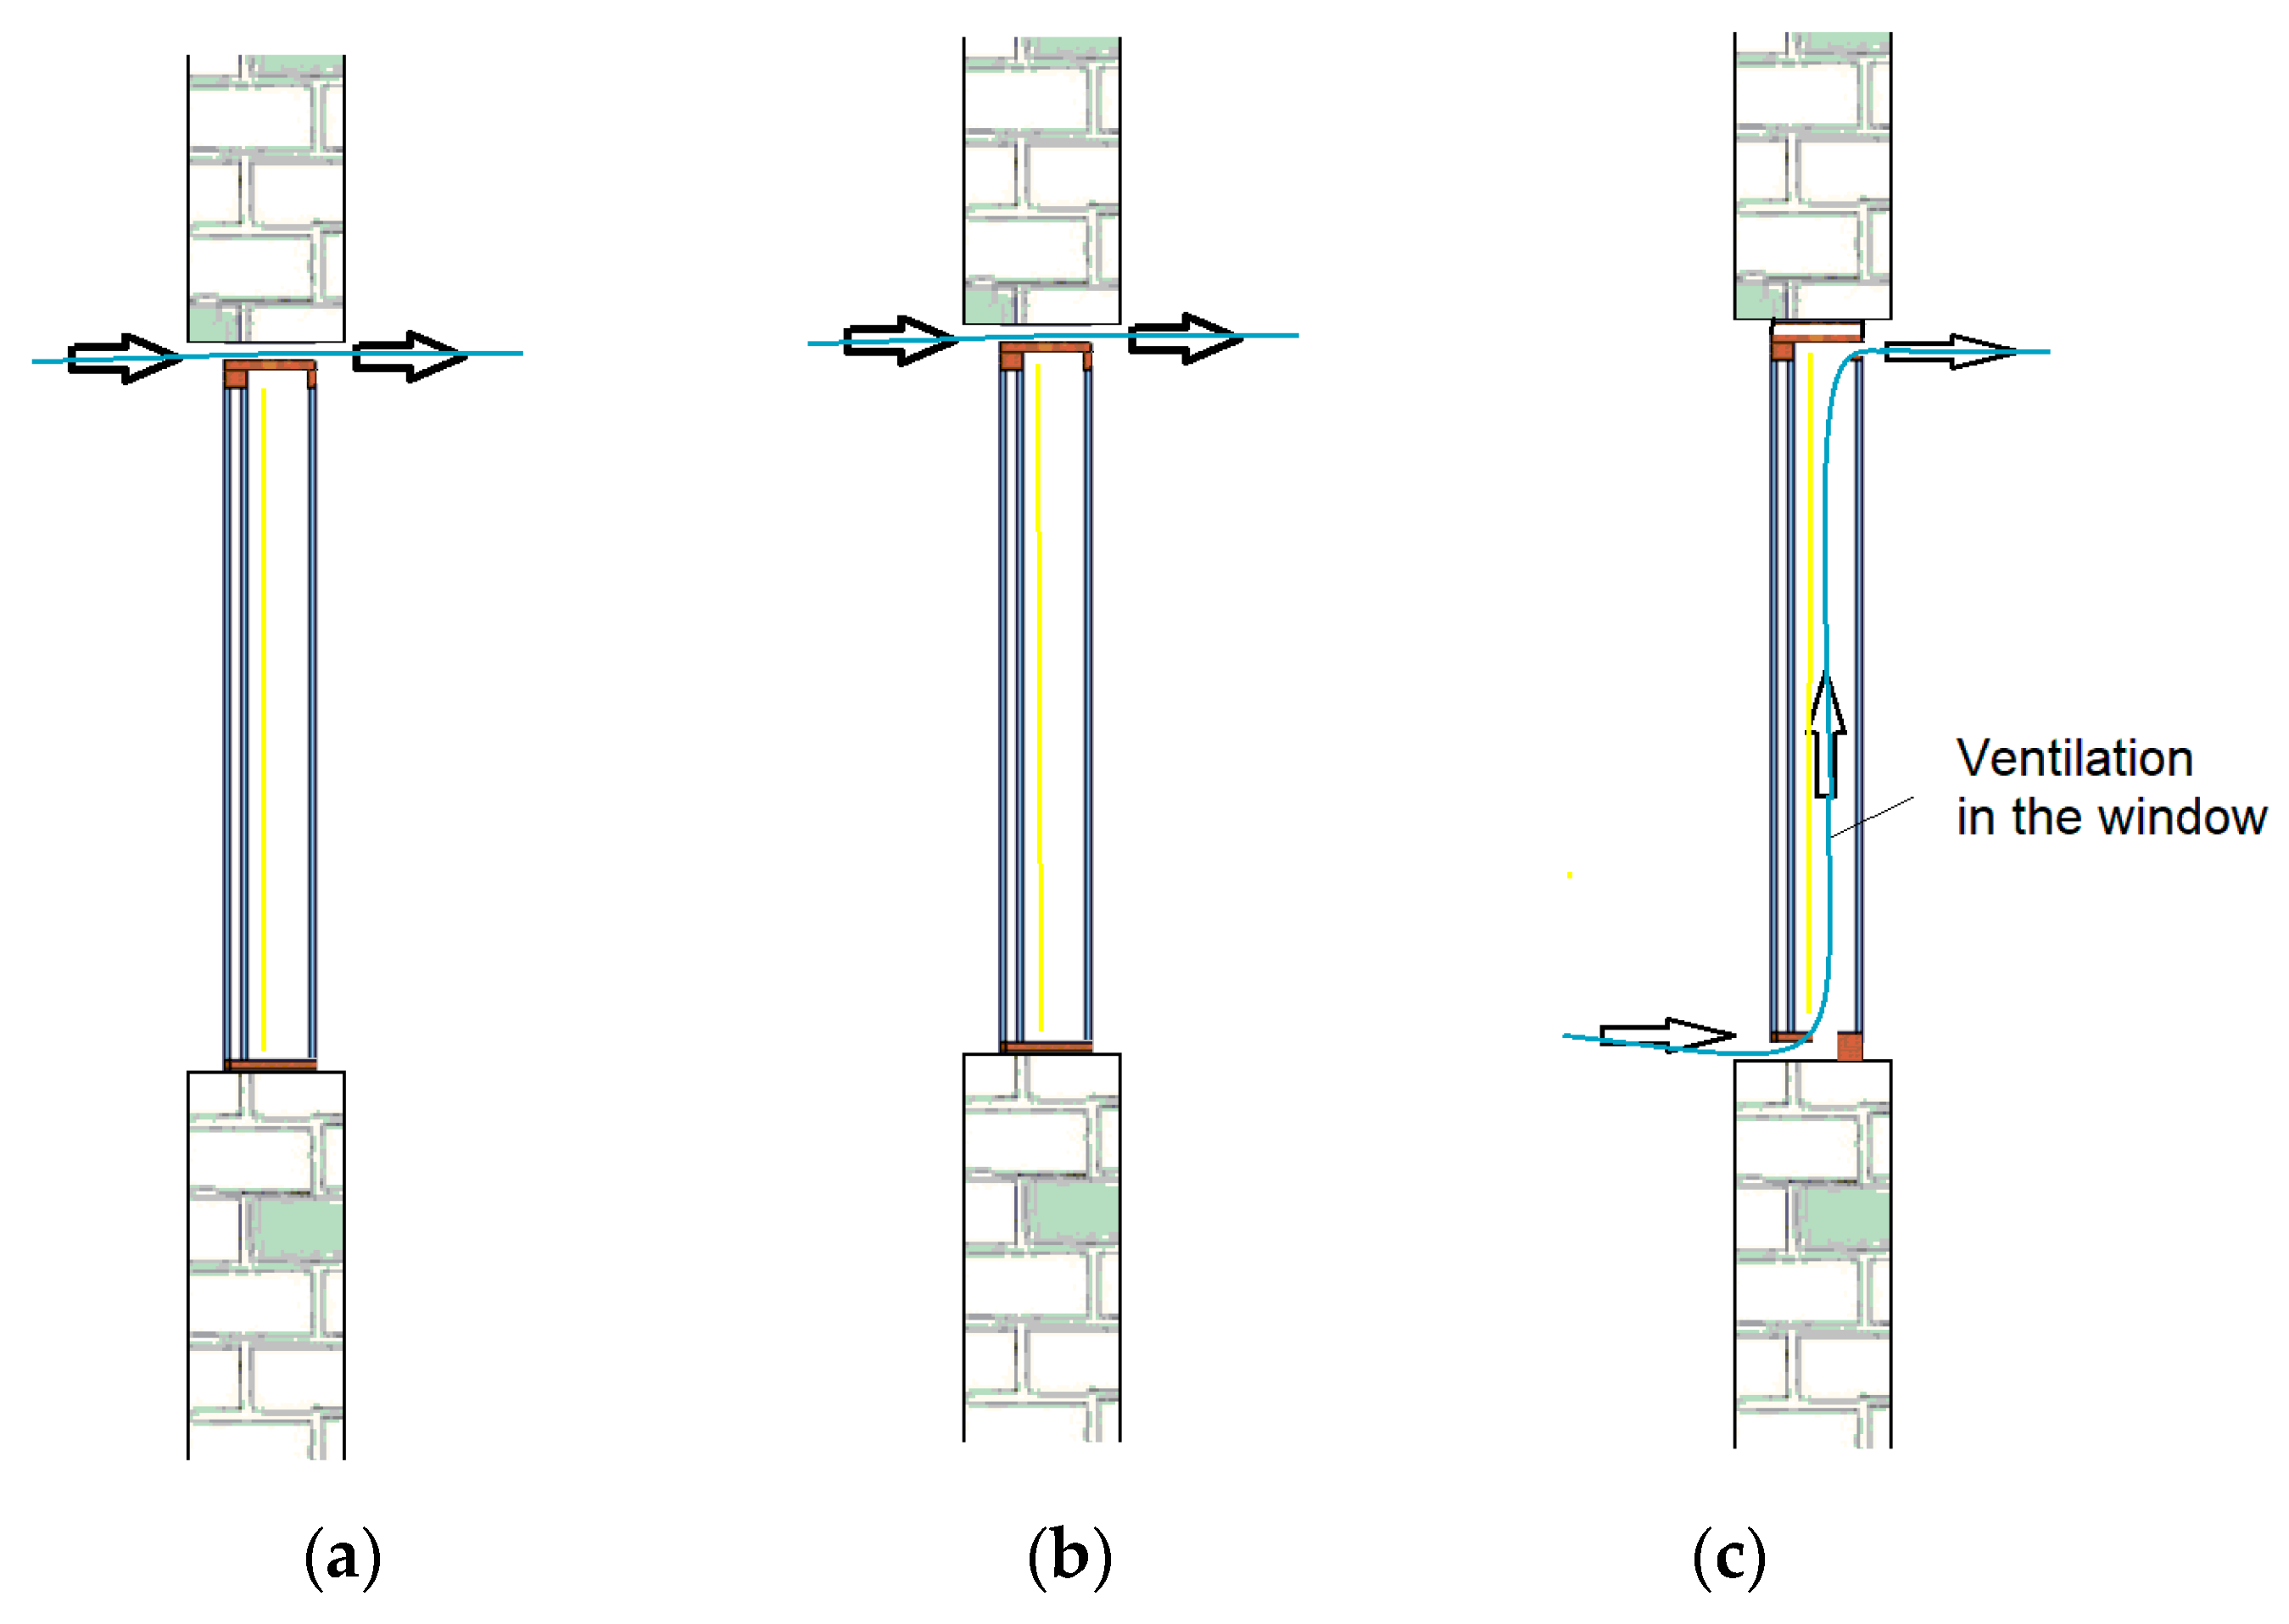
  • The PCM energy storage discharge mode (Figure 3a), which is in operation at night, where energy is discharged by the cold outdoor air, to remove the heat stored in the PCM during the previous operation mode.
  • The ventilation pre-cooling mode (Figure 3b), which is operated during the day, when the indoor air temperature is high, and ventilation pre-cooling is needed. The relatively hot ambient air is ventilated through the cool PCM energy storage before being supplied to the indoor room; meanwhile, by natural ventilation outdoor airflow through the VW, heat accumulated in the window cavity is removed.
  • The heat mode (Figure 3c), which is operated when the indoor room is overcooled. In this mode, outdoor air for ventilation is supplied through the VW, where it is heated up in the window cavity.
The PCM energy storage façade works similar to that of the PCMVW. The working principle of the PCM façade is shown in Figure 4. It includes three ventilation modes:
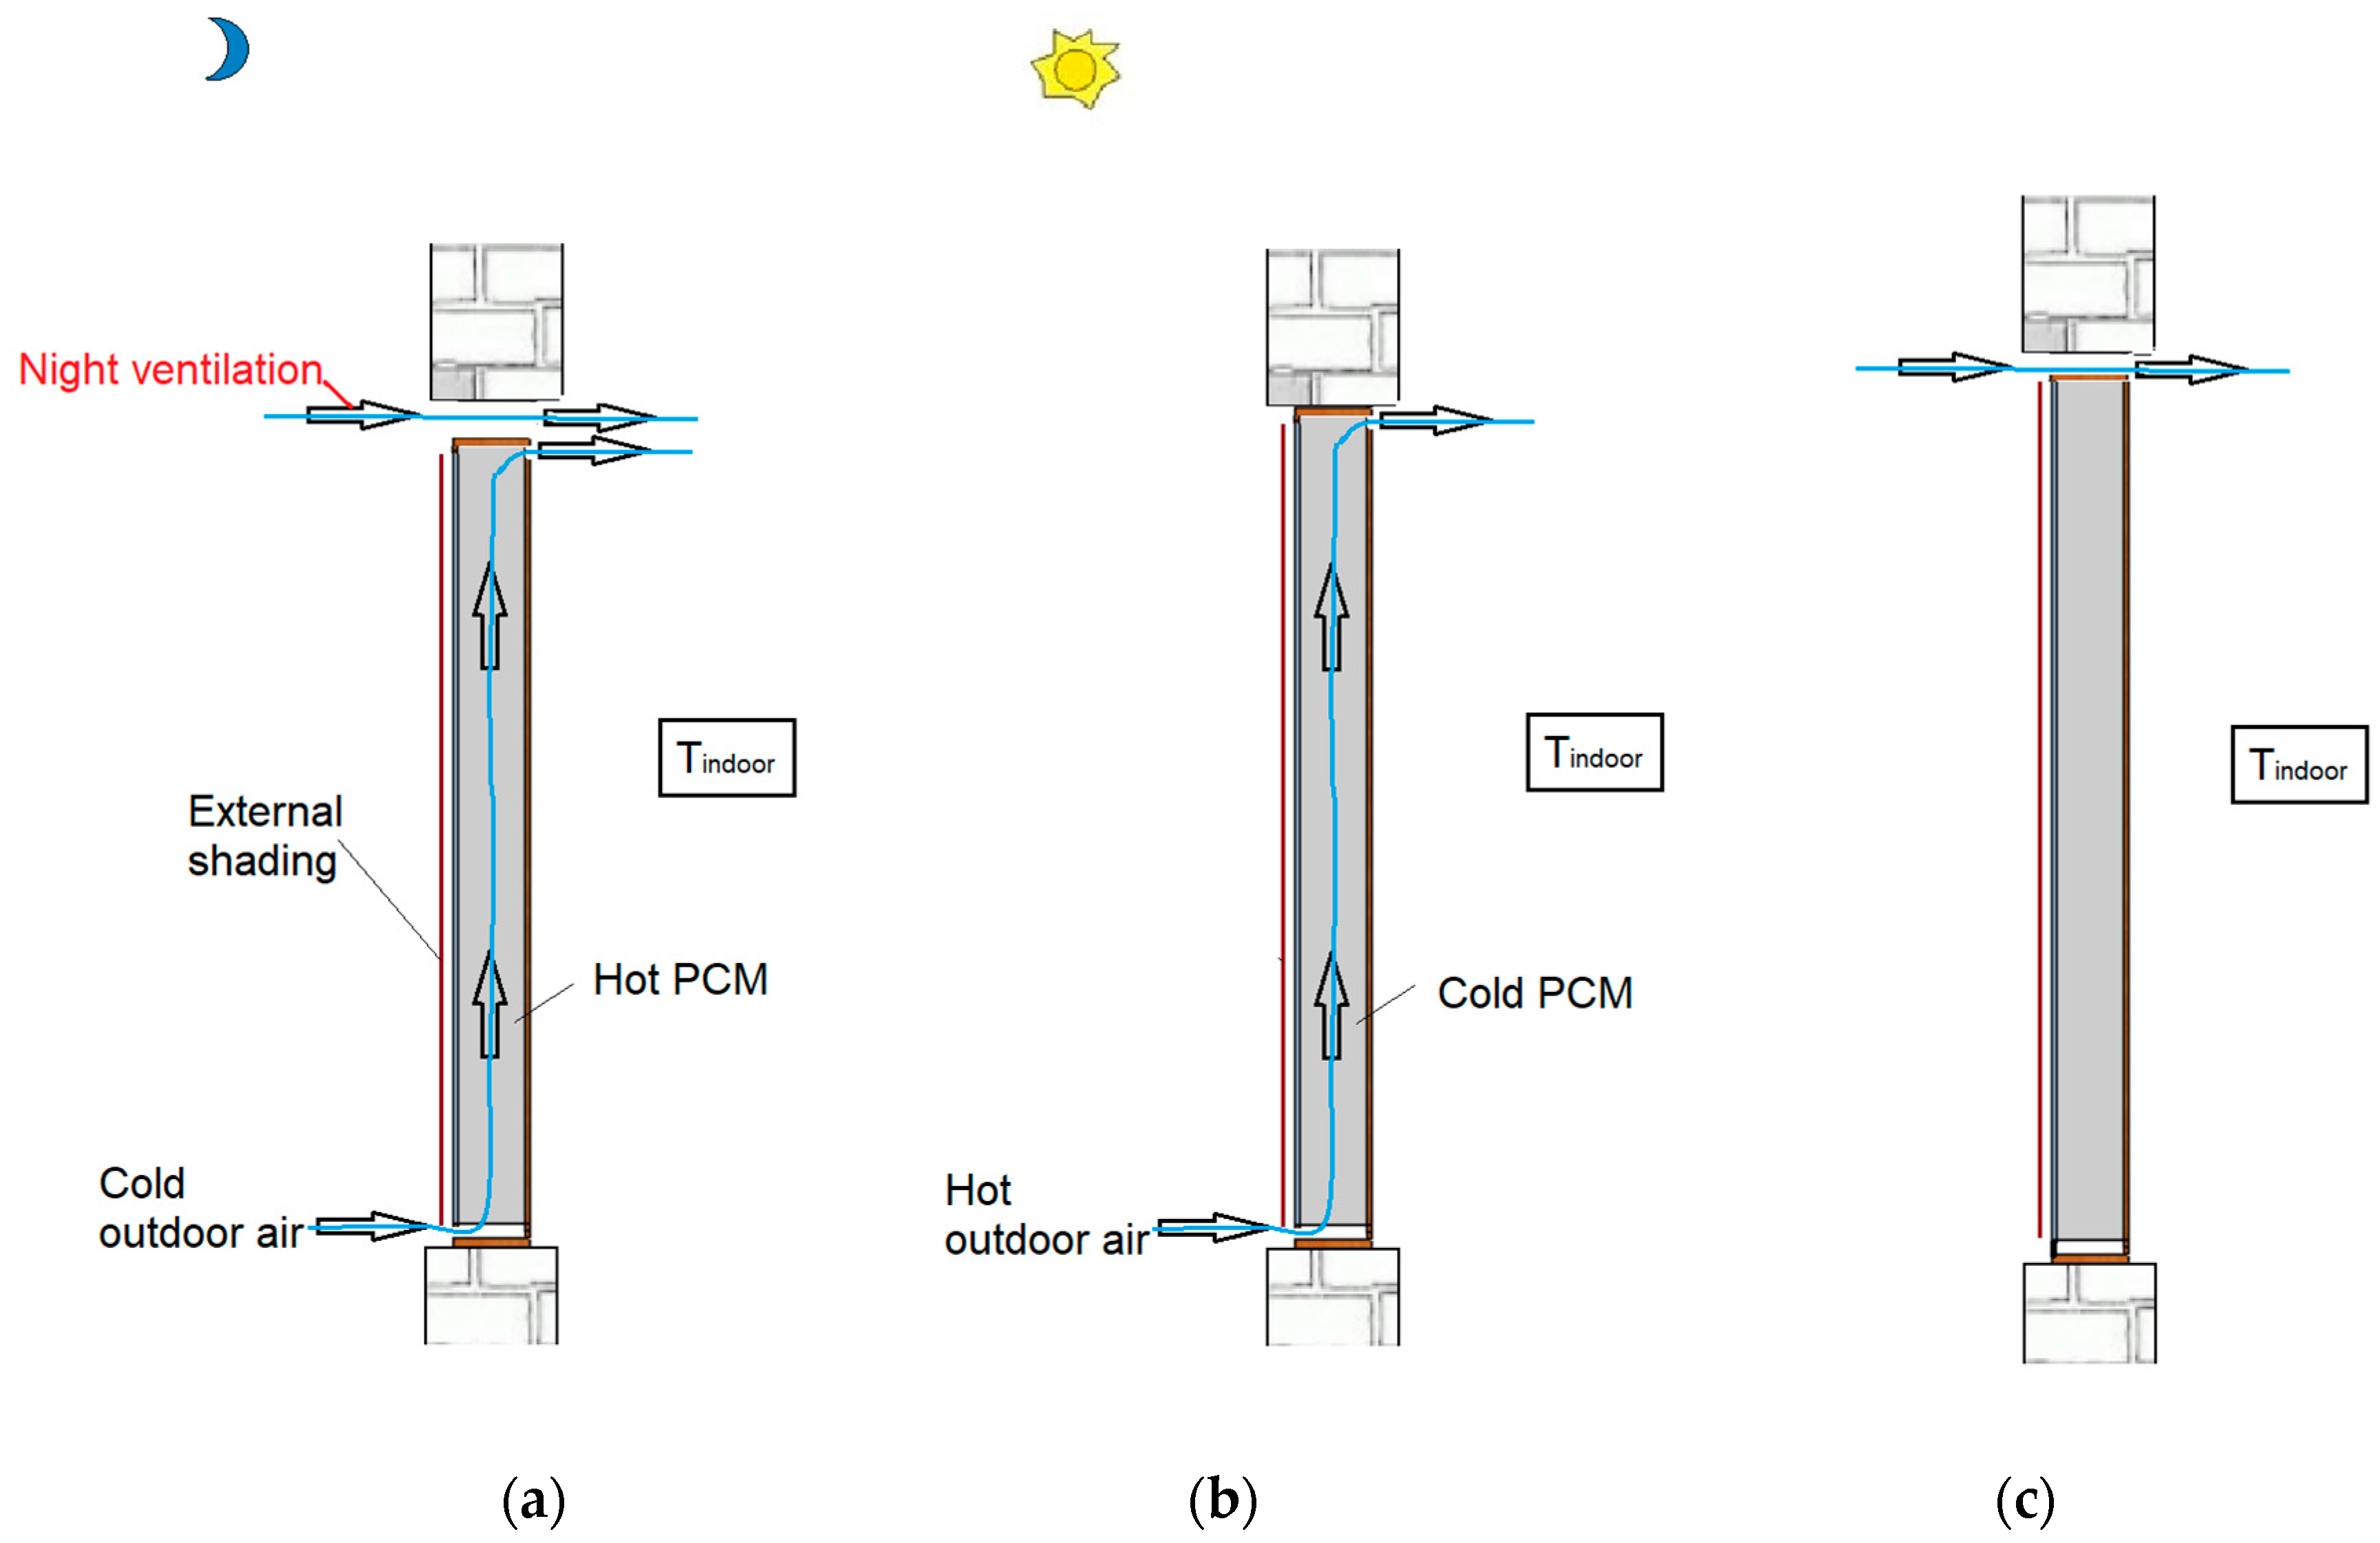
  • The PCM energy storage discharge mode (Figure 4a). At night, the relatively low-temperature ambient air is supplied through the PCM façade to discharge the heat in the PCM energy storage. Meanwhile, bypass night ventilation is also in operation, to cover the cooling demand of the room during the night.
  • Ventilation pre-cooling mode (Figure 4b). It operates when the indoor air temperature is too high, and ventilation pre-cooling is needed. The relatively high-temperature outdoor air is supplied through the cooler PCM energy storage plates, where it is cooled before being supplied to the room.
  • The bypass mode (Figure 4c). It operates when the indoor room is overcooled. The ventilation goes directly from the outdoors to the room.
Furthermore, the PCMVW provides pre-heated air to the indoor environment during winter. The PCM works as solar energy storage. The working principle of the PCMVW during winter includes three modes:
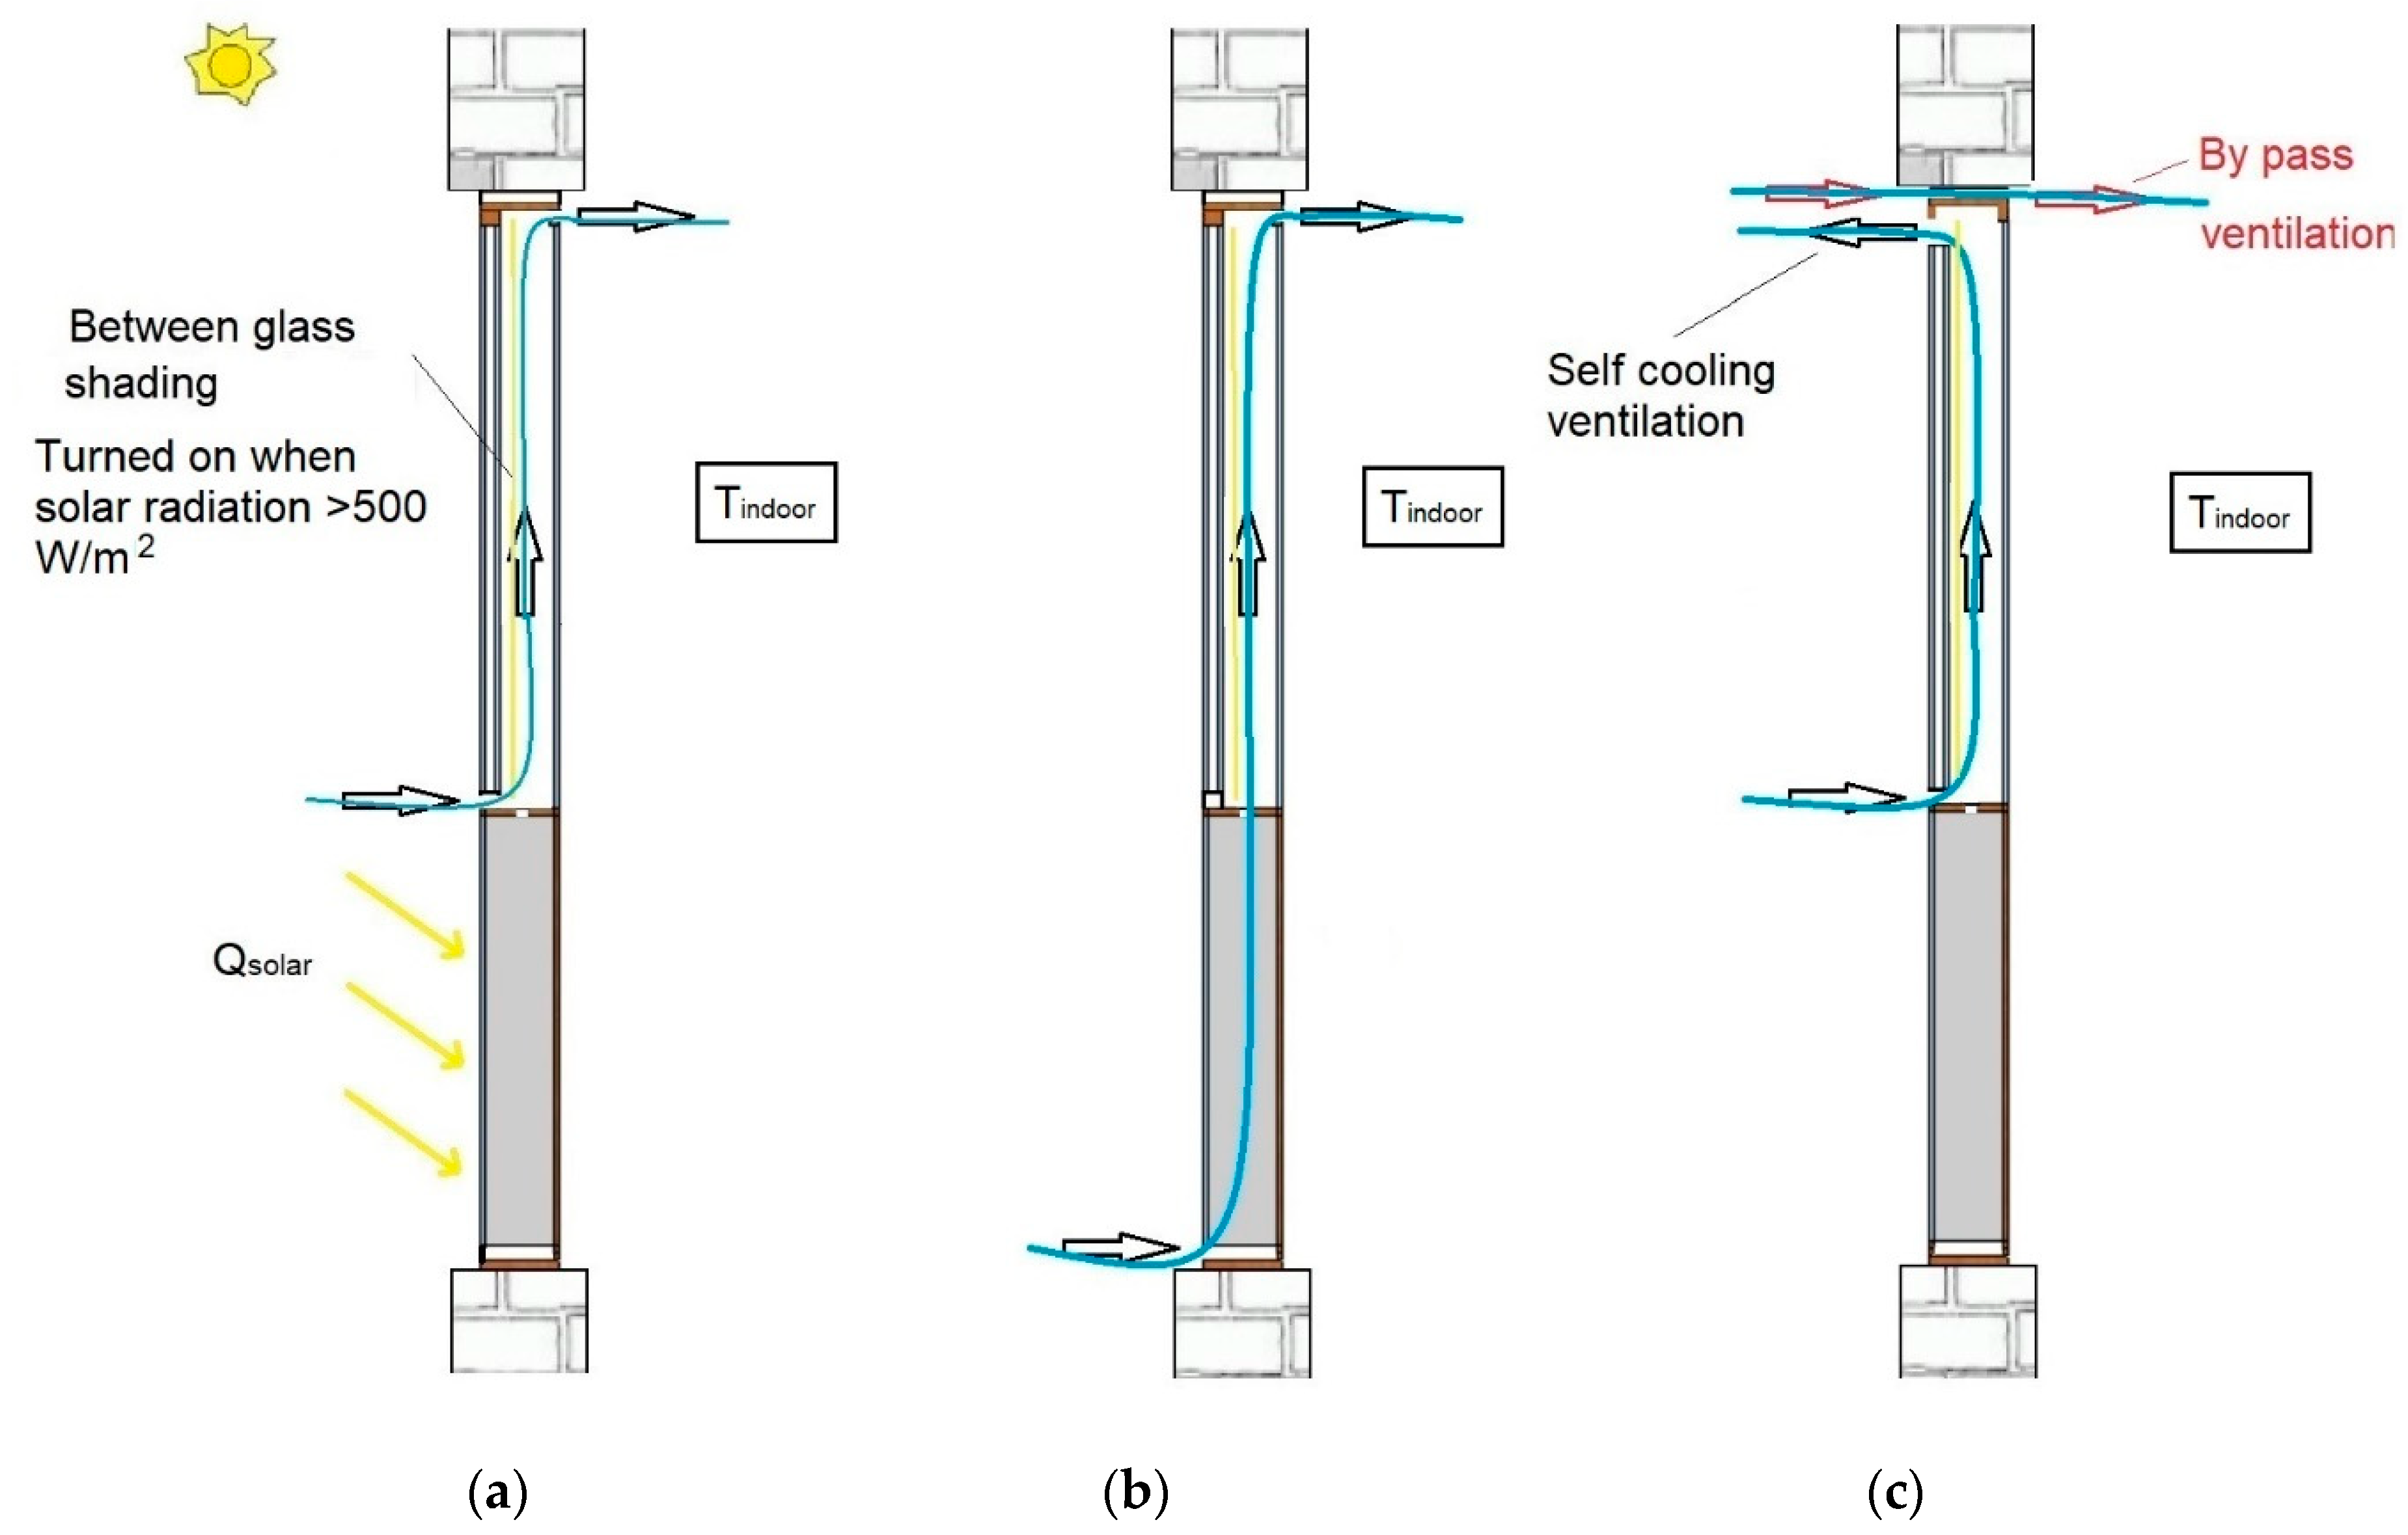
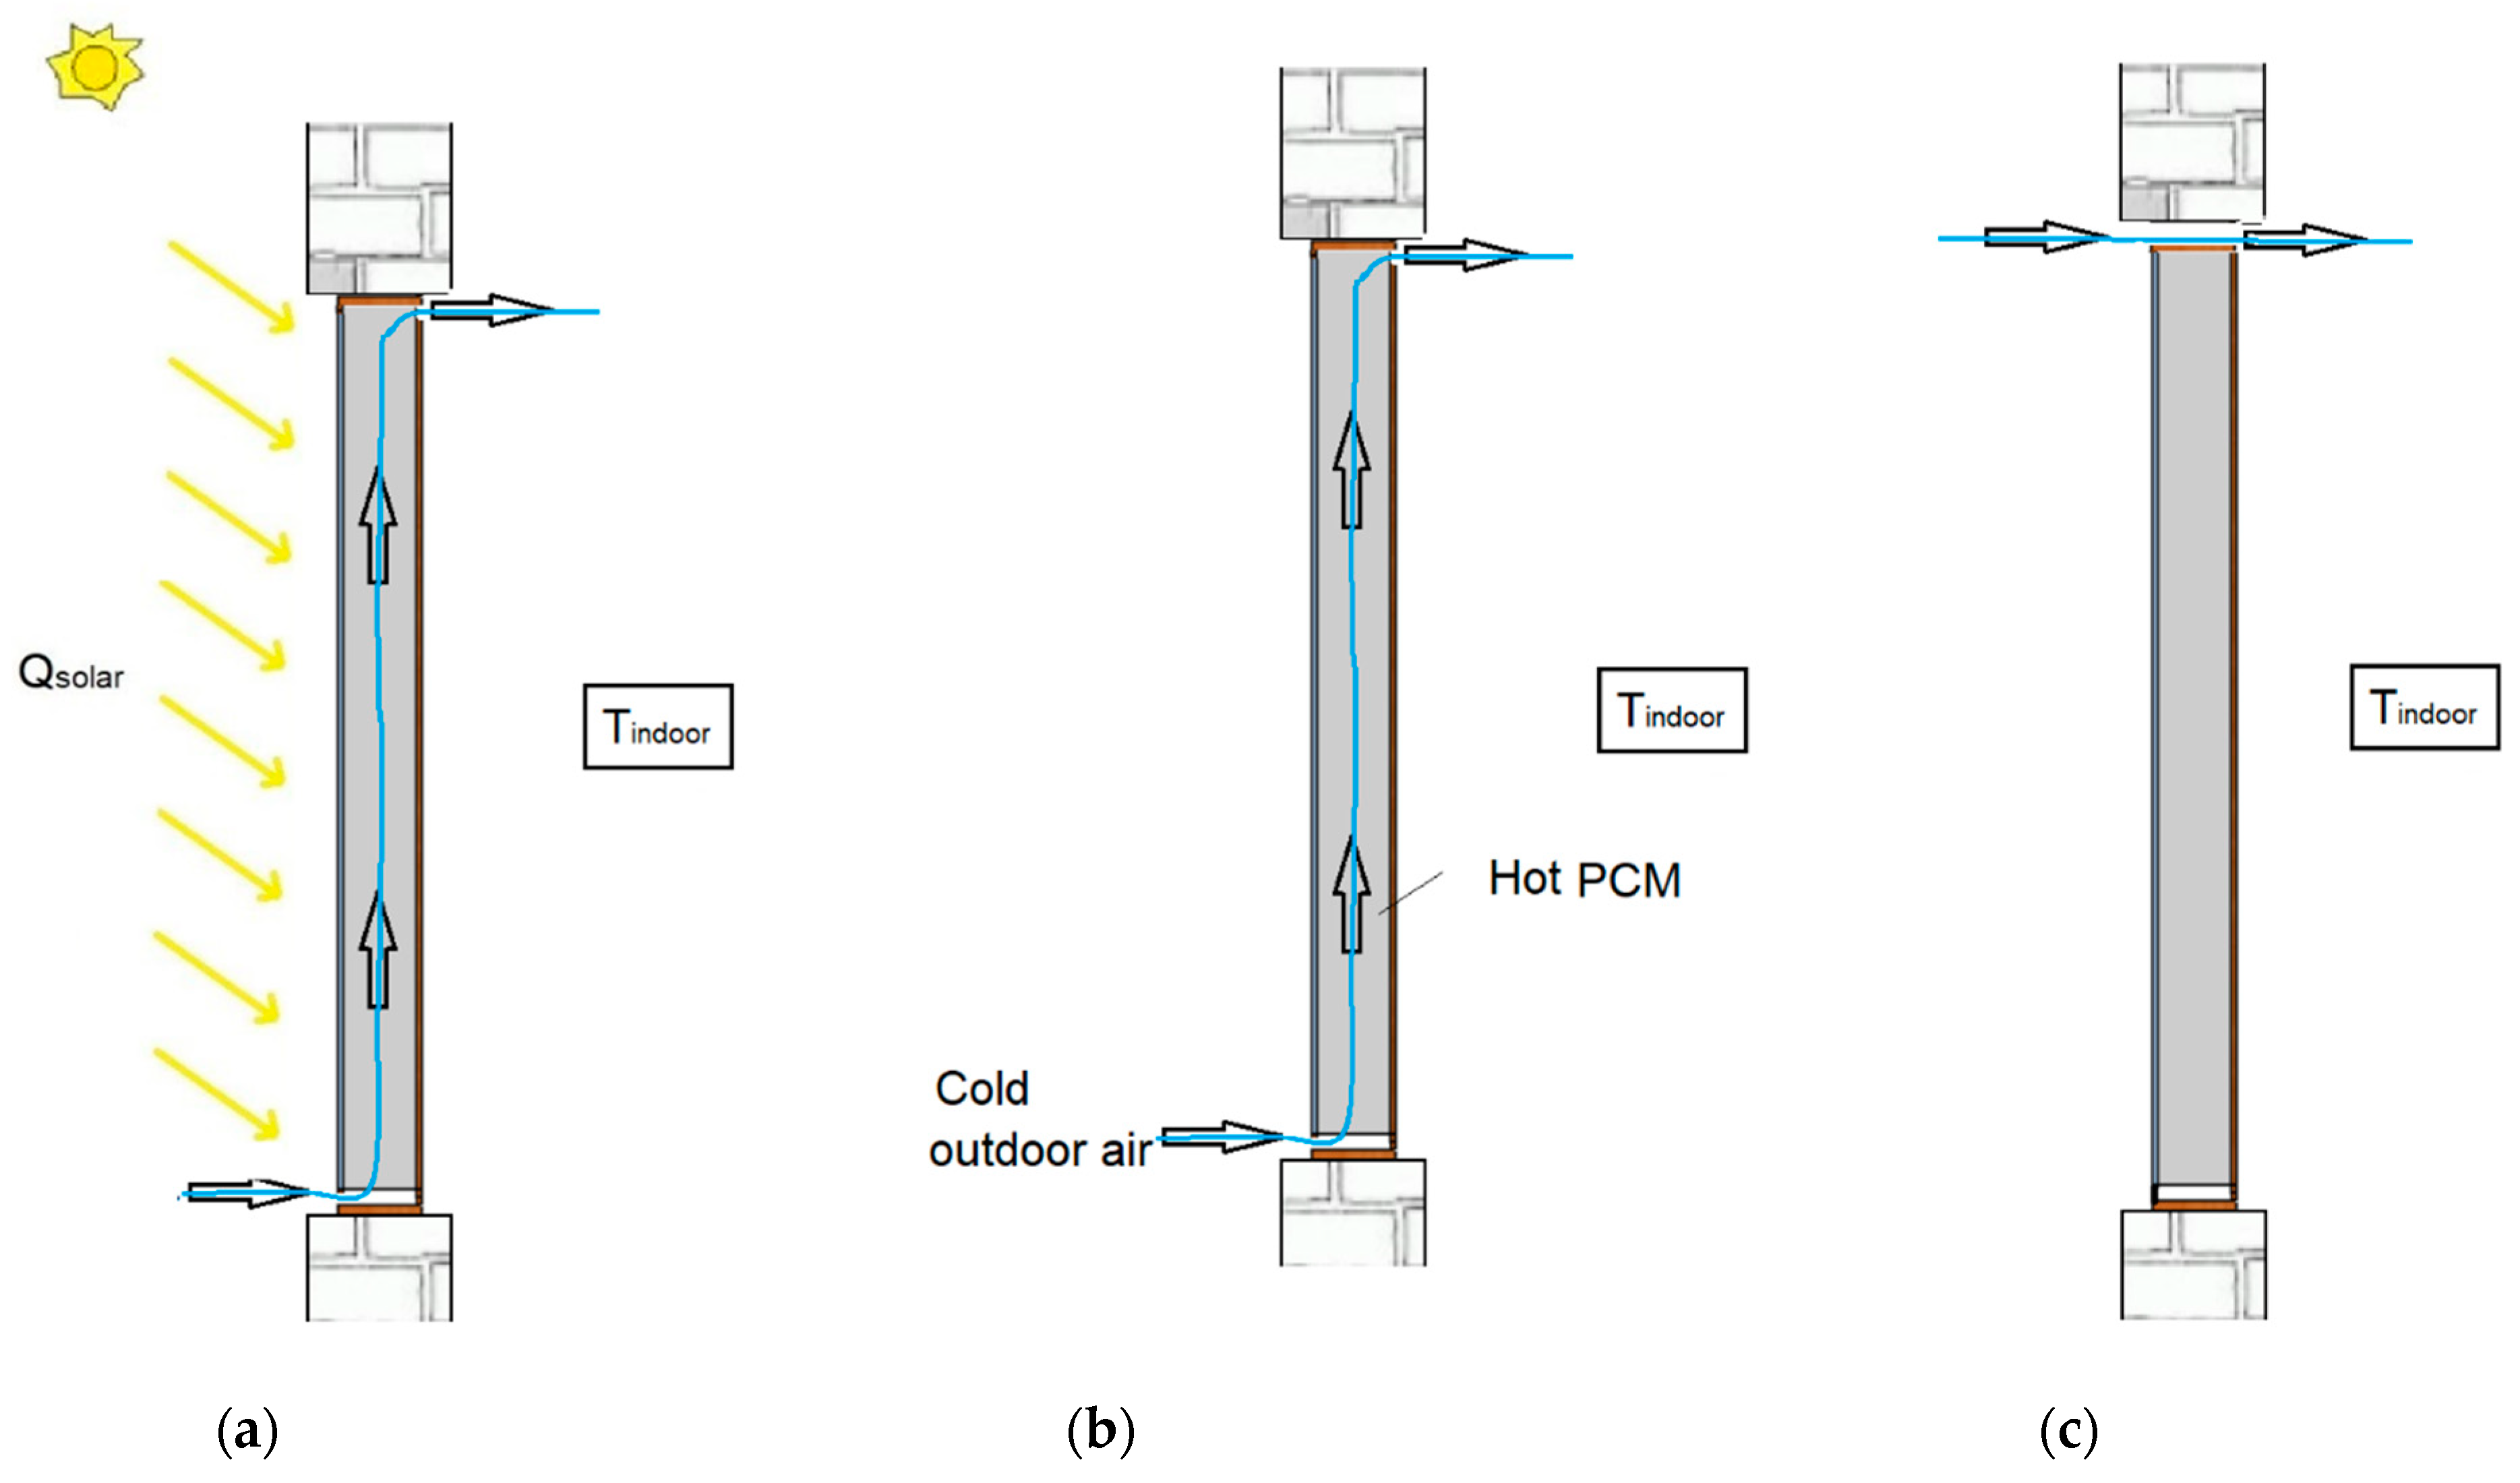
  • The heat storage mode (Figure 5a). The PCM stores solar energy during the day when solar radiation is high. The ventilation air flows through the VW before being supplied to the room, and is heated up in the window cavity.
  • The heat release mode (Figure 5b). It operates when the indoor air temperature is low and ventilation pre-heating is needed. The ventilation air flows through the PCM energy storage and the VW before being supplied to the room, and is heated up in both the PCM energy storage and the VW cavity.
  • The overheating preventing mode (Figure 5c). This mode is turned on when the indoor environment is overheated. The ventilation airflow is provided by bypass ventilation, where outdoor air is supplied directly to the room. Meanwhile, the VW is cooled by self-cooling natural ventilation.
The PCM energy storage façade works similarly to the PCMVW in winter. It has three operation modes:
  • The heat storage mode (Figure 6a). In this mode, outdoor solar radiation is high. The PCM energy storage has a temperature rise due to solar radiation.
  • The heat release mode (Figure 6b). When the indoor air temperature is low, the ventilation air flows through the PCM façade before it is supplied to the room, and is heated up by the warm PCM energy storage.
  • The bypass ventilation mode (Figure 6c). When the room is overheated, the bypass ventilation airflow is operated, where the relatively low-temperature ambient air is supplied directly to the room.
The PCM used is paraffin wax, which has a melting range of 16–23 °C and a freezing range of 14–21.5 °C. The PCM changes its phase in the melting range and freezing range. The melting peak of the PCM is 21.5 °C and freezing peak is 20.7 °C. The total heat capacity is 117 kJ/kg in the temperature range of [10–30 °C], which is measured by Differential Scanning Calorimetry (DSC) with a heating/cooling rate of 0.5 °C/min. The specific heat of the material is 2.3 kJ/kg/°C. The density of the PCM is 820 kg/m3. Please refer to [15] for more details on PCM thermal properties.
The PCM energy storage is made by parallel PCM fiberboards. The thickness of the fiberboards is 12.5 mm. The depth is 90 mm. The thickness of the gaps between the two boards is 5 mm. The PCM amount for each room is shown in Table 2.
The ventilation window (VW) is made by a double glazing pane, a single glazing pane, and a ventilated cavity with solar shading integrated into the cavity. A double glazing pane is also used for the surface of the PCM energy storage both for the VW and the façade and is equipped with an external shading device. The rest of the windows and glass doors are made by triple glass panes with integrated solar shading devices. The window properties and shading properties are shown in Table 3 and Table 4.
The Energyplus model uses Conduction Finite Difference (CondFD) heat balance algorithm for phase change material, which allows shorter time steps and changeable thermal properties than the conduction transfer function (CTF) algorithm. The model was verified by the experiment, which can be found in [14].
The house is equipped with a Packaged Terminal Heat Pump. The average heat pump heating coil COP is 2.87, and the average cooling coil COP is 1.87. The supply fan total efficiency is 0.7. Figure 7 shows a sketch of the heat pump system [27].
The room temperature set points are 22 °C and 26 °C for summer and winter, respectively. The weather data of New York from Typical Meteorological Year is used for the simulation. The data can be found in the EnergyPlus homepage [28]. Figure 8 shows the yearly outdoor air dry bulb temperature and solar radiation.

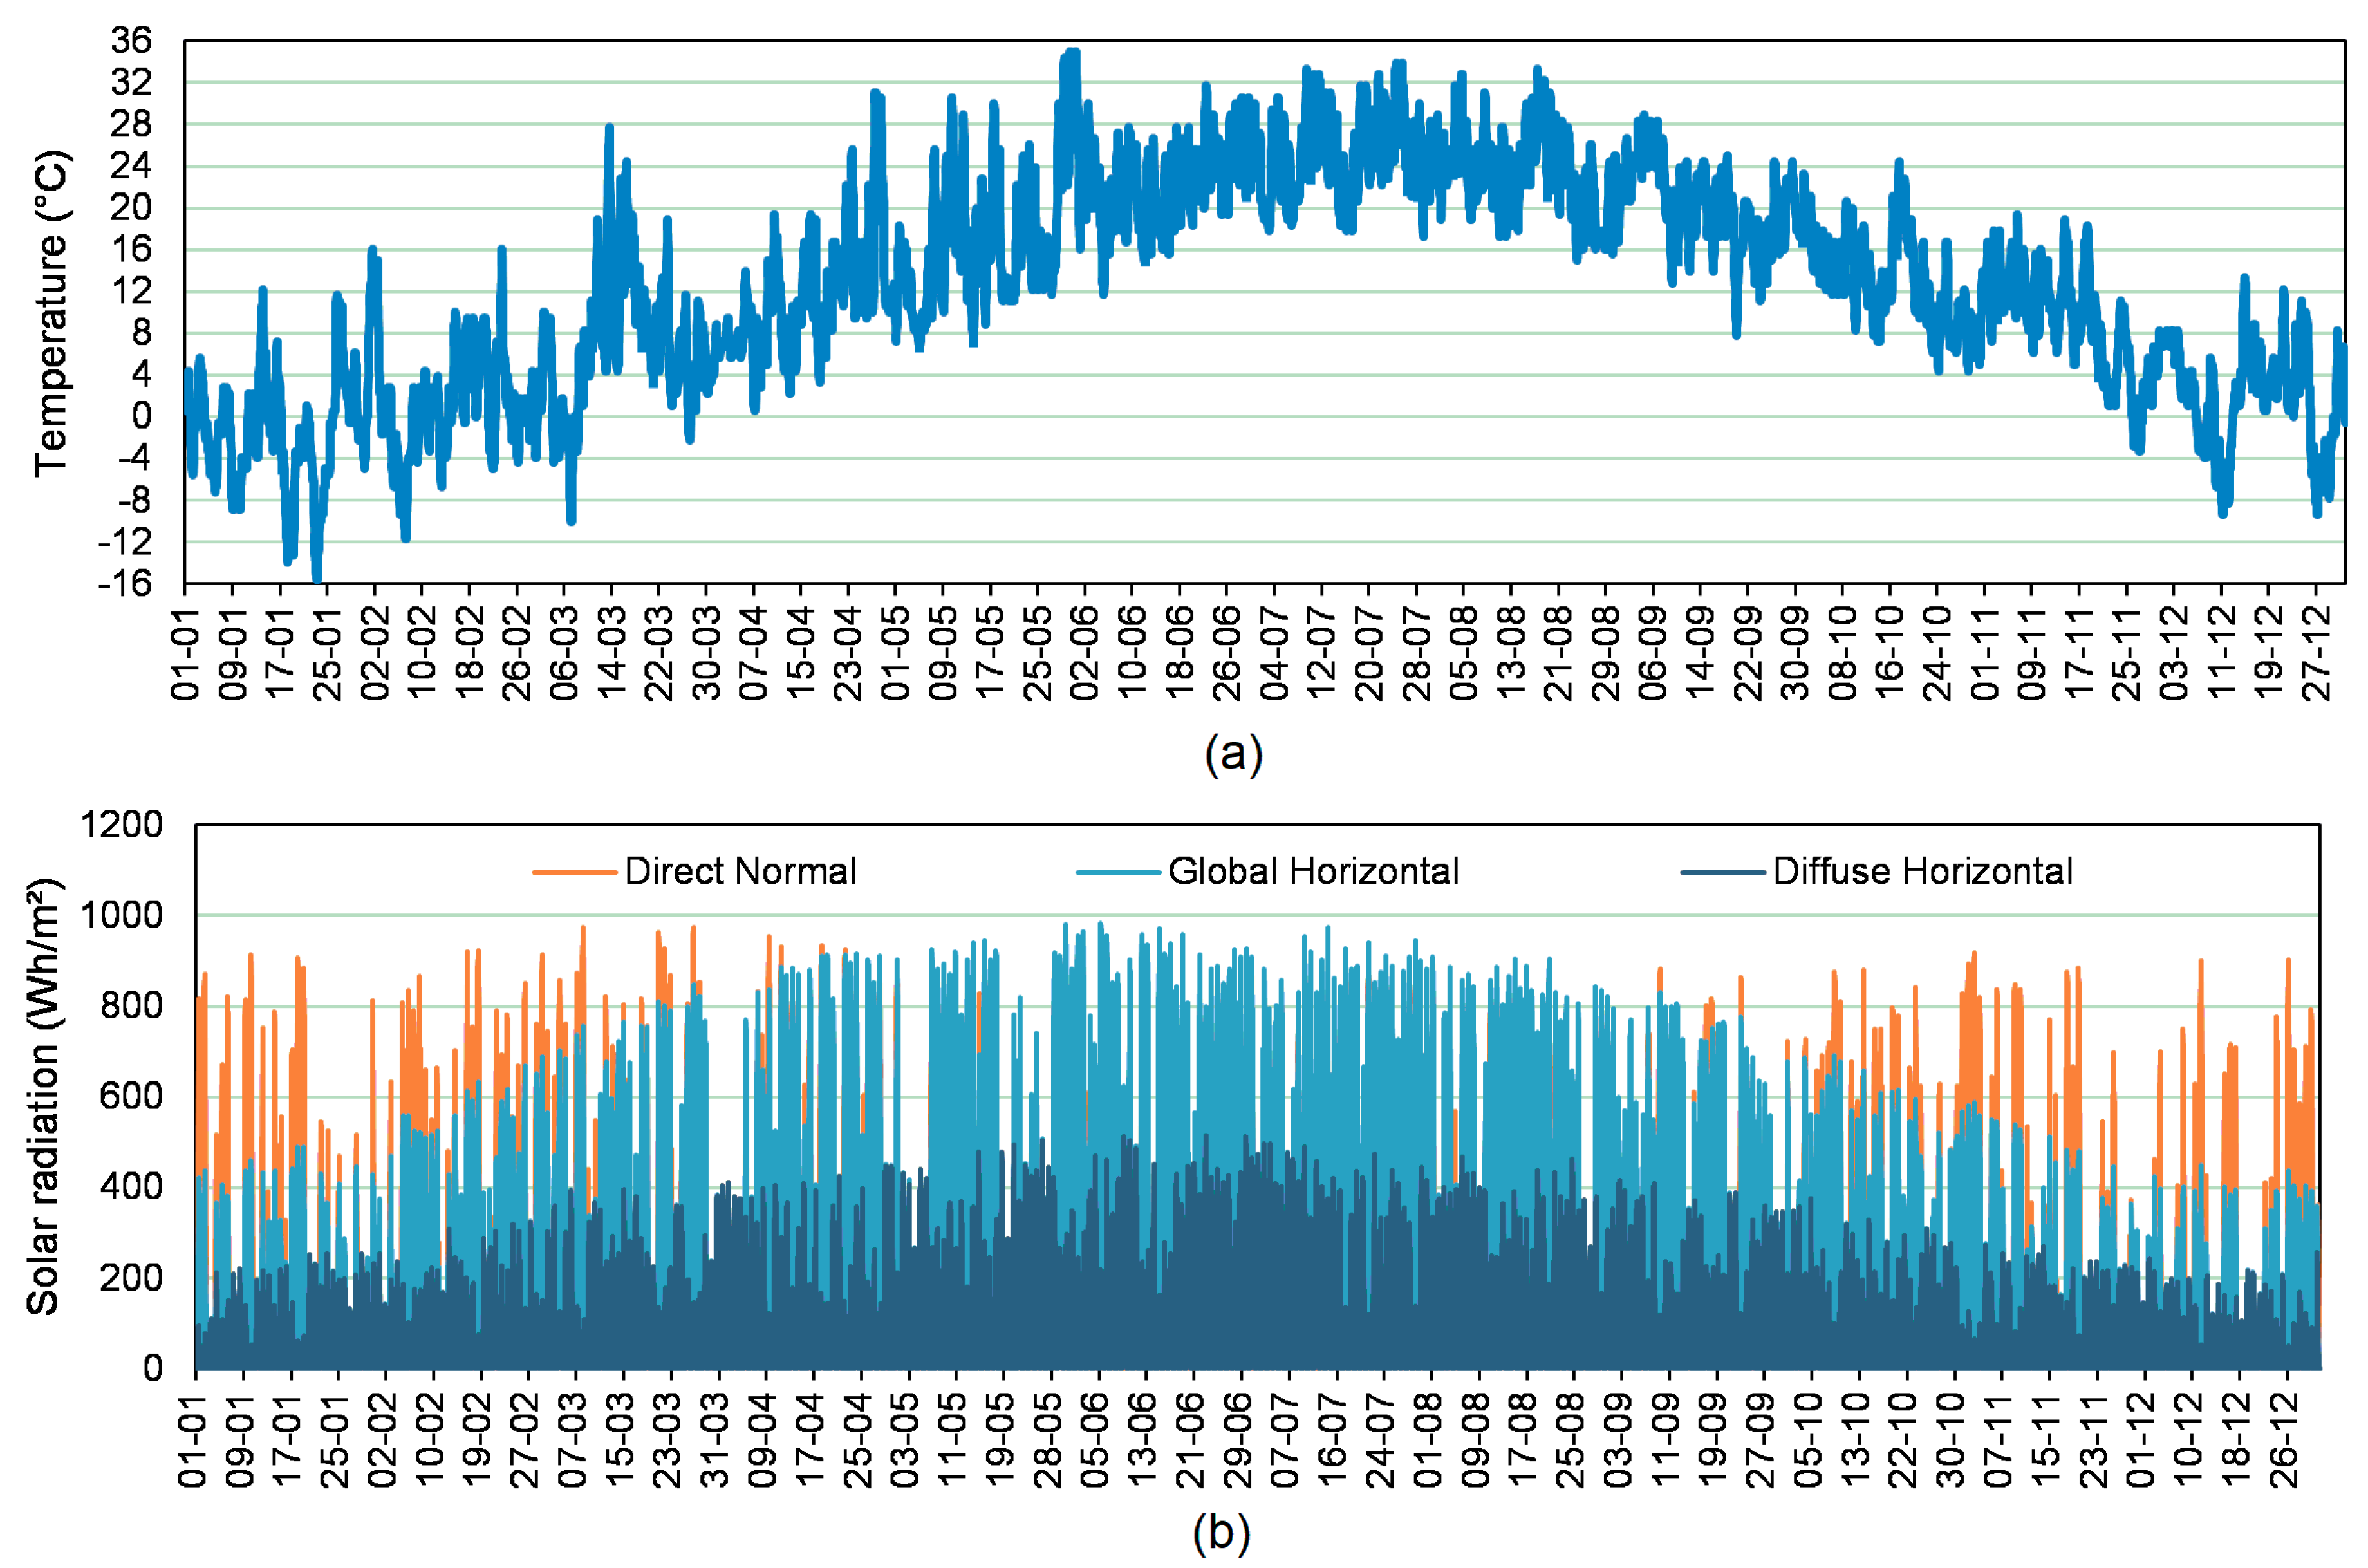
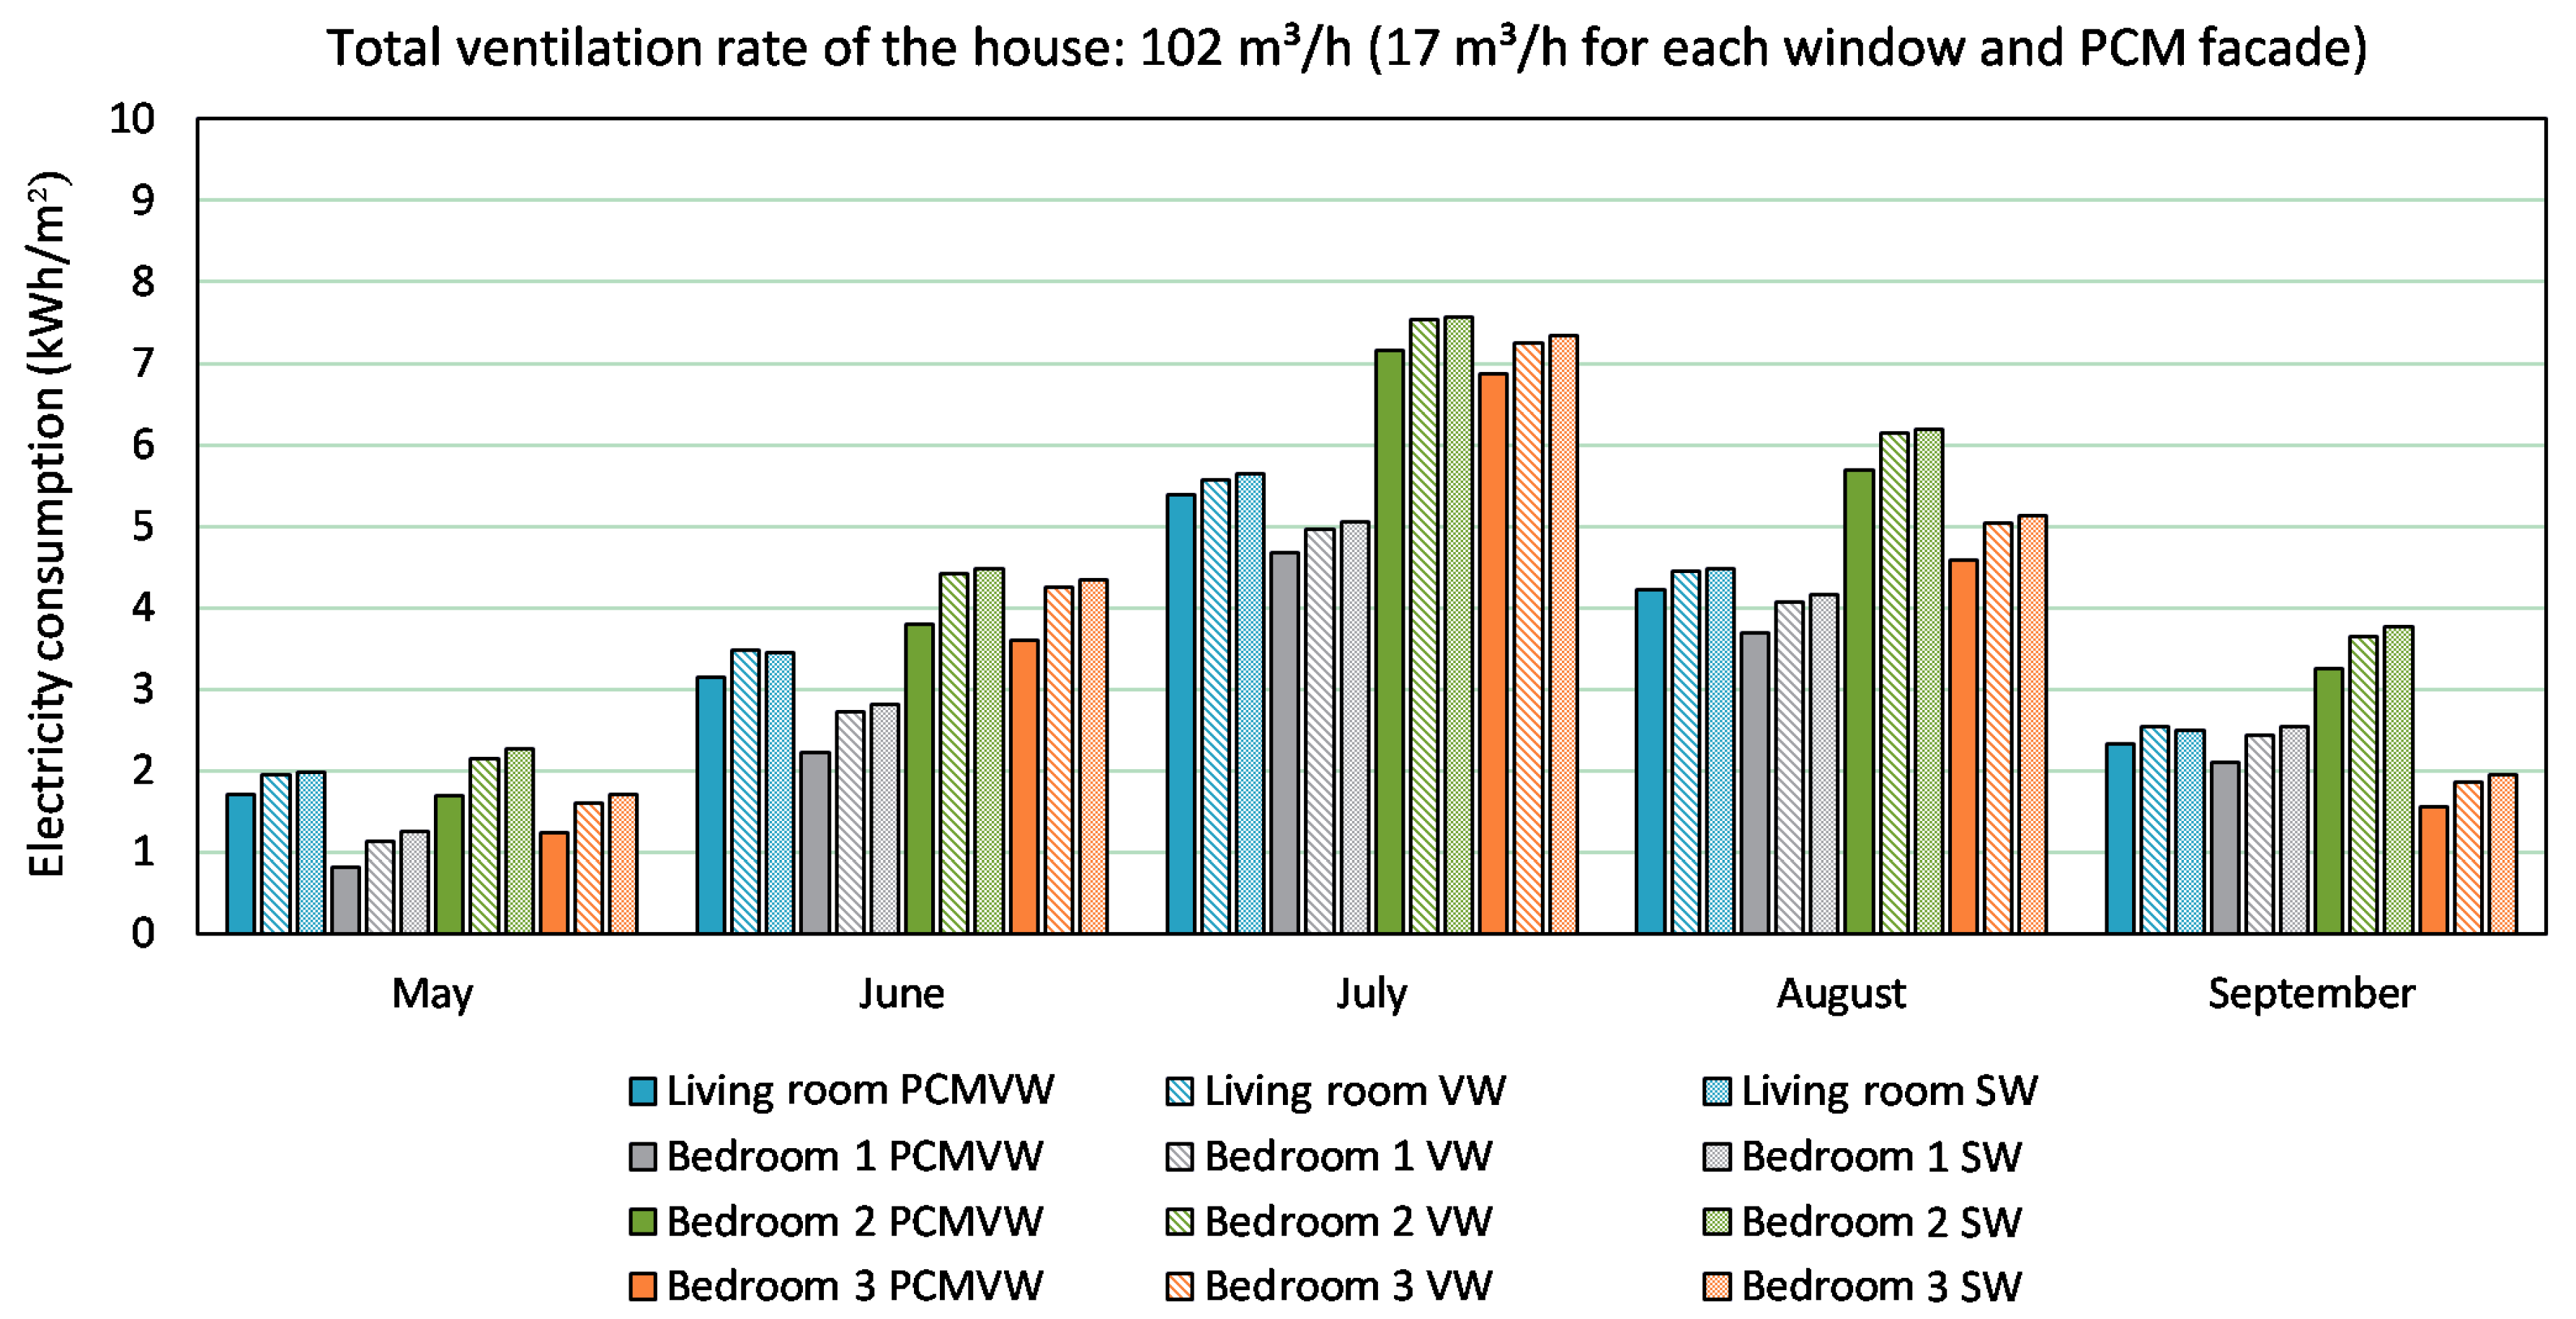
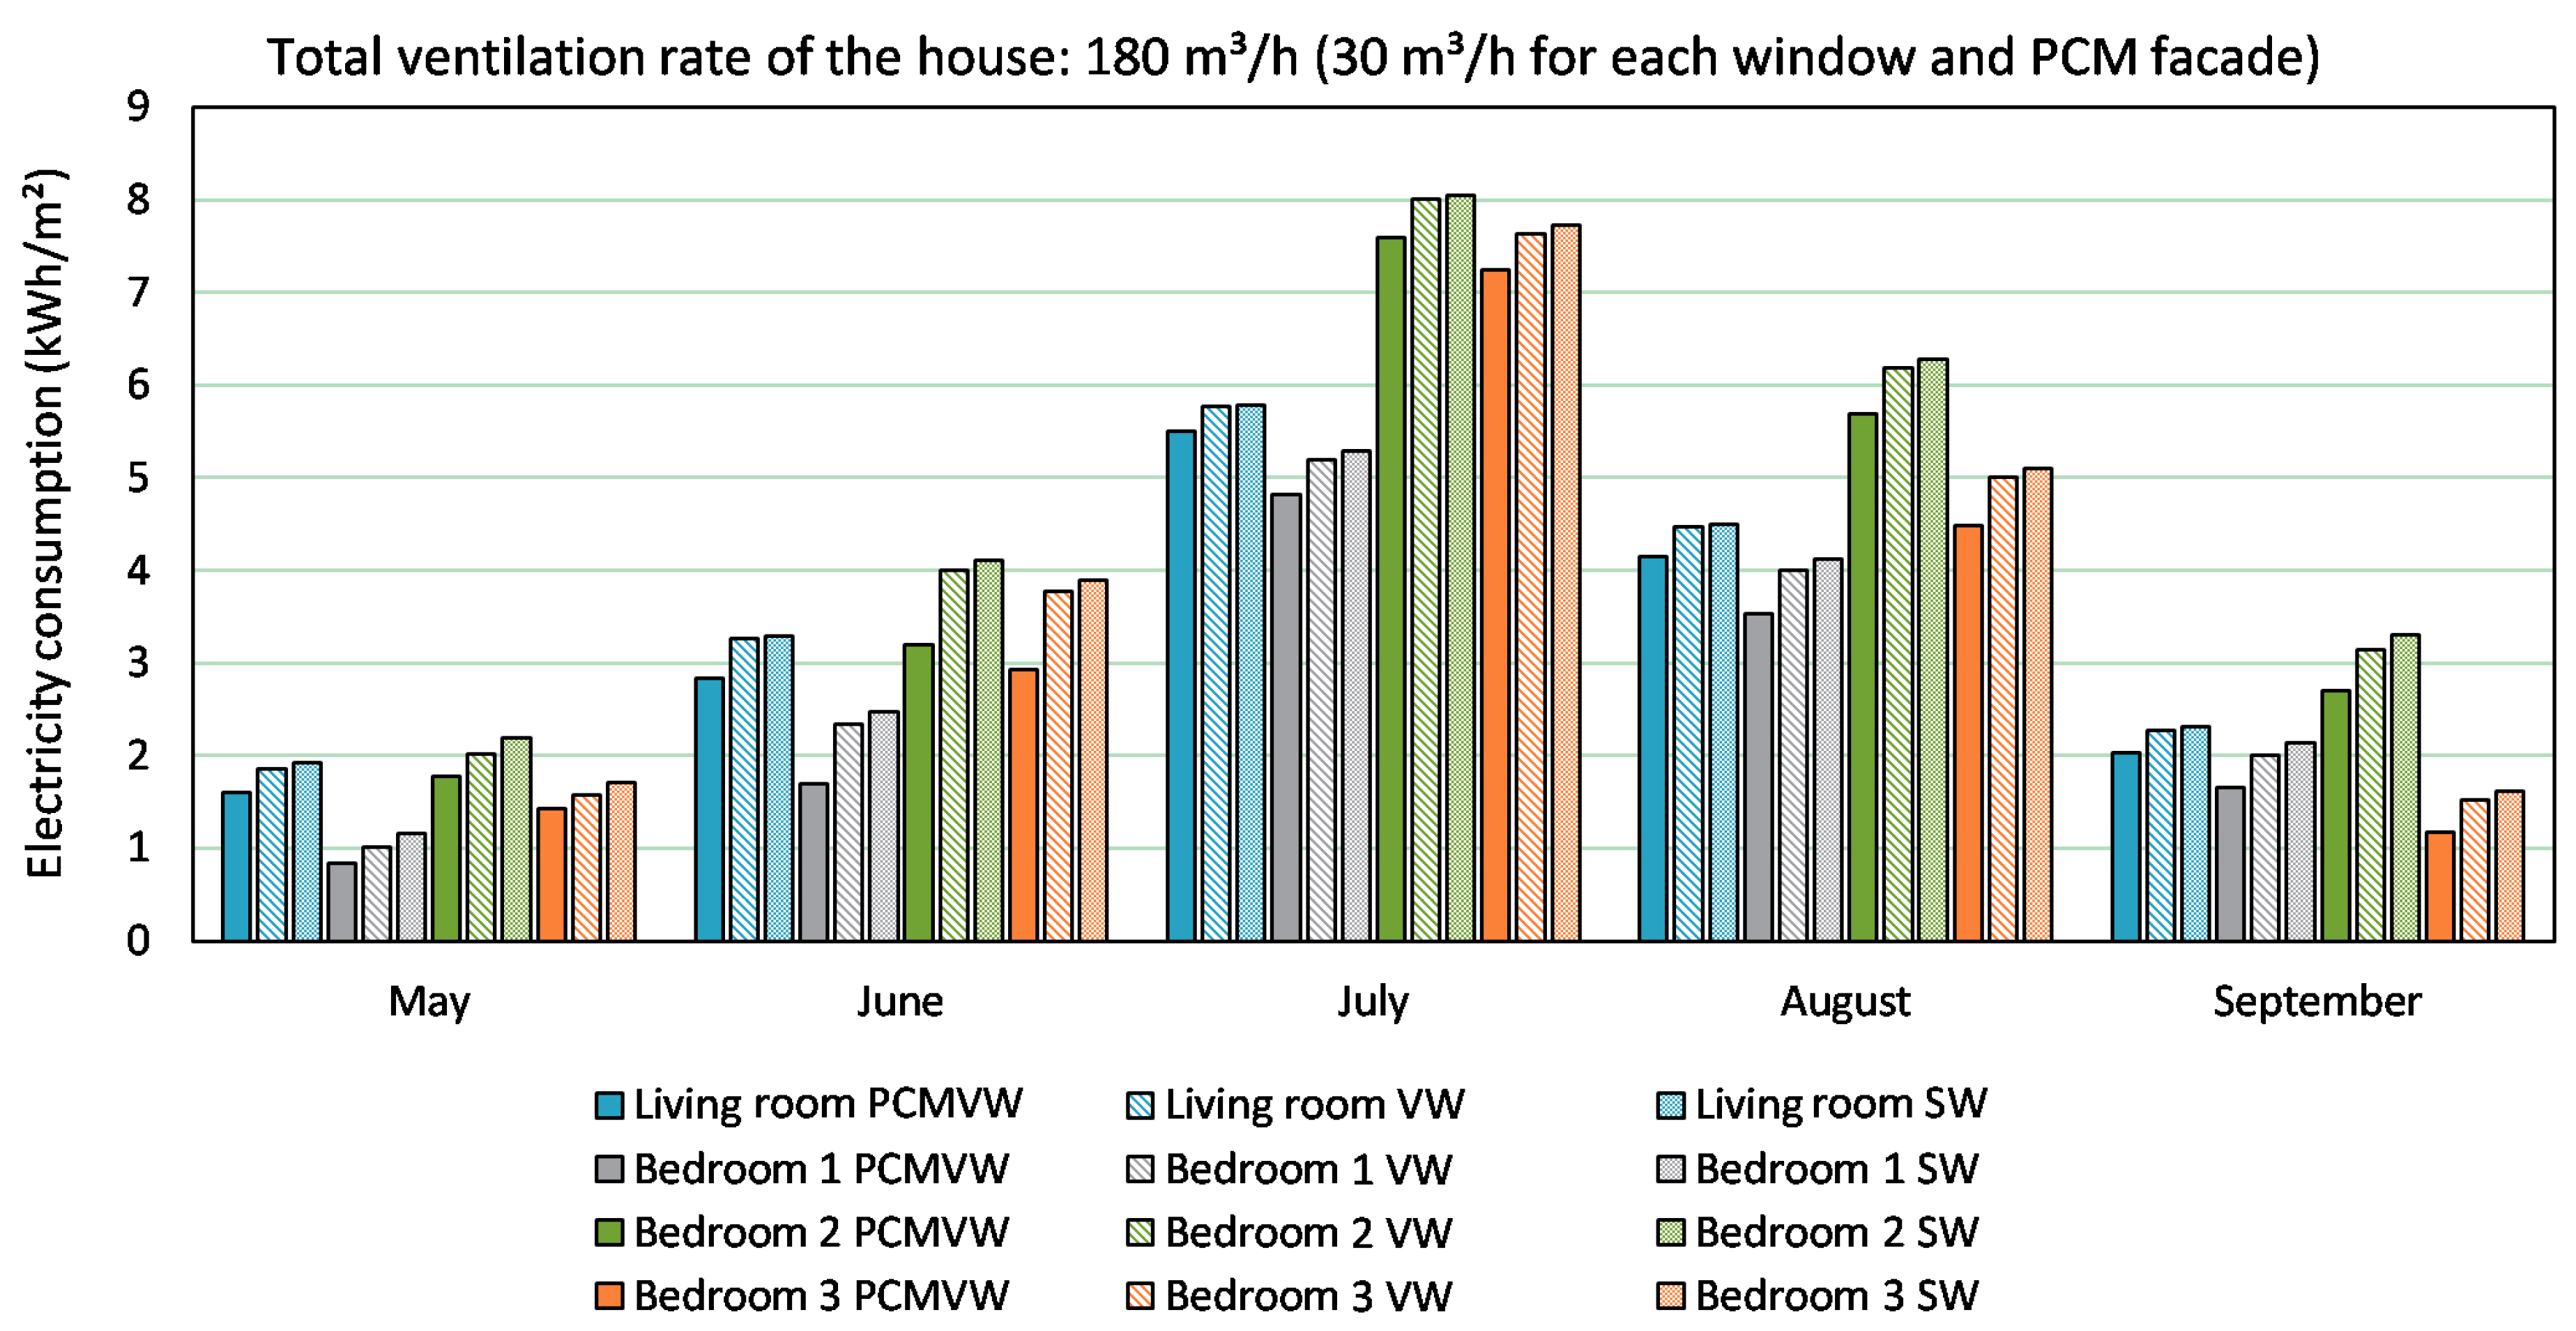
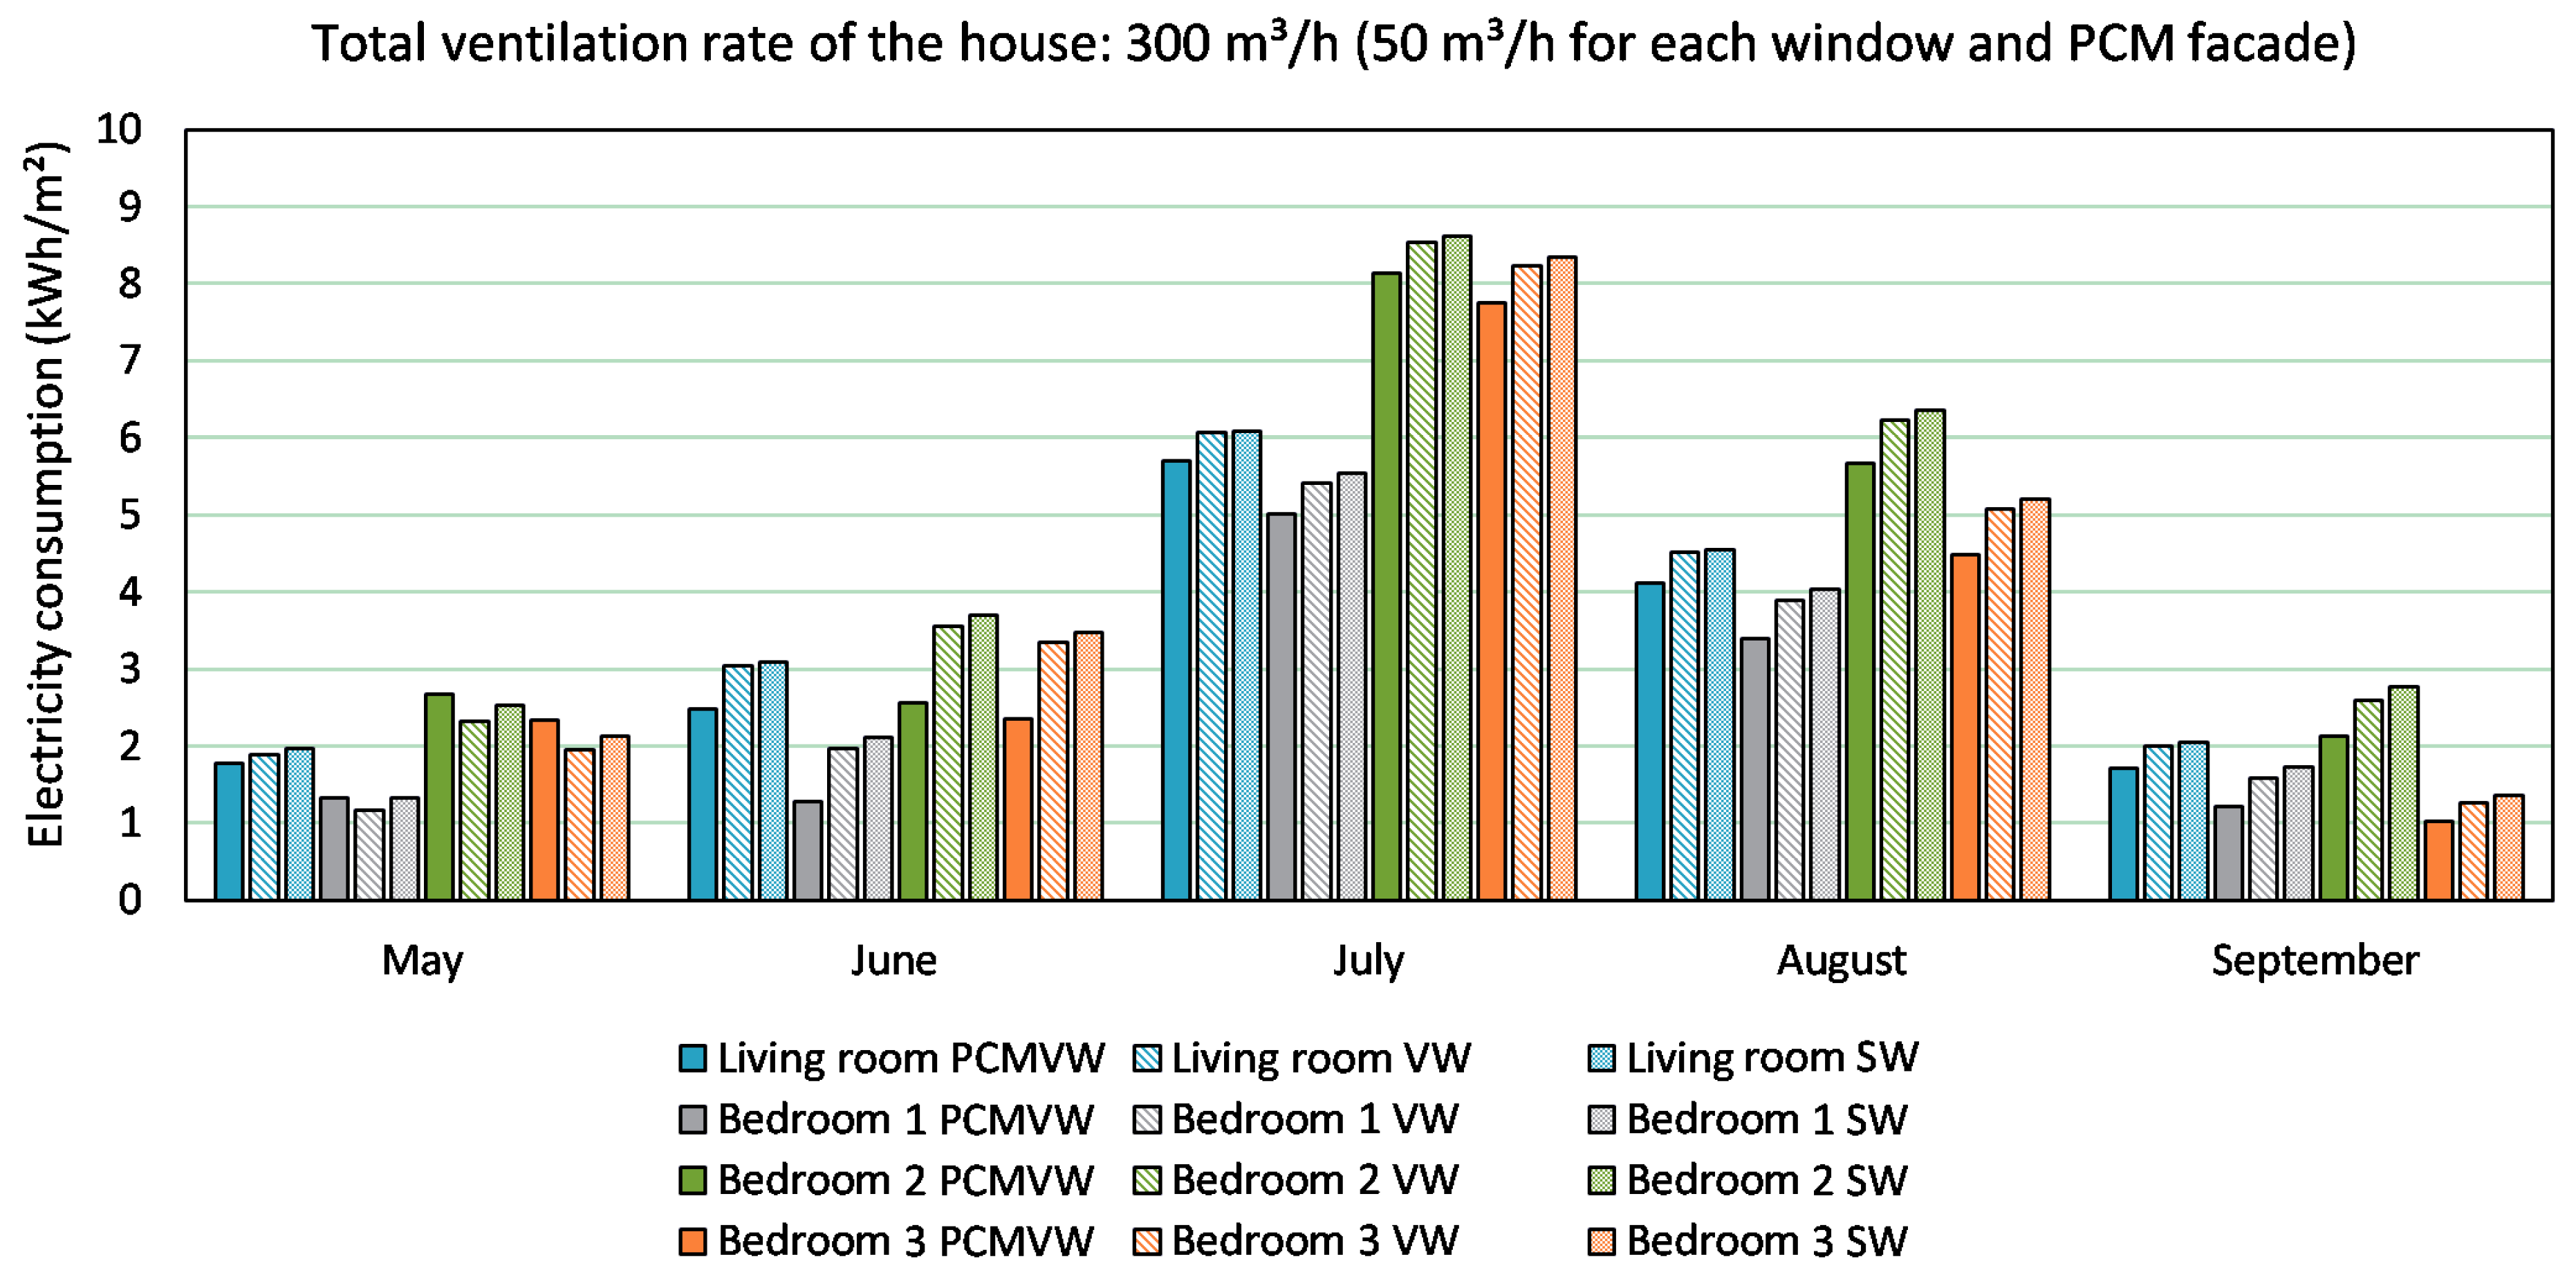
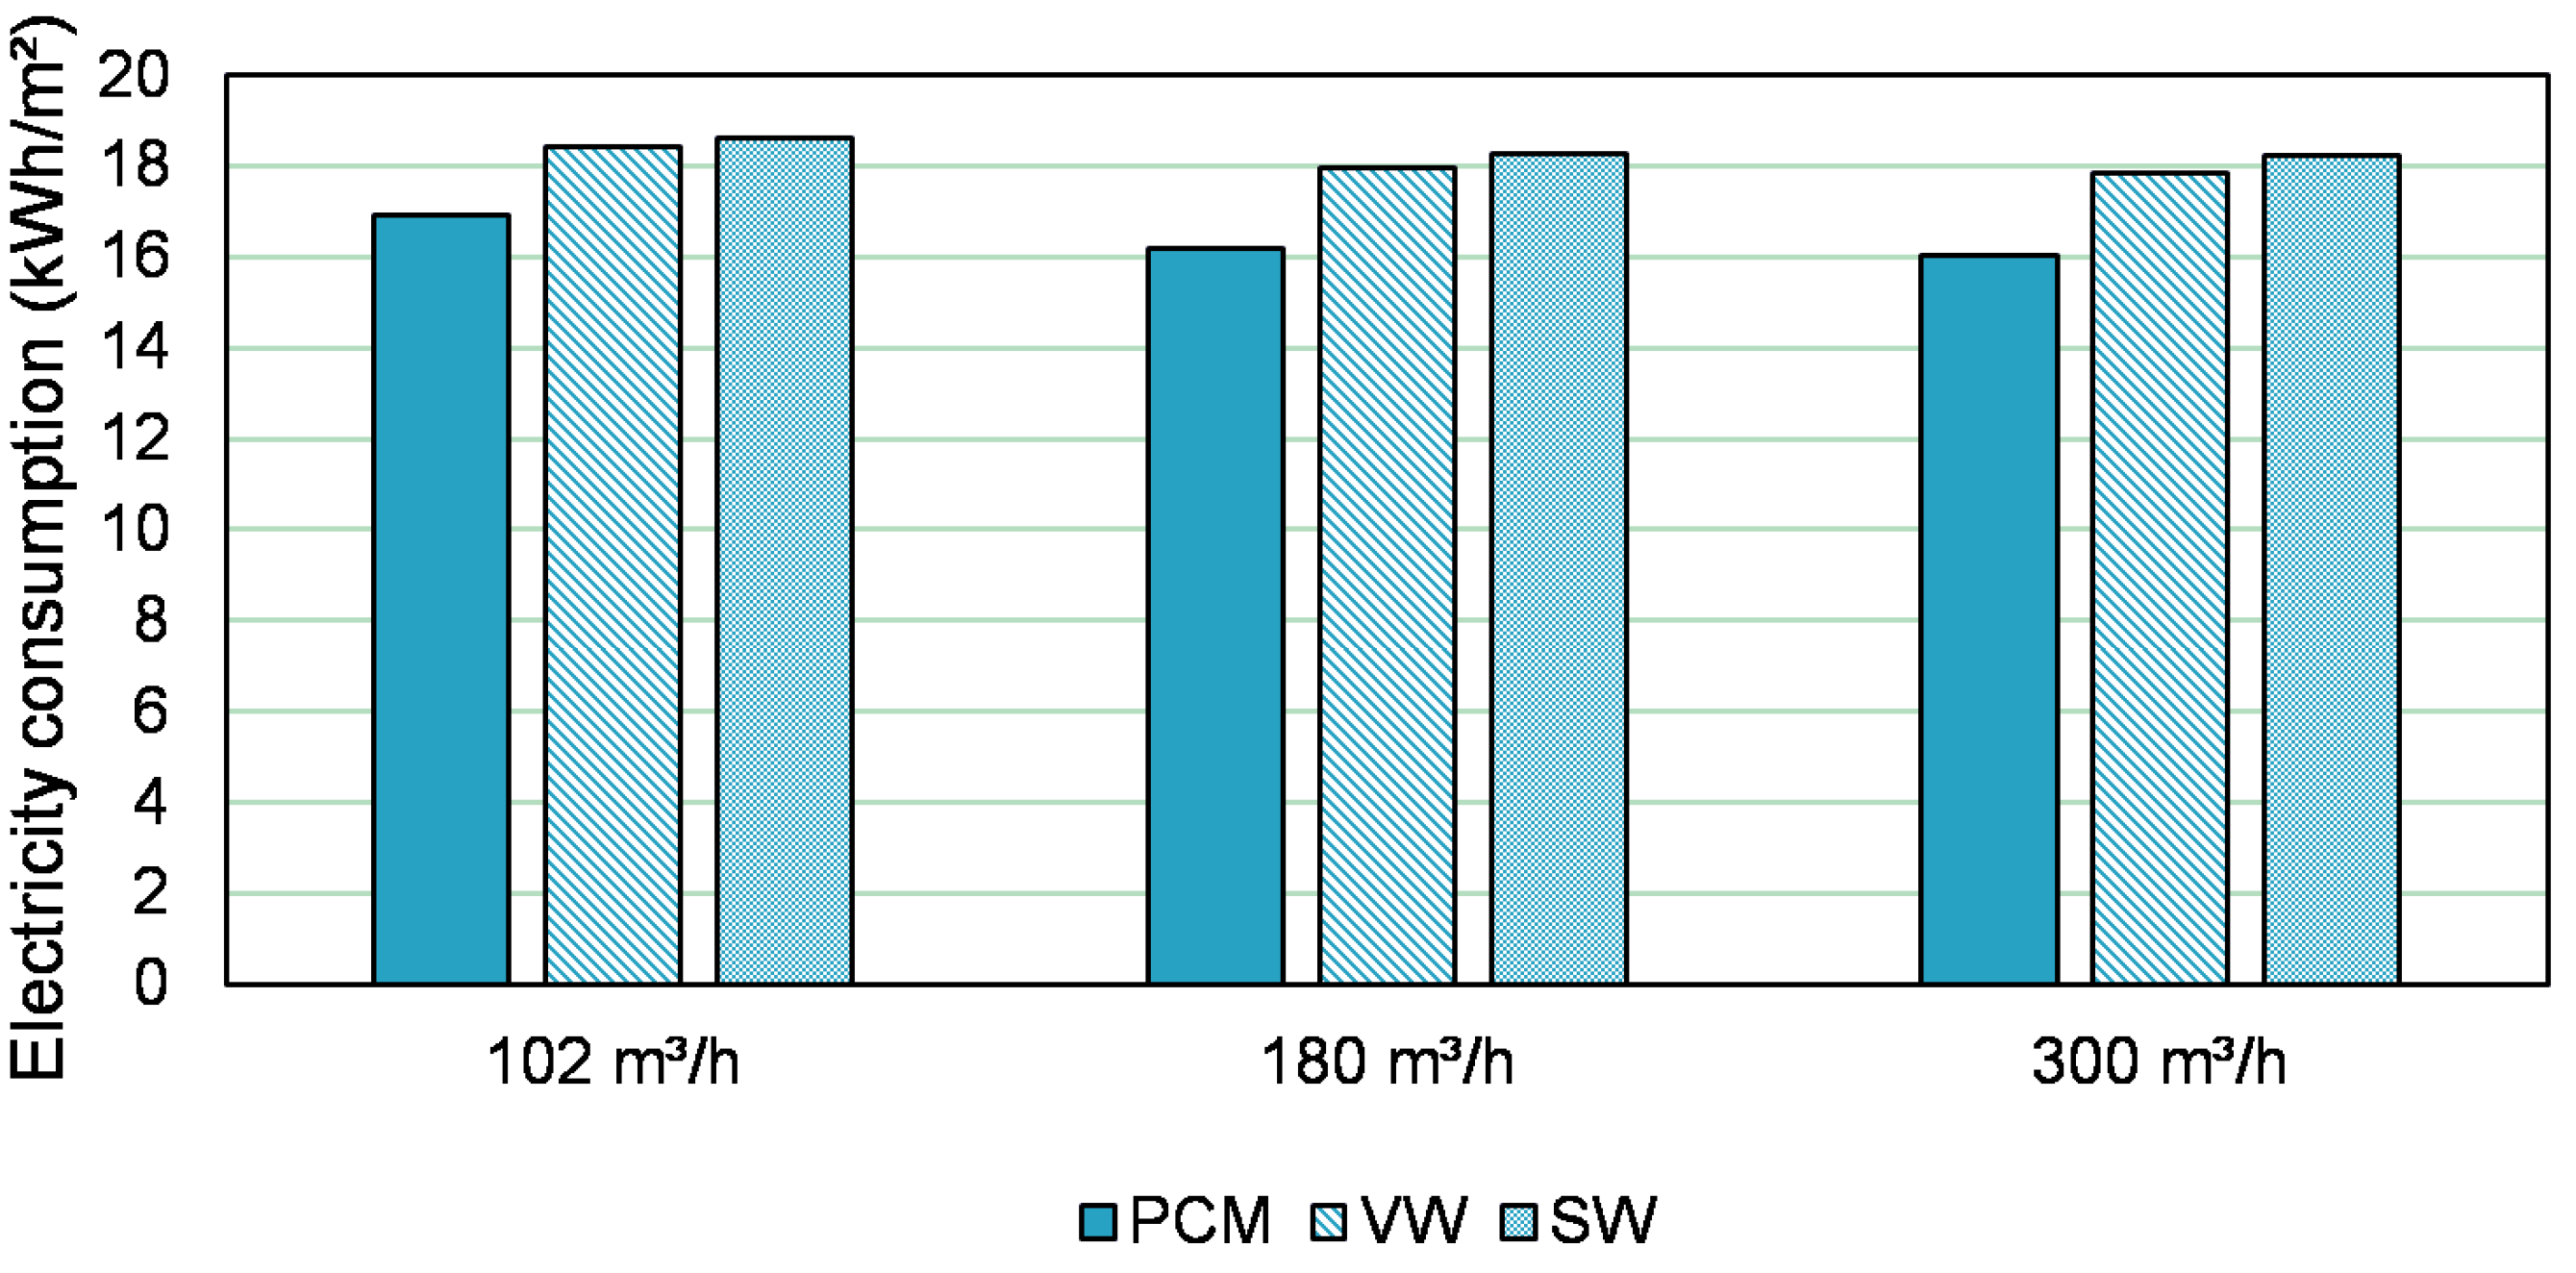
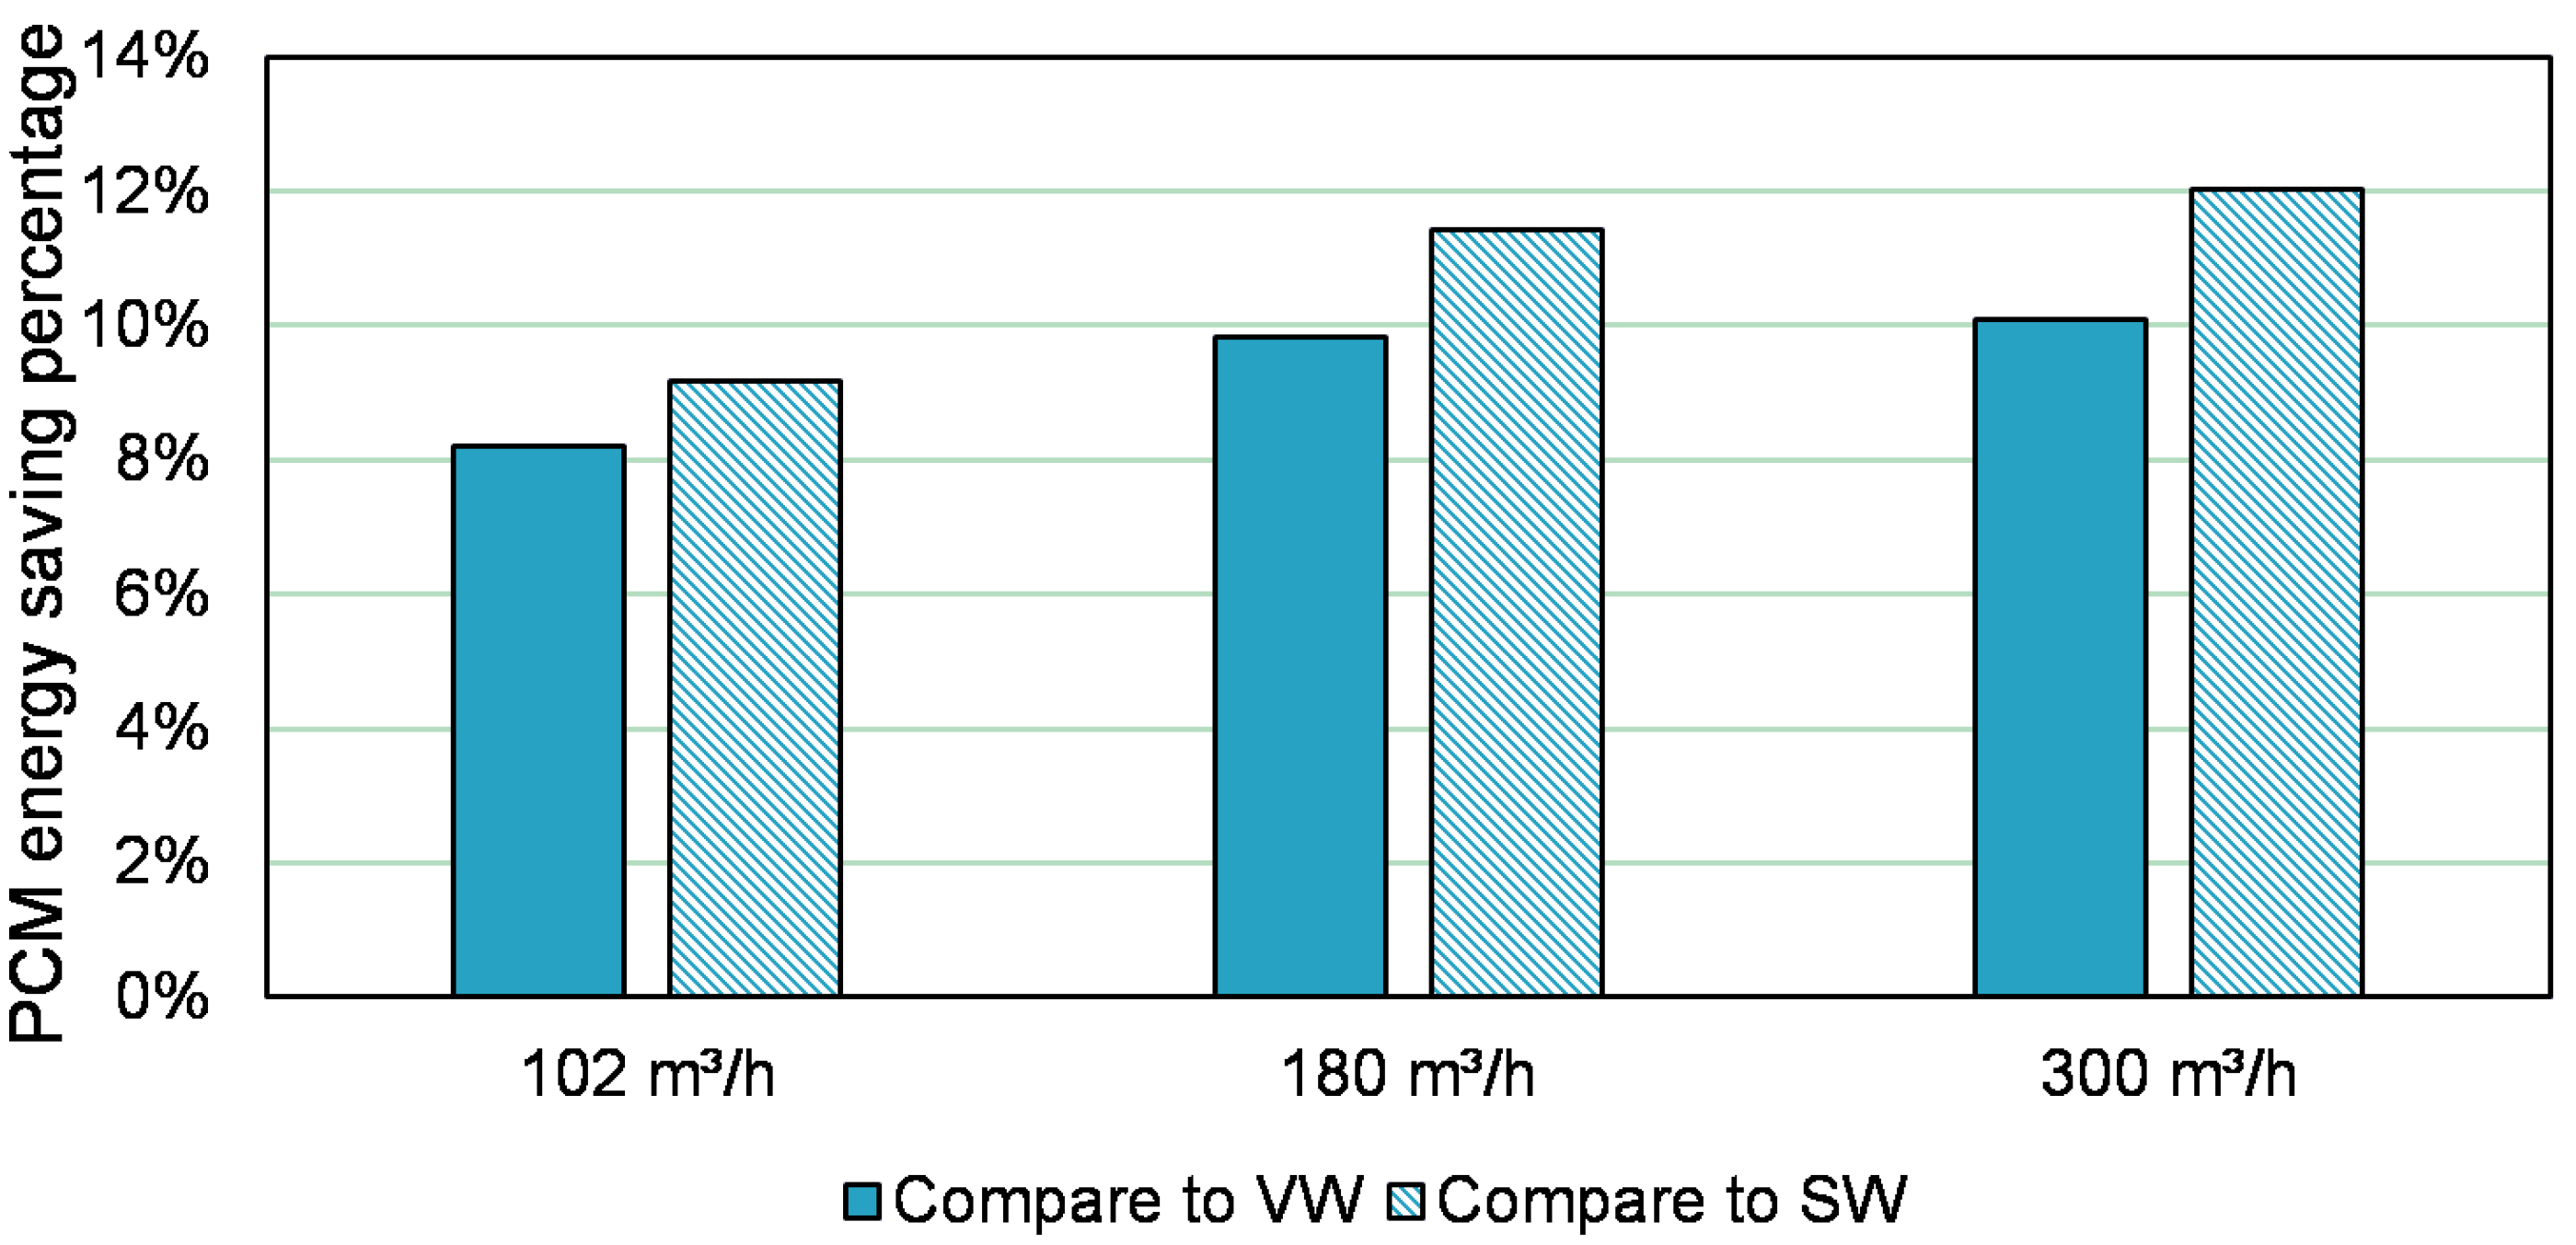
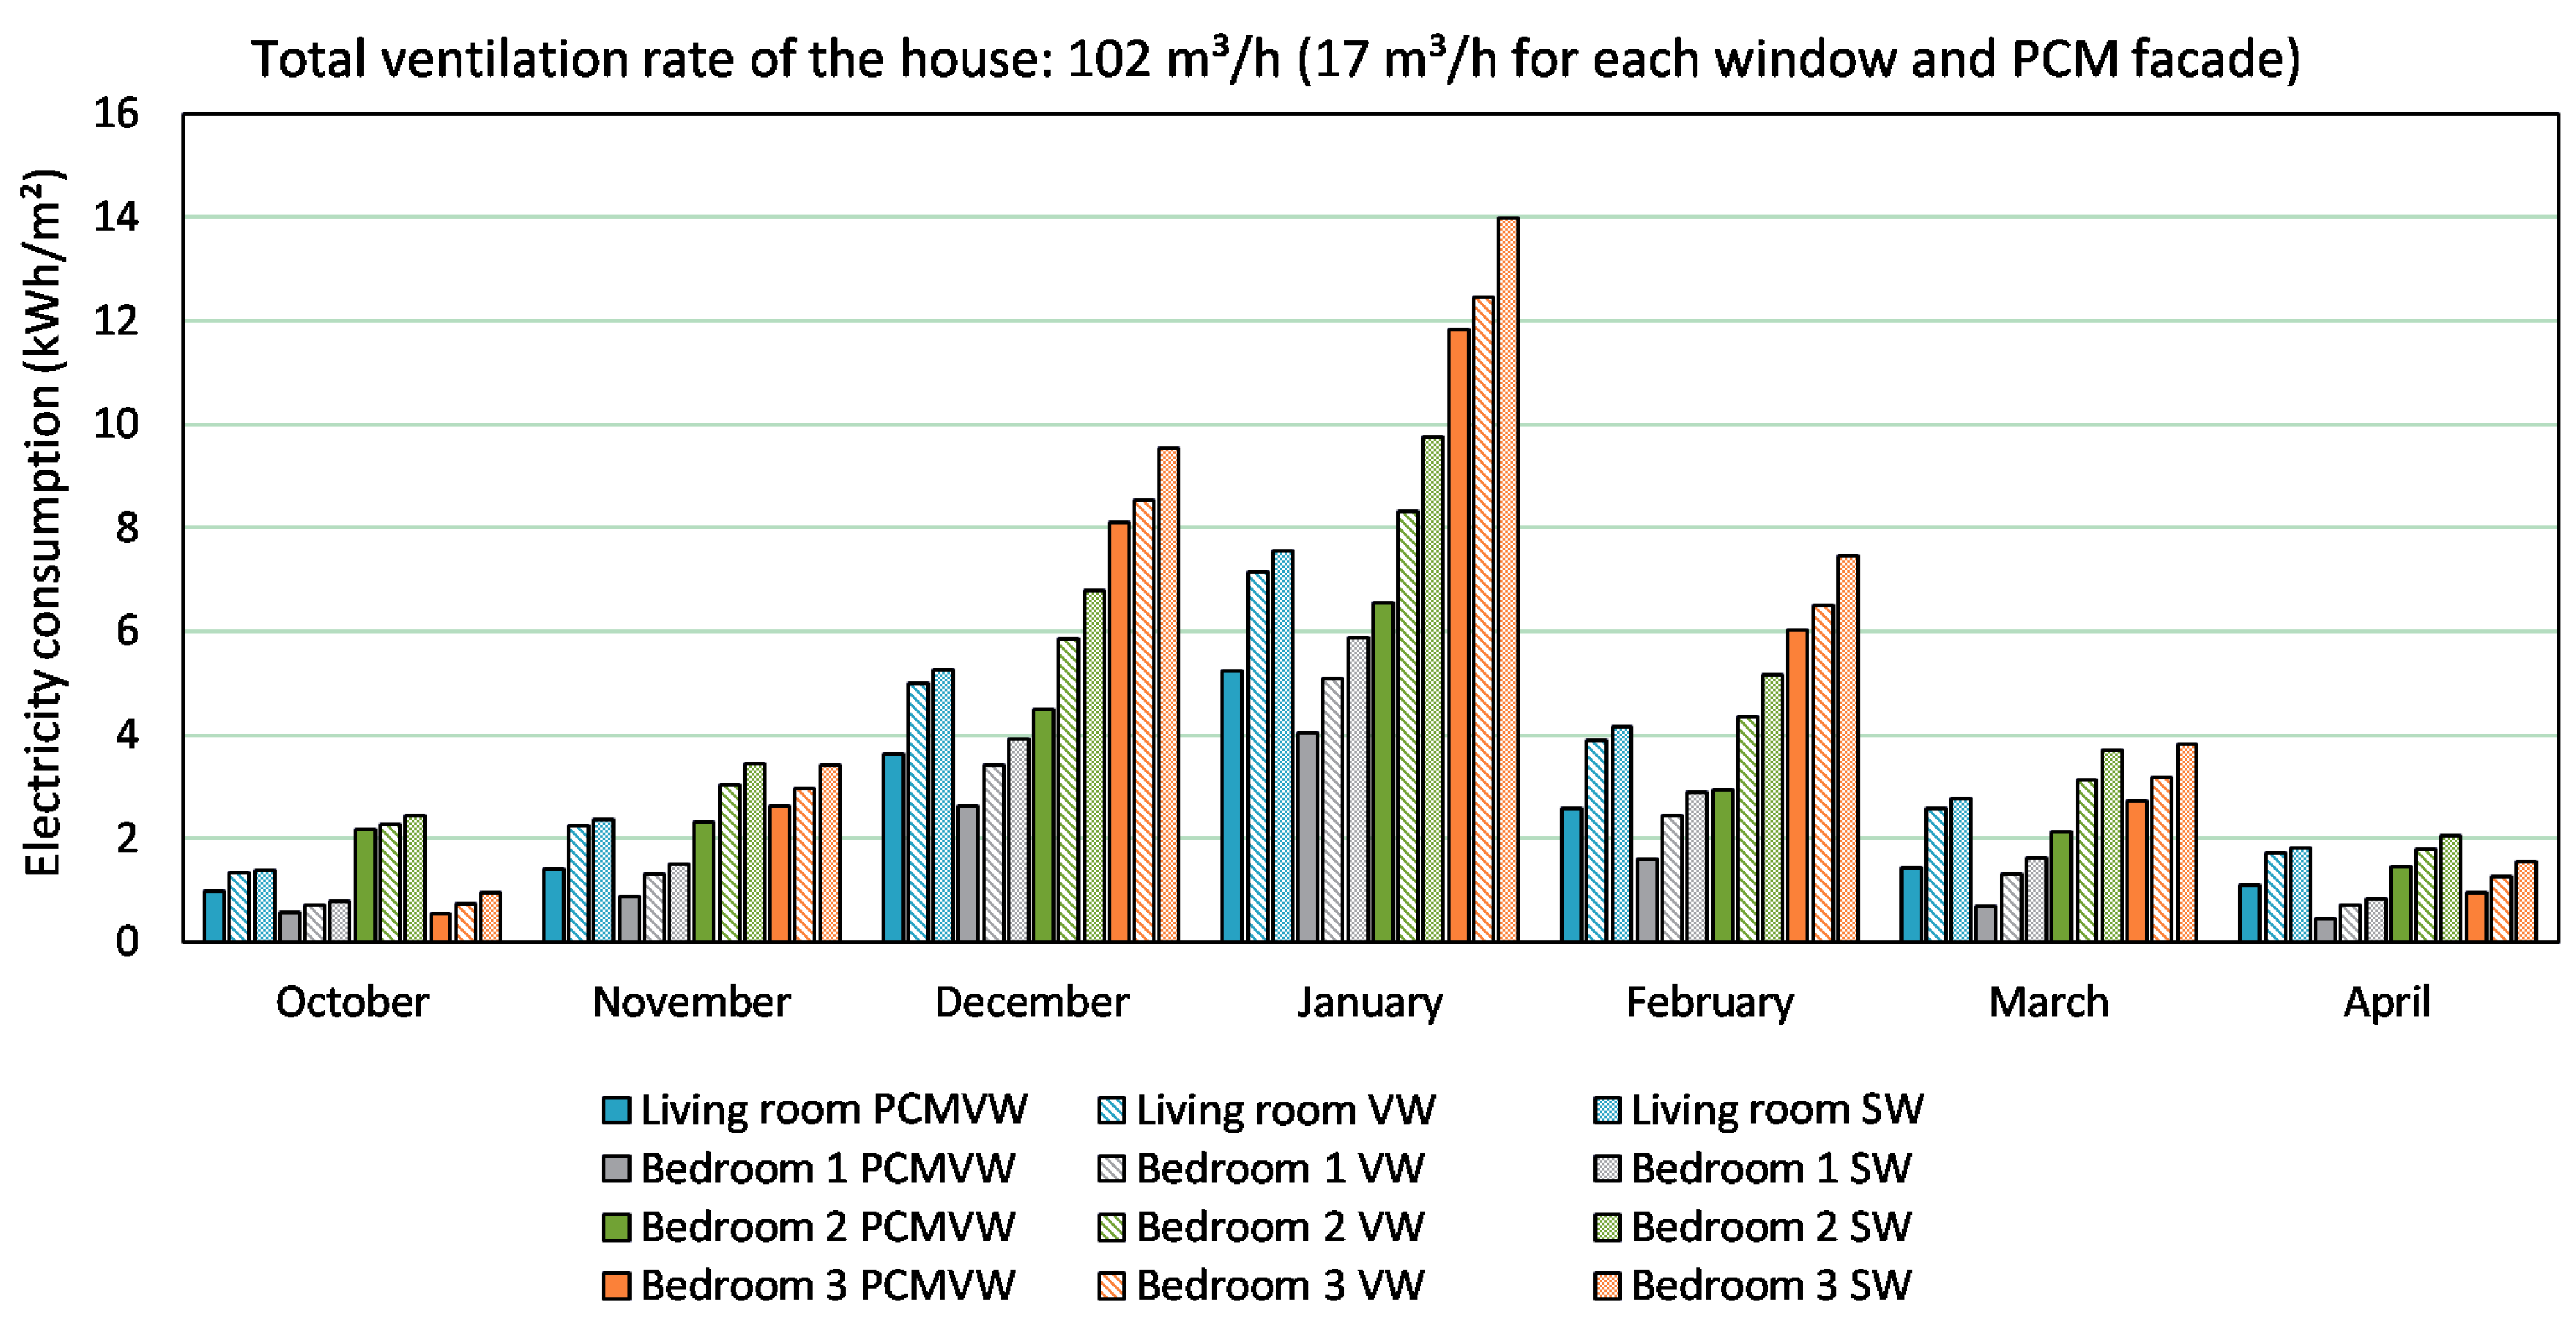
3. Constant Ventilation Airflow Rate

3.1. Method

For the simple constant airflow ventilation strategy, the influence of the ventilation airflow rate on the PCM energy storage saving potential is investigated. The house is simulated as a single thermal zone. The average internal heat load from equipment in the house is 3.5 W/m2 [29]. The heat load schedule shown in Figure 9 is based on previous work [14]. The house is occupied by four people. The occupant schedule of the house is based on the recommendation in ASHRAE standard 90.1 [30], as seen in Figure 10. The time here refers to New York time.
The ventilation strategies shown in Figure 3, Figure 4, Figure 5 and Figure 6 are simulated. The required minimum ventilation flow rate of the house is 102 m3/h according to US Building Codes and Indoor Air Quality [31]. To investigate the influence of the airflow rate on the PCM energy storage saving potential, three ventilation flow rates are examined: 102 m3/h (0.385 h−1), 180 m3/h (0.679 h−1) and 300 m3/h (1.132 h−1), for summer and winter applications, respectively.

3.2. Results

3.1.1. Summer Night Cooling Application

The ventilation energy-saving potential of the PCM energy storage in a summer night cooling application is calculated by comparing the heat pump electricity consumption of the building for a ventilation system with PCM energy storage to one without. The PCM energy storage solution is compared to two other reference cases: using either ventilated windows (VW), as shown in Figure 11, or standard windows (SW) with direct outdoor air supply.
Figure 12, Figure 13 and Figure 14 show the heat pump electricity consumption of each room under three different ventilation airflow rates during the summer period. With the increase in the ventilation airflow rate, the heat pump electricity consumption for each month decreases, except in July. In July, the night cooling potential is too low due to the high outside air temperature, and increasing the ventilation airflow rate increased the cooling heat pump electricity consumption. In the other summer months, an increasing airflow rate increased the pre-cooling ability of the PCM energy storage, because more heat is discharged during the night. For all the summer months, the model with PCM energy storage has the least heat pump electricity consumption, and the model with the standard window has the highest heat pump electricity consumption. Bedrooms 2 and 3 have relatively high heat pump electricity consumption, especially during July and August. The two rooms have more external walls and windows than Bedroom 1; thus, the heat gain during the summer is much higher and the room should be equipped with a larger PCM energy storage.
Figure 15 shows the summer total heat pump electricity energy consumption per air-conditioned area with different ventilation airflow rates. The ventilation system with PCM energy storage has the lowest electricity consumption compared to the other two systems. The ventilated system has similar electricity consumption as the standard window system, which indicates that the energy-saving potential of VW is limited during summer. With a higher ventilation airflow rate, the heat pump electricity consumption of the house is lower. However, the decreased amount is not significant.
Figure 16 shows the energy-saving potential of the ventilated window with PCM energy storage compared to using the stand-alone VW or the standard window (SW) solutions. With increase in ventilation airflow rate, the energy-saving potential increases. With a ventilation airflow rate of 300 m3/h, the energy-saving of the PCM energy storage is 10.1% compared to VW and 12.0% compared to the SW.
In summer, the house should be ventilated by a high ventilation airflow rate, for both purposes of decreasing the electricity consumption and increasing the PCM energy storage saving potential. Rooms with more external walls and windows should be equipped with larger PCM energy storage due to the higher room electricity consumption.

3.1.2. Winter Solar Energy Storage Application

Similar to summer night cooling application, the ventilation energy-saving potential of the PCM energy storage in winter solar energy application is calculated by comparing the electricity consumption of the building for ventilation systems with and without PCM energy storage. The PCM energy storage solution is compared to two other reference cases: using either stand-alone ventilated windows (VW) as shown in Figure 17, or standard windows with direct air supply from outdoors to the rooms.
Figure 18, Figure 19 and Figure 20 show the electricity consumption of each room under three different ventilation flow rates during the winter period. With increase in ventilation airflow rate, the electricity consumption for each month increases. For all the winter months, the model with PCM energy storage has the least electricity consumption, and the model with the standard window solution has the highest electricity consumption. Bedroom 3 has a relatively high electricity consumption. It has one external wall, which faces north; thus, the room heat gain during the winter is much lower.
Figure 21 shows the winter total electricity consumption per air-conditioned area with different ventilation flow rates. The ventilation system with PCM energy storage has the lowest electricity consumption compared to the other two systems. The standard window system has the highest electricity consumption. The VW system has less electricity consumption than the standard window system. The VW is more energy saving in winter than in summer because the heat accumulated in the window cavity heats up the ventilation air. With a higher ventilation airflow rate, the electricity consumption of the house is higher. The electricity consumption is the highest when the airflow rate is 300 m3/h.
The winter energy-saving percentage of the ventilated windows with PCM energy storage with three different ventilation airflow rates is shown in Figure 22. The energy saved compared to the standard window system (SW) is much higher than that compared to the stand-alone ventilated window system (VW). When the ventilation airflow rate increases from 102 m3/h to 300 m3/h, the total energy-saving percentage decreases. With a ventilation airflow rate of 102 m3/h, the energy-saving of the PCM energy storage solution is 26.6 % compared to the standalone VW system, and 32.8 % compared to the standard window system.
In both summer and winter, the ventilated window and façade system with PCM energy storage are efficient to decrease the house electricity consumption. In summer, a high ventilation rate should be applied, while in winter, a low ventilation rate should be adopted, to decrease the heat pump electricity consumption of the house.

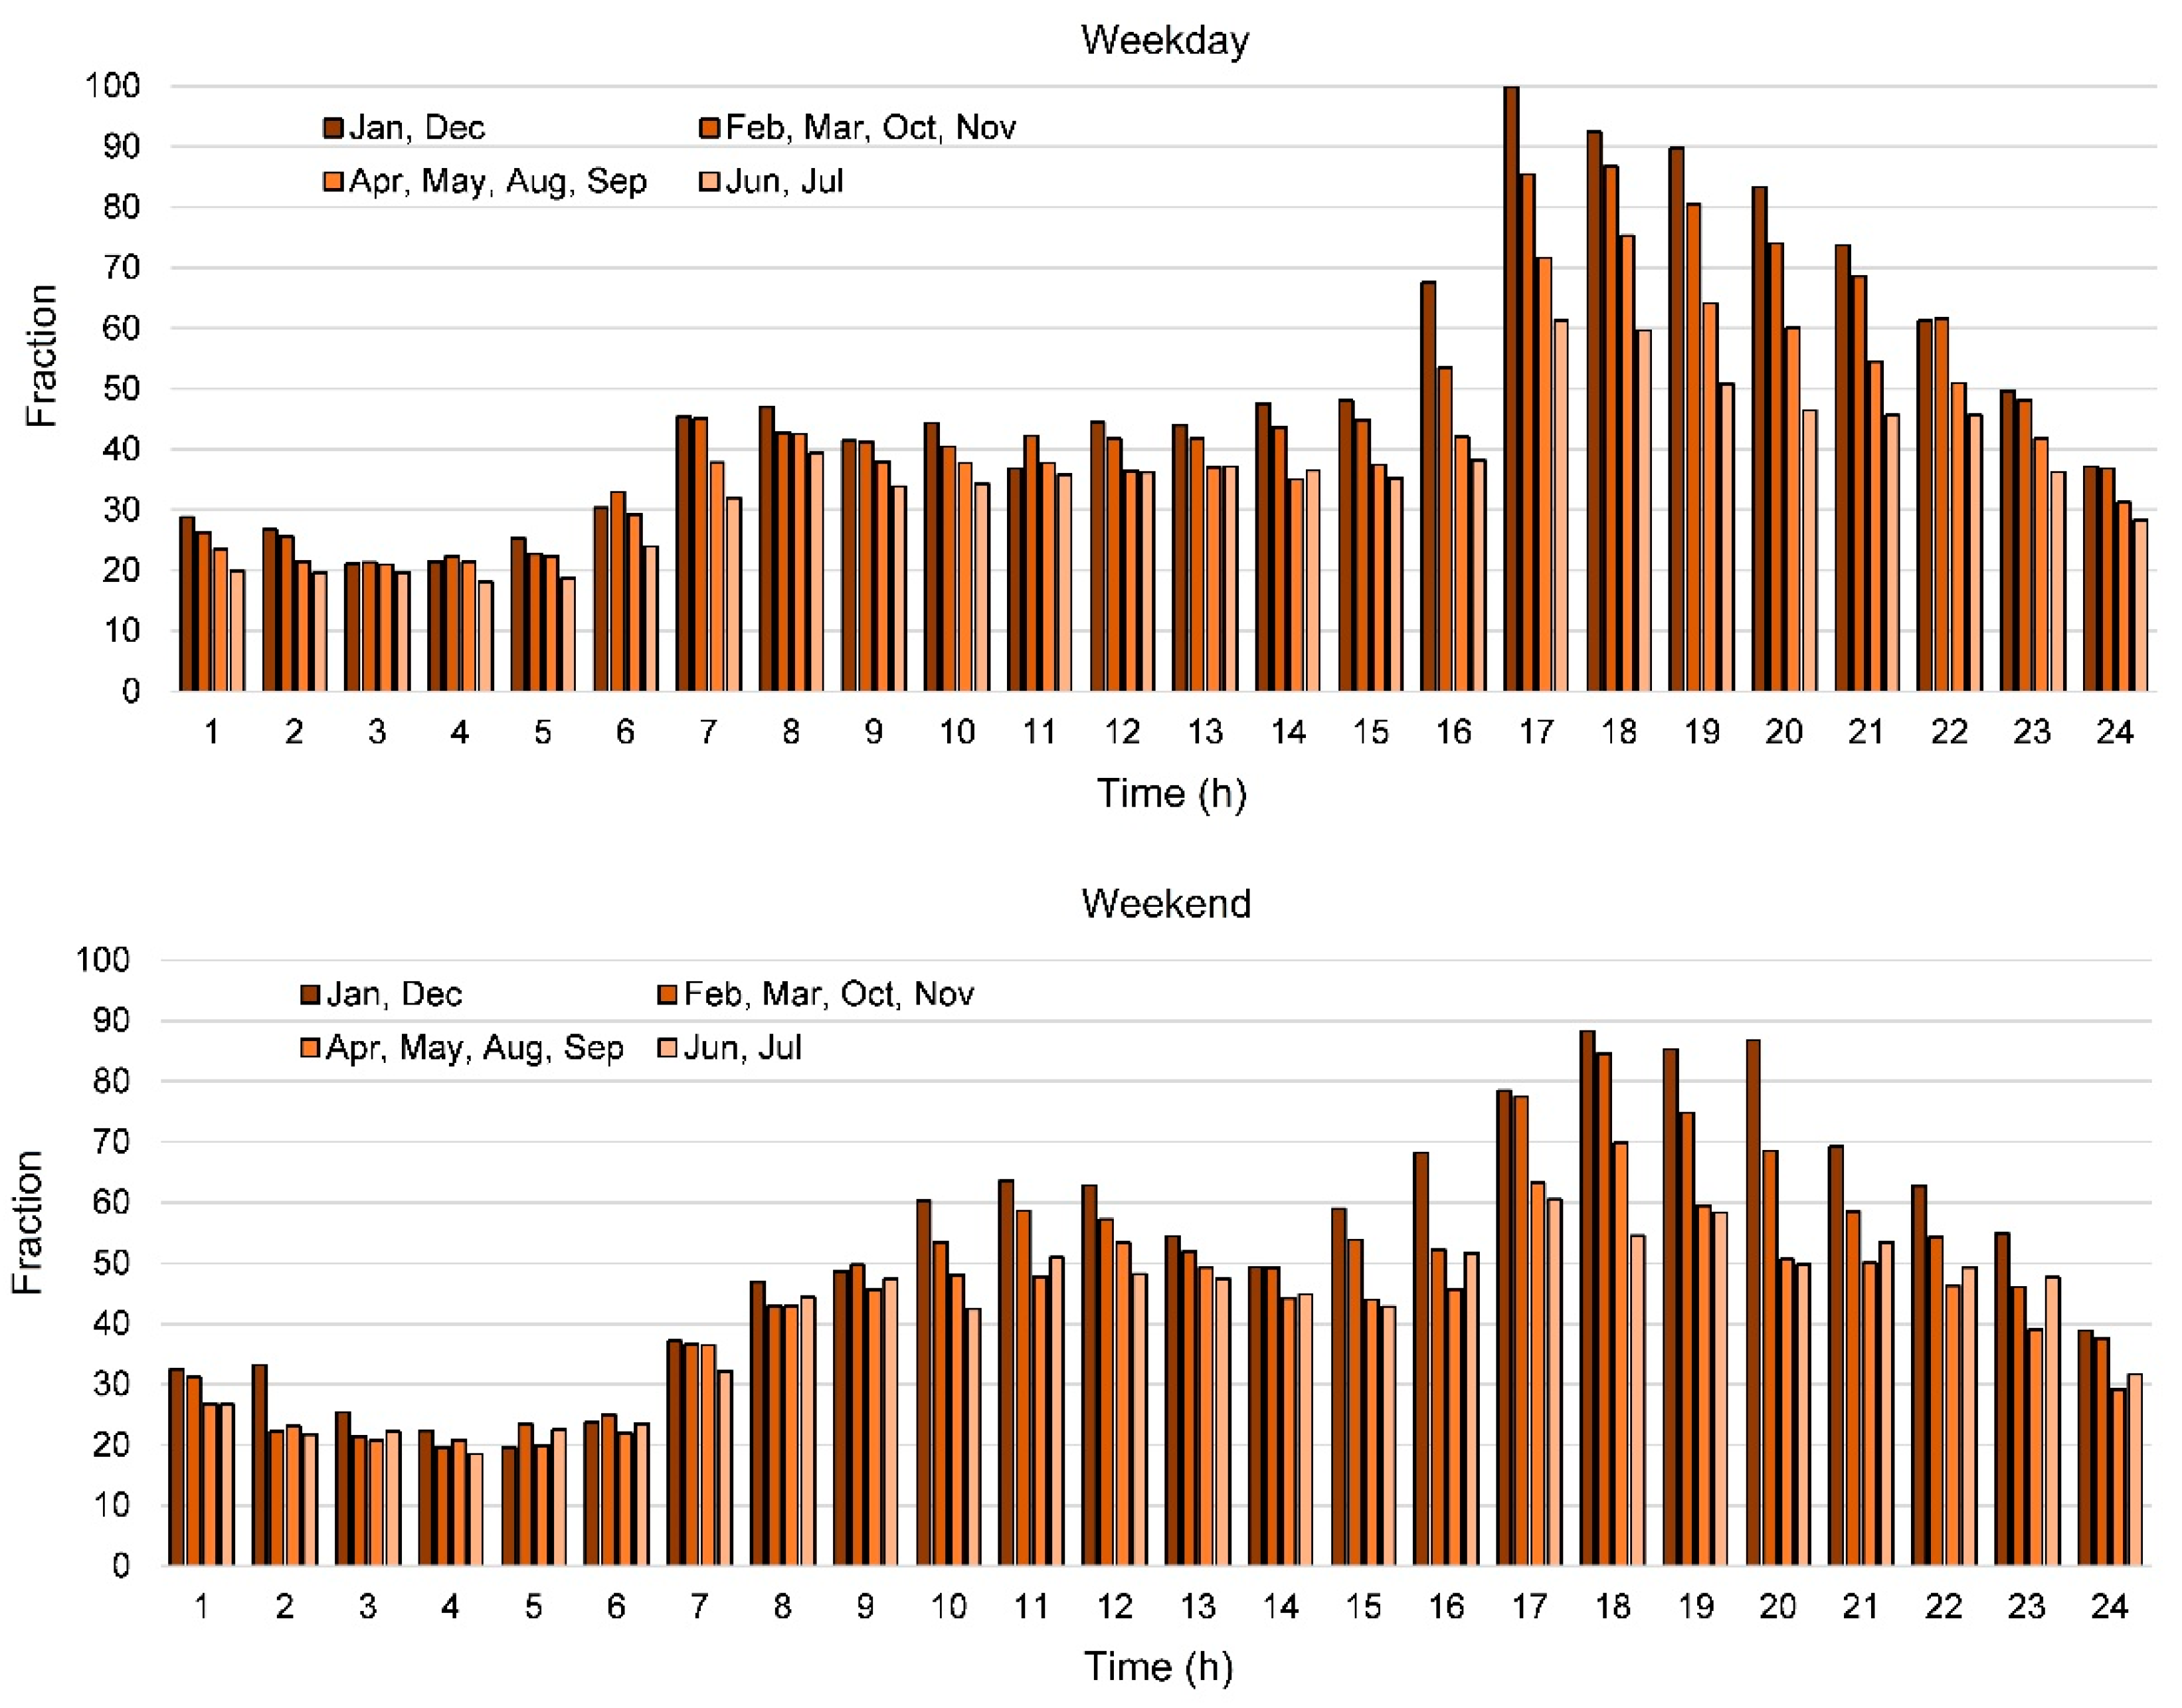
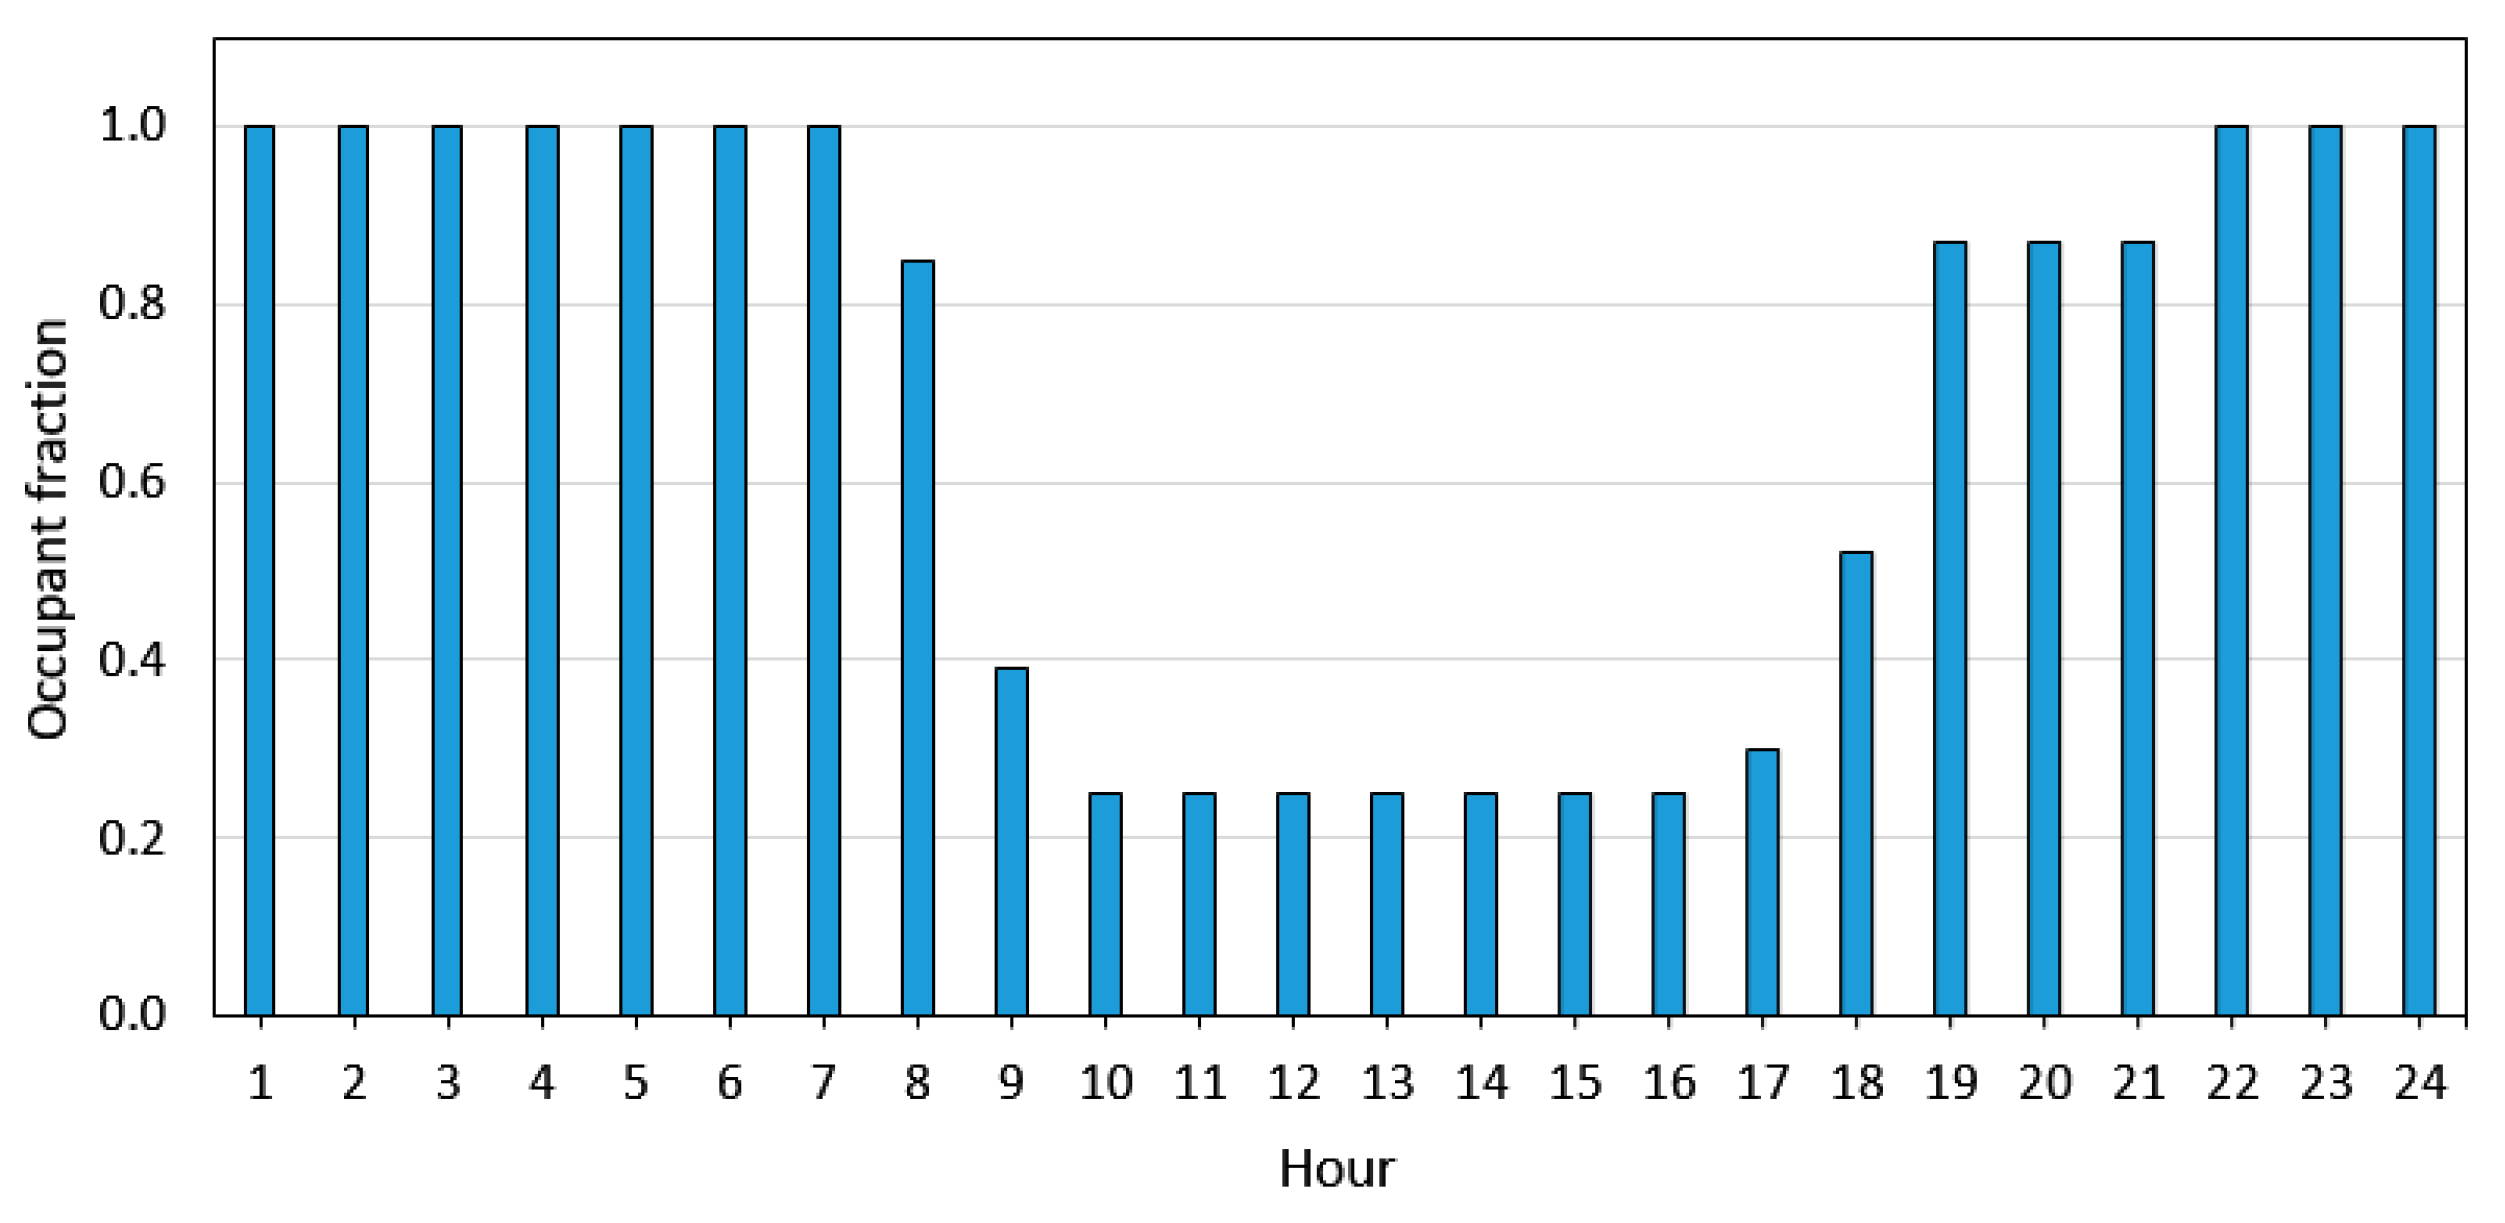
4. Demand-Controlled Ventilation

4.1. Method

Demand-controlled ventilation is a personalized air supply based on the demand of each room. Instead of modelling the house as one thermal zone, the house is separated into several thermal zones. The house is separated into four thermal zones: living room, bedroom 1, bedroom 2, and bedroom 3. The HVAC and ventilation schedules are based on the demand of the zones and occupant behaviors.
The internal heat load schedule of the rooms is the same as shown in Figure 9. The internal heat load level is set as 2 W/m2 in the bedrooms and 5 W/m2 in the living room.
The family house with one master bedroom and two single bedrooms is occupied by four people. According to suggestions by Bekö et al. [32], the occupancy time for children’s bedroom is 20:00–6:00, and for adults, it is 23:00–6:00 in New York time. The occupant schedules of the bedrooms and living room are set accordingly, as shown in Figure 23, Figure 24 and Figure 25. Bedroom 2 and 3 are children’s rooms, and are occupied 20:00–6:00. Day occupancy during the summer holidays is not taken into account.
The HVAC schedule for each room is set according to the occupancy schedule. The HVAC is turned on when the room is occupied, as shown in Figure 26.
The results of the optimized ventilation airflow rates in Section 3 are adopted: the maximum ventilation rate of the house during summer is 300 m3/h, and during winter 102 m3/h.
The ventilation strategies of the rooms are the same as shown in Figure 3, Figure 4, Figure 5 and Figure 6. The ventilation airflow rate of each ventilation inlet is set as the ratio of the room ventilation airflow rate and the number of the ventilation inlets of the room. For example, in the living room, there are three ventilation inlets (one PCMVW and 2 PCM façades). During the night in summer, the living room is ventilated with 0.042 m3/h (0.014 m3/h for each inlet). During weekday days (9:00–16:00), the occupant fraction is 0.25; thus, the airflow rate through each inlet is deduced to 0.0105 m3/h, as seen in Figure 27.
During summers, the PCMVWs in bedrooms are not used due to no-cooling demand during the day. Instead, the night ventilation of the bedrooms is from outdoor directly to the room. For the living room, both PCMVW and PCM energy storage façade operate. The PCM energy storage provides pre-cooled air during the day, when ventilation pre-cooling is needed. During the night, night ventilation operates from 20:00–7:00, to discharge heat from the PCM energy storage as well as the thermal mass in the room.
During the winter, all the PCMVWs and PCM energy storage façades are in operation. The PCM energy storage provides pre-heated air, when a heating demand is present in the room. The ventilation airflow rate of each room is shown in Figure 28.

4.2. Results

The comparison of the room electricity consumptions in summer with/without demand control of ventilation is shown in Figure 29. For all the bedrooms, the electricity consumption with demand-controlled ventilation is lower than with a constant ventilation airflow rate, especially for bedroom 2 and 3 in July and August. Each of the two bedrooms has two external walls, which results in a high energy gain of the room during the daytime. Thus, the electricity consumption of the rooms is quite high without demand-controlled ventilation. The living room has three external walls, but a much larger PCM energy storage in the ventilation system and higher ventilation airflow rates than the bedrooms, which results in lower electricity consumption than bedroom 2 and 3. For the living room, the room electricity consumption with demand control is lower than that with a constant ventilation airflow rate for most of the months, but the difference is not very large. For June and September, the living room electricity consumption with demand-controlled ventilation is even higher than that with constant ventilation airflow rate. The reason could be that the outdoor air temperature in June and September is suitable for not only night ventilation but also day ventilation. With constant ventilation airflow rate, the higher ventilation airflow rate during the day results in lower electricity consumption than with demand control.
The comparison of the heat pump electricity consumptions with/without demand control in winter is shown in Figure 30. It shows that with demand-controlled ventilation, all of the bedrooms in all the winter months have a lower electricity consumption than with a constant ventilation airflow rate, especially for bedroom 3. The probable reason is that bedroom 3 has an external wall facing north, which results in low solar heat gain and high electricity consumption of the room without demand control. For the living room, the electricity consumption with demand-control is lower than that without demand-control for most of the months, except October and April, where the demand control has slightly higher heat pump electricity consumption.
The total electricity consumption of the house and the energy-saving potential of demand-controlled ventilation is summarized in Table 5. For both summer and winter, the electricity consumption is much higher without demand-controlled ventilation. The energy-saving potential of demand-controlled ventilation is higher in winter than in summer. In summer, demand-controlled ventilation could not be operated during the night due to the night ventilation requirement of the house, which could be the potential reason for its limited energy-saving percentage.
In summer, the rooms with more external walls and windows should be have larger PCM energy storages due to the high room electricity consumption. Those rooms also have the highest energy-saving potential by demand-controlled ventilation. In winter, the rooms that only have external walls facing north have high room electricity consumption and benefit more from demand-controlled ventilation.

5. Conclusions

The PCM-enhanced ventilated window has been proven to be effective for building ventilation energy saving for both summer and winter in previous works. In this paper, the influence of ventilation airflow rate on the PCM energy storage saving potential is studied based on the EnergyPlus model of a sustainable low energy house in New York. Based on the optimized ventilation airflow rate, a demand-controlled ventilation strategy is proposed and its energy-saving potential is examined.
The influence of airflow rate on the PCM energy storage saving potential is investigated by comparing the ventilated window and façade PCM energy storage system with two reference systems: stand-alone ventilation window (VW) system and a standard window (SW) system. The main conclusions are:
The heat pump electricity consumption of the house with the PCM energy storage system < VW < SW for both summer night cooling application and winter solar energy storage application.
In summer, increasing the ventilation airflow rate decreases the electricity consumption of the house; the increasing airflow rate increases the energy-saving potential of the PCM energy storage. With a ventilation airflow rate of 300 m3/h, energy-saving of the PCM energy storage is 10.1% compared to the VW system, and 12.0% compared to the SW system.
In winter, increasing the ventilation airflow rate increases the electricity consumption of the house. The energy-saving potential of PCM energy storage is similar under different airflow rates. With a ventilation airflow rate of 102 m3/h, the energy-saving of the PCM energy storage system is 26.6% compared to the VW system, and 32.8% compared to the SW system. The PCMVW has a much higher energy-saving potential in winter than in summer, which indicates the high potential of adopting PCM in solar energy storage applications.
Based on the optimized ventilation flow rate from Section 3, a demand-controlled ventilation strategy, which personalizes the air supply to each room based on the room demand, is proposed. The setup of ventilation and air conditioning schedules of each room are based on the occupancy and electricity level of each room distinguished by weekdays, weekends, summer, and winter. The conclusions are that both in summer and winter, the room electricity consumption with demand-controlled ventilation is lower than without demand controlled ventilation. With demand control ventilation, the energy-saving percentage of the house is 14.7% in summer and 30.4% in winter.
The PCM-enhanced ventilated window with a demand-controlled ventilation system has a big building energy-saving potential in comparison with the ventilated window and standard window systems, for both summer night cooling application and winter solar energy storage application in New York climate. Future works include the energy-saving potential of PCM-enhanced ventilated windows in various climate zones, and life cycle accessment of the system.

Author Contributions

Conceptualization, P.K.H. and Y.H.; Methodology, P.K.H. and Y.H.; Writing–Original Draft Preparation, Y.H.; Writing–Review & Editing, P.K.H. and T.S.L.; Supervision, P.K.H. and T.S.L.; Funding Acquisition, T.S.L. All authors have read and agreed to the published version of the manuscript.

Funding

This research was funded by the project Det cirkulære træhus grant number 893501.

Conflicts of Interest

The authors declare no conflict of interest.

References

  1. Chen, Y.; Galal, K.; Athienitis, A.K. Modeling, design and thermal performance of a BIPV/T system thermally coupled with a ventilated concrete slab in a low energy solar house: Part 2, ventilated concrete slab. Sol. Energy 2010, 84, 1908–1919. [Google Scholar] [CrossRef]
  2. Jin, X.; Zhang, X. Thermal analysis of a double layer phase change material floor. Appl. Therm. Eng. 2011, 31, 1576–1581. [Google Scholar] [CrossRef]
  3. Pasupathy, A.; Athanasius, L.; Velraj, R.; Seeniraj, R.V. Experimental investigation and numerical simulation analysis on the thermal performance of a building roof incorporating phase change material (PCM) for thermal management. Appl. Therm. Eng. 2008, 28, 556–565. [Google Scholar] [CrossRef]
  4. Pomianowski, M.; Heiselberg, P.; Jensen, R.L.; Lund Jensen, R. Dynamic heat storage and cooling capacity of a concrete deck with PCM and thermally activated building system. Energy Build. 2012, 53, 96–107. [Google Scholar] [CrossRef]
  5. Koschenz, M.; Lehmann, B. Development of a thermally activated ceiling panel with PCM for application in lightweight and retrofitted buildings. Energy Build. 2004, 36, 567–578. [Google Scholar] [CrossRef]
  6. Fraisse, G.; Johannes, K.; Trillat-Berdal, V.; Achard, G. The use of a heavy internal wall with a ventilated air gap to store solar energy and improve summer comfort in timber frame houses. Energy Build. 2006, 38, 293–302. [Google Scholar] [CrossRef]
  7. Ismail, K.A.R.; Salinas, C.T.; Henriquez, J.R. Comparison between PCM filled glass windows and absorbing gas filled windows. Energy Build. 2008, 40, 710–719. [Google Scholar] [CrossRef]
  8. Darzi, A.A.R.; Moosania, S.M.; Tan, F.L.; Farhadi, M.; Tan, F.L.; Farhadi, M. Numerical investigation of free-cooling system using plate type PCM storage. Int. Commun. Heat Mass Transf. 2013, 48, 155–163. [Google Scholar] [CrossRef]
  9. Mosaffa, A.H.; Infante Ferreira, C.A.; Rosen, M.A.; Talati, F. Thermal performance optimization of free cooling systems using enhanced latent heat thermal storage unit. Appl. Therm. Eng. 2013, 59, 473–479. [Google Scholar] [CrossRef]
  10. Borderon, J.; Virgone, J.; Cantin, R. Modeling and simulation of a phase change material system for improving summer comfort in domestic residence. Appl. Energy 2015, 140, 288–296. [Google Scholar] [CrossRef]
  11. Fallahi, A.; Haghighat, F.; Elsadi, H. Energy performance assessment of double-skin façade with thermal mass. Energy Build. 2010, 42, 1499–1509. [Google Scholar] [CrossRef]
  12. Liu, M.; Heiselberg, P.K.; Larsen, O.K.; Mortensen, L.; Rose, J. Investigation of Different Configurations of a Ventilated Window to Optimize Both Energy Efficiency and Thermal Comfort. Energy Procedia 2017, 132, 478–483. [Google Scholar] [CrossRef]
  13. Hu, Y.; Heiselberg, P.; Guo, R. Ventilation cooling/heating performance of a PCM enhanced ventilated window—An experimental study. Energy Build. 2020, 109903. [Google Scholar] [CrossRef]
  14. Hu, Y.; Guo, R.; Heiselberg, P. Performance and control strategy development of a PCM enhanced ventilated window system by a combined experimental and numerical study. Renew. Energy 2020. under review. [Google Scholar] [CrossRef]
  15. Hu, Y.; Heiselberg, P.K. A new ventilated window with PCM heat exchanger—Performance analysis and design optimization. Energy Build. 2018, 169, 185–194. [Google Scholar] [CrossRef]
  16. Hu, Y.; Heiselberg, P.; Guo, R. PCM Solar Air Collector with Ventilated Window System and Its Ventilation Pre-Heating Effectiveness; Building Simulation: Rome, Italy, 2019; pp. 182–184. [Google Scholar]
  17. Tabares-Velasco, P.C.; Christensen, C.; Bianchi, M. Verification and validation of EnergyPlus phase change material model for opaque wall assemblies. Build. Environ. 2012, 54, 186–196. [Google Scholar] [CrossRef]
  18. Evola, G.; Marletta, L.; Sicurella, F. Simulation of a ventilated cavity to enhance the effectiveness of PCM wallboards for summer thermal comfort in buildings. Energy Build. 2014, 70, 480–489. [Google Scholar] [CrossRef]
  19. Tabares-Velasco, P.C.; Griffith, B. Diagnostic test cases for verifying surface heat transfer algorithms and boundary conditions in building energy simulation programs. J. Build. Perform. Simul. 2012, 5, 329–346. [Google Scholar] [CrossRef]
  20. Saffari, M.; de Gracia, A.; Ushak, S.; Cabeza, L.F. Economic impact of integrating PCM as passive system in buildings using Fanger comfort model. Energy Build. 2016, 112, 159–172. [Google Scholar] [CrossRef] [Green Version]
  21. Chernousov, A.A.; Chan, B.Y.B. Numerical simulation of thermal mass enhanced envelopes for office buildings in subtropical climate zones. Energy Build. 2016, 118, 214–225. [Google Scholar] [CrossRef]
  22. Ramakrishnan, S.; Wang, X.; Alam, M.; Sanjayan, J.; Wilson, J. Parametric analysis for performance enhancement of phase change materials in naturally ventilated buildings. Energy Build. 2016, 124, 35–45. [Google Scholar] [CrossRef]
  23. Bony, J.; Citherlet, S. Numerical model and experimental validation of heat storage with phase change materials. Energy Build. 2007, 39, 1065–1072. [Google Scholar] [CrossRef]
  24. Biswas, K.; Shukla, Y.; Desjarlais, A.; Rawal, R. Thermal characterization of full-scale PCM products and numerical simulations, including hysteresis, to evaluate energy impacts in an envelope application. Appl. Therm. Eng. 2018, 138, 501–512. [Google Scholar] [CrossRef]
  25. Diaconu, B.M. Thermal energy savings in buildings with PCM-enhanced envelope: Influence of occupancy pattern and ventilation. Energy Build. 2011, 43, 101–107. [Google Scholar] [CrossRef]
  26. Build with Nature. Available online: https://buildwithnature.us/ (accessed on 1 May 2020).
  27. EnergyPlus Documentation Engineering Reference. 1996. Available online: https://energyplus.net/sites/default/files/pdfs_v8.3.0/EngineeringReference.pdf (accessed on 4 May 2020).
  28. Weather Data | EnergyPlus. Available online: https://energyplus.net/weather (accessed on 20 October 2017).
  29. Jensen, R.; Nørgaard, J.; Daniels, O.; Justesen, R. Person-Og Forbrugsprofiler: Bygningsintegreret Energiforsyning; Aalborg University: Aalborg, Denmark, 2011. [Google Scholar]
  30. ASHRAE. Energy Standard for Buildings Except Low-Rise Residential Buildings; ANSI/ASHRAE/IES Standard 90.1-2007; ASHRAE: Atlanta, GA, USA, 2007. [Google Scholar]
  31. US EPA. Building Codes and Indoor Air Quality; US EPA: Washington, DC, USA, 2019.
  32. Bekö, G.; Lund, T.; Nors, F.; Toftum, J.; Clausen, G. Ventilation rates in the bedrooms of 500 Danish children. Build. Environ. 2010, 45, 2289–2295. [Google Scholar] [CrossRef]
Figure 1. The sketch of the PCM-enhanced ventilated window.
Applsci 10 04336 g001
Figure 2. The room ID and PCM ventilation window (PCMVW) and PCM façade locations.
Applsci 10 04336 g002
Figure 3. The working principle of the PCM ventilated window during summer [14]. (a) PCM discharge mode, when (hour < 7) or (hour > 20:00). (b) Ventilation pre-cooling mode, when Tindoor > 24 °C. (c) Heat mode, when Tindoor < 24 °C.
Applsci 10 04336 g003
Figure 4. The working principle of the PCM façade in summer. (a) PCM discharge mode, when (hour < 7) or (hour > 20:00). (b) Ventilation pre-cooling mode, when Tindoor > 24 °C. (c) Bypass ventilation, when Tindoor < 24 °C.
Applsci 10 04336 g004
Figure 5. The working principle of the PCMVW during winter [14]. (a) Heat storage mode, when I > 200 W/m2). (b) Heat release mode, when Tindoor < 24 °C. (c) Overheating preventing mode, when Tindoor >= 24 °C.
Applsci 10 04336 g005
Figure 6. The working principle of the PCM façade in winter. (a) Heat storage mode, when I > 200 W/m2). (b) Heat release mode, when Tindoor < 24 °C. (c) Bypass ventilation mode, when Tindoor >= 24 °C.
Applsci 10 04336 g006
Figure 7. The sketch of the heat pump system [27].
Applsci 10 04336 g007
Figure 8. The weather conditions for the simulation. (a) Outdoor air dry-bulb temperature; (b) Solar radiation.
Applsci 10 04336 g008
Figure 9. Internal heat load schedule.
Applsci 10 04336 g009
Figure 10. Occupancy schedule.
Applsci 10 04336 g010
Figure 11. Summer reference case 1 using VW [14]. (a) Night time ventilation, when (hour < 7) or (hour > 20:00). (b)Bypass ventilation, when Tindoor > 24 °C. (c) Heat mode, when Tindoor < 24 °C.
Applsci 10 04336 g011
Figure 12. The heat pump electricity consumption of each room during the summer period at a ventilation airflow rate of 102 m3/h.
Applsci 10 04336 g012
Figure 13. The heat pump electricity consumption of each room during the summer period at a ventilation airflow rate of 180 m3/h.
Applsci 10 04336 g013
Figure 14. The heat pump electricity consumption of each room during the summer period at a ventilation air flow rate of 300 m3/h.
Applsci 10 04336 g014
Figure 15. The summer total electricity consumption of the house (six-month period) under different ventilation flow rates.
Applsci 10 04336 g015
Figure 16. The PCM energy-saving potential during the summer period compared to the two reference cases.
Applsci 10 04336 g016
Figure 17. Winter reference case 1 using stand-alone ventilated windows (VW) [14]. (a) Bypass ventilation, when Tindoor > 24 °C. (b) Heat mode, when Tindoor < 24 °C.
Applsci 10 04336 g017
Figure 18. The electricity consumption of each room during the winter period at a ventilation airflow rate of 102 m3/h.
Applsci 10 04336 g018
Figure 19. The electricity consumption of each room during the winter period at a ventilation airflow rate of 180 m3/h.
Applsci 10 04336 g019
Figure 20. The electricity consumption of each room during the winter period at a ventilation airflow rate of 300 m3/h.
Applsci 10 04336 g020
Figure 21. The winter total electricity consumption of the house (six-month period) under different ventilation flow rates.
Applsci 10 04336 g021
Figure 22. The PCM energy-saving potential during the winter period compared to the two reference cases.
Applsci 10 04336 g022
Figure 23. Bedroom 1 occupancy schedule.
Applsci 10 04336 g023
Figure 24. Bedroom 2 and 3 occupancy schedule.
Applsci 10 04336 g024
Figure 25. Living room occupancy schedule.
Applsci 10 04336 g025
Figure 26. The HVAC schedule for each room.
Applsci 10 04336 g026
Figure 27. Ventilation schedule of each room during summer.
Applsci 10 04336 g027
Figure 28. The ventilation schedule of each room during winter.
Applsci 10 04336 g028
Figure 29. The electricity consumption of each room with/without demand control in summer.
Applsci 10 04336 g029
Figure 30. The electricity consumption of each room with/without demand control in winter.
Applsci 10 04336 g030
Table 1. The thermal properties of the constructions.
ConstructionMaterialThickness (mm)U value (W/m2K)
WallPressed straw panel and wood fiberboard4500.12
Foundation Wood fiber4000.12
Roof Wood fiber6000.045
Table 2. The PCM amount for each room.
LocationLiving Room PCM Façade 1Living Room PCM Façade 2Living Room PCMVWBedroom 1 PCMVWBedroom 2 PCMVWBedroom 3
PCMVW
PCM amount (kg)939340404040
PCM surface area (m2)23.3823.3810101010
Total heat capacity [from 10–30 °C] (MJ)7.357.393.163.163.163.16
Table 3. Window constituents and properties.
ConstructionMaterialU Value (W/m2K)g Value
Windows and glass doors3 glass panels0.80.63
VW out layer glass2 glass panels1.10.63
VW inner layer glassSingle glass panel5.70.79
Table 4. Shading properties.
ConstructionsSolar
Transmittance
Solar ReflectanceThickness (mm)Conductivity (W/m·K)
External shading for PCM energy storage00.550.01
Between glass shading0.30.620.2
Table 5. Total electricity consumption of the house and demand-control energy-saving percentages.
SummerWinter
No demand control heat pump electricity consumption (kWh/m2)65.0957.32
Demand control heat pump electricity consumption (kWh/m2)55.5539.91
Demand control energy-saving potential14.7%30.4%

