Article

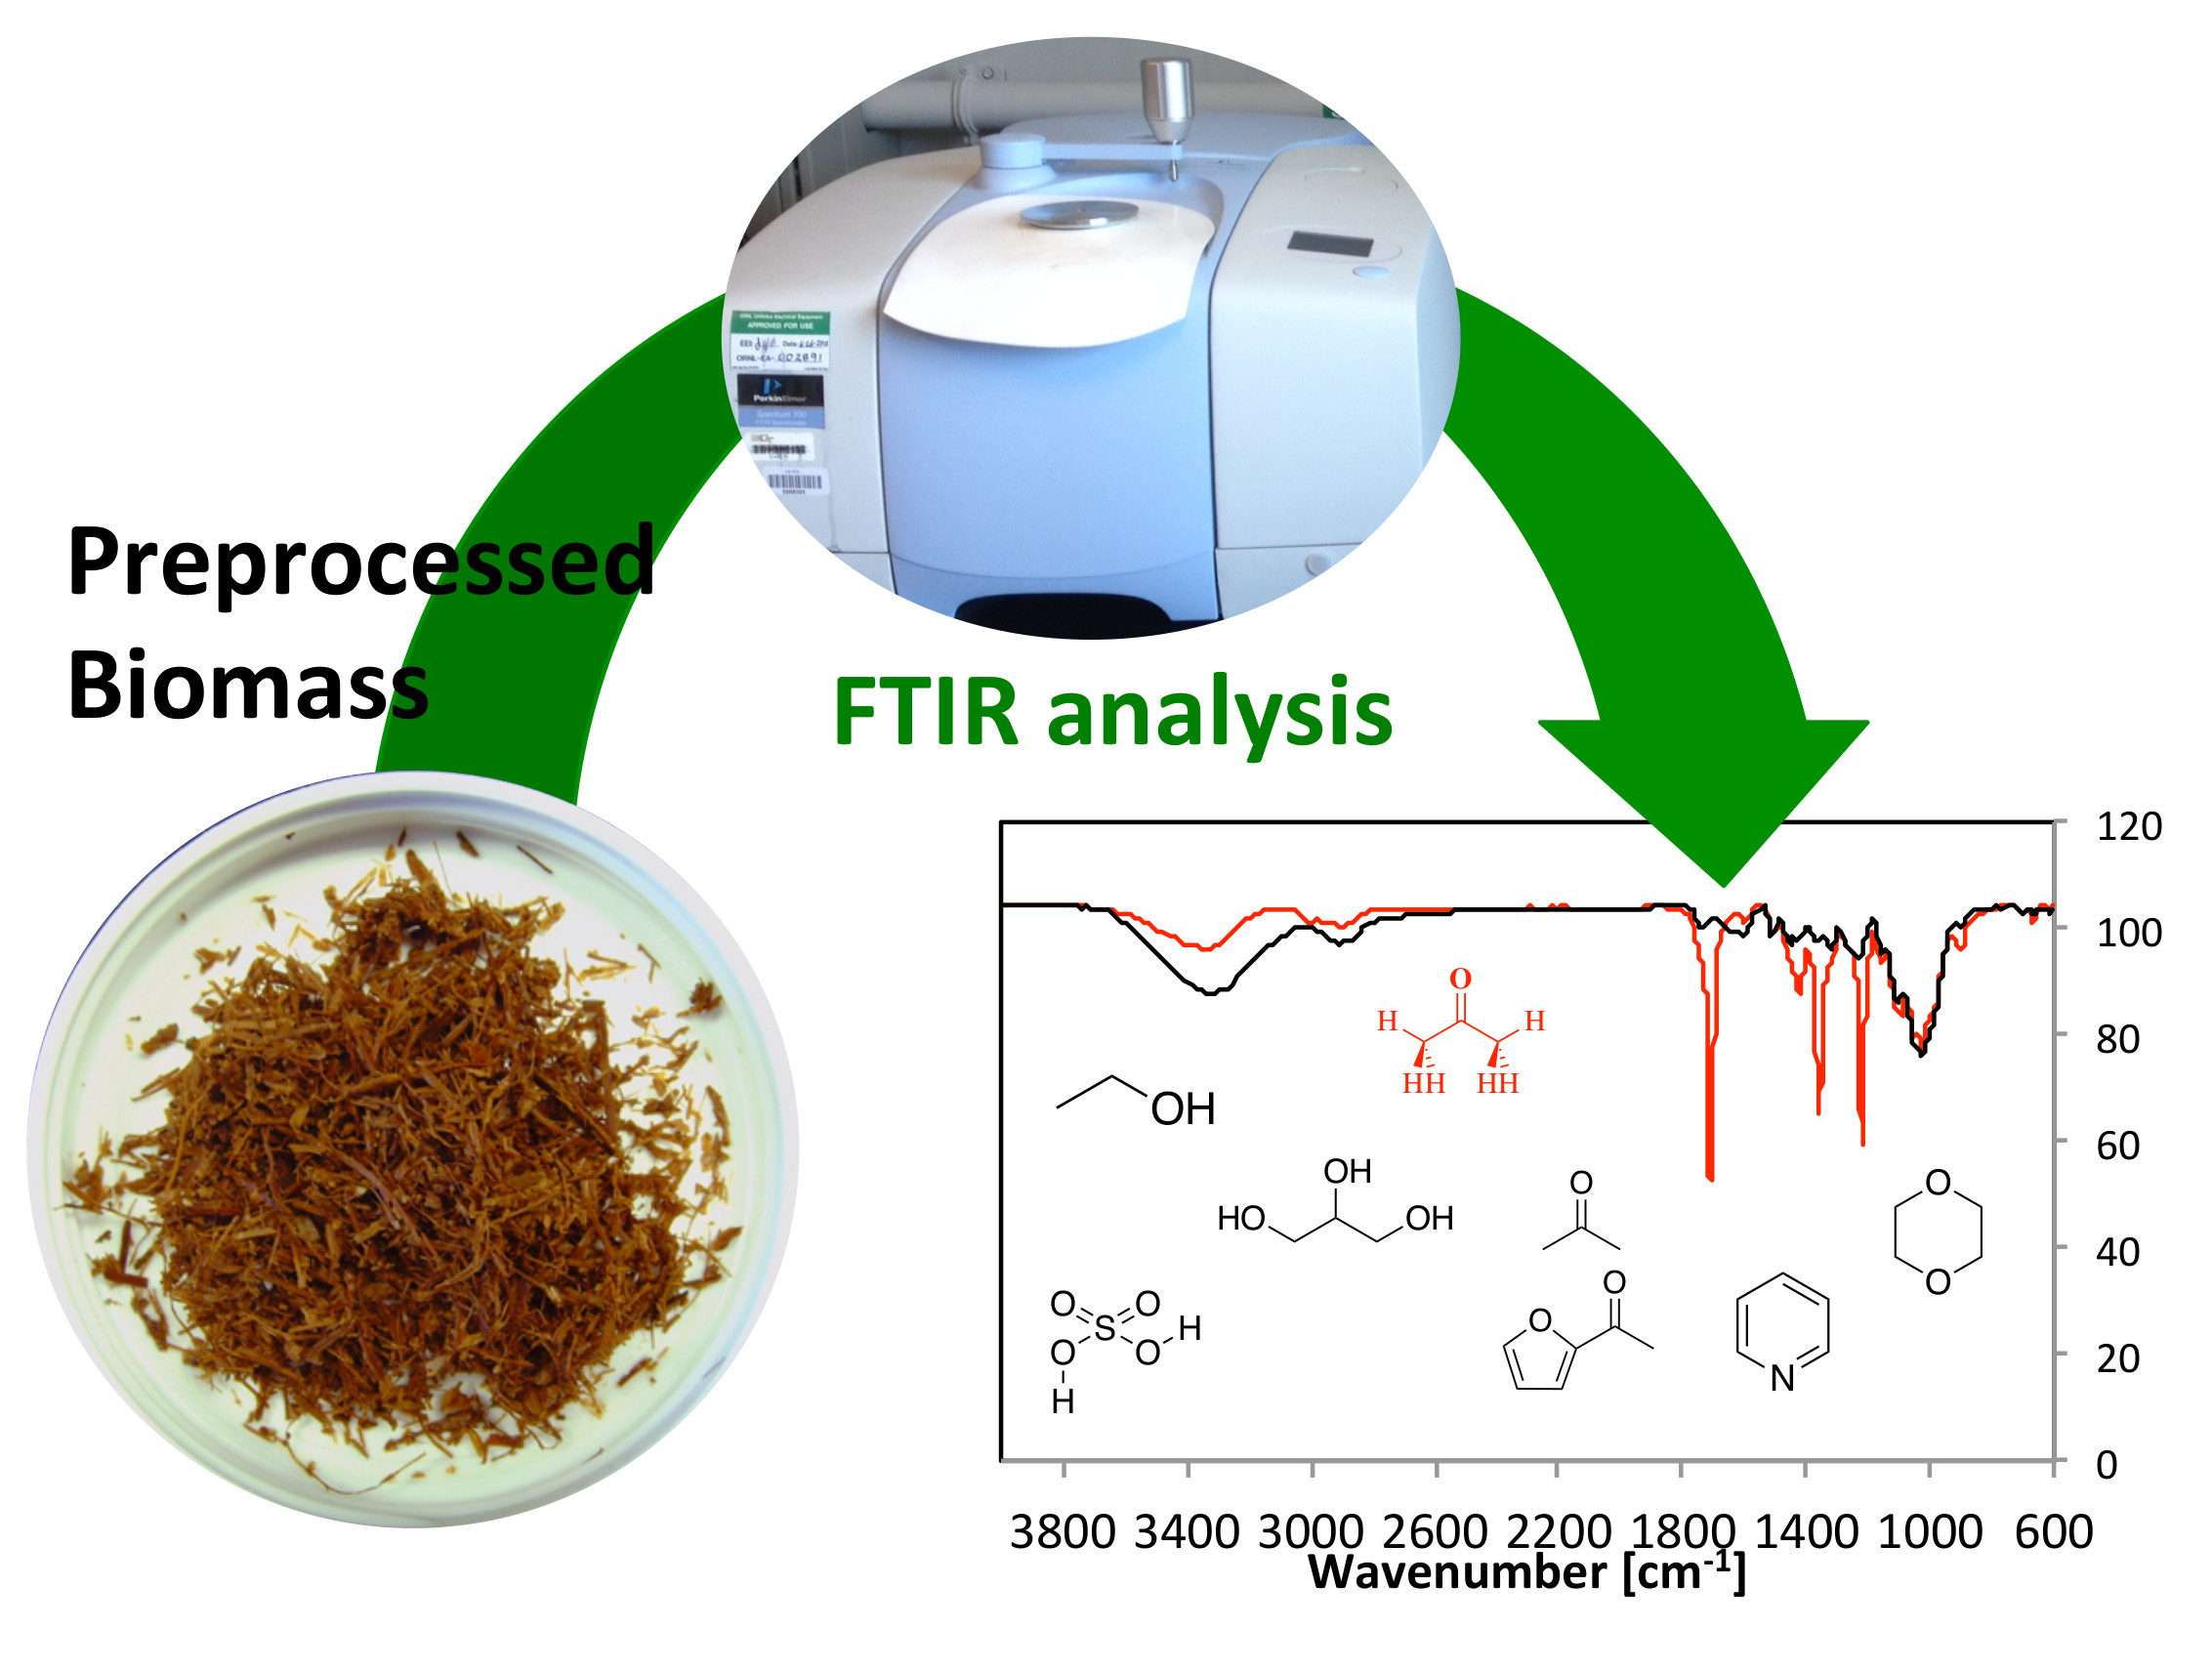
Observation of Potential Contaminants in Processed Biomass Using Fourier Transform Infrared Spectroscopy

1
Department of Chemical Engineering, State University of New York College of Environmental Science and Forestry, Syracuse, NY 13104, USA
2
Center for Renewable Carbon, Department of Forestry, Wildlife, and Fisheries, University of Tennessee Institute of Agriculture, Knoxville, TN 37996, USA
3
Center for Bioenergy Innovation, Biosciences Division, University of Tennessee-Oak Ridge National Laboratory Joint Institute for Biological Science, Oak Ridge National Laboratory, Oak Ridge, TN 37831, USA
4
Department of Chemical and Biomolecular Engineering, University of Tennessee, Knoxville, TN 37996, USA
*
Authors to whom correspondence should be addressed.
Appl. Sci. 2020, 10(12), 4345; https://doi.org/10.3390/app10124345
Submission received: 2 June 2020 / Revised: 17 June 2020 / Accepted: 22 June 2020 / Published: 24 June 2020
(This article belongs to the Special Issue Biorefinery: Current Status, Challenges, and New Strategies)

Abstract

:
With rapidly increased interests in biomass, diverse chemical and biological processes have been applied for biomass utilization. Fourier transform infrared (FTIR) analysis has been used for characterizing different types of biomass and their products, including natural and processed biomass. During biomass treatments, some solvents and/or catalysts can be retained and contaminate biomass. In addition, contaminants can be generated by the decomposition of biomass components. Herein, we report FTIR analyses of a series of contaminants, such as various solvents, chemicals, enzymes, and possibly formed degradation by-products in the biomass conversion process along with poplar biomass. This information helps to prevent misunderstanding the FTIR analysis results of the processed biomass.

Graphical Abstract

1. Introduction

A proper understanding of biomass characteristics is important for the effective utilization of biomass. It not only provides natural properties of biomass but also tells the influences of the applied processes on the biomass structures. Characteristics of biomass have been investigated in different aspects, including physical, chemical, thermal, mineral, and surface properties. For a better understanding of biomass and its products, several different analytical approaches have been developed using diverse analytical techniques such as high-performance liquid chromatography (HPLC), gas chromatography (GC), gel permeation chromatography (GPC), nuclear magnetic resonance (NMR), time-of-flight secondary ion mass spectrometry (ToF-SIMS), X-ray, transmission electron microscopy (TEM), scanning electron microscopy (SEM), differential scanning calorimetry (DSC), thermogravimetric analysis (TGA), and Fourier transform infrared (FTIR) for measuring carbohydrate contents, identification and quantity of products, molecular weights, structural information such as linkages and composition, spatial distribution of molecules and chemical structures on surface, crystallinity, morphological characteristics in nano- and micro-scales, thermal properties (melting point, glass transition temperature, etc.), functional groups and chemical bonds, and other important information of biomass and its products and by-products [1,2,3,4,5,6,7,8,9]. Among these methods, FTIR spectroscopy is one of the most widely applied analytical methods to study the functional groups of biomass by measuring the absorption bands of samples [10]. It provides qualitative and semi-quantitative information for functional groups of biomass by determining the presence of fundamental molecular vibrations [11]. Its Fellgett and Jacquinot advantages allow for rapid and ready characterization compared to many other biomass analysis methods [12]. Moreover, it does not need any modification and/or deconstruction of biomass; therefore, original properties can be monitored as the sample is. Despite these advantages, the characterization of biomass using FTIR is still challenged by overlapping the bands from different biomass components and/or unexpected impurities from the applied catalysts and solvents. In particular, fingerprint regions are complicated to identify because of many series of absorptions. For fast and reliable analysis of the substances from different processing, detection, and identification of possible contaminants are very important.
Lignocellulosic biomass is a heterogeneous matrix. Due to the complicated composition and structural properties of biomass, single or multi-stage pretreatment/preprocessing is necessary for its utilization, isolation, and analyses. Various chemicals, such as organic solvents, acids, alkalis, and inorganic salt solutions have been applied for isolation, pretreatment, conversion, and other reactions on biomass [13,14,15,16,17,18,19]. Biological catalysts, such as enzymes, have also been used in many biomass conversion processes or characterization methods [20]. Besides, each biomass component could be decomposed and/or modified under severe process conditions [21]. The presence of these chemicals and by-products are considered as impurities and could potentially affect their characterization results; therefore, they should be completely removed after the processes. Unfortunately, these components are possibly retained on the surface of biomass after these preprocessing and cause misinterpretation of the targeted biomass structure by their overlapped FTIR spectra. Besides the misreading of the biomass properties, the detection of contaminants can be used to determine the necessity of biomass washing step. Although the IR assignments of many chemicals and solvents are available individually, their actual contaminations are not easily detected due to the spectra of biomass itself. In this study, poplar biomass was mixed with known chemicals and enzymes, which are potential contaminants, and their overlapped FTIR spectra in each sample were identified and discussed.

2. Materials and Methods

2.1. Materials

Poplar was harvested in the Oak Ridge National Laboratory in 2008. Prior to the FTIR analysis, the sample was Wiley-milled and screened to 0.42 mm. Extractives were removed from the original poplar sample (~10 g) by toluene/ethanol Soxhlet extraction (2:1, v/v, 200 mL) for 8 h followed by 6 h of water extraction. All chemicals (acetone, ethanol, methanol, tetrahydrofuran, dioxane, toluene, glycerol, chloroform, pyridine, sulfuric acid, hydrochloric acid, phosphoric acid, acetic acid, sodium hydroxide, ammonium hydroxide, 1-butyl-3-methylimidazolium chloride, 1-benzyl-3-methylimidazolium chloride, choline chloride, urea, p-hydroxybenzoic acid, 4-hydroxybenzaldehyde, p-coumaric acid, hydroxymethylfurfural, and furfural) and enzymes (cellulase and β-glucosidase) used in this study were purchased from VWR, Sigma-Aldrich, or Fisher Scientific. Deep eutectic solvents (DESs) formed by combining hydrogen bonding donors (HBDs: urea, p-hydroxybenzoic acid, 4-hydroxybenzaldehyde, p-coumaric acid) and hydrogen bonding acceptor (HBA: choline chloride) at 80 °C prior to the FTIR analysis.

2.2. Isolation of Cellulose, Hemicellulose, and Lignin

Cellulose, hemicellulose, and lignin were isolated from the extractives-free poplar, as described in the previous studies [2,22]. In brief, the biomass was delignified using peracetic acid at 25 °C with 5% (wt/wt) solid loading for 24 h. The remaining solid, holocellulose, was air dried for 24 h. Two-step alkali extraction with 17.5% (wt/wt) and 8.75% (wt/wt) sodium hydroxide was conducted at 25 °C for 2 h in each step. The remaining solid fraction was called α-cellulose after being air dried, and the liquid fraction was neutralized with anhydrous acetic acid and mixed with ethanol three times to precipitate hemicellulose.
Cellulolytic enzyme lignin (CEL) was separated from the poplar samples. The extractives-free poplar was ball-milled using Retsch PM 100 at 600 rpm for 2 h. The ball-milled sample was hydrolyzed at 50 °C with the CTec2 enzyme in acetate buffer solution (pH 4.8) for 48 h twice. The residual solid was extracted with 96% dioxane for 48 h. The dioxane-extracted fraction was recovered at 40 °C by rotary evaporation and freeze drying and used for further analysis.

2.3. Fourier Transform Infrared (FTIR) Analysis

To observe the FTIR spectra of contaminants from the spectra of biomass clearly, about 30–50 μL of contaminant was loaded to 0.3 g of extractives-free poplar in 20 mL glass vial and mixed by vortexing prior to the analysis. The prepared DESs were loaded to biomass and physically mixed using a glass rod due to their relatively high viscosity. FTIR analysis was conducted using the Spectrum One FTIR spectrometer (PerkinElmer, Wellesley, MA, USA) equipped with a universal attenuated total reflection (ATR) accessory. ATR-FTIR spectra between 4000 and 600 cm−1 were measured at a 4 cm−1 resolution and averaging 16 scans per sample.

3. Results and Discussion

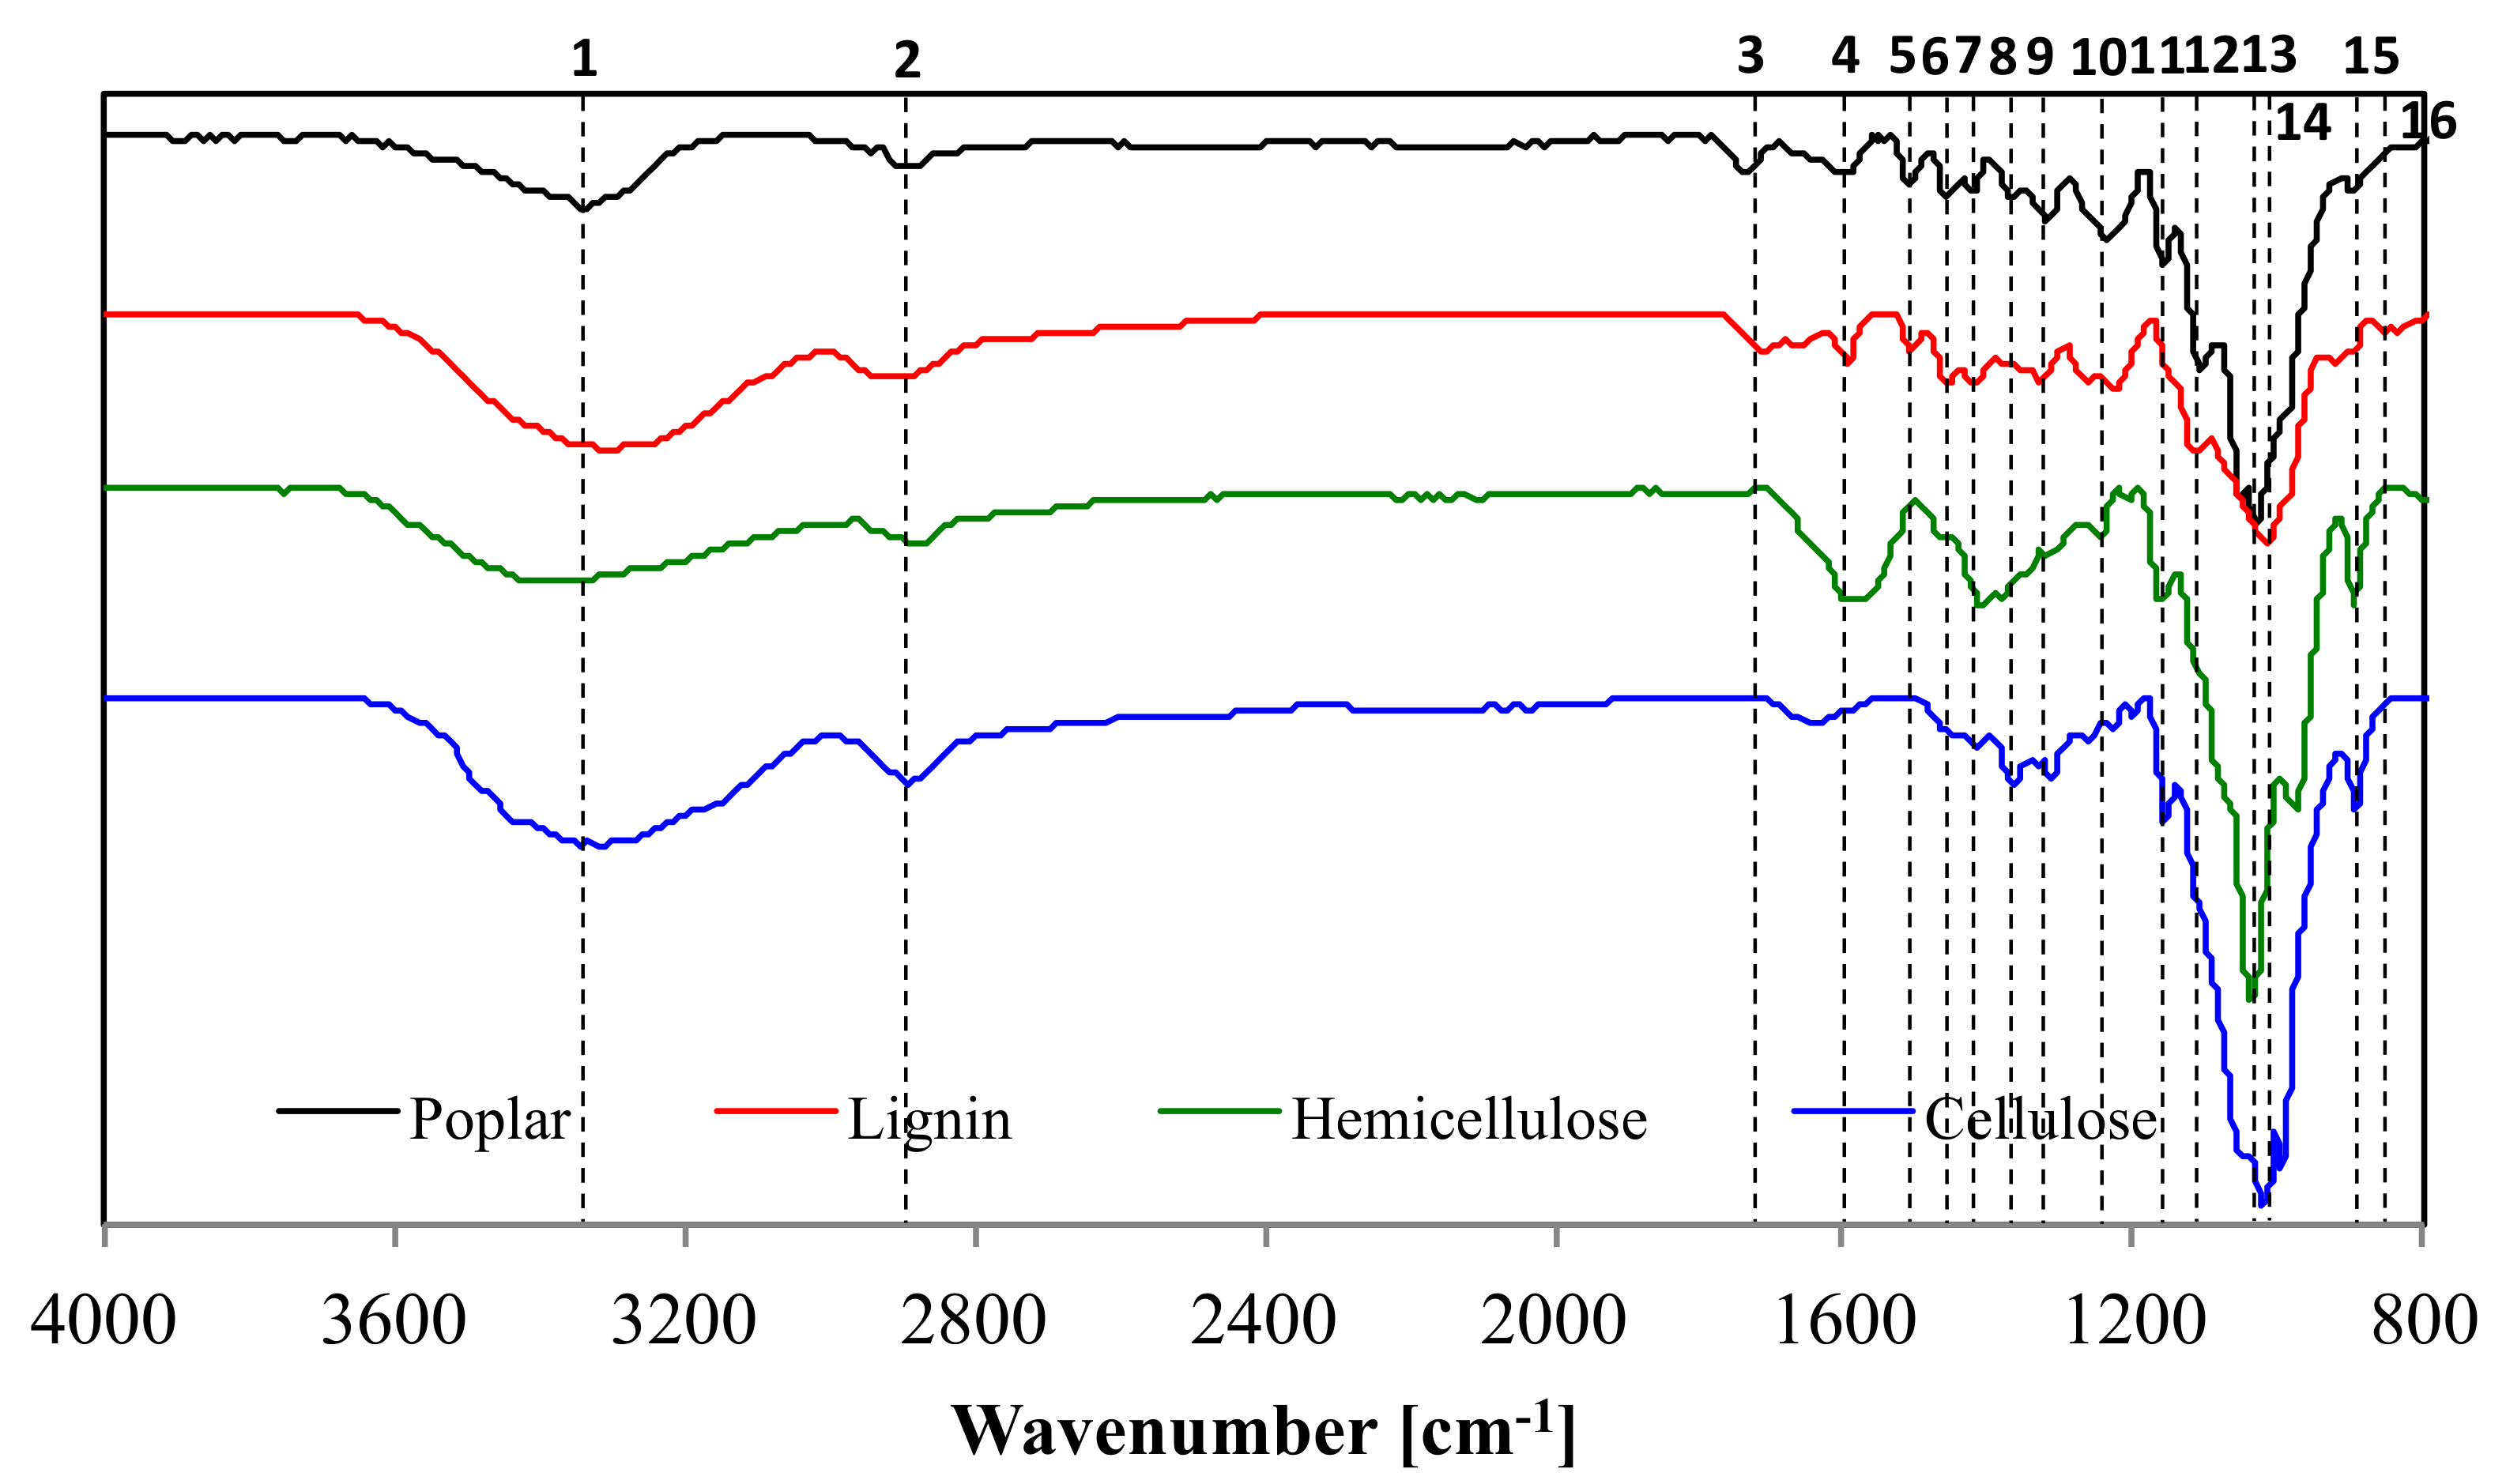
3.1. Major Components of Biomass

Cellulose, hemicellulose, and lignin are three main components in lignocellulosic biomass. Table 1 and Figure 1 present the FTIR band assignments and spectra of poplar and its major components isolated from the same biomass. Prior to the analysis, other extractives in the poplar sample were removed by two-step extraction: 8 h toluene/ethanol Soxhlet-extraction followed by 6 h water extraction. Isolated cellulose, hemicellulose, and lignin were analyzed using FTIR and compared with the extractives-free poplar. The assignment of each band was identified according to the previous studies [23,24,25,26,27,28,29,30,31].
The IR spectra of poplar and its components showed strong O-H stretching and C-H stretching absorptions at 3367 and 2914 cm−1, respectively. These two strong absorptions are because all three major components in biomass (cellulose, hemicellulose, and lignin) have hydroxy groups and many C-H bonds in their structures. The absorption at 1745 cm−1 was due to C=O stretching in hemicellulose and lignin. The absorption at 1618 cm−1 represented asymmetric stretching band of the carboxyl group of glucuronic acid in hemicellulose and C=O stretching in conjugated carbonyl of lignin. The band at 1650 cm−1 in the IR spectrum of cellulose was possibly caused by adsorbed H2O. Higher absorption at 3367 cm−1 was also observed because of the moisture content in the biomass. In addition, the bands due to symmetric CH2 bending vibration in cellulose, carboxyl vibration in glucuronic acid with xylan, and C-H in plane deformation with aromatic ring stretching in lignin were observed at 1424 cm−1. The IR absorption bands at 1582 and 1508 cm−1 assigned to aromatic ring stretching and vibration (C=C-C) in lignin. The band at 1457 cm−1 was observed in lignin due to its C-H deformation in methyl and methylene. The C-H bending in cellulose, hemicellulose, and lignin (aliphatic C-H stretching in methyl and phenolic alcohol) was observed at 1370 cm−1. The CH2 wagging in cellulose and hemicellulose and the C-O stretching of C5 substituted aromatic units, such as syringyl and condensed guaiacyl units, were assigned at 1317 cm−1. Similarly, the C-O stretching of guaiacyl unit in lignin was assigned at 1235 cm−1. The bands at 1160 and 896 cm−1 arise from C-O-C stretching at the β-(1→4)-glycosidic linkages in cellulose and hemicellulose. The absorption at 1108 cm−1 was associated with aromatic C-H in plane deformation for the syringyl unit. The band at 1053 cm−1 was assigned to the C-OH stretching vibration of cellulose and hemicellulose. Moreover, this band was for C-O deformation in secondary alcohols and aliphatic ethers. The C-O stretching of cellulose and primary alcohols and C-H in plane deformation for guaiacyl unit exhibited at 1032 cm−1. Aromatic C-H out of plane bending in lignin was presented at 846 cm−1. Although several FTIR bands of different biomass components were overlapped, the IR spectra of samples still provide important clues, including changes of chemical composition, functionalization, and other transformation of biomass for understanding the applied biomass processing.

3.2. Commonly Used Pretreatment and Preprocessing Solvents

Table 2 and Figure S1 show the band assignment for common biomass processing solvents. Water is the most common solution in biomass analysis and the conversion processes. It also exists in the air, and a certain amount can be accumulated in biomass during its storing and processing. The existence of water in biomass remarkably increased the bands at 3354 and 1653 cm−1 because of its O-H stretching and O-H-O scissors bending, respectively [32]. Acetone, ethanol, and methanol are common organic solvents for the diverse pre- and post-processing of biomass, and they are also produced from biomass [33]. Acetone contamination on poplar was observed at 3005, 2908, 1713, 1431, 1364, and 1222 cm−1 representing its CH3 degenerated stretching, CH3 symmetrical stretching, C=O stretching, CH3 degenerated deformation, CH3 symmetrical deforming, and C-C stretching, respectively [34]. A decrease in the bands at 3354 and 1653 cm−1 is possibly due to the displacement of water in biomass by acetone. The spectra of ethanol impurity were shown at 3350, 2980, and 1056 cm−1 for O-H stretching, C-H stretching, and C-O stretching, and those of methanol were at 3352, 2952, 2879, 1465, 1450, 1336, 1053 and 1026 cm−1 for O-H stretching, C-H stretching (asymmetric), C-H stretching (symmetric), C-H bending (asymmetric), C-H bending (symmetric), O-H bending, CH3 rocking, and C-O stretching, respectively [34,35,36]. Besides these chemicals, tetrahydrofuran (THF), dioxane, toluene, glycerol, pyridine, and chloroform are well-known solvents for diverse biomass pretreatment, isolation/purification, and analyses [1,3,19,37]. In addition, some chemicals, such as toluene, can be produced from biomass components [38]. The assignments of these impurities were assigned according to the previous studies. Contamination of poplar by THF appeared at 2977 and 2875 cm−1 for its C-H stretching, 1063 cm−1 for ring deformation, and 912 cm−1 for CH2 twisting [39]. The bands of dioxane were observed at 2960, 2890, 1457, 1322, 1255, 1119, 1057, 889 and 872 cm−1 to show its equatorial (higher frequency) C-H stretching, axial (lower frequency) C-H stretching, symmetric CH2 deformation, CH2 wagging, CH2 twisting, C-O-C symmetric stretching, ring trigonal deformation, C-C stretching, and C-O-C stretching, respectively [40]. The addition of toluene on poplar caused three bands including 3069 cm−1 for C-H stretching, 1497 cm−1 for C-C stretching, and 728 cm−1 for C-H out of plane bending [41]. Glycerol on poplar had the bands for O-H stretching at 3341 cm−1, C-H stretching at 2948 and 2897 cm−1, C-H deformation of secondary alcohol at 1333 and 1239 cm−1, C-O stretching of primary alcohol at 1034 cm−1, and O-H bending at 923 cm−1 [42,43]. Chloroform contaminants also showed at 1220 and 755 cm−1 for C-H bending and CCl3 stretching [34]. Pyridine contamination resulted in additional bands for C-H stretching at 3036 cm−1, C-C bonding at 1583 cm−1, C-N stretching at1485 cm−1, C-H in plane wagging at 1438 cm−1, symmetric C-H wagging at 1203 cm−1, C-H wagging at 1069 cm−1, C-C in plane wagging at 1032 cm−1, C-H out of plane bending at 750 and 693 cm−1 [44,45]. The intensities of the bands at 3353 and 1653 cm−1 decreased with the contaminants that do not contain OH groups such as acetone, THF, dioxane, toluene, chloroform, and pyridine due to the displacement of moisture in biomass by these solvents. On the other hand, the intensity increased with the contaminants having OH groups such as water, ethanol, methanol, and glycerol.

3.3. Acids and Alkalis

Sulfuric acid, hydrochloric acid, acetic acid, phosphoric acid, ammonium hydroxide, and sodium hydroxide on the poplar sample were observed. As Table 3 and Figure S2 present, most acids on poplar, including sulfuric acid, hydrochloric acid, and phosphoric acid, commonly had the bands at 3370 and 1660 cm−1 to represent O-H bonding and O-H-O scissors bending, respectively, because of water content. The contamination bands from sulfuric acid in the literature at 1362 and 750 cm−1 for S=O (1362 cm−1) and S-O stretching (750 cm−1) were not clearly appeared in this study [46]. A relatively low concentration of sulfuric acid (4%) could be the reason for weak intensities of the contaminant. Hydrochloric acid showed H-Cl stretching at 2942 cm−1, while phosphoric acid had a P-OH bond and P=O stretching at 2904 and 1161 cm−1, respectively [34,47,48]. Acetic acid bands appeared at 3351, 2916, 1706, 1427, 1234, and 1031 cm−1 to indicate its O-H stretching, symmetric CH3 stretching, C=O stretching, CH3 deformation, O-H bending and CH3 rocking, respectively [34]. Sodium hydroxide had the bands caused by water at 3360 and 1660 cm−1, but there were no other clear contamination bands observed. Similarly, ammonium hydroxide had the IR bands at 3350 and 1660 cm−1 from both water and NH3 content but N-H stretching of NH4+ also appeared at 2914 cm−1. Previous study also said that adsorption of ammonia increased the overall polarity and resulted in the absorbance of several bands (e.g., 1115 and 1036 cm−1 in this study) not from the N-H vibrations [49].

3.4. Ionic Liquids

Besides the aforementioned chemicals, FTIR spectra and the band assignments of ionic liquids, enzymes, and biomass-derived chemicals on poplar are presented in Table 4 and Figures S3–S5. The bands from 1-butyl-3-methylimidazolium chloride contaminant were observed at 3341, 1658, and 1604 cm−1 representing the formation of quaternary amine salt formation with chlorine, C=C stretching, and C=N stretching, respectively. However, the band at 835 cm−1 representing C-N stretching vibration was not clearly observed [50]. The bands from 1-benzyl-3-methylimidazolium chloride were 2961, 1574, 765, and 633 cm−1 from C-H stretching, C-C stretching of ring vibration, and C-N/C-Cl in-plane bending, respectively [51]. Moreover, two bands at 1383 and 1176 cm−1 were observed; however, further study is needed to identify them.
The bands of choline chloride-urea, which is a well-known DES, were at 3435 and 3340 cm−1, which ascribed to the stretching of –NH2 (asymmetric and symmetric), 1669 cm−1 for the bending vibration of –NH2, 1597 cm−1 for bending vibration of -OH possibly due to the existence of water, 1474 cm−1 for CH3 rocking, 1152 cm−1 for asymmetric C-N stretching, 1062 cm−1 for CH2 rocking, 961 cm−1 for asymmetric stretching of CCO from choline structure and 790 cm−1 from C=O bonding [52,53]. Three lignin-based DESs, choline chloride–p-hydroxybenzoic acid (PHA), choline chloride–4-hydroxybenzaldehyde (PB), and choline chloride–p-coumaric acid (PCA), were mixed with poplar sample to observe the possible contamination bands. The bands of choline chloride–PHA were observed at 3180 cm−1 for O-H stretching, 1681 cm−1 for C=O stretching, 1581 cm−1 for the asymmetric stretch of COO vibrations, 1282 cm−1 for C-O stretching vibration, 1082 cm−1 for C-O stretching, 953 cm−1 for C-N stretching, 861 cm−1 for CH2 rocking vibrations, 838 cm−1 for aromatic C-H out-of-plane bending, 786 cm−1 for C–C stretching [54,55]. The bands from choline chloride–PB were observed at 3122 cm−1 for the stretching vibration of the phenolic O-H group exhibiting intermolecular hydrogen bonding, 1667 cm−1 for the stretching vibration of carbonyl group, 1272 cm−1 for the methylene, 1030 cm−1 for C-H binding vibration [56]. The bands from choline chloride—PCA DES were observed at 3126 cm−1, 1675 cm−1, 1606 cm−1, 1160 cm−1, 848 cm−1 from bending vibration of –NH2, C=O stretch of carboxylic acid, C=C stretching, C-OH stretching, C-H stretching and 771cm−1 from stretching of the -OH group on the second carbon of the choline chloride [57,58,59].

3.5. Enzymes

Enzymes such as cellulase and β-glucosidase break polysaccharides in biomass to fermentable sugars. The bands at 3353, 2942, 2900, 1642, 1334, and 1036 cm−1 were observed from cellulase (Table 4 and Figure S4). The bands at 3353, 2942, and 2900 cm−1 were from N-H/O-H stretching and the C-H stretching (asymmetric and symmetric) of cellulase. The bands at 1642, 1432, 1334, and 1036 cm−1 were possibly from NH2 scissoring, C-C stretching, C-N stretching, and C-O stretching, respectively [60,61,62]. β-glucosidase also showed similar bands at 3351, 1646, 1432, and 620 cm−1, which represented N-H stretching, N-H bonding and C=O stretching, N-H bending, and N-H out of plane bending, respectively [63].

3.6. Biomass-Derived Chemicals

Biomass can be contaminated by its decomposed fractions. For instance, furan-based chemicals such as furfural and hydroxymethylfurfural can be produced through the dehydration of hexoses and pentoses in biomass. As Figure S5 presents, HMF contamination showed at 3364, 1661, and 1561 cm−1 from O-H stretching, C=O stretching (carbonyl), and C=C stretching of furan ring, respectively [64]. Furfural also showed bands at 3134 cm−1 from C-H stretching of furan ring, at 2859 cm−1 from the C-H vibration of aldehyde group, 1671 cm−1 from C=O in the conjugated carbonyl group, 1465 cm−1 from C=C stretching of furan ring, 1276 and 1021 cm−1 from C-O stretching vibration, 928, 884, and 755 cm−1 from C-H bending out of plane peaks [65,66].

4. Conclusions

The identification of contaminants on the biomass surface after preprocessing is important to avoid the unwanted misleading of analysis data. This study investigated and discussed diagnostic FTIR bands from 26 potential chemicals, including organic solvents, acids and alkalis, ionic liquids, enzymes, and biomass-derived components through diverse biomass preprocessing. The observation of these contaminants will improve the FTIR analysis with diverse biomass and bioproducts in the biorefinery.

Supplementary Materials

The following are available online at https://www.mdpi.com/2076-3417/10/12/4345/s1, Figure S1: FTIR spectra of preprocessing solvent contaminants on poplar, Figure S2: FTIR spectra of preprocessing acid and alkaline contaminants on poplar, Figure S3: FTIR spectra of ionic liquid contaminants on poplar, Figure S4: FTIR spectra of enzyme contaminants on poplar, Figure S5: FTIR spectra of biomass-derived chemical contaminants on poplar.

Author Contributions

C.G.Y. and A.J.R. conceived and designed the research. J.Z., C.G.Y., M.L., and Y.P. carried out the experiment. J.Z., M.L., and C.G.Y. wrote the manuscript. All the authors discussed data and revised the paper. All authors have given approval to the final version of the manuscript.

Funding

This research received no external funding.

Acknowledgments

This manuscript has been authored by UT-Battelle, LLC under Contract No. DE-AC05- 00OR22725 with the U.S. Department of Energy. This study was supported and performed as part of the BioEnergy Science Center (BESC) and Center for Bioenergy Innovation (CBI). The BESC and CBI are U.S. Department of Energy Bioenergy Research Centers supported by the Office of Biological and Environmental Research in the DOE Office of Science. The United States Government retains and the publisher, by accepting the article for publication, acknowledges that the United States Government retains a non-exclusive, paid-up, irrevocable, world-wide license to publish or reproduce the published form of this manuscript, or allow others to do so, for the United States Government purposes. The Department of Energy will provide public access to these results of federally sponsored research in accordance with the DOE Public Access Plan (http://energy.gov/downloads/doe-public-access-plan). The views and opinions of the authors expressed herein do not necessarily state or reflect those of the United States Government or any agency thereof. Neither the United States Government nor any agency thereof, nor any of their employees, makes any warranty, expressed or implied, or assumes any legal liability or responsibility for the accuracy, completeness, or usefulness of any information, apparatus, product, or process disclosed, or represents that its use would not infringe privately owned rights. The views and opinions of the authors expressed herein do not necessarily state or reflect those of the United States Government or any agency thereof. Neither the United States Government nor any agency thereof, nor any of their employees, makes any warranty, expressed or implied, or assumes any legal liability or responsibility for the accuracy, completeness, or usefulness of any information, apparatus, product, or process disclosed, or represents that its use would not infringe privately owned rights.

Conflicts of Interest

There are no conflicts to declare.

References

  1. Pu, Y.; Cao, S.; Ragauskas, A.J. Application of quantitative 31P NMR in biomass lignin and biofuel precursors characterization. Energy Environ. Sci. 2011, 4, 3154–3166. [Google Scholar] [CrossRef]
  2. Yoo, C.G.; Pu, Y.; Li, M.; Ragauskas, A.J. Elucidating Structural Characteristics of Biomass using Solution-State 2D NMR with a Mixture of Deuterated Dimethylsulfoxide and Hexamethylphosphoramide. ChemSusChem 2016, 9, 1090–1095. [Google Scholar] [CrossRef] [PubMed]
  3. Yoo, C.G.; Yang, Y.; Pu, Y.; Meng, X.; Muchero, W.; Yee, K.L.; Thompson, O.A.; Rodriguez, M.; Bali, G.; Engle, N.L. Insights of biomass recalcitrance in natural Populus trichocarpa variants for biomass conversion. Green Chem. 2017, 19, 5467–5478. [Google Scholar] [CrossRef]
  4. Sluiter, A.; Hames, B.; Ruiz, R.; Scarlata, C.; Sluiter, J.; Templeton, D.; Crocker, D. Determination of structural carbohydrates and lignin in biomass. Lab. Anal. Proced. 2010, 1617, 1–16. [Google Scholar]
  5. Jung, S.; Foston, M.; Kalluri, U.C.; Tuskan, G.A.; Ragauskas, A.J. 3D chemical image using TOF-SIMS revealing the biopolymer component spatial and lateral distributions in biomass. Angew. Chem. 2012, 124, 12171–12174. [Google Scholar] [CrossRef]
  6. Tolbert, A.K.; Yoo, C.G.; Ragauskas, A.J. Understanding the Changes to Biomass Surface Characteristics after Ammonia and Organosolv Pretreatments by Using Time-of-Flight Secondary-Ion Mass Spectrometry (TOF-SIMS). ChemPlusChem 2017, 82, 686–690. [Google Scholar] [CrossRef]
  7. Sannigrahi, P.; Kim, D.H.; Jung, S.; Ragauskas, A. Pseudo-lignin and pretreatment chemistry. Energy Environ. Sci. 2011, 4, 1306–1310. [Google Scholar] [CrossRef]
  8. Figueira, M.; Volesky, B.; Mathieu, H. Instrumental analysis study of iron species biosorption by Sargassum biomass. Environ. Sci. Technol. 1999, 33, 1840–1846. [Google Scholar] [CrossRef]
  9. Kok, M.V.; Özgür, E. Thermal analysis and kinetics of biomass samples. Fuel Process. Technol. 2013, 106, 739–743. [Google Scholar] [CrossRef]
  10. Pu, Y.; Meng, X.; Yoo, C.G.; Li, M.; Ragauskas, A.J. Analytical methods for biomass characterization during pretreatment and bioconversion. In Valorization of Lignocellulosic Biomass in a Biorefinery: From Logistics to Environmental and Performance Impact; Kumar, R., Ed.; Nova Science Publishers: New York, NY, USA, 2016; pp. 37–78. [Google Scholar]
  11. Acquah, G.E.; Via, B.K.; Fasina, O.O.; Eckhardt, L.G. Rapid quantitative analysis of forest biomass using fourier transform infrared spectroscopy and partial least squares regression. J. Anal. Methods Chem. 2016, 2016, 1839598. [Google Scholar] [CrossRef]
  12. Perkins, W. Fourier transform infrared spectroscopy. Part II. Advantages of FT-IR. J. Chem. Educ. 1987, 64, A269. [Google Scholar] [CrossRef]
  13. Di Fidio, N.; Raspolli Galletti, A.M.; Fulignati, S.; Licursi, D.; Liuzzi, F.; De Bari, I.; Antonetti, C. Multi-Step Exploitation of Raw Arundo donax L. for the Selective Synthesis of Second-Generation Sugars by Chemical and Biological Route. Catalysts 2020, 10, 79. [Google Scholar] [CrossRef] [Green Version]
  14. Licursi, D.; Antonetti, C.; Fulignati, S.; Corsini, A.; Boschi, N.; Galletti, A.M.R. Smart valorization of waste biomass: Exhausted lemon peels, coffee silverskins and paper wastes for the production of levulinic acid. Chem. Eng. Trans. 2018, 65, 637. [Google Scholar]
  15. Lara-Serrano, M.; Morales-delaRosa, S.; Campos-Martín, J.M.; Fierro, J.L.G. Fractionation of Lignocellulosic Biomass by Selective Precipitation from Ionic Liquid Dissolution. Appl. Sci. 2019, 9, 1862. [Google Scholar] [CrossRef] [Green Version]
  16. Shen, X.J.; Wen, J.L.; Mei, Q.Q.; Chen, X.; Sun, D.; Yuan, T.Q.; Sun, R.C. Facile fractionation of lignocelluloses by biomass-derived deep eutectic solvent (DES) pretreatment for cellulose enzymatic hydrolysis and lignin valorization. Green Chem. 2019, 21, 275–283. [Google Scholar] [CrossRef]
  17. Agbor, V.B.; Cicek, N.; Sparling, R.; Berlin, A.; Levin, D.B. Biomass pretreatment: Fundamentals toward application. Biotechnol. Adv. 2011, 29, 675–685. [Google Scholar] [CrossRef] [PubMed]
  18. Yoo, C.G.; Pu, Y.; Ragauskas, A.J. Ionic liquids: Promising green solvents for lignocellulosic biomass utilization. Curr. Opin. Green Sustain. Chem. 2017, 5, 5–11. [Google Scholar] [CrossRef]
  19. Nguyen, T.Y.; Cai, C.M.; Osman, O.; Kumar, R.; Wyman, C.E. CELF pretreatment of corn stover boosts ethanol titers and yields from high solids SSF with low enzyme loadings. Green Chem. 2016, 18, 1581–1589. [Google Scholar] [CrossRef]
  20. Yang, B.; Dai, Z.; Ding, S.-Y.; Wyman, C.E. Enzymatic hydrolysis of cellulosic biomass. Biofuels 2011, 2, 421–449. [Google Scholar] [CrossRef] [Green Version]
  21. Rasmussen, H.; Sørensen, H.R.; Meyer, A.S. Formation of degradation compounds from lignocellulosic biomass in the biorefinery: Sugar reaction mechanisms. Carbohydr. Res. 2014, 385, 45–57. [Google Scholar] [CrossRef]
  22. Li, M.; Pu, Y.; Yoo, C.G.; Gjersing, E.; Decker, S.R.; Doeppke, C.; Shollenberger, T.; Tschaplinski, T.J.; Engle, N.L.; Sykes, R.W. Study of traits and recalcitrance reduction of field-grown COMT down-regulated switchgrass. Biotechnol. Biofuels 2017, 10, 12. [Google Scholar] [CrossRef] [PubMed] [Green Version]
  23. Faix, O. Fourier transform infrared spectroscopy. In Methods in Lignin Chemistry; Lin, S.Y., Dence, C.W., Eds.; Springer: Berlin/Heidelberg, Germany, 1992; pp. 83–109. [Google Scholar]
  24. Sim, S.F.; Mohamed, M.; Lu, N.A.L.M.I.; Sarman, N.S.P.; Samsudin, S.N.S. Computer-assisted analysis of fourier transform infrared (FTIR) spectra for characterization of various treated and untreated agriculture biomass. BioResources 2012, 7, 5367–5380. [Google Scholar] [CrossRef] [Green Version]
  25. Pandey, K. A study of chemical structure of soft and hardwood and wood polymers by FTIR spectroscopy. J. Appl. Polym. Sci. 1999, 71, 1969–1975. [Google Scholar] [CrossRef]
  26. Ciolacu, D.; Ciolacu, F.; Popa, V.I. Amorphous cellulose—Structure and characterization. Cell. Chem. Technol. 2011, 45, 13. [Google Scholar]
  27. Yang, H.; Yan, R.; Chen, H.; Lee, D.H.; Zheng, C. Characteristics of hemicellulose, cellulose and lignin pyrolysis. Fuel 2007, 86, 1781–1788. [Google Scholar] [CrossRef]
  28. Le, D.M.; Nielsen, A.D.; Sørensen, H.R.; Meyer, A.S. Characterisation of Authentic Lignin Biorefinery Samples by Fourier Transform Infrared Spectroscopy and Determination of the Chemical Formula for Lignin. Bioenergy Res. 2017, 10, 1025–1035. [Google Scholar] [CrossRef]
  29. Liu, C.F.; Xu, F.; Sun, J.X.; Ren, J.L.; Curling, S.; Sun, R.C.; Fowler, P.; Baird, M.S. Physicochemical characterization of cellulose from perennial ryegrass leaves (Lolium perenne). Carbohydr. Res. 2006, 341, 2677–2687. [Google Scholar] [CrossRef]
  30. Xu, F.; Sun, J.-X.; Sun, R.; Fowler, P.; Baird, M.S. Comparative study of organosolv lignins from wheat straw. Ind. Crop. Prod. 2006, 23, 180–193. [Google Scholar] [CrossRef]
  31. Sills, D.L.; Gossett, J.M. Using FTIR to predict saccharification from enzymatic hydrolysis of alkali-pretreated biomasses. Biotechnol. Bioeng. 2012, 109, 353–362. [Google Scholar] [CrossRef]
  32. Mojet, B.L.; Ebbesen, S.D.; Lefferts, L. Light at the interface: The potential of attenuated total reflection infrared spectroscopy for understanding heterogeneous catalysis in water. Chem. Soc. Rev. 2010, 39, 4643–4655. [Google Scholar] [CrossRef]
  33. Zhang, K.; Pei, Z.; Wang, D. Organic solvent pretreatment of lignocellulosic biomass for biofuels and biochemicals: A review. Bioresour. Technol. 2016, 199, 21–33. [Google Scholar] [CrossRef] [PubMed]
  34. The Virtual Planetary Laboratory Molecular Database. Available online: http://vpl.astro.washington.edu/spectra/allmoleculeslist.htm (accessed on 8 May 2020).
  35. Plyler, E.K. Infrared Spectra of Methanol, Ethanol, and n-Propanol. J. Res. Natl. Bur. Stand. 1952, 48, 281–286. [Google Scholar] [CrossRef]
  36. Conklin, A., Jr.; Goldcamp, M.J.; Barrett, J. Determination of ethanol in gasoline by FT-IR spectroscopy. J. Chem. Educ. 2014, 91, 889–891. [Google Scholar] [CrossRef]
  37. Hu, S.; Li, Y. Two-step sequential liquefaction of lignocellulosic biomass by crude glycerol for the production of polyols and polyurethane foams. Bioresour. Technol. 2014, 161, 410–415. [Google Scholar] [CrossRef] [PubMed]
  38. Elfadly, A.; Zeid, I.; Yehia, F.; Abouelela, M.; Rabie, A. Production of aromatic hydrocarbons from catalytic pyrolysis of lignin over acid-activated bentonite clay. Fuel Process. Technol. 2017, 163, 1–7. [Google Scholar] [CrossRef]
  39. Dwivedi, A.; Baboo, V.; Bajpai, A. Fukui Function Analysis and Optical, Electronic, and Vibrational Properties of Tetrahydrofuran and Its Derivatives: A Complete Quantum Chemical Study. J. Theor. Chem. 2015, 2015, 345234. [Google Scholar] [CrossRef]
  40. Borowski, P.; Gac, W.; Pulay, P.; Woliński, K. The vibrational spectrum of 1, 4-dioxane in aqueous solution–theory and experiment. New J. Chem. 2016, 40, 7663–7670. [Google Scholar] [CrossRef] [Green Version]
  41. IR Spectroscopy Tutorial. Available online: https://orgchemboulder.com/Spectroscopy/irtutor/tutorial.shtml (accessed on 8 May 2020).
  42. Wen Yee, T.; Tin Sin, L.; Rahman, W.; Samad, A. Properties and interactions of poly (vinyl alcohol)-sago pith waste biocomposites. J. Compos. Mater. 2011, 45, 2199–2209. [Google Scholar] [CrossRef]
  43. Danish, M.; Mumtaz, M.W.; Fakhar, M.; Rashid, U. Response surface methodology based optimized purification of the residual glycerol from biodiesel production process. Chiang Mai J. Sci. 2015, 43, 1570–1582. [Google Scholar]
  44. Swoboda, A.; Kunze, G. Infrared study of pyridine adsorbed on montmorillonite surfaces. Clay Clay Miner. 1964, 13, 277. [Google Scholar] [CrossRef]
  45. Testa, A.C. Molecular Vibrations of Pyridine. Available online: http://facpub.stjohns.edu/~testaa/anim27vib.html (accessed on 6 May 2020).
  46. Segneanu, A.E.; Gozescu, I.; Dabici, A.; Sfirloaga, P.; Szabadai, Z. Organic compounds FT-IR spectroscopy. In Macro To Nano Spectroscopy; Uddin, J., Ed.; InTech: Rijeka, Croatia, 2012; pp. 145–164. [Google Scholar]
  47. Eisazadeh, A.; Kassim, K.A.; Nur, H. Physicochemical characteristics of phosphoric acid stabilized bentonite. Electron. J. Geotech. Eng. 2010, 15, 327–335. [Google Scholar]
  48. Arai, Y.; Sparks, D.L. ATR–FTIR spectroscopic investigation on phosphate adsorption mechanisms at the ferrihydrite–water interface. J. Colloid Interface Sci. 2001, 241, 317–326. [Google Scholar] [CrossRef] [Green Version]
  49. Valentin, R.; Horga, R.; Bonelli, B.; Garrone, E.; Renzo, F.D.; Quignard, F. FTIR spectroscopy of NH3 on acidic and ionotropic alginate aerogels. Biomacromolecules 2006, 7, 877–882. [Google Scholar] [CrossRef]
  50. Dharaskar, S.A.; Varma, M.N.; Shende, D.Z.; Yoo, C.K.; Wasewar, K.L. Synthesis, characterization and application of 1-butyl-3 methylimidazolium chloride as green material for extractive desulfurization of liquid fuel. Sci. World J. 2013, 2013, 395274. [Google Scholar] [CrossRef] [PubMed]
  51. Seethalakshmi, K.; Jasmine Vasantha Rani, E.; Padmavathy, R. Study of vibrational spectra and solvation number of non-aqueous solutions of 1-benzyl-3-dimethylimidazolium chloride through ultrasonic technique. Int. J. Recent Sci. Res. 2015, 6, 2347–2349. [Google Scholar]
  52. Yue, D.; Jia, Y.; Yao, Y.; Sun, J.; Jing, Y. Structure and electrochemical behavior of ionic liquid analogue based on choline chloride and urea. Electrochim. Acta 2012, 65, 30–36. [Google Scholar] [CrossRef]
  53. Du, C.; Zhao, B.; Chen, X.-B.; Birbilis, N.; Yang, H. Effect of water presence on choline chloride-2urea ionic liquid and coating platings from the hydrated ionic liquid. Sci. Rep. 2016, 6, 29225. [Google Scholar] [CrossRef] [Green Version]
  54. Dega-Szafran, Z.; Dutkiewicz, G.; Kosturkiewicz, Z.; Szafran, M. Crystal structure and spectroscopic properties of the complex of trigonelline hydrate with p-hydroxybenzoic acid. J. Mol. Struct. 2011, 985, 219–226. [Google Scholar] [CrossRef]
  55. Sun, R.; Tomkinson, J.; Bolton, J. Separation and characterization of lignins from the black liquor of oil palm trunk fiber pulping. Sep. Sci. Technol. 1999, 34, 3045–3058. [Google Scholar] [CrossRef]
  56. Shareef, B.A.; Waheed, I.F.; Jalaot, K.K. Preparation and Analytical Properties of 4-Hydroxybenzaldehyde, Biuret and Formaldehyde Terpolymer Resin. Orient. J. Chem. 2014, 29, 1391–1397. [Google Scholar] [CrossRef] [Green Version]
  57. Kaur, J.; Katopo, L.; Hung, A.; Ashton, J.; Kasapis, S. Combined spectroscopic, molecular docking and quantum mechanics study of β-casein and p-coumaric acid interactions following thermal treatment. Food Chem. 2018, 252, 163–170. [Google Scholar] [CrossRef] [PubMed]
  58. Moosavinejad, S.M.; Madhoushi, M.; Vakili, M.; Rasouli, D. Evaluation of degradation in chemical compounds of wood in historical buildings using FT-IR and FT-Raman vibrational spectroscopy. Maderas-Cienc. Tecnol. 2019, 21. [Google Scholar] [CrossRef] [Green Version]
  59. Asare, S. Synthesis, Characterization and Molecular Dynamic Simulations of Aqueous Choline Chloride Deep Eutectic Solvents. Ph.D. Thesis, South Dakota State University, Brookings, SD, USA, 2018. [Google Scholar]
  60. Bohara, R.A.; Thorat, N.D.; Pawar, S.H. Immobilization of cellulase on functionalized cobalt ferrite nanoparticles. Korean J. Chem. Eng. 2016, 33, 216–222. [Google Scholar] [CrossRef]
  61. Zhang, D.; Hegab, H.E.; Lvov, Y.; Snow, L.D.; Palmer, J. Immobilization of cellulase on a silica gel substrate modified using a 3-APTES self-assembled monolayer. SpringerPlus 2016, 5, 48. [Google Scholar] [CrossRef] [PubMed] [Green Version]
  62. Swarnalatha, V.; Ester, R.A.; Dhamodharan, R. Immobilization of α-amylase on gum acacia stabilized magnetite nanoparticles, an easily recoverable and reusable support. J. Mol. Catal. B-Enzym. 2013, 96, 6–13. [Google Scholar] [CrossRef]
  63. Bai, H.; Wang, H.; Sun, J.; Irfan, M.; Han, M.; Huang, Y.; Han, X.; Yang, Q. Production, purification and characterization of novel beta glucosidase from newly isolated Penicillium simplicissimum H-11 in submerged fermentation. EXCLI J. 2013, 12, 528. [Google Scholar]
  64. Tsilomelekis, G.; Josephson, T.R.; Nikolakis, V.; Caratzoulas, S. Origin of 5-hydroxymethylfurfural stability in water/dimethyl sulfoxide mixtures. ChemSusChem 2014, 7, 117–126. [Google Scholar] [CrossRef]
  65. Garba, N.A.; Muduru, I.; Sokoto, M.A.; Dangoggo, S.M. Production of liquid hydrocarbons from millet husk via catalytic hydrodeoxygenation in NIO/AL2O3 catalysts. In WIT Transactions on Ecology and the Environment; Syngellakis, S., Magaril, E., Eds.; WIT PRESS: Billerica, MA, USA, 2018; pp. 125–130. [Google Scholar]
  66. Allen, G.; Bernstein, H.J. Internal rotation: VIII. The infrared and raman spectra of furfural. Can. J. Chem. 1955, 33, 1055–1061. [Google Scholar] [CrossRef]
Figure 1. FTIR spectra of poplar and its major components: cellulose, hemicellulose, and lignin. (Note: The assignments of the numbered bands in the figure are described in Table 1).
Applsci 10 04345 g001
Table 1. Fourier transform infrared (FTIR) band assignments of poplar and its major components: cellulose, hemicellulose, and lignin [23,24,25,26,27,28,29,30,31].
Wavenumber [cm−1]AssignmentComponents
13367O-H stretchingCellulose, Hemicellulose, Lignin
22914C-H stretchingCellulose, Hemicellulose, Lignin
31745C=O stretchingHemicellulose, Lignin
41618Aromatic skeletal vibration, C=O stretching, adsorbed O-HHemicellulose, Lignin
51508C=C-C aromatic ring stretching and vibrationLignin
61457C-H deformation (in methyl and methylene)Lignin
71424Symmetric CH2 bending vibration, symmetric stretching band of carboxyl group, C-H deformationCellulose, Hemicellulose, Lignin
81370C-H bending, C-H stretching in CH3Cellulose, Hemicellulose, Lignin
91317CH2 wagging, C-O stretching of C5 substituted aromatic unitsCellulose, Hemicellulose, Lignin
101235C-O stretching of guaiacyl unit Lignin
111160C-O-C stretchingCellulose, Hemicellulose
121108Aromatic C-H in plane deformationLignin
131053C-OH stretching vibration, C-O deformationCellulose, Hemicellulose, Lignin
141032C-O stretching, aromatic C-H in plane deformationCellulose, Lignin
15896C-O-C stretchingCellulose, hemicellulose
16846Aromatic C-H out of plane bendingLignin
Table 2. FTIR band assignments of common biomass processing solvents on poplar [32,33,34,35,36,37,38,39,40,41,42,43,44,45].
ContaminantsWavenumber [cm−1]Assignments
Water3354O-H stretching
1653O-H-O scissors bending
Acetone3005CH3 stretching
2908CH3 stretching
1713C=O stretching
1431CH3 deforming
1364CH3 deforming
1222C-C stretching
Ethanol3350O-H stretching
2980C-H stretching
1056C-O stretching
Methanol3352O-H stretching
2952C-H asymmetric stretching
2879C-H symmetric stretching
1465C-H asymmetric bending
1450C-H symmetric bending
1336O-H bending
1068CH3 rocking
1026C-O stretching
Tetrahydrofuran2977C-H stretching
2875C-H stretching
1063Ring deformation
912CH2 twisting
Toluene3069C-H stretching
1497C-C stretching
728C-H out of plane bending
Dioxane2960C-H stretching
2890C-H stretching
1457Symmetric CH2 deformation
1322CH2 wagging
1255CH2 twisting
1119C-O-C symmetric stretching
1057Ring trigonal deformation
889C-C stretching
872C-O-C stretching
Glycerol3341O-H bending
2948C-H stretching
2897C-H stretching
1333C-H deformation
1239C-H deformation
1034C-O stretching
923O-H bending
Chloroform1220C-H bending
755CCl3 stretching
Pyridine3036C-H stretching
1583C-C bonding
1485C-N stretching
1438C-H in plane wagging
1203Symmetric C-H wagging
1069C-H wagging
1032C-C in plane wagging
750/693C-H out of plane bending
Table 3. FTIR band assignments of acids and alkalis contaminants on poplar [34,46,47,48,49].
ContaminantsWavenumber [cm−1]Assignments
Sulfuric acid3370O-H stretching
1660O-H-O scissors bending
1362S=O stretching
750S-O stretching
Hydrochloric acid3370O-H stretching
2905H-Cl stretching
1660O-H-O scissors bending
Phosphoric acid3370O-H stretching
2905P-OH bond
1660O-H-O scissors bending
1161P=O stretching
1031P=O stretching
Acetic acid3351O-H stretching
2916Symmetric CH3 stretching
1706C=O stretching
1427CH3 deformation
1234O-H bending
1031CH3 rocking
Ammonium hydroxide3350N-H stretching & O-H stretching
2914N-H stretching
1660O-H-O scissors bending
Table 4. FTIR band assignments of ionic liquids, enzymes, and biomass-derived chemicals on poplar [49,50,51,52,53,54,55,56,57,58,59,60,61,62,63,64,65].
ContaminantsWavenumber [cm−1]Assignments
1-Butyl-3-methylimidazolium chloride3341Quaternary amine salt formation
1658C=C stretching
1604C=N stretching
1-Benzyl-3-methylimidazolium chloride2961C-H stretching
1574C-C stretching ring vibration
633C-N/C-Cl in-plane bending
ChCl-Urea3435NH2 asymmetric stretching
3340NH2 symmetric stretching
1669NH2 bending vibration
1597OH bending vibration
1474CH3 rocking
1152C-N stretching
1062CH2 rocking
961Asymmetric stretching of COO
790C=O bonding
ChCl–PHA3180O-H stretching
1681C=O stretching
1581Asymmetric stretching of COO
1282C-O stretching vibration
1082C-O stretching
953C-N stretching
861CH2 rocking vibrations
838Aromatic C-H out-of-plane bending
786C–C stretching
ChCl–PB3122The stretching vibration of the phenolic O-H
1667The stretching vibration of carbonyl group
1272Methylene
1030C-H binding
ChCl-PCA3126Bending vibration of –NH2
1675C=O stretch of carboxylic acid
1606C=C stretching
1160C-OH stretching
848C-H stretching
771Stretching of the -OH group
Cellulase3353N-H stretching & O-H stretching
2942C-H stretching (asymmetric)
2900C-H stretching (symmetric)
1642NH2 scissoring & C=N vibration
1334C-N stretching
1036C-N stretching
β-glucosidase3351N-H stretching
1646N-H bonding & C=O stretching
1432N-H stretching
620N-H out of plane bending
HMF3364O-H stretching
1661Carbonyl stretching
1561C=C stretching (furan ring)
Furfural3134C-H stretching
2859C-H vibration of aldehyde group
1671C=O in conjugated carbonyl group
1465C=C stretching of furan ring
1276/1021C-O stretching vibration
928/884/755C-H bending out of plane peaks

