1. Introduction
Liquid composite molding (LCM) processes were developed to enable the production of large, wide, and complex structural components at low cost. Among the important LCM processes, it is important to mention liquid resin infusion (LRI), which consists of the injection of a polymer resin through empty channels mounted on a fibrous mold, favoring the global propagation of the resin over the mold domain [
1]. One of the most considerable difficulties in applying LRI is related to complete mold filling and void formation, ensuring that the fibrous reinforcement is completely impregnated by the resin within the mold [
2,
3,
4,
5].
To tackle the reported difficulties, several efforts have been made to improve process comprehension, as well as to avoid traditional trial-and-error approaches. One possibility is the use of computational tools to simulate multiphase resin/air flow into the enclosed mold [
3,
4,
5,
6,
7,
8]. The study of parametrical investigations in the LRI process (as the influence of design over the behavior of resin/air flow, voids formation, and filling time) also represents an important subject. Therefore, studies have been carried out in the analytical, experimental, and numerical scope to improve the understanding of resin/air flow in this kind of domain [
3,
4].
The development of computational methods for the representation of LCM processes is an important point of concern. For example, Isoldi et al. [
9] performed a numerical study of resin flow in porous domains that mimics the operational principle of the Resin Transfer Molding (RTM) and Light Resin Transfer Molding (LRTM) processes. Different resin flow cases were solved numerically (linear, radial, and complex three-dimensional domain) and compared with analytical, experimental, and numerical results available in the literature. The maximum difference between these solutions was about 8.0%, showing the validity of the developed numerical method. Wang et al. [
1] conducted a numerical and experimental study of the resin infusion process under industrial conditions. The authors verified that mold filling time determined by numerical simulation brought about results in agreement with experimental solutions. Afterward, Grössing et al. [
10] compared the technical feasibility of using two different numerical methods (PAM-RTM
® and OpenFOAM) to obtain numerical solutions of resin flow. Firstly, it was found that the numerical methods led to valid solutions in comparison with experimental results. It was also verified that both numerical methods had very similar results for the simulation of resin flow in porous media. Sirtautas et al. [
11] developed a numerical model based on the Finite Element Method (FEM), considering the effects of compressibility and orthotropic permeability dependent on pressure in the domain for different fibrous materials. A comparison between the numerical model and experimental results was performed for resin flow in the two-dimensional domain of an aerospace piece. The results showed good agreement, recommending the use of the proposed computational method. Pierce et al. [
12] developed and validated a multi-physics model to improve the simulation of the infusion process in the complex preform. The results are compared with traditional models that do not consider fabric deformation. The combination of deformation-dependent permeability properties and the preform draping model led to more realistic predictions for local infusion flow. Chebil et al. [
13] developed a computational model for the simulation of three-dimensional resin flow in laminated preform composed of multiple layers with different permeabilities. The method proposed the use of shell elements for flow simulation instead of solid elements, leading to a reduction in computing time. Rubino and Carlone [
14] proposed an analytical/numerical methodology to consider the effects of preform compaction on resin flow for a deformable porous media, which is important for processes such as vacuum assisted resin transfer molding (VARTM) and Seeman composites resin infusion molding process (SCRIMP), where a flexible bag is generally used as part of the mold. The results showed that preform compaction affected resin flow and filling time.
The numerical approach has also been used to define strategies for several LCM processes. Examples of the evaluation of gate placements in RTM processes seeking to prevent void content and minimize filling time had been widely reported in different works [
15,
16,
17,
18,
19,
20]. The work of Brouwer et al. [
3] proposed strategies to improve the positioning of injection channels in one LRI process using computational modeling. More precisely, the authors presented developments in two large structures to be filled with resin, a rotor blade, and a boat hull 20 m and 16 m long, respectively. The strategy adopted by the authors consisted of a main injection channel in the central region of the domain (the keel for the case of injection in the hull domain) with several bifurcated channels spread along the area of the domain (from the center to the periphery). Afterward, Gomes et al. [
21] performed a numerical and experimental study for better characterization of a VARTM (vacuum assisted resin transfer molding) process, indicating the best strategies for the filling of a C-shaped stringer. The results indicated that the consideration of two exit regions (with vacuum) and one entering region of resin placed in the extremes of domain length was the best strategy to minimize filling time and prevent void formation. Wang et al. [
1] developed an iterative method based on a centroidal Voronoi diagram for optimization of the distribution of several channels to reduce the number of required tests.
Recently, Struzziero and Skordos [
22] performed a numerical multi-objective optimization focusing on the choice of an optimal temperature profile, which minimizes the filling time and the risk of hindering resin flow due to excessive curing. For the optimization, the authors employed the genetic algorithm (GA) method. It achieved reductions of nearly 66% and 15% in filling time and final degree of cure, respectively, in comparison with standard solutions. Geng et al. [
23] investigated the behavior of resin impregnation in curved porous plates mimicking a VARTM process. They performed an experimental study investigating the influence of curvature angles and preform layers on the advancement of the resin front line. The results indicated that due to interaction between the preforms and void formation, the curved regions led to an augmentation of 15% to 30% of filling time in comparison with a linear region. Shevtsov et al. [
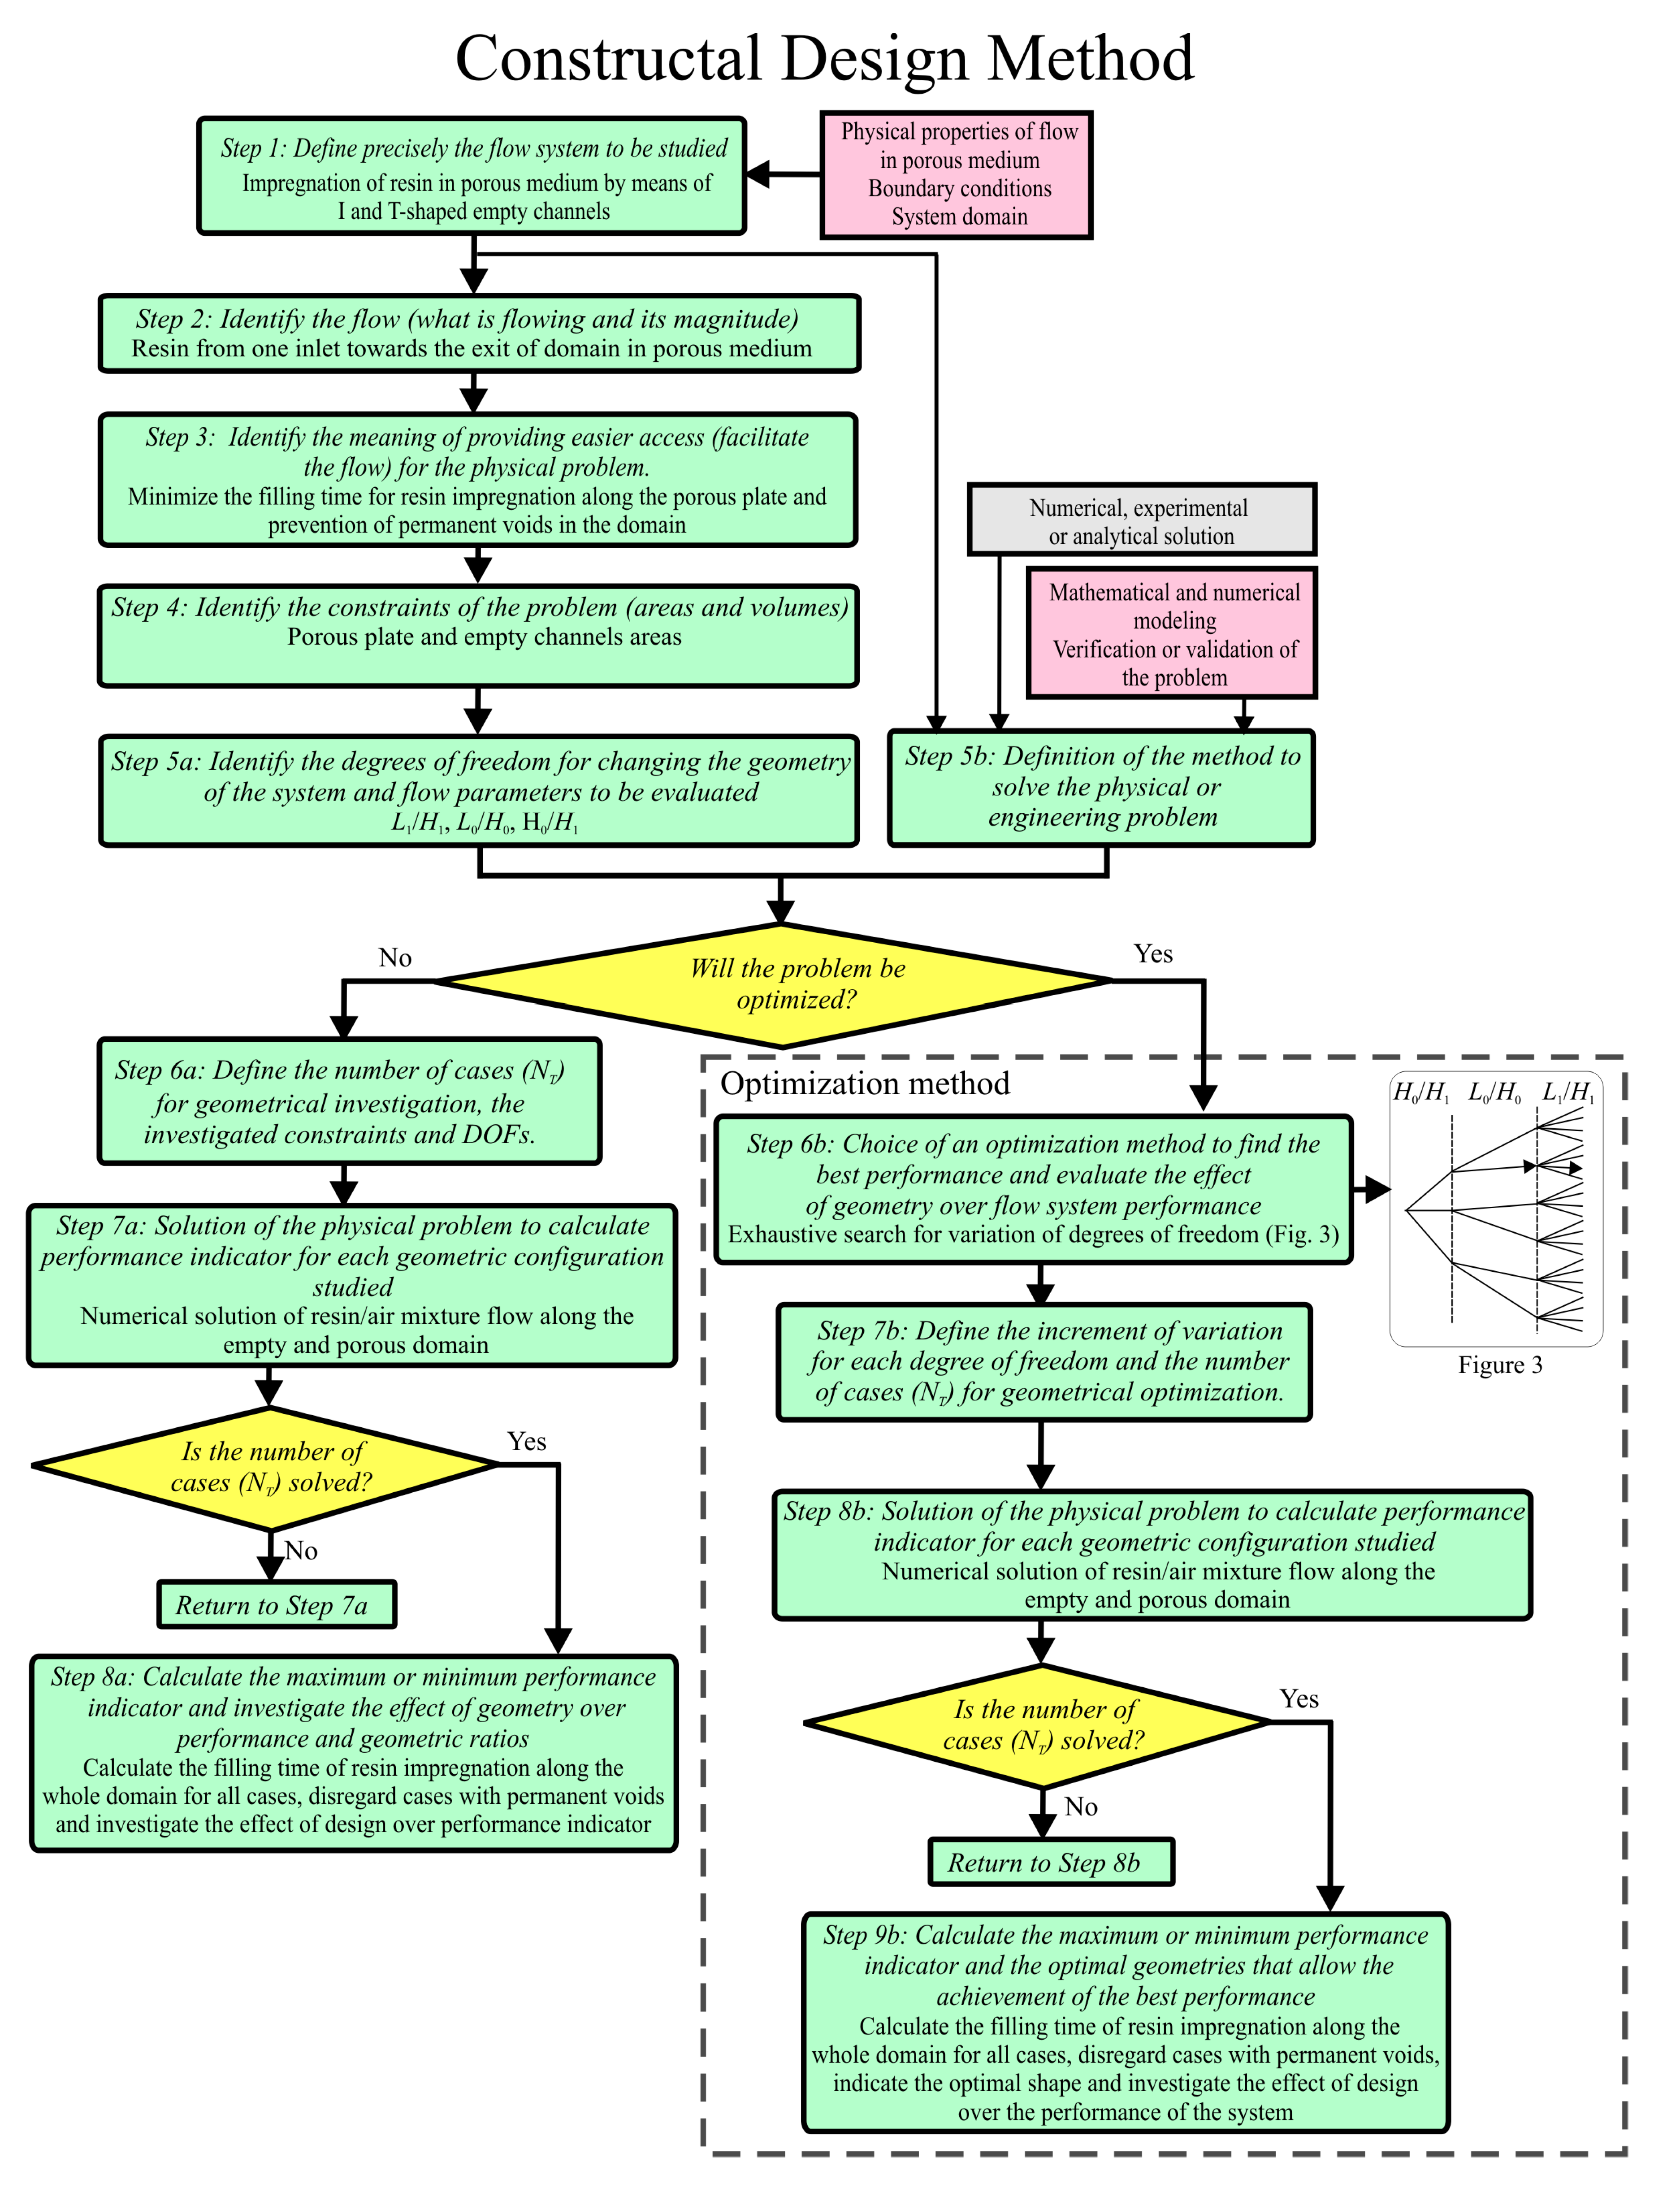
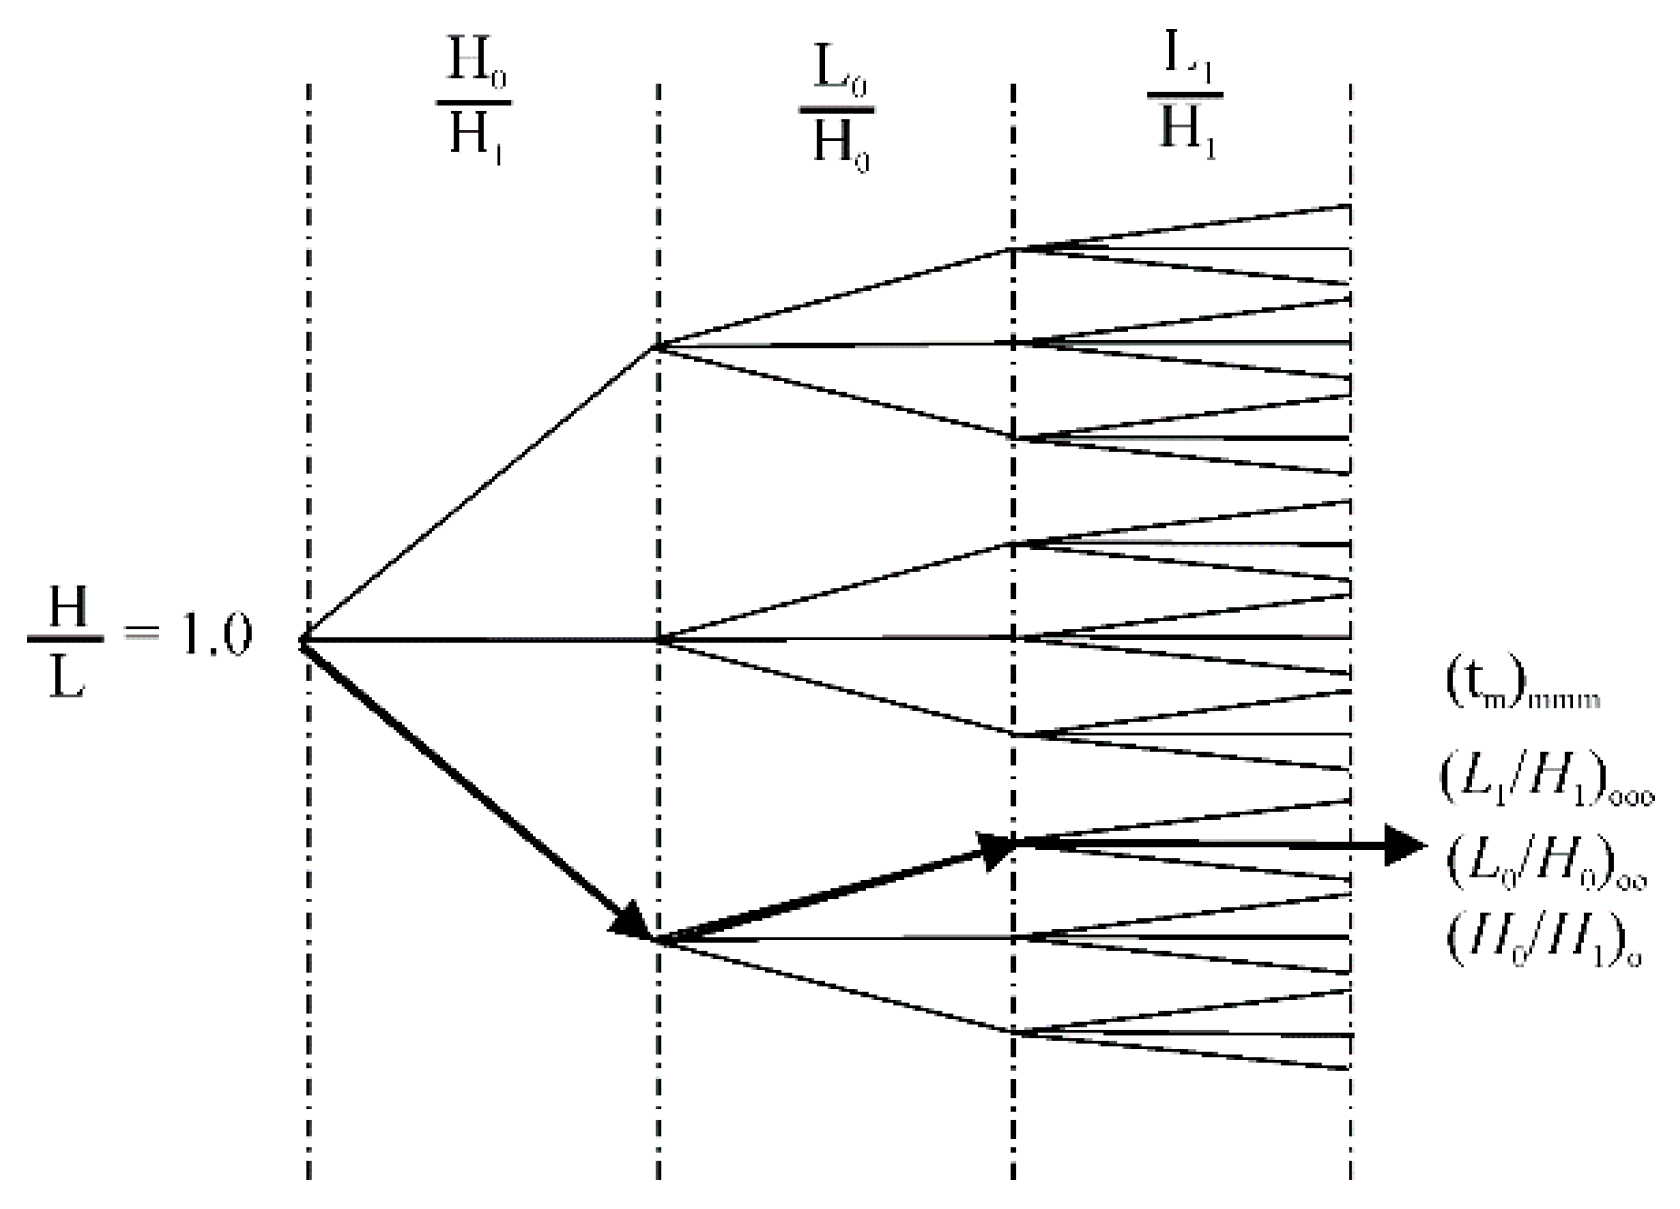
24] performed an experimental and numerical study for the manufacturing of three-dimensional composite parts of complex shape. For the computational model, a numerical technique based on liquid resin flow into porous preform is coupled with a model that describes the fluid motion in unsaturated soils. The developed method allowed the prediction of inner and outer dry spots depending on the resin flow movement. Despite several important works reported, few studies can be found on the evaluation of the influence of the geometry of empty channels in the behavior of resin/air fluid flow into the porous domain. In the present study, a geometrical optimization of I and T-shaped empty channels over the required time to fill a porous rectangular plate is performed with the constructal design (CD) and exhaustive search (ES) methods.
Constructal design is a method for assessment of design in any finite flow system based on the objectives and constraints principle. This method has been widely applied to show that shape and structure in nature (trees, rivers, animal body, and others) are deterministically generated following a physical principle named Constructal Law of Design and Evolution [
25,
26,
27,
28,
29]. According to Bejan [
28], constructal law states that the design of the finite-size flow system to persist in time (to live) must evolve freely to maximize access to its internal currents. This method has also been applied as a powerful tool to improve the design of several engineering problems as cooling systems, heat exchangers, renewable energy, transport systems, and even solid mechanics [
30,
31,
32,
33,
34,
35,
36]. As per the authors’ knowledge, except for the works of Refs. [
37,
38], the constructal design method has not been employed in the literature for investigation on the influence of geometry over impregnation of resin in a porous medium, which mimics the LRI process, a novelty in the present work.
Here, the application of computational modeling, constructal design, and exhaustive search (ES) in geometrical optimization of I and T-shaped empty channels inserted into the rectangular porous medium is proposed. The main aims here are to minimize the filling time of resin impregnation in the porous medium, prevent the formation of permanent voids in the domain, and investigate the influence of geometry over the performance indicator of the system. The solution domain is presented in a two-dimensional rectangular plate with a porous medium, which simulates a fibrous reinforcement. This work is a sort of continuity of the study by Magalhães et al. [
38] with the difference being that here the T-shaped channel is completely optimized, i.e., all three degrees of freedom are investigated. The conservation equations of mass, momentum, and one equation for the transport of volumetric fractions are solved with the finite volume method (FVM) [
39,
40,
41]. To deal with the resin/air interface flow, the volume of fluid (VOF) method is used [
42]. In the region of the porous medium, it is also considered a body force modeled with Darcy’s law. More precisely, the simulations were performed using the computational fluid dynamics code FLUENT [
41].
3. Numerical Modeling and Code Validation
For simulation of the infusion process, the conservation equations of mass, momentum, and transport equation of volume fraction were solved using a commercial CFD (computational fluid dynamics) code based on FVM [
39,
40,
41]. Numerical simulations were carried out using computers with 4 Intel Xeon processors and 8 threads of 3.30 GHz clock and 8.0 Gb of RAM. In all the simulations, the second-order upwind discretization scheme was used for the treatment of the advective terms. For pressure interpolation, the PRESTO scheme was used. Pressure-velocity coupling was performed with the PISO method, while the Geo-Reconstruction method was used to reconstruct the interface between the two fluids. In addition, sub-relaxation factors of 0.3 and 0.7 are imposed for the conservation equations of mass and momentum, respectively. The simulations are considered converged when the residuals of conservation equations of mass and momentum are lower than
R < 10
−6.
For time discretization, a study of time step independence was performed, since a transient problem was being investigated. Five simulations were performed with a varying time step, and its influence over the volume of domain completely impregnated by the resin was investigated, i.e., the volume of domain with volume fraction of
f = 1.0. For all simulations, the volume of resin injected up to time of
t = 7.0 s was evaluated.
Table 1 shows, for the analyzed injection time, the volume percentage of the domain filled with resin and the processing time required to carry out the simulations. The analyzed case consists of a I-shaped empty channel with area fraction of
ϕ = 0.05,
H/L = 1.0 and
L0/
H0 = 4.0. It is possible to observe that for values of Δ
t ≤ 1.0 × 10
−3 s, all employed time steps lead to identical results. For the values of Δ
t = 1.0 × 10
−2 s and Δ
t = 1.0 × 10
−1 s, there is no convergence in the simulations. Consequently, the time step of Δ
t = 1.0 × 10
−3 s is adopted in subsequent geometric evaluation simulations, as it leads to a lower computational effort compared to smaller time steps.
For spatial discretization, the domain was divided into finite rectangular volumes, and a mesh independence test was performed to define the number of volumes used for the simulations. The time step used is defined in
Table 1 (∆
t = 1.0 × 10
−3 s).
Table 2 shows the number of volumes, the filling time for complete impregnation of resin in the mold, and the processing time required to perform the simulations for each evaluated mesh and for the same I-shaped channel studied in the time independence study, i.e.,
ϕ = 0.05,
H/
L = 1.0 and
L0/
H0 = 4.0. The following equation presents the criterion for achievement of an independent mesh:
where
tj represents the minimum value of the filling time calculated with the coarser mesh, and
tj+1 corresponds to the magnitude calculated with the refined successive mesh. Successive refinements determine appropriate mesh size until the magnitude of the difference variable for two successive meshes is lower than 1.0%. In this sense, a mesh with 18,271 finite rectangular volumes is used in this study.
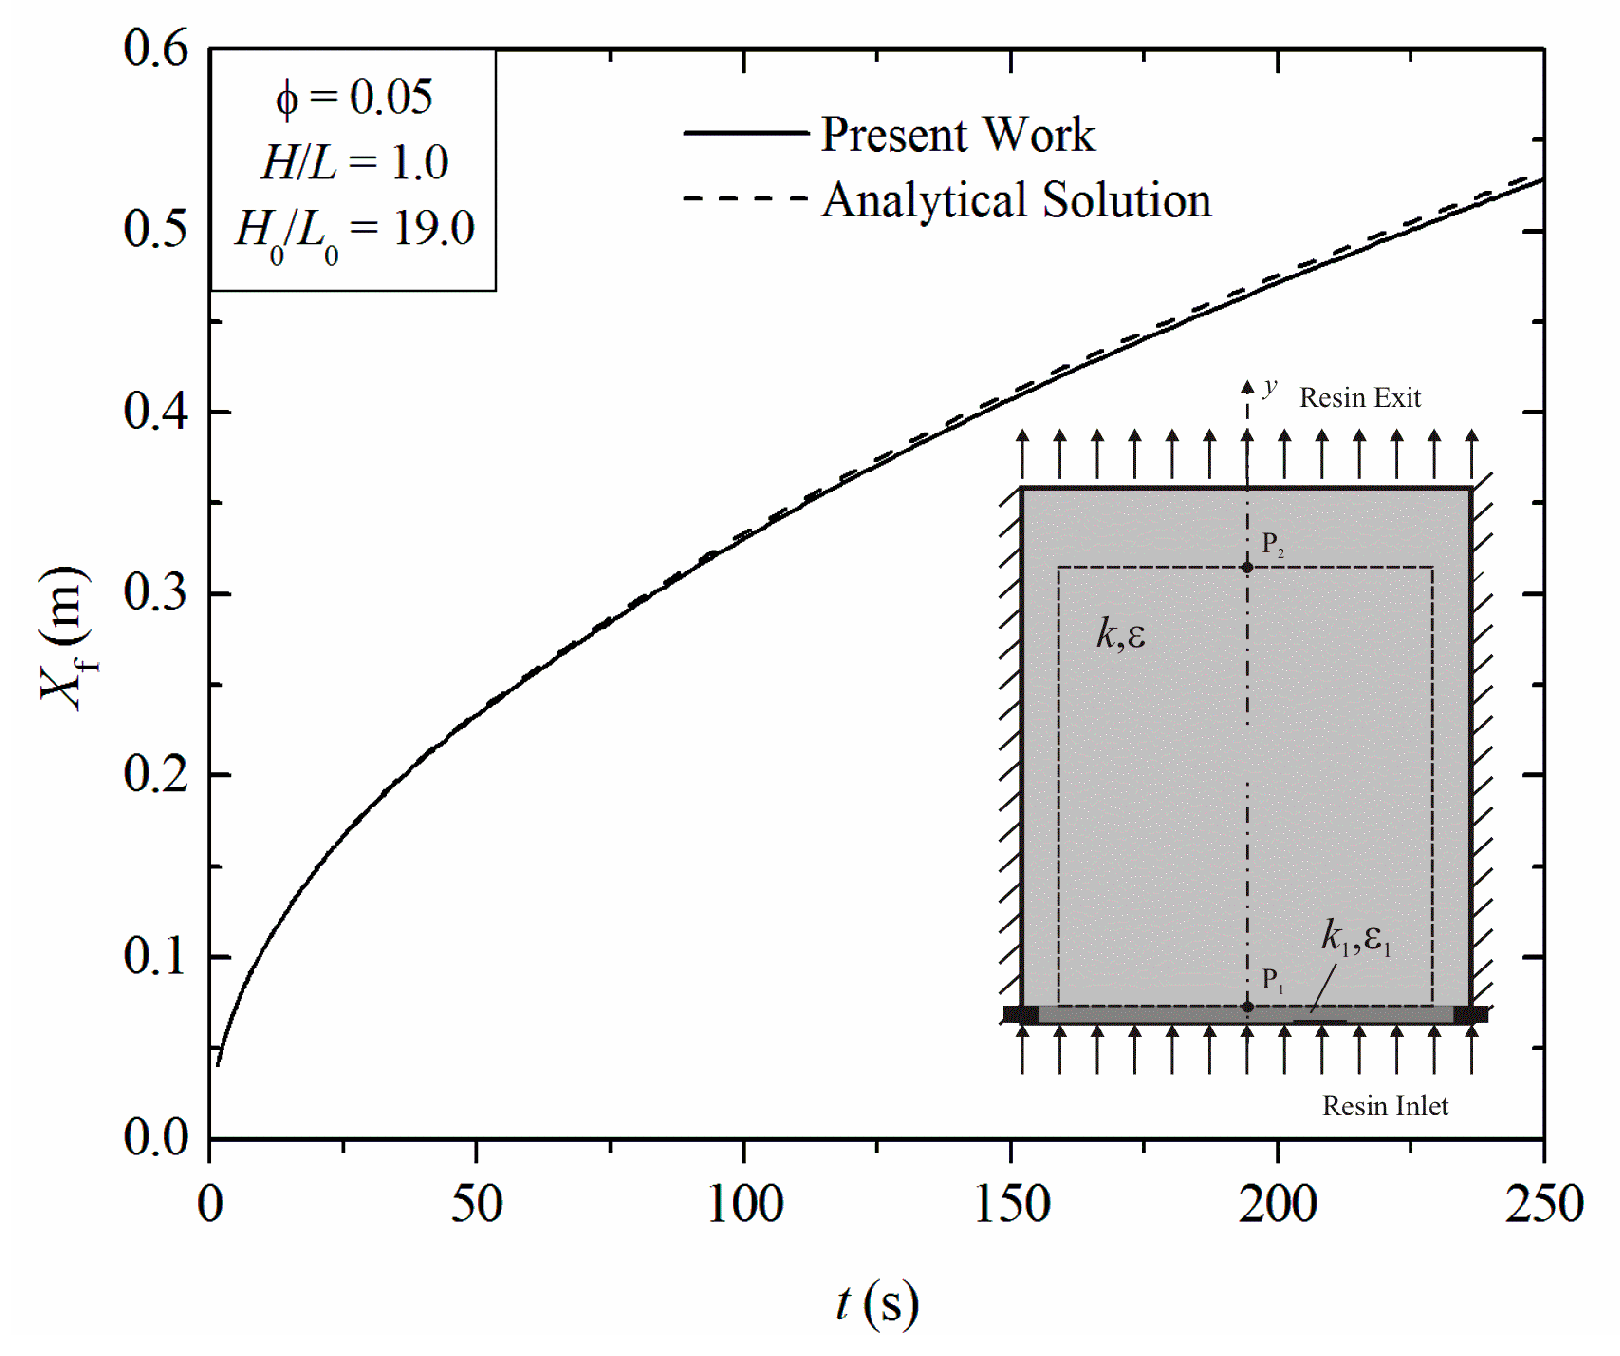
To show the reliability of the present computational model, a verification of the numerical method used here was done by comparing the present numerical solution and a classical analytical solution for the rectilinear case. More precisely, resin advancement as a function of infusion time obtained with the present method and the analytical solution described in Jinlian et al. [
50] and Rudd [
45] are compared. This comparison can be made for empty channels that lead to rectilinear behavior of resin in the porous medium. For the sake of comparison, a simulation in an I-shaped empty channel with
ϕ = 0.05,
H/
L = 1.0, and
L0/
H0 = 19.0, where
L0 is equal to
L, is chosen. The case with these configurations represents a rectilinear case.
An analytical solution for front-line resin advancement as a function of time is given by [
50]:
where
Xf is the position of the resin front-line (m),
t is the time (s),
μ is the resin viscosity (Pa/s),
ε is the porosity,
K is the permeability (m
2), and
Pin is the injection pressure (Pa). It should be noted that the present formulation is only applicable to a constant
P0 situation.
A monitoring line was created in the center of the domain to obtain the numerical results. More precisely, a line that overlaps the
y-axis was defined by the following points: P
1 (
x1 = 0.0 m,
y1 = 0.0256 m) and P
2 (
x2 = 0.0 m,
y2 = 0.7500 m). The coordinates
x1 =
x2 represent the center of the domain in the
x-direction, while the coordinate
y1 represents the interface placement between the open channel and the porous medium, and
y2 is the exit region of the resin.
Figure 4 shows the advancement of the resin front line as a function of the injection time for both solutions (analytical and numerical) and an illustration of the simulated domain with monitoring points for resin advancement in the porous medium. A maximum difference of 0.66% was observed between the analytical and numerical results, which is an indication of very good agreement. Therefore, the verification of the numerical model presented was satisfactorily achieved, and the code can be used for theoretical recommendations on the geometric configurations of I and T-shaped empty channels inserted in a rectangular porous plate.
It is also worth mentioning that the present computational model was previously verified and validated in the work by the authors of [
9]. The resin propagation obtained with this computational model was verified with the analytical data for linear and radial cases and with numerical results obtained with the PAM-RTM
® software for three-dimensional resin flow in a rectangular box and spherical shell. Moreover, the code was validated with the experimental results obtained by Schmidt et al. [
51] for a case of resin flow in a cavity mold with an inlet nozzle. More precisely, it was compared to the results of resin flow advancement as a function of time: differences of nearly 8.0% were found. The cases in Reference [
9] mimic resin transfer molding (RTM) or light-resin transfer molding (LRTM) processes. In spite of the simulation of different processes, the fluid dynamic behavior of the resin flow of Reference [
9] is the same as performed here. These results were reproduced for code validation in this study, but are not provided here since they have already been presented in Reference [
9].
4. Results and Discussion
To eliminate residual air from a porous medium, it is necessary to perform successful molding. The formation of voids due to partial impregnation of resin inside the fibrous reinforcement can lead to failures in the use of the final product [
45]. In this sense, geometric optimization is essential because it not only increases productivity by reducing the time of injection, but also enhances the quality of the pieces produced. Thus, the prevention of the formation of voids in the porous medium is a restriction in the analysis and definition of the liquid resin infusion (LRI) process.
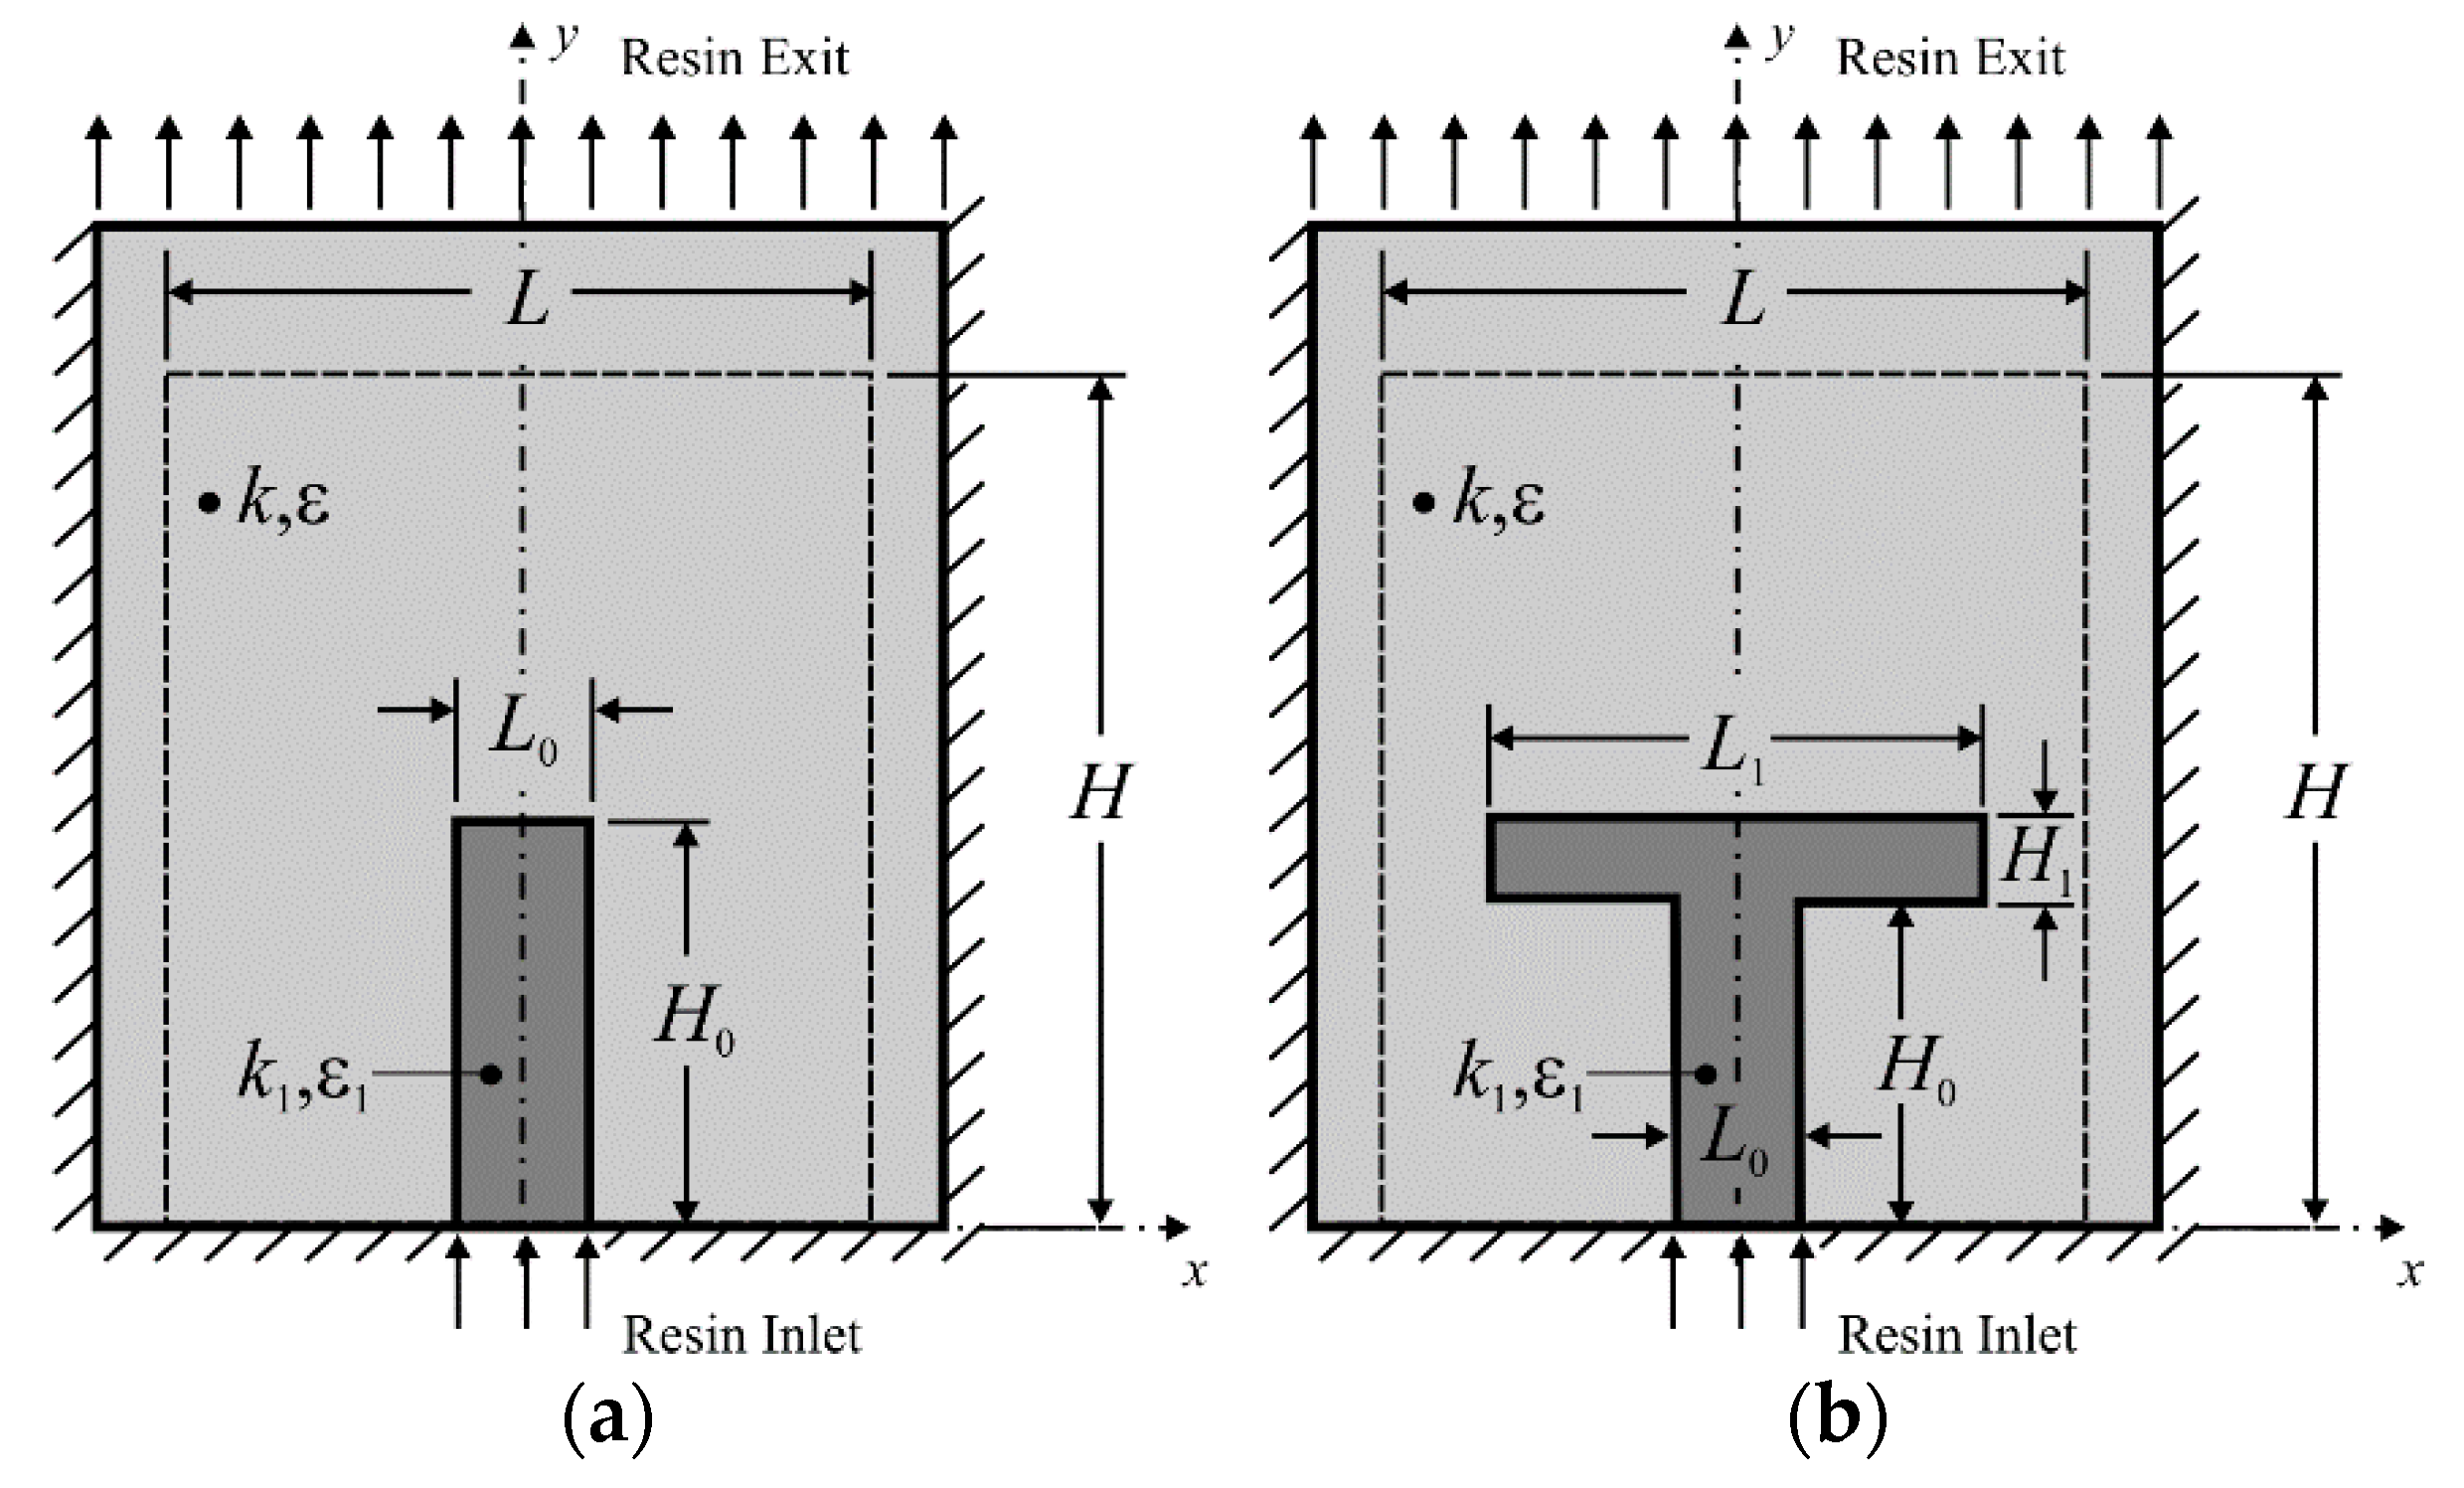
A reference line was created in the domain to measure filling time (see the horizontal dashed lines in
Figure 1a,b, defined by the following points: P
1 (
x1 = −0.25 m,
y1 = 0.50 m) and P
2 (
x2 = 0.25 m,
y2 = 0.50 m)). The position of the front line of the resin flow is monitored along this line. When the resin flow completely crosses the reference line, i.e., when the volumetric fraction along the entire line is equal to
f = 1.0, the infusion process is considered complete.
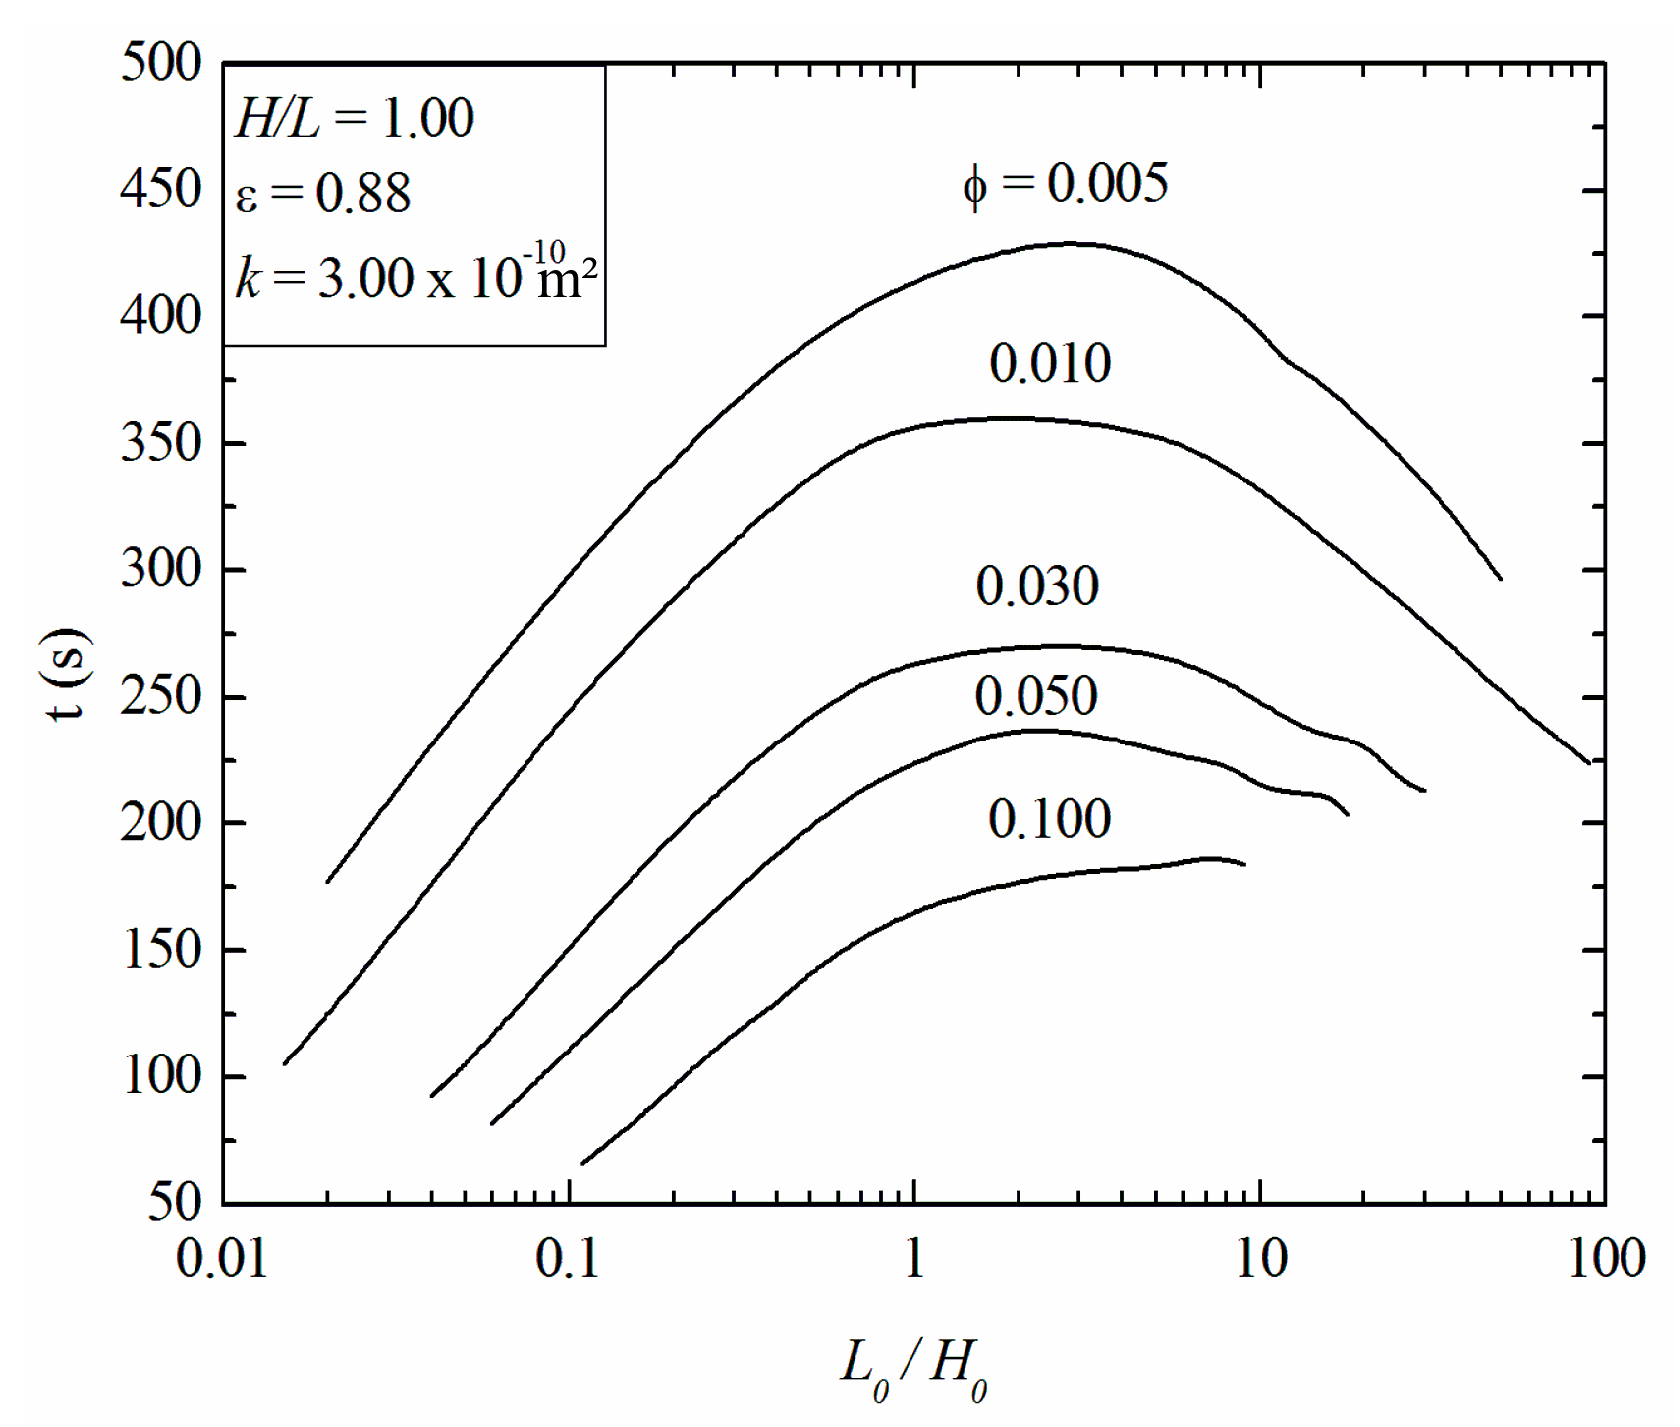
To evaluate the geometric influence of the I-shaped empty channel over the filling infusion time of the resin along the rectangular porous plate, the fraction area inside the domain is analyzed. Simulations performed with different
L0/
H0 ratios are used to determine the case with lower infusion time for five different fraction areas of the empty channel,
ϕ = 0.005; 0.01; 0.03; 0.05 and 0.1. It has been found that the effect of the ratio
L0/
H0 over filling time (
t) is similar for all investigated fractions
ϕ. The only exception happened for
ϕ = 0.1 due to the restriction of the geometry in the upper limit of
L0/
H0, as can be seen in
Figure 5. In general, it is noticed that the lowest
L0/
H0 ratios lead to the best results, i.e., there is a reduction in filling time (
t) when the channel has higher penetration in the
y-direction of the domain. However, the progressive increase of
L0/
H0 to the upper limit results in a decrease in injection time too. Thus, there is a globally optimized ratio placed in the lowest region of
L0/
H0 and a local optimized ratio region, placed in the superior limit of the ratio
L0/
H0 investigated. The worst performance, for almost all cases of
ϕ, is reached for intermediate ratios of
L0/
H0. Different behavior is noticed only for
ϕ = 0.100, where there is an almost asymptotic growth of filling time as a function of ratio
L0/
H0, showing that restriction influences the best shape and effect of geometry over the performance indicator.
The results also showed that the best configurations for lower magnitudes of ϕ can have a superior performance than those achieved for intermediate ratios of L0/H0, even for higher magnitudes of ϕ. For example, the best configuration obtained for ϕ = 0.01, (L0/H0)o = 0.015 led to a filling time of tm = 105.3 s, which is lower than the filling time reached for several configurations (not optimized) with ϕ = 0.03; 0.05 and 0.1. This behavior indicates that geometric rationalization can lead to smaller dimension channels for a performance superior to that reached for larger channels, where geometric configuration is not optimized.
The optimal results obtained in
Figure 5 for each fraction area,
ϕ, are compiled in
Figure 6a.
Figure 6a shows the influence of the ratio between the channel area and the area of the plate (
ϕ) on the once minimized filling time (
tm) for the I-shaped empty channel. Results in
Figure 6a indicate that for the largest area fractions (
ϕ) of the I-shaped channel, the filling time once minimized (
tm) increases.
Figure 6b shows the influence of
ϕ on the optimal ratio of
L0/
H0 named (
L0/
H0)
o. It is also noted that the behavior of the geometric ratio (
L0/
H0)
o is modified with the variation of the area occupied by the channel, i.e., there is no universal optimal geometry that leads to the best performance for all area fractions of the open channels.
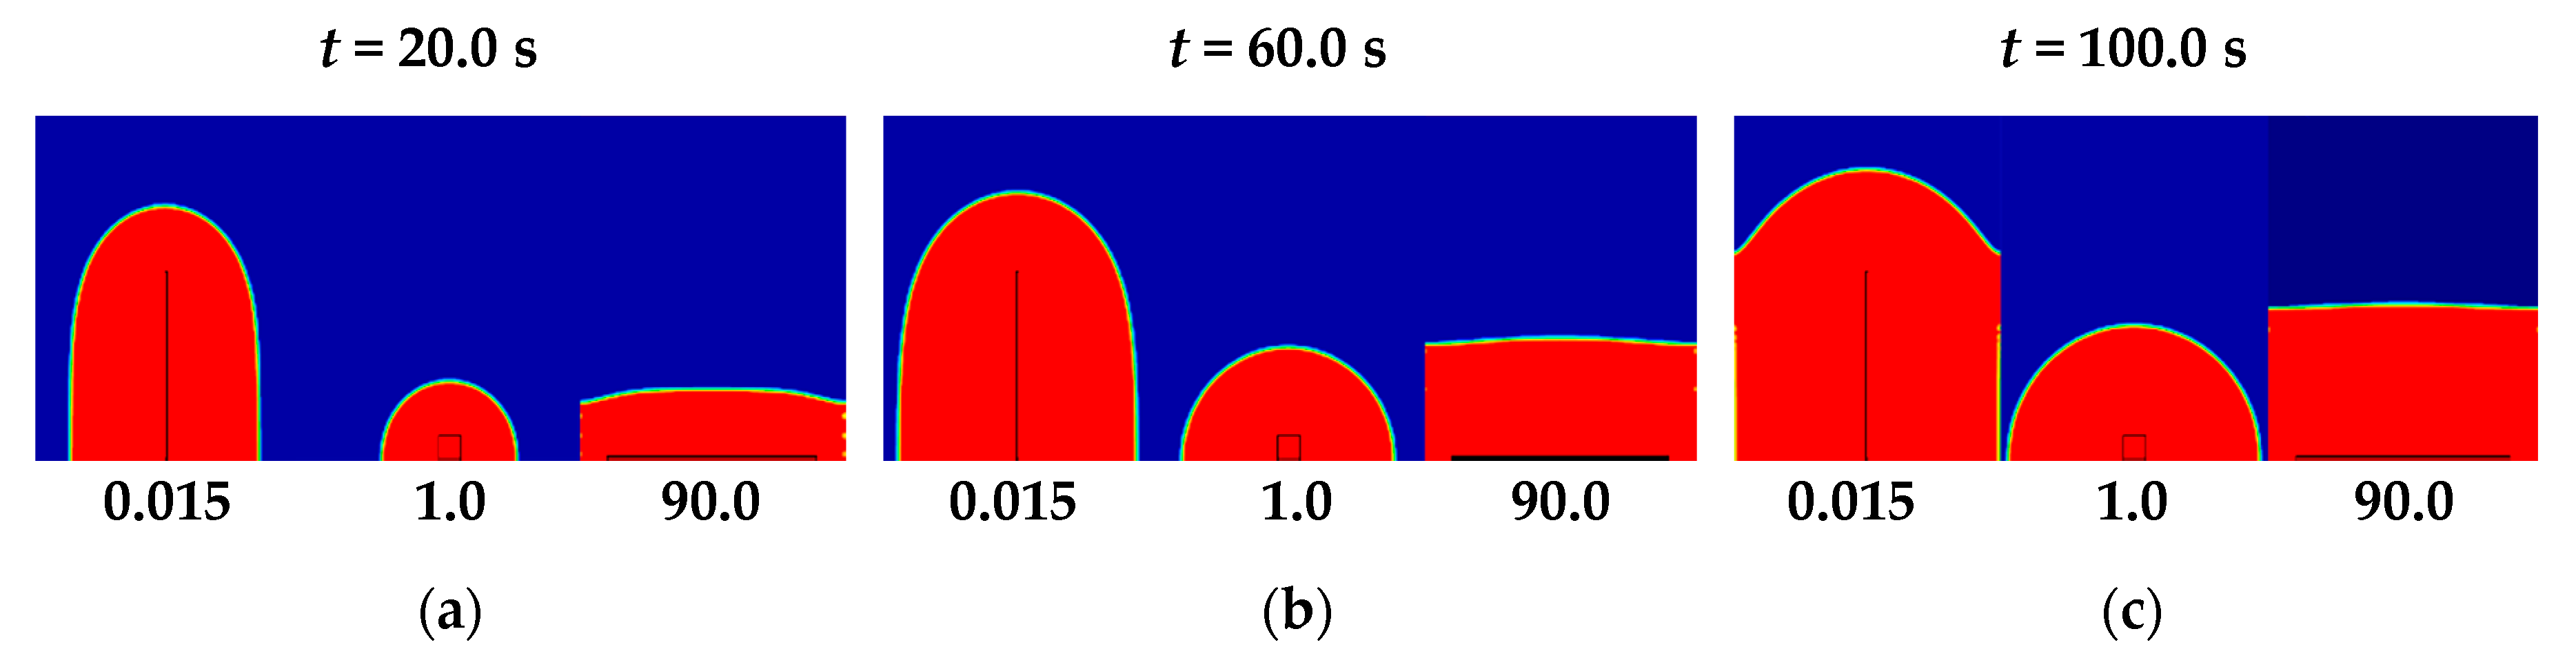
To illustrate the influence of
ϕ and the
L0/
H0 ratio over resin flow considering the I-shaped channel,
Figure 7 and
Figure 8 show the behavior of the resin advancement for three different instants of time at
ϕ = 0.01 and 0.1, respectively. The red region represents the resin, i.e., when the volume fraction is
f = 1.0, while the blue region represents the air (
f = 0). Regions with different colors represent resin/air mixture with intermediary volume fractions between resin and air (0.0 <
f < 1.0). It is worth mentioning that this description is applied to all figures where the resin volume fraction is illustrated. Channel configuration is illustrated with the black line.
Figure 7 shows resin advancement for
ϕ = 0.010 and three different magnitudes of the ratio
L0/
H0: (
L0/
H0)
o = 0.015,
L0/
H0 = 1.0 and
L0/
H0 = 90.0, which represents the two extreme magnitudes and an intermediate value of the ratio
L0/
H0, where the worst performance was reached. Three different instants of time are illustrated to show resin impregnation along time
t = 20.0 s (
Figure 7a); 60.0 s (
Figure 7b) and 100.0 s (
Figure 7c).
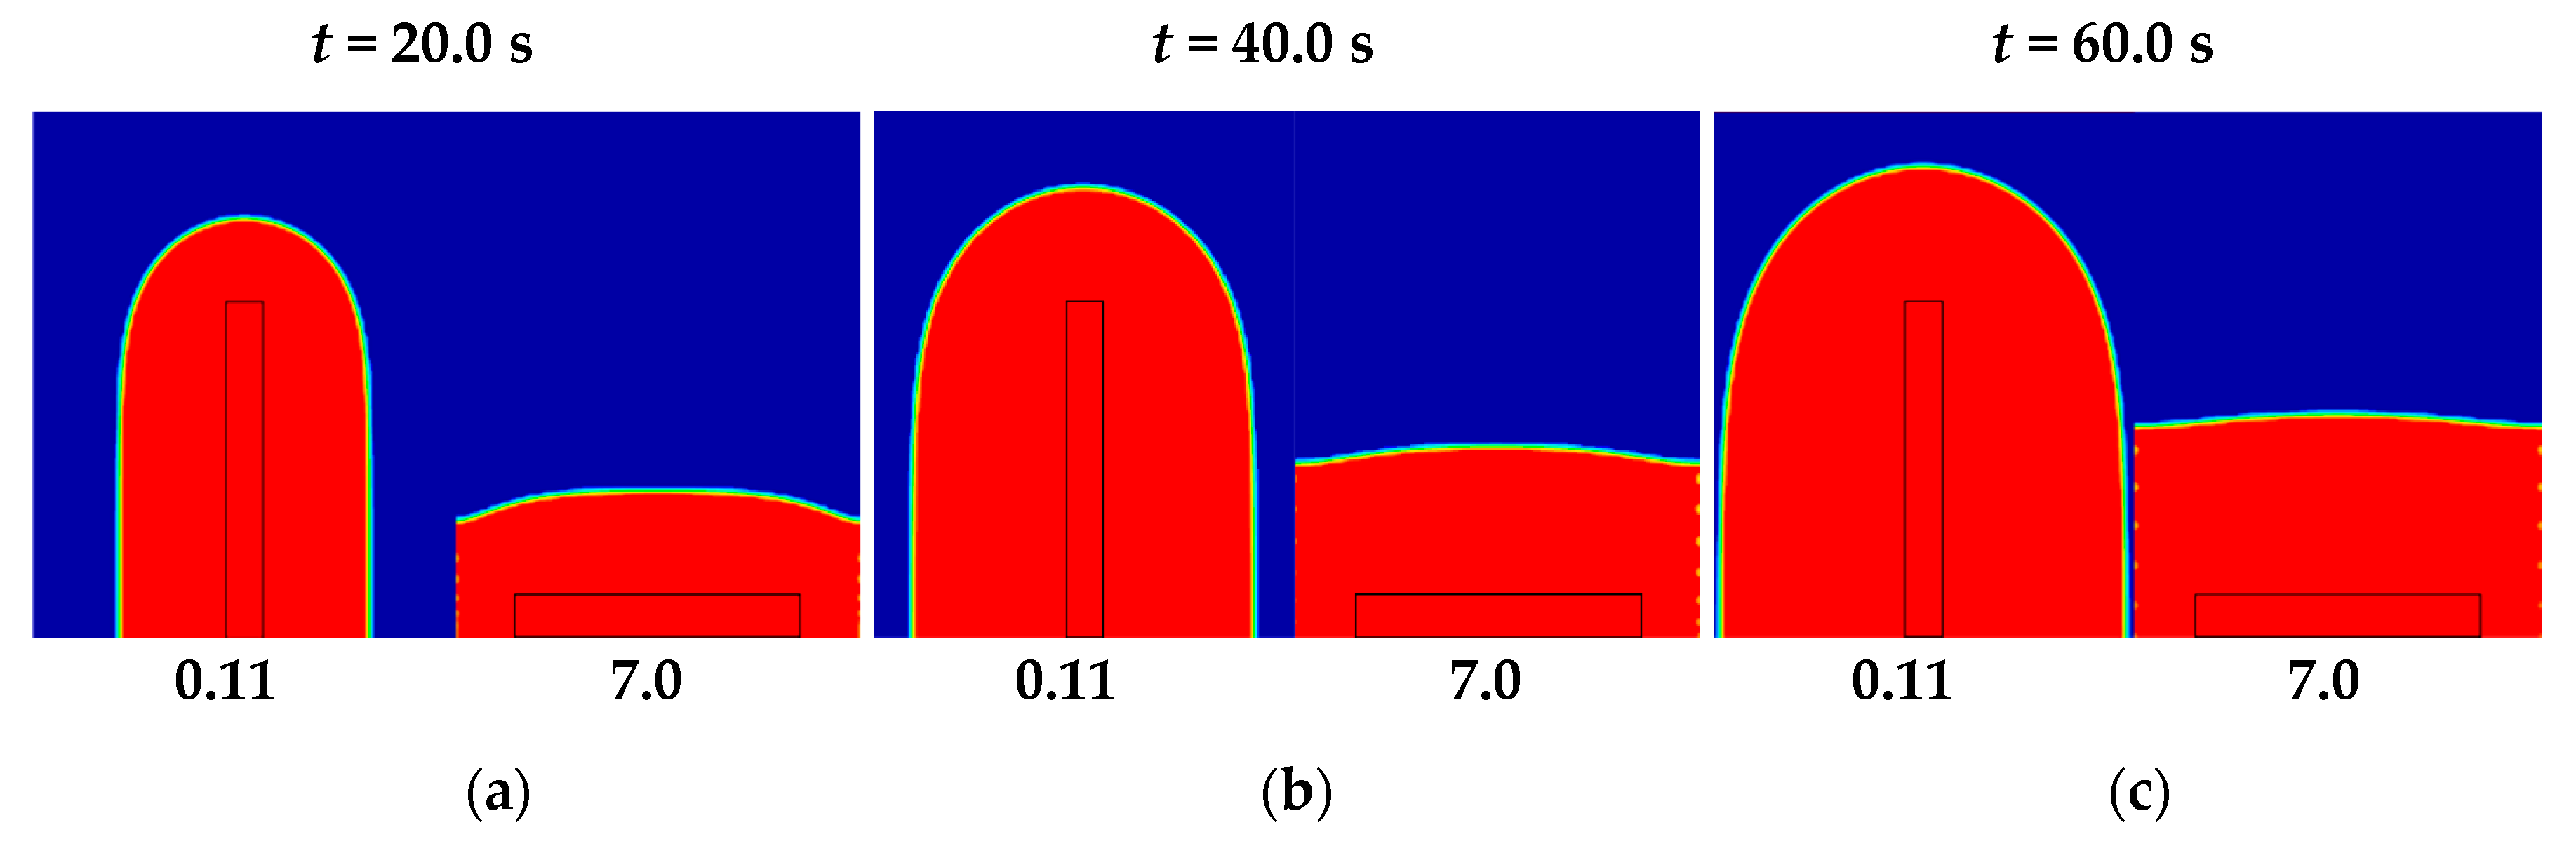
Figure 8 shows the resin flows for
ϕ = 0.100 and two different ratios of
L0/
H0: (
L0/
H0)
o = 0.11 and
L0/
H0 = 7.0, representing the optimal geometry and worst case for three different instants of time:
t = 20.0 s (
Figure 8a), 40.0 s (
Figure 8b), and 60.0 s (
Figure 8c).
Results of
Figure 7 and
Figure 8 indicated that for the smallest ratios of
L0/
H0, there is a higher advancement of resin in the
y-direction. After the spread of resin along the entire empty channel, resin flows from the central region of the domain towards the lateral surfaces of the porous plate. Furthermore, in the superior region of the empty channel, the behavior of the resin flow is similar to that found in radial configurations. This behavior makes the distribution of the resin in the fibrous medium more efficient, minimizing resin filling time in the porous medium. It is also noticed that there are no void formations that could delay the infusion process or cause problems in the manufacturing process. For the highest magnitudes of
L0/
H0, the channel is placed in the lower region of the porous plate, leading to an almost constant front-line of resin.
Moreover, resin advances towards the exit of the porous domain with a behavior similar to the rectilinear case. In a general sense, geometrical investigation of I-shaped empty channels has attested that the elongated channels in resin propagation direction led to the best performance due to the increase of pressure gradient imposed inside the mold. This behavior is in agreement with the constructal principle of the optimal distribution of imperfections.
Subsequent investigation consisted of the evaluation of the influence of the T-shaped channel aspect ratios
L1/
H1,
L0/
H0, and
H0/
H1 on the filling time for resin impregnation in the rectangular porous plate. For this configuration, the optimization process was performed only for
ϕ = 0.05 due to the high number of simulations needed. Firstly, the effect of the ratio
L1/
H1 on resin infusion time along the mold was evaluated for different values of the ratio
L0/
H0, keeping
H0/
H1 fixed.
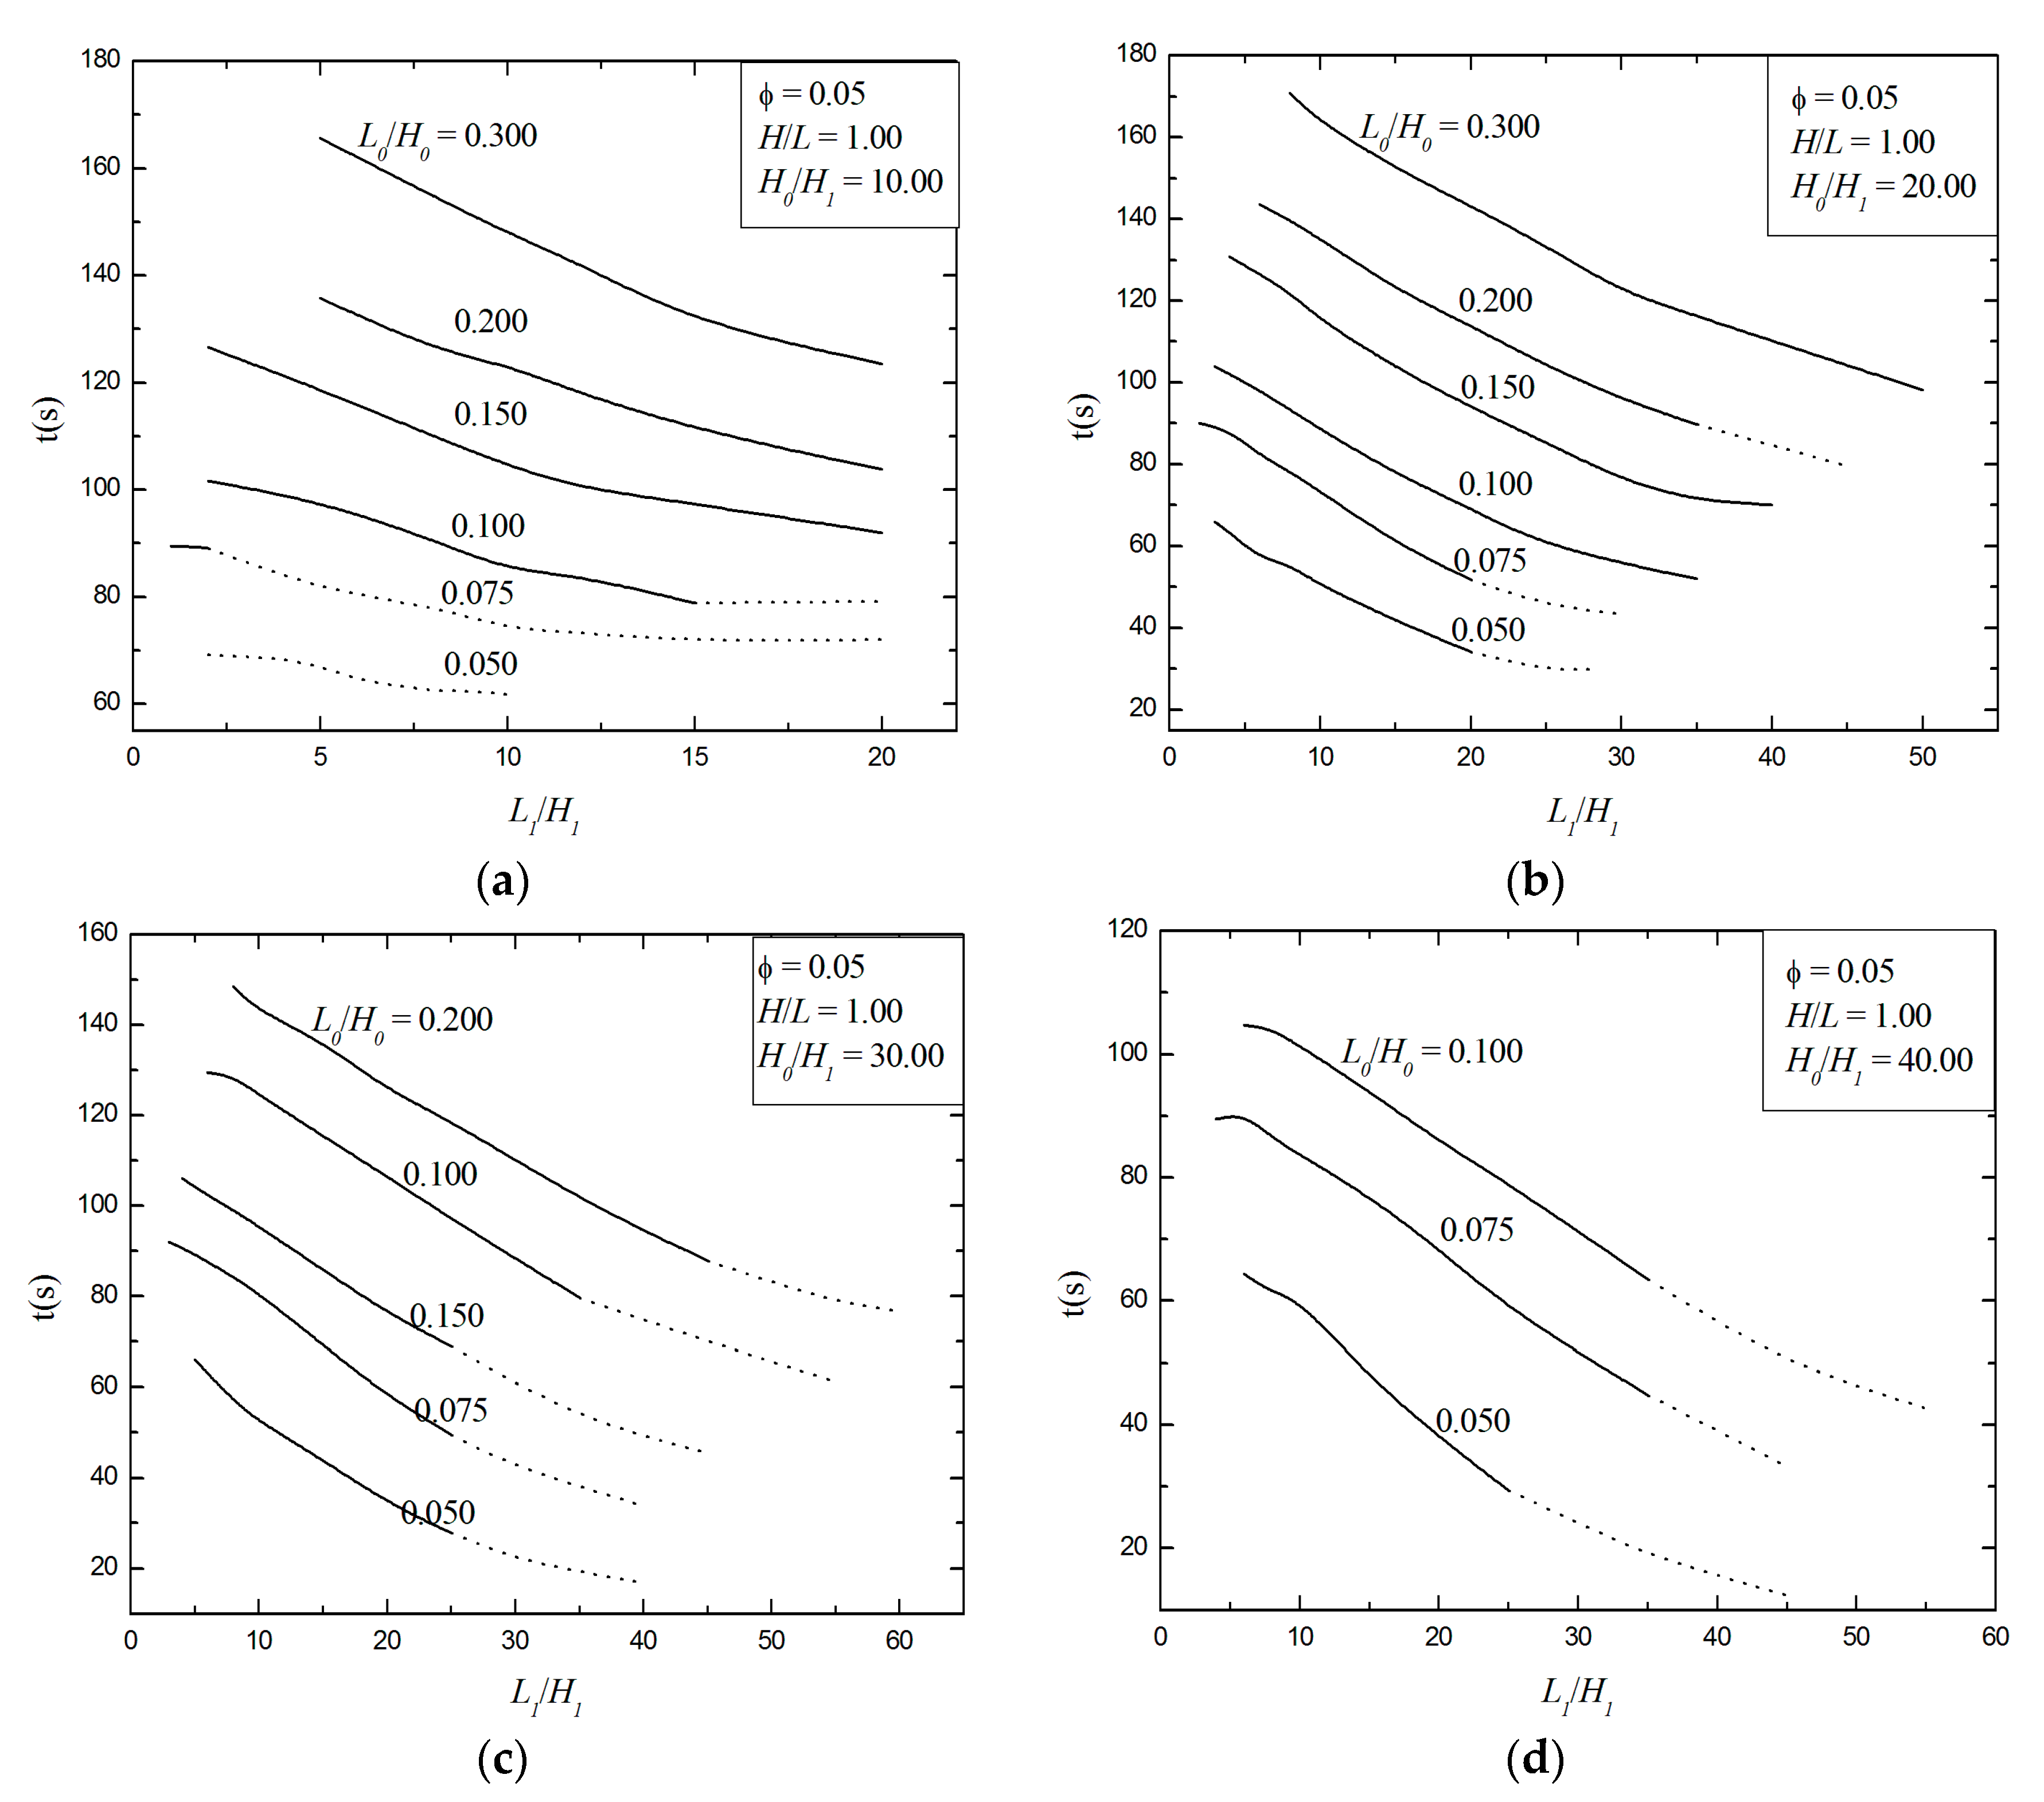
Figure 9a–d present the effect of the ratio
L1/
H1 over the filling time for various constant ratios of
L0/
H0 and four different magnitudes of
H0/
H1 = 10.0, 20.0, 30.0 and 40.0, respectively. It should be noted that for
H0/
H1 = 30.0 and
H0/
H1 = 40.0, the
L0/
H0 search space becomes more restricted due to the generation of very thin channels. For example, when
H0/
H1 = 40.0, the variation is viable only in the range 0.05 ≤
L0/
H0 ≤ 0.1 because for higher magnitudes of
L1/
H1, the thickness of the bifurcated channel would become insignificant, which disfigures the T-shaped geometry of the channel and leads to the generation of permanent voids.
In
Figure 9a–d, the continuous curves represent valid geometries, i.e., those geometries with no permanent void inside the porous plate or empty channel. The dashed curves represent cases where permanent voids are generated, even if the monitoring line indicates complete impregnation of the mold (with
f = 1.0 along the whole measurement line). In this sense, these results are disregarded for optimization evaluation, since void formations are a critical problem in manufacturing. It is to be noted that some cases in the dashed region of the curves achieved lower filling times, indicating that the resin has a higher impregnation in the porous plate. However, the mold was not completely filled.
Results in
Figure 9a–d also show that the higher magnitudes of
L1/
H1 for all investigated ratios of
L0/
H0 lead to the best performance, i.e., there is a reduction in resin filling time (
t) when the bifurcated channel has higher penetration into the mold toward its lateral surfaces. However, some T-shaped channels with higher ratios of
L1/
H1 and lower magnitudes of
L0/
H0 lead to the formation of permanent voids, mainly when the geometry is composed of skinny channels. Therefore, the results recommend the building of elongated channels, since this does not lead to skinny channels. The generation of permanent voids occur, in general, in the corner that connects the single stem to the bifurcated branches. One possible reason for this behavior is the detachment of resin flow in the channel corner with not enough resin flow coming from the inlet to degenerate the void. Therefore, the permanent void remains during all the simulations in the area mentioned above.
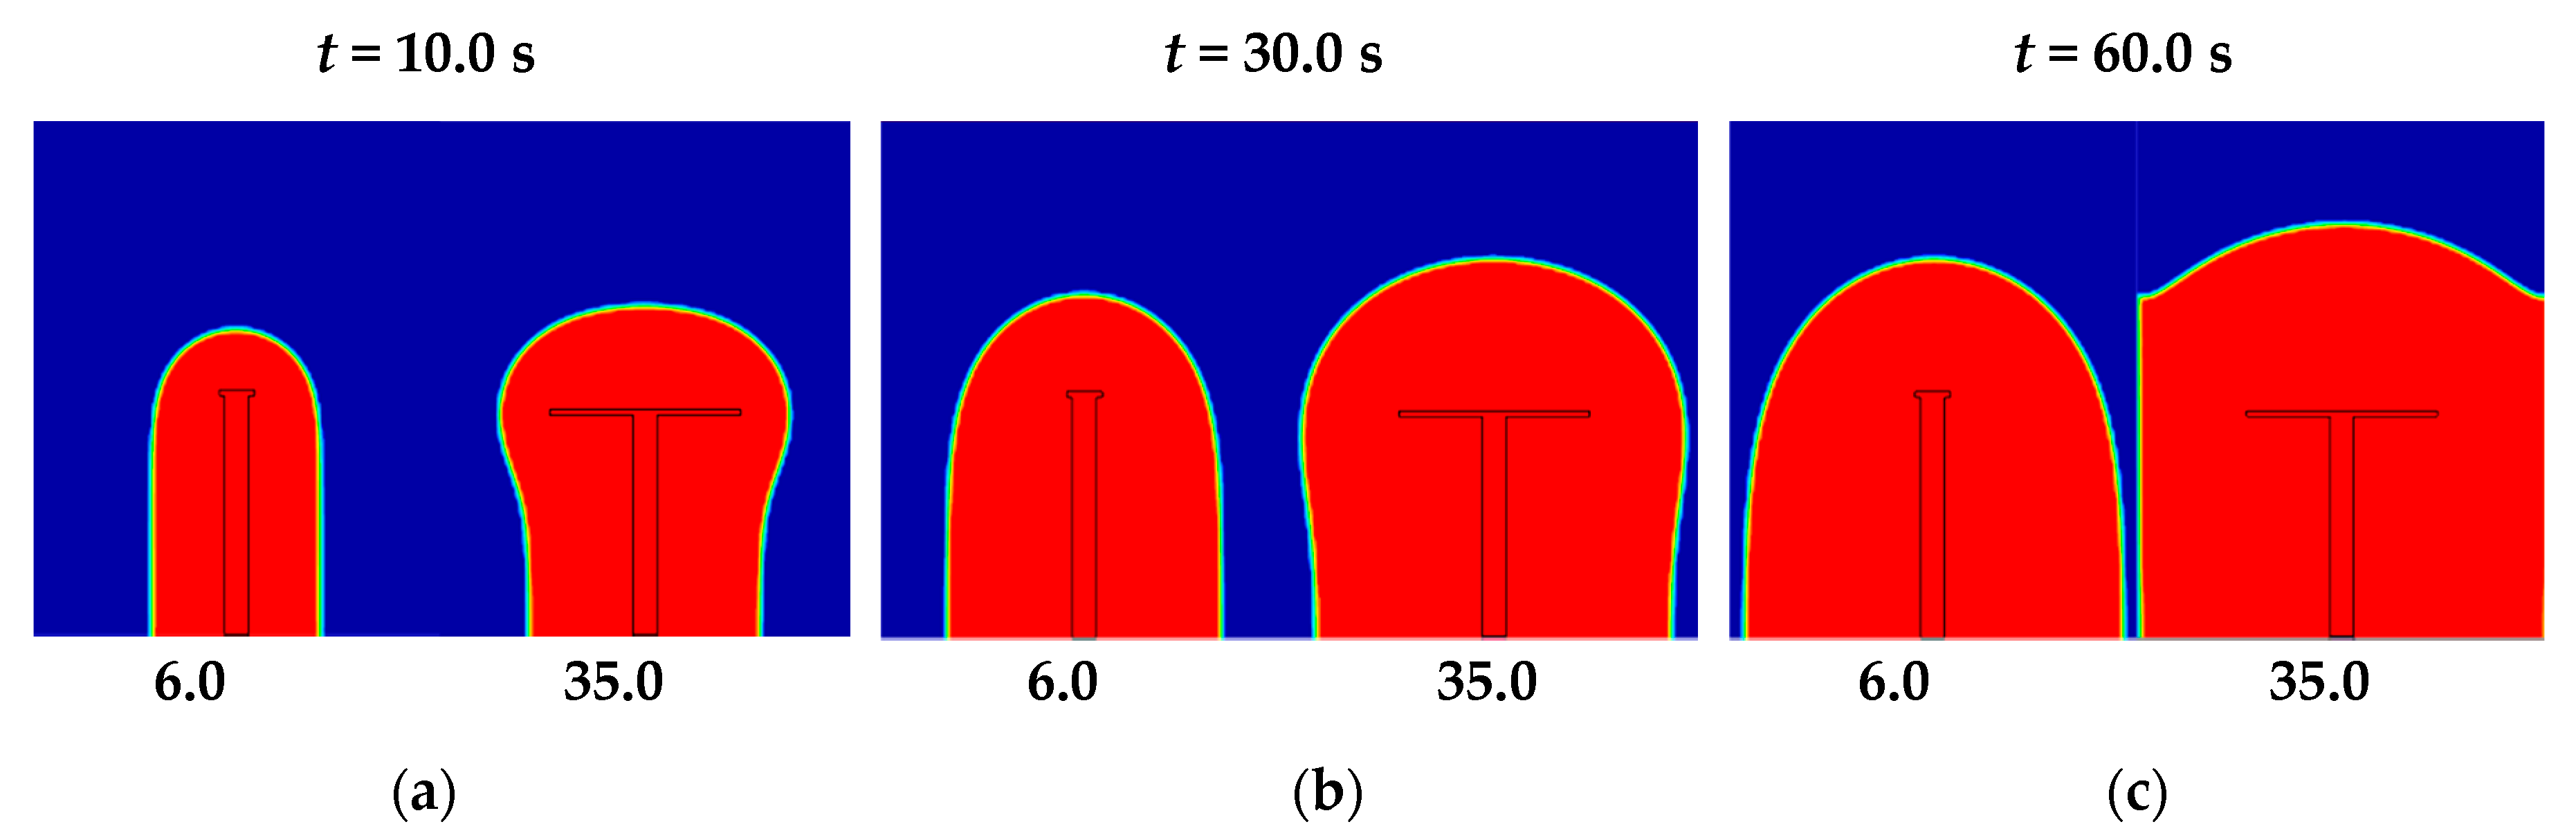
To illustrate the influence of ratio
L1/
H1 on mold filling time,
Figure 10 shows the advancement of resin for two different ratios of
L1/
H1,
L1/
H1 = 6.0 and (
L1/
H1)
o = 35.0, which represents the worst and best shapes when the constant ratios of
H0/
H1 = 40.0 and
L0/
H0 = 0.1 are assumed. For both cases, the volume fraction fields for three different instants of time—
t = 10.0 s, 30.0 s, and 60.0 s—are presented in
Figure 10a–c, respectively. For
L1/
H1 = 6.0, filling time of
t = 104.7 s is obtained, while the ratio (
L1/
H1)
o = 35.0 leads to a resin injection time of the once minimized of
tm = 63.5 s, which is about 65.0% faster than the worst-performing geometry. For the lower magnitudes of
H1/
L1, resin distribution occurrs in a radial form in the upper region of the T-shaped channel and linearly from the center to the side surfaces of the mold at the bottom region of the T-shaped channel. This behavior is quite similar to that seen for I-shaped empty channels with high intrusion in the porous plate. As the ratio of
H1/
L1 is changed to (
H1/
L1)
o = 35.0, the radial advancement of the resin at the upper region of the T-shaped channel is found to be intensified, when compared with the previous case (
H1/
L1 = 6.0). This effect also intensifies the linear advancement of resin in the inferior region of the porous plate.
Consequently, the filling of the resin in the horizontal direction (from the open channel towards the side walls) is completed in a shorter amount of time, also leading to an improvement in resin advancement towards the porous plate exit. However, significant increase in bifurcated length (augmentation of the ratio H1/L1) leads to the formation of permanent voids inside the plate. It is worth mentioning that the channel area is constant; as a consequence, augmentation of the channel bifurcated branch leads to a decrease in channel thickness, which is the main factor responsible for the formation of voids, especially in the corners between the single and bifurcated regions of the channel.
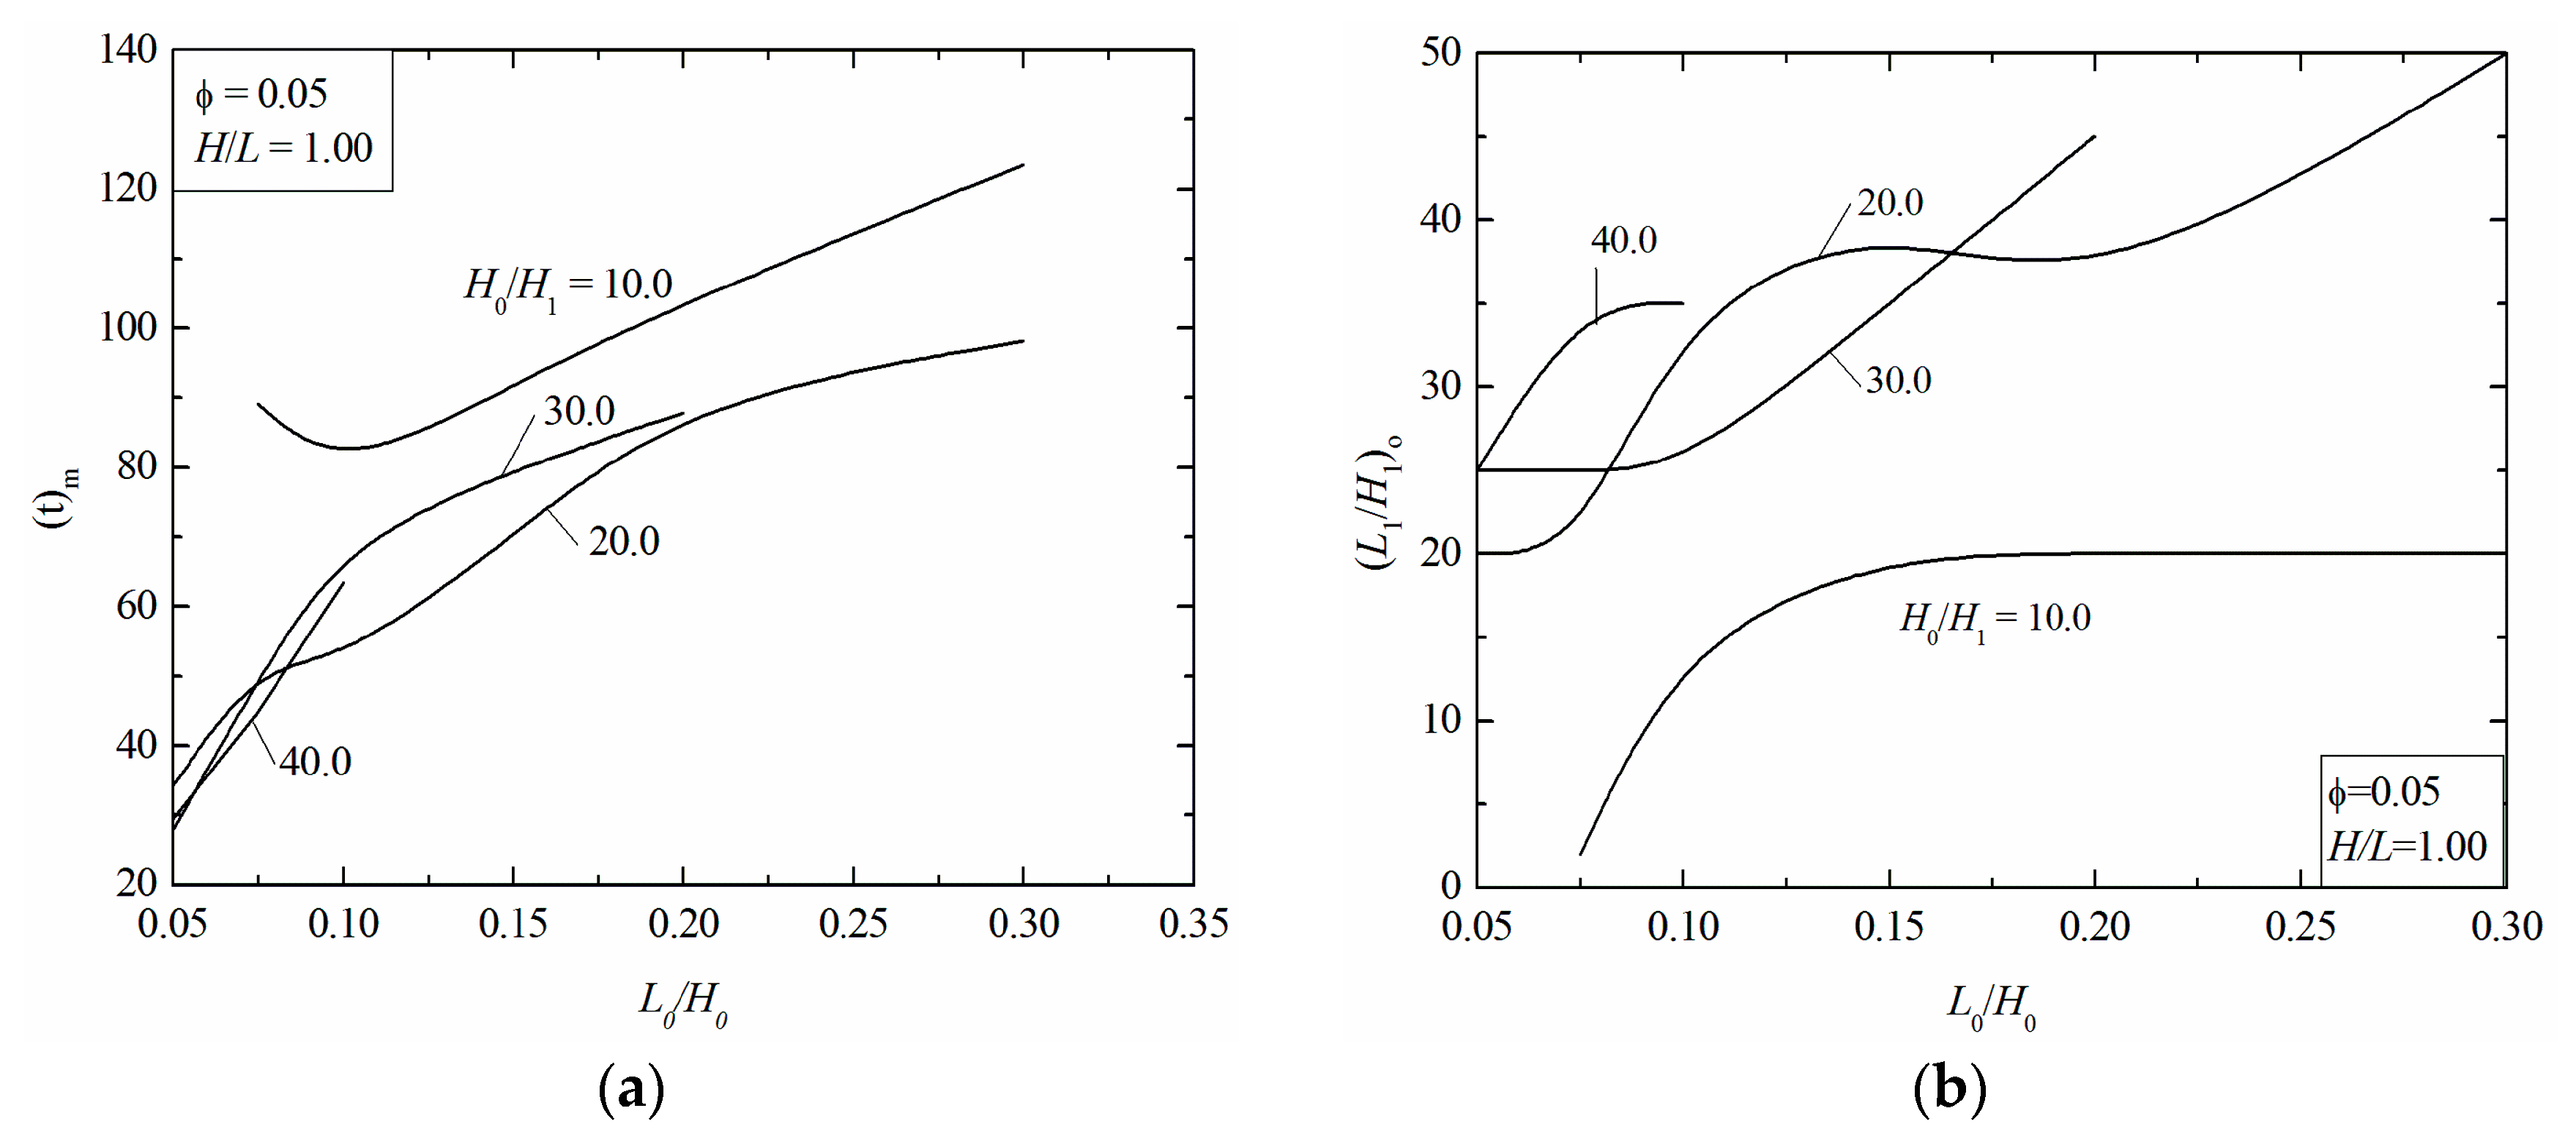
The variation of the
L1/
H1 ratio provides the once minimized filling time (
tm) of the resin in the porous plate for each investigated ratio of
L0/
H0 and different ratios of
H0/
H1. In the second optimization level, the results of
Figure 9 are compiled and presented in
Figure 11a,b.
Figure 11a illustrates the influence of the ratio
L0/
H0 over the once minimized filling time,
tm, for different
H0/
H1 ratios studied here. It can be noted that for
H0/
H1 = 20.0; 30.0 and 40.0, the effect of the
L0/
H0 over
tm is similar, except for cases with
H0/
H1 = 10.0. In general, it is noticed that lower ratios of
L0/
H0 present a predominance in achieving the twice-minimized filling time (
tmm), i.e., the best shapes are obtained when the main channel has a higher penetration in the direction of the exit region of the domain. For the ratio
H0/
H1 = 10.0, it can be observed that intermediate ratios of
L0/
H0 lead to the best performance of the problem. For the lowest magnitudes of
L0/
H0, the optimal ratios of (
L1/
H1)
o suffer a strong decrease (see
Figure 11b), degenerating the T-shaped channel into an I-shaped one. For higher magnitudes of
L0/
H0, the T-shaped channel is strongly restricted in the lower region of the porous plate.
Figure 11b highlights the influence of the ratio
L0/
H0 over the once-optimized ratio of
L1/
H1, (
L1/
H1)
o, for the four different magnitudes of
H0/
H1 investigated. The effect of
L0/
H0 over (
L1/
H1)
o varied for different magnitudes of
H0/
H1. For the ratios
H0/
H1 = 20.0; 30.0 and 40.0, the best shapes are obtained for (
L0/
H0)
o = 0.05 and for high magnitudes of (
L1/
H1)
oo in the range 20.0 ≤ (
L1/
H1)
oo ≤ 25.0, corroborating previous findings that the best performance is achieved for the most elongated possible single and bifurcated branches of T-shaped channel. For
H0/
H1 = 10.0, the best configurations changed for (
L0/
H0)
o = 0.075 and the optimal ratio (
L1/
H1)
oo dropped dramatically to (
L1/
H1)
oo = 2.0. In general, the results show that changes in one degree of freedom have a strong influence on the effect of other geometric ratios on the performance indicator. In this case, it was also noticed that there is no optimal universal configuration that leads to the best performance in this problem.
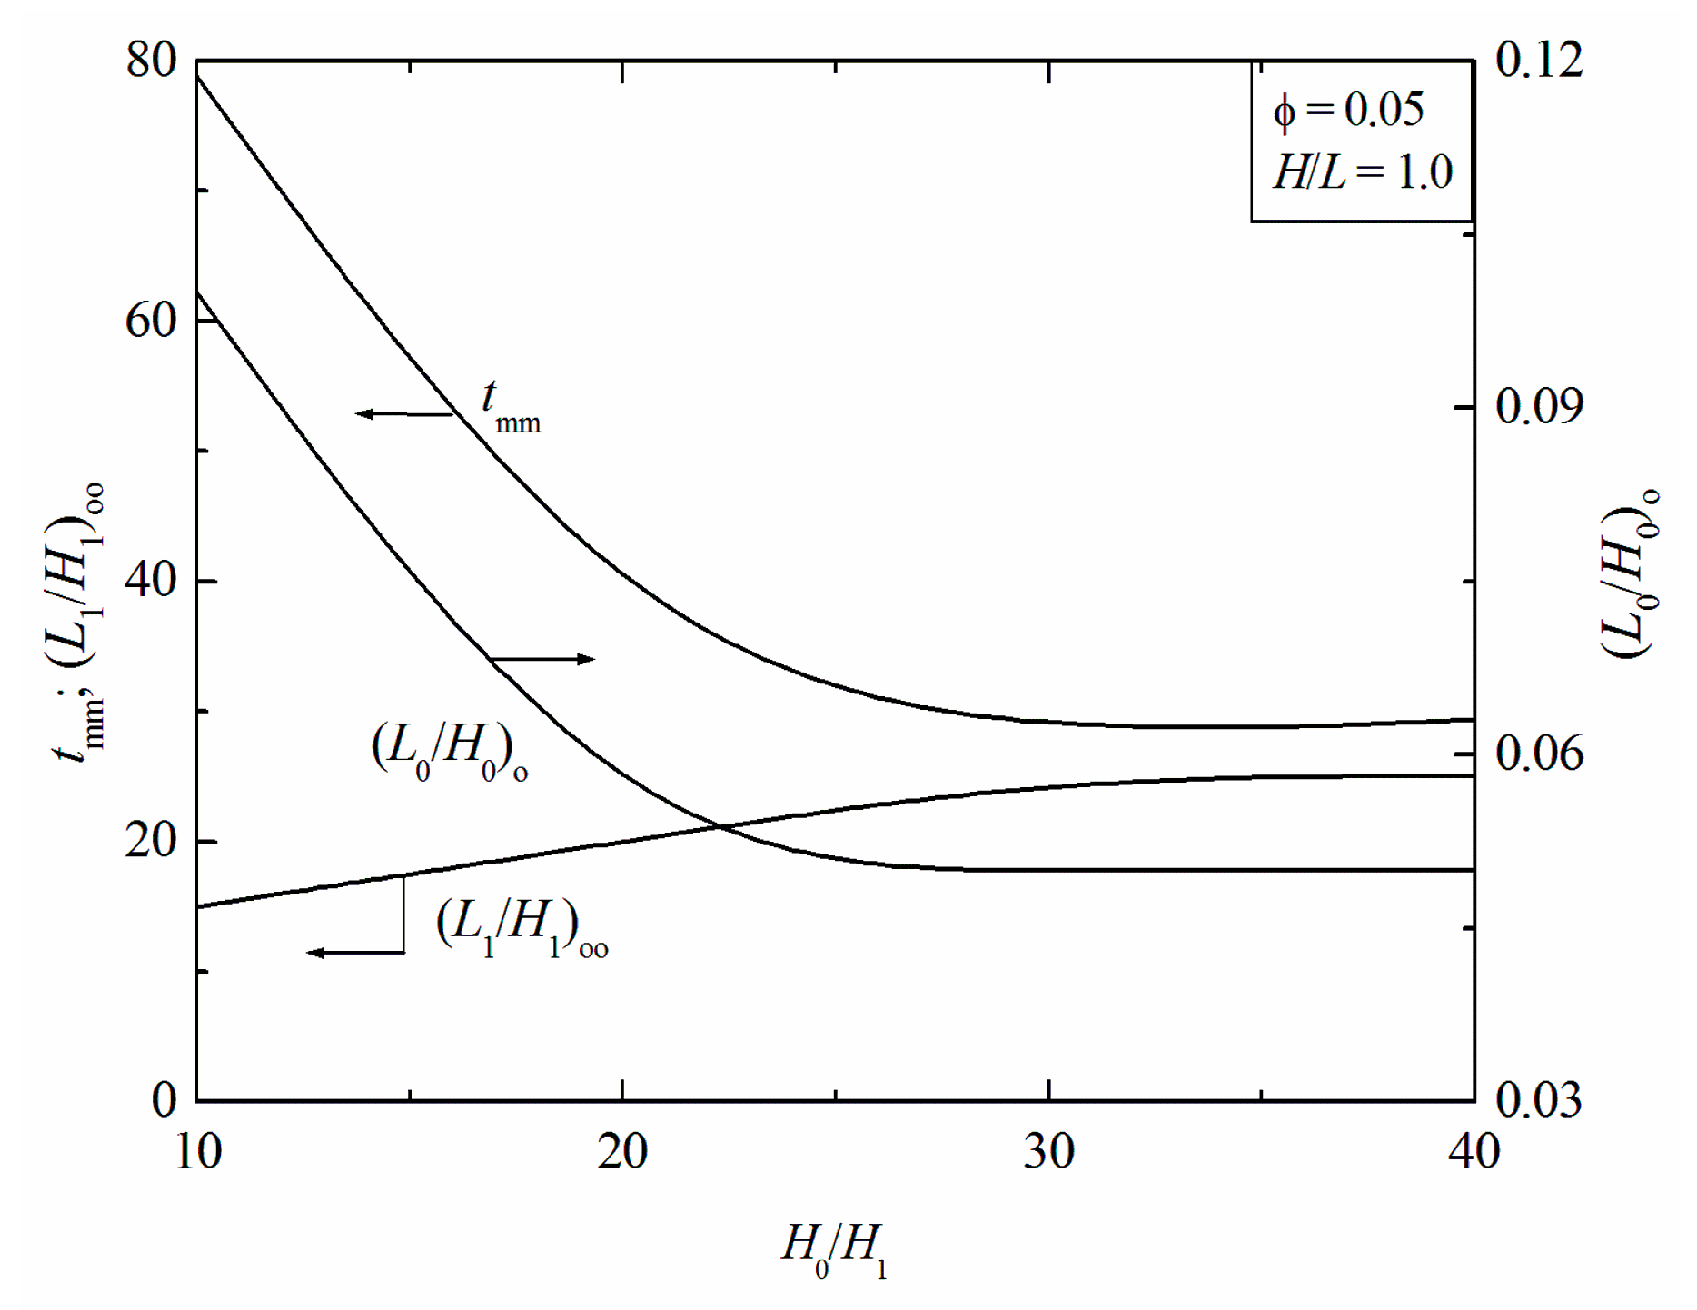
The last optimization step consists of investigation on the influence of the ratio
H0/
H1 over the twice-minimized filling time (
tmm) and the respective optimal configurations: (
L0/
H0)
o and (
L1/
H1)
oo. To obtain this evaluation, the best results achieved in
Figure 11a,b are compiled in
Figure 12.
These results show that the behavior of the (tmm) is largely affected by ratio H0/H1, and it has a strong dependence on ratios (L1/H1)oo and (L0/H0)o. The thrice-minimized filling time (tmmm) is obtained for the rate (H0/H1)o = 30.0, which is only 5.0% lower than that reached for H0/H1 = 40.0. In general, it is possible to state that the higher magnitudes of the ratio H0/H1 led to the best performance for this problem. The lowest magnitude of H0/H1 = 10.0 obtained a performance 183.0% inferior to that reached for the optimal ratio (H0/H1)o = 30.0. Moreover, differences found for tmm between the ratios H0/H1 = 20.0 and (H0/H1)o = 30.0 was nearly 23.0%.
Concerning optimal shapes, it was noticed that the ratio (L0/H0)o suffered a strong decrease in its magnitude in the region 10.0 ≤ H0/H1 ≤ 20.0, followed by a smooth decrease in the range 20.0 ≤ H0/H1 ≤ 30.0 and a stabilization for H0/H1 ≥ 30.0. For (L1/H1)oo, an increase in magnitude was noticed, until stabilization for H0/H1 ≥ 30.0. In general, the results show the importance of geometric investigation in the reduction of filling time of resin impregnation along a porous domain.
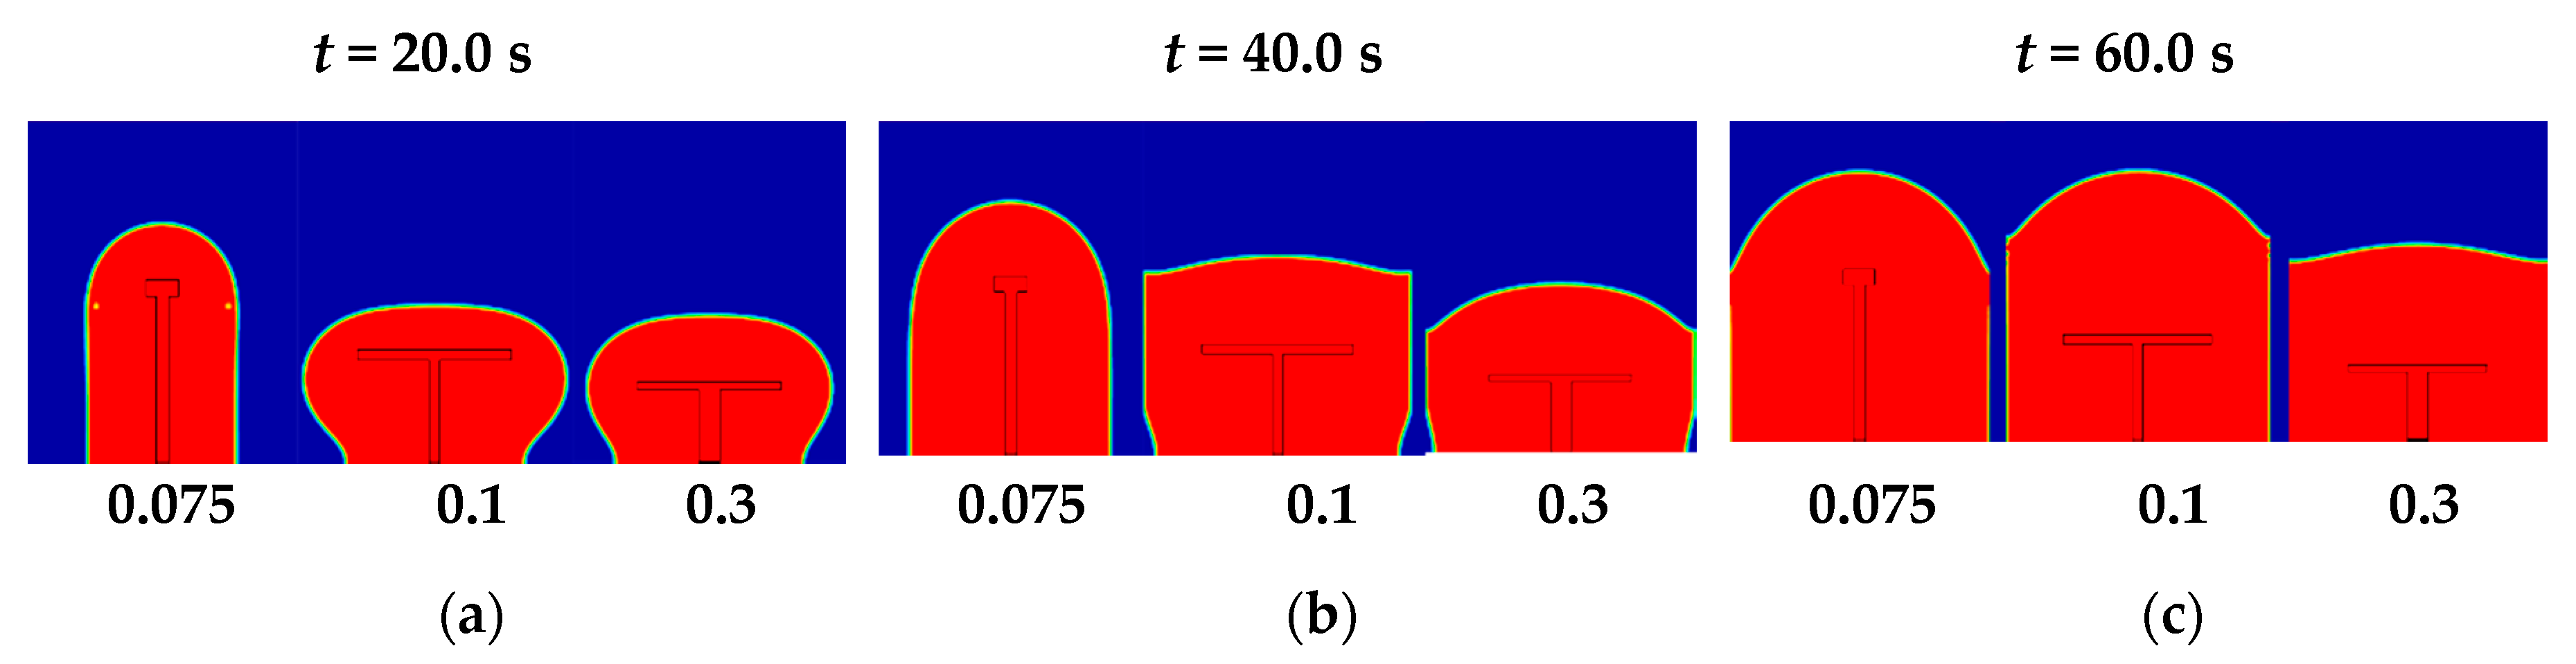
To illustrate the transient behavior of resin flow in the mold,
Figure 13 and
Figure 14 show the distribution of resin volume fraction as a function of time for the worst performing ratio,
H0/H1 = 10.0, and for the optimal ratio (
H0/H1)
o = 30.0, respectively. Topologies are presented for the following times:
t = 20.0 s; 40.0 s and 60.0 s, respectively.
Figure 7,
Figure 8, and
Figure 10 illustrate the topology of the configuration of the empty channel.
Figure 13 shows resin progression at the analyzed instants of time for
H0/
H1 = 10.0 and
L0/
H0 = 0.075, (
L0/
H0)
o = 0.1, and
L0/
H0 = 0.3 corresponds to the lowest ratio of
L0/
H0, the optimal configuration, and the superior magnitude, respectively. For the lowest ratio of
L0/
H0, it is observed that the T-shaped channel almost degenerates into an I-shaped channel. This configuration leads to a poor distribution of resin in the lower region of the porous plate. The resin propagation is shown for three different instants of time:
t = 20.0 s (
Figure 13a),
t = 40.0 s (
Figure 13b) and
t = 60.0 s (
Figure 13c).
For optimal configuration, despite the T-shaped channel being placed in a lower region of the porous plate in comparison with the case with L0/H0 = 0.075, the elongated bifurcated branches led to better distribution of the resin in the lower region of the porous plate and allow easy resin propagation towards the exit of the domain. For the superior ratio of L0/H0 = 0.3, the restriction of the T-shaped channel in the lower region of the porous plate affects the advancement of resin towards the exit of the domain, leading to a poorer performance than the optimal ratio of L0/H0.
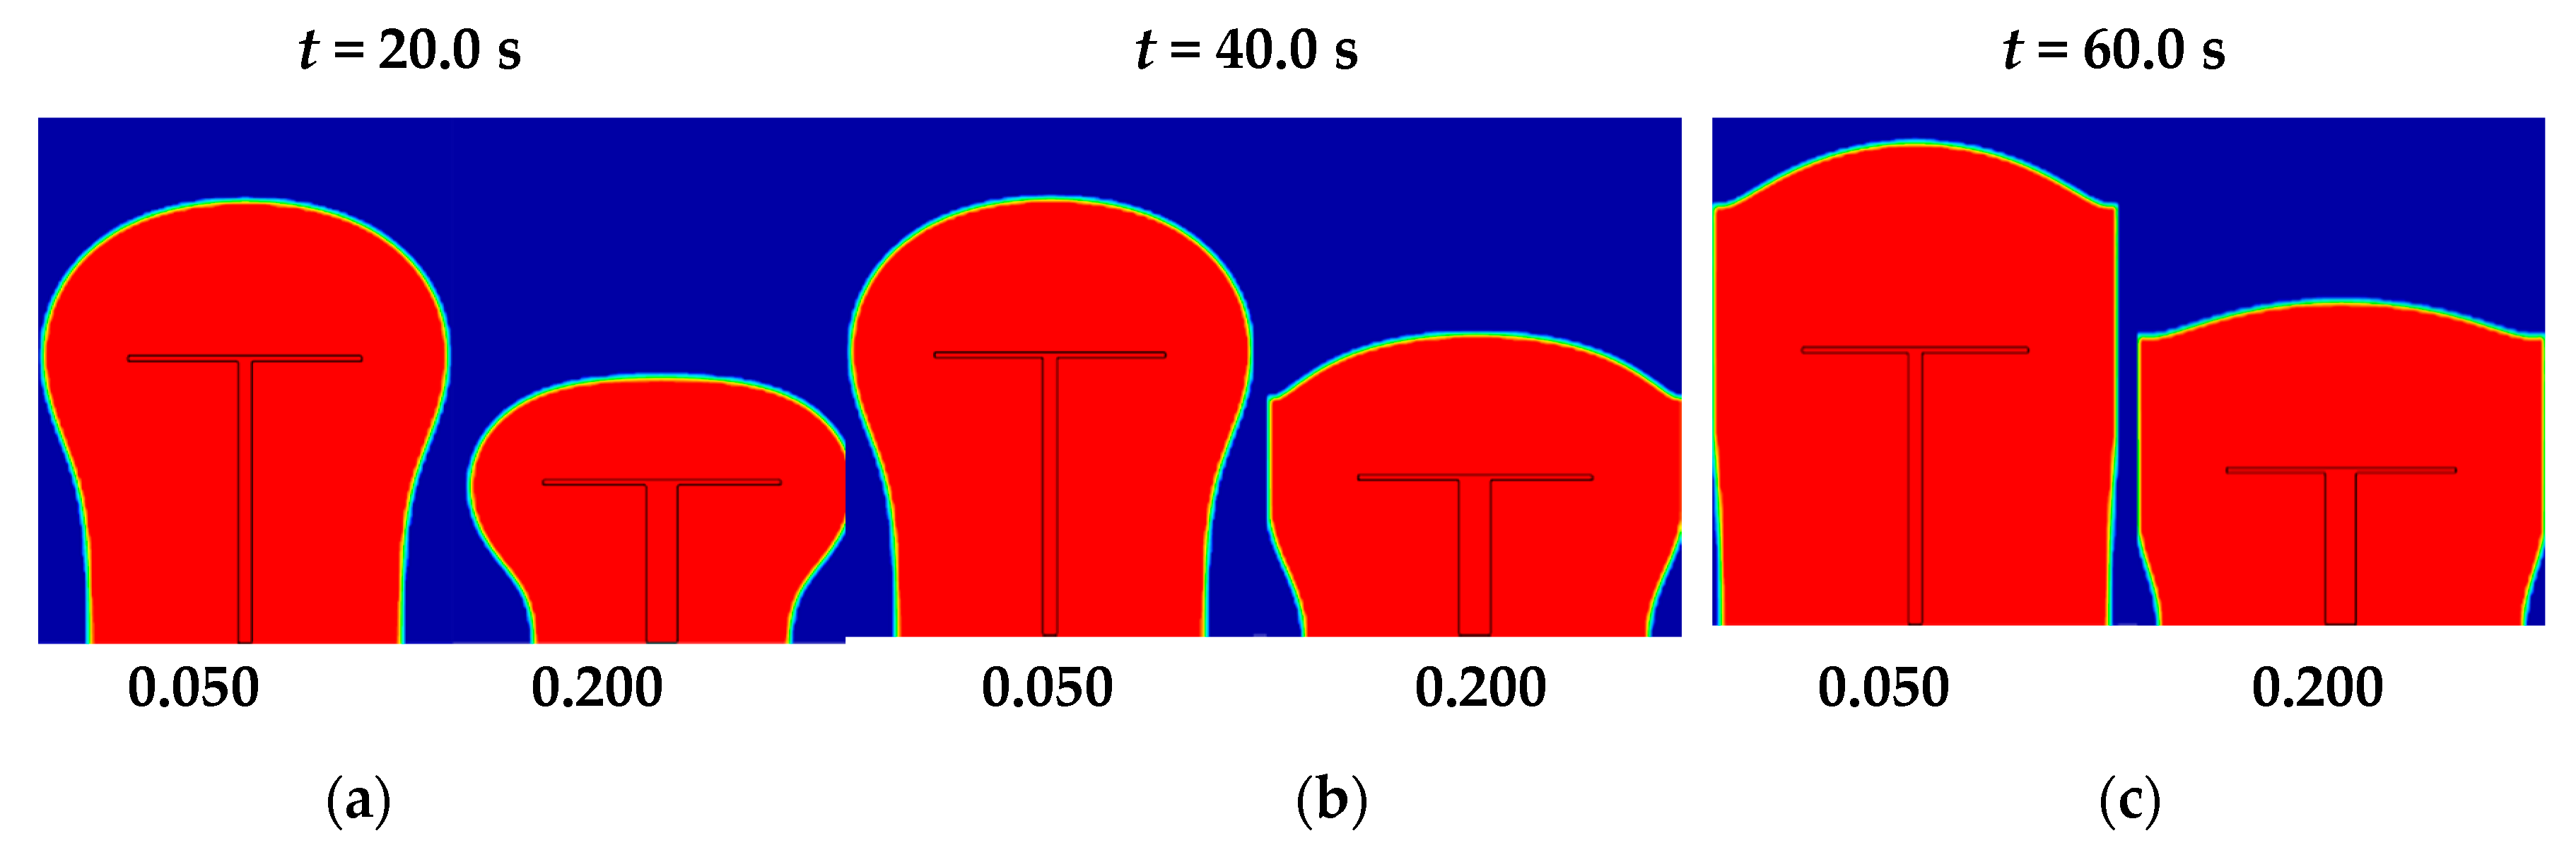
Figure 14 presents the results of resin spread for the optimum ratio of
H0/
H1, (
H0/
H1)
o = 30.0, for two different ratios of
L0/
H0, (
L0/
H0)
oo = 0.05,
L0/
H0 = 0.2 and three different instants of time:
t = 20.0 s (
Figure 14a),
t = 40.0 s (
Figure 14b),
t = 60.0 s (
Figure 14c). These ratios represent the corresponding twice-optimized and worst-case scenarios for the ratio of (
H0/
H1)
o = 30.0, respectively. For the ratio (
L0/
H0)
oo = 0.05, an injection time of
tmmm = 27.9 s is obtained, and the ratio
L0/
H0 = 0.2 leads to a once minimized injection time of
tm = 87.9 s, which is, about of 215.0% higher than the previously obtained optimal geometry. It is then possible to significantly improve the performance of the studied system even in the last level of optimization.
In a general sense, the results demonstrate that for the T-shaped channel, all geometrical ratios (degrees of freedom) affect the filling time of resin impregnation in a porous domain. They also show that one degree of freedom has a strong influence over the optimal ratios of other geometric ratios, e.g., the ratio H0/H1 affected the optimal ratios of (L1/H1)oo and (L0/H0)o.
All the geometrical parameters studied here (L1/H1, L0/H0, and H0/H1) has some sensibility in the infusion process and cannot be neglected. Moreover, a comparison between the performance of the T-shaped and I-shaped empty channels, for the same conditions, demonstrates that the thrice-optimized T-shaped channel leads to performance that is almost three times superior to that achieved by the optimal I-shaped configuration.
In the present fluid dynamic conditions, where resin flow has little advective dominance, the rectangular porous plate can be viewed as an elementary construction of multiple structures generated by the replication of a porous plate in x- or y-axes. In this case, multiple optimal configurations of I and T-shaped channels can be associated in a series and/or parallel using the optimal configurations reached in this work.


 ,
, 


