1. Introduction
Arthrospira (Spirulina) platensis is planktonic, photoautotrophic, filamentous cyanobacteria, which is morphologically characterized by multicellular spiral trichomes [
1]. From an economic perspective,
A. platensis is considered to be one of the most valuable cyanobacteria due to its large-scale cultivation and biotechnological potential. The rich content of micro- and macro-nutrients, along with a high content of valuable compounds such as proteins, lipids, and pigments, made
A. platensis an interesting microorganism for industrial sectors such as cosmetics, pharmaceuticals, biomedical, and food.
With few exceptions, cyanobacterial phycobiliproteins are found in vivo assembled in huge macromolecular complexes, which are known as phycobilisomes (PBSs). The PBSs are the main light harvesting antenna systems found in cyanobacteria and red algae, which are unique complexes among all photosynthetic organisms that are located on the stromal face of the thylakoid membrane [
2]. The PBS is a macromolecular complex formed by soluble, colored proteins, known as phycobiliproteins (PBPs) and linker polypeptides [
3,
4]. PBPs are the only light-harvesting proteins that covalently bind the chromophores, and based on their spectral properties, they are classified in four types: phycocyanin (PC; λ max absorption = 610–625 nm) [
5], phycoerythrin (PE; λ max = 540–570 nm), phycoerythrocyanin (PEC; λ max = 560–600 nm), and allophycocyanin (APC; λ max = 650–660 nm) [
3,
6,
7]. The PBS can be found in several shapes, from hemidiscoidal and hemielipsoidal to bundle shape. Regardless of their shape, the basic structure of the PBS can be divided into two structural different compartments, consisting of a cylindrical core from which several rods of stacked disks radiate out [
7]. The core is always formed by APC and can contain three to five cylinders [
6]. The number of rods varies greatly from six, usually in cyanobacteria [
4], to 14 in some red algae [
8]. Rods are typically assembled from PC and in some species, PE and PEC are added [
2]. Phycobiliproteins are organized in a trimeric discoidal structure, which is constructed from α/β polypeptide heterodimers [
6]. Typically, two trimeric disks are stacked together to form a hexamer, which is the building block of the PBS [
9]. Linker proteins are colorless polypeptides and are vital for the normal functioning of the PBS complex. Their main roles are to direct the proper assembly of the complex and to modulate energy flow between chromophores [
3,
10,
11]. The unique assembly mode of PBSs allows only the unidirectional energy transfer from higher energy chromophores to lower ones. As a result of this, the energy flows from the rods of PE/PC to the APC core and finally to the photosystem through the L
cm final emitter [
3,
7,
12]. The PBPs have a broad absorption spectrum, narrowing the absorption gap of chlorophyll, and as such, increasing the total energy that can be used in photosynthesis [
4]. Absorption spectra of different PBPs coincide with the excitation spectra, so pigments that absorb at lower wavelengths transfer and concentrate their energy to the pigments with higher wavelengths and low energy. This is possible only if the pigments are at a favorable distance and have the right orientation of the dipole moments [
13].
In
A. platensis, the PBS has a hemidiscoidal shape with a tricylindrical core and six radiating rods. The core is formed by stacked discs of APC, while the rods are formed by PC hexamers [
14]. The number of hexamers on each rod has a high variability, from one to three hexamers, being strongly influenced by the cultivation conditions. In recent years, the PBPs from
A. platensis, especially PC, captured the attention of the energy sector thanks to its use as a photosensitizer in solar cells [
15]. In addition to PC, Mulder et al. used the entire PBS as solar concentrator for a photo voltaic device [
16]. To extend the applicability of the PBPs from
A. platensis as photosensitizers, a better understanding of intra- and inter-molecular energy transfer of both PBPs and the PBS is required. Time-resolved absorption and fluorescence measurements have been employed to investigate the mechanism of energy transfer in PBPs on the femtosecond (fs) to nanosecond (ns) time scale [
17,
18,
19]. Several theories have been proposed for the ultrafast dynamics observed in PBPs, with the most likely involving Förster energy transfer based on the energy resonant interaction of transition dipoles of donor and acceptor molecules, which can be applied for donor–acceptor distances ≥20 Å. For shorter distances, this mechanism was replaced by the exciton interaction, which assumes a strong electronic interaction between the electronic states of two closed-lying chromophores, making them behave as a single super chromophore with electronic states delocalized over both chromophores [
20]. PC and APC have been isolated from various organisms, and the excited state kinetics have been investigated for their specific aggregation states [
21,
22,
23]. PC is usually found in three states, monomeric, trimeric and hexameric, the last one being the most stable [
24]. APC is found in similar assembly states as PC, but with the notable mention that the trimeric state is usually the stable form [
9].
In PC, fluorescence decays in the range of tens of picosecond (ps) were identified and assigned to the energy transfer from short-wavelength sensitizing chromophores to long-wavelength absorbing fluorescing ones [
21]. However, previous results showed that in APC, the α-84 and β-84 chromophores are excitonically coupled, and a short 14 ps time component was assigned to the relaxation from the upper to the lower exciton level [
21]. Energy flow investigations in PBSs have resolved kinetics as fast as a few hundreds of fs along the PC rod subcomplex to the APC core [
25]. The excitation energy transfer (EET) in the PBS extracted from
A. marina was described as a four-step process: (1) the excitonic relaxation between α-84 and β-84 chromophores in approximately 400 fs, followed by (2) excitation energy equilibration of PC and energy transfer to APC in 3 ps, (3) energy transfer from APC to the terminal emitter pigment in 14 ps, and (4) to the photosystem in 100 ps [
26]. More recent studies have focused on the interaction between pigment and proteins and how they modify to adapt to changes in light conditions [
27,
28] or to the type of water medium (e.g., seawater or freshwater) [
29]. It was observed that even if the energy transfer from the PBS to the photosystems was modified depending on the light quality and quantity, the total amount of energy transferred to photosystem I remained constant.
Cyanobacteria can sense the wavelength and energy of the ambient light, process the information, and modulate the PBS construction by changing the size, form, and PBP composition [
30], therefore showing variations of the spectral absorption region and the duration of the energy transfer. With this in mind, we aim to understand the ultrafast excitation energy transfer in the PBS extracted from
A. platensis and in its sub-components PC and APC. We plan to further use this insight for building biomimetic hybrid systems based on PBS/PBPs and metal or semiconductor nanoparticles optimized for solar energy collection and photocurrent amplification. To our knowledge, the energy transfer investigations on light-harvesting antenna from
A. platensis strain AICB 49 have not been performed before in a bottom–up approach, from isolated PBPs to the highly assembled PBS.
2. Materials and Methods
2.1. Biological Material
Arthrospira platensis AICB 49 from the Collection of Algae and Cyanobacteria from the Institute for Biological Research in Cluj-Napoca was used. The cultures were grown in Zarrouk media at room temperature under continuous lighting conditions (50 μE m−2s−1). The growth was checked daily, based on the spectrophotometric measurement (678 nm) of the optical density.
2.2. Phycobilisome Purification
The whole procedure used for PBS purification was carried out at room temperature and was adapted from Ducrett et al. [
31]. Briefly, cells were harvested in late exponential phase by filtration. The harvested cells were resuspended at 0.2 g/mL in 0.9 M potassium phosphate buffer (KPI), pH 7.0, and washed twice with the same buffer by centrifugation. The cells were disrupted by passing them two times through a French pressure cell at 20,000 psi. The resulting homogenate was treated with Triton-X 100, at a concentration of 2% (
v/
v), and incubated for 40 min at room temperature, with continuous stirring. The mixture was centrifuged for 10 min. at 25,000×
g, and the deep blue fraction was collected. The blue fraction was loaded on a sucrose step gradient of 0.2M, 0.4M, 0.6M, 0.8M, 1M, 1.2M, 2M and centrifuged for 16 h at 60,000×
g. After gradient centrifugation, the 1M fraction containing intact PBSs was collected. To remove any impurities, detached PBPs, and PBS aggregates, the samples were dialyzed using SnakeSkin tubing (MWCO 10 kDa) for 1 h at room temperature, against 0.9M potassium phosphate buffer. The dialyzed sample was further passed on a size exclusion column (SEC) packed with Sepharose CL-6B and migrated under gravitational forces. Fractions containing an intact phycobilisome were collected and used for subsequent analysis.
2.3. Phycobiliproteins Purifications
For obtaining high-purity PBPs, pure PBS samples were dialyzed against 50 mM KPI using 10 kDa SnakeSkin tubing. Further, the dialyzed samples were subjected to precipitation with ammonium sulfate: 30% (
w/
v) for phycocyanin and 60% (
w/
v) for allophycocyanin. The precipitated samples were resuspended in 50 mM KPI and dialyzed for 4 h against the same buffer to remove (NH
4)
2SO
4. To improve the purity and homogeneity, the samples were loaded on an SEC column packed with Toyopearl HV 55 and equilibrated with 50 mM KPI. Fractions containing pure phycocyanin and allophycocyanin were collected from the column and used for further analysis. The purity grade of the samples was estimated by the difference between the specific absorbance (620 nm for PC and 652 nm for APC) and the total protein absorbance at 280 nm. Each PBP was quantified spectrophotometrically based on the equations of Bennett and Bogorad [
32]:
| Concentration | Purity |
| PC (mg/mL) = [A615 − 0.474*(A652)]/5.34 | PC = A620/A280 |
| APC (mg/mL) = [A652 − 0.208*(A615)]/5.09 | APC = A650/A280 |
2.4. Electron Microscopy
Phycobilisome samples, 5 μL with a concentration of 0.2 mg/mL, were applied to an Electron Microscopy (EM) copper grid covered with continuous carbon film. After 30 s, the excess sample was blotted, and the grid was washed on 3 consecutive droplets of KPI buffer. The residual material on the grid was fixed for 5 min with 0.5% glutaraldehyde, after which the sample was washed 3 times on ultrapure water droplets. The excess water was blotted, and the sample was negatively stained with 2% uranyl acetate. Samples were examined with a HD-2700 scanning transmission electron microscope, operated at 200 kV.
To highlight the PBS compartments, we performed 2D reference-free class averaging in RELION 3.1 package [
33]. PBS particles were manually picked and extracted in 600 A boxes using the same software. A contrast transfer function (CTF) was estimated and corrected using CTFFIND4 [
34].
2.5. Steady-State Absorption and Fluorescence Spectra
The UV–VIS absorption spectra were recorded on a double-beam Jasco V550UV–VIS spectrophotometer in the 400–750 nm wavelengths range with a 2 nm resolution, using 1 mm length quartz cells. Baseline corrections were run successively in air and phosphate buffer saline. Fluorescence emission and excitation spectra were measured using a Jasco FP-6500 spectrofluorimeter, equipped with a Xe lamp of 150 W, 1800 lines/mm monochromator and 1 nm spectral resolution.
2.6. Time-Resolved Spectroscopy
The samples were pumped with 580 nm femtosecond (fs) pulses obtained using an optical parametric amplifier (Orpheus, Light Conversion) from the 1030 nm pulse emitted by an Yb:KGW laser (Pharos, Light Conversion) of 170 fs laser pulse duration and 80 kHz repetition frequency. For the transient absorption (TA) experiments (Harpia, Light Conversion), a supercontinuum probe pulse was obtained by focusing 10% of the 1030 nm pulse in a sapphire crystal. The generated white light (WL) extends from 480 to 780 nm. After traveling through an optical delay line, the WL transmitted through the sample is detected using a spectrograph with 300 L/mm grating combined with an array detector. Absorption changes (differential absorption) are measured as the difference in optical density between the pumped and unpumped sample. The polarization between the pump and probe pulses was set at the 54.7° magic angle. The samples were measured in the same quartz cuvettes of 1 mm optical path length that were used for recording the UV-VIS absorption spectra. The fluorescence kinetics was investigated using the time-correlated single photon counting (TCSPC) setup (Chimera, Light Conversion). The samples were excited with vertically polarized light, and the fluorescence emission was collected through a long-pass filter suitable for each sample emission and an emission polarizer set at the magic angle (54.7° relative to the polarization of the pump pulse). The fluorescence signal was focused on the entrance slit of a double monochromator and detected using a single photon sensitive photomultiplier (Becker&Hickl PMC-100-1 standard). The FWHM of the instrument response function (IRF) was 340 ps. For the TCSPC experiments, the average power of the pump beam was 2 mW, while for the TA experiments, laser pulses of 3–4 mW were used.
2.7. Data Analysis
The pre-processing of the TA data included removal of the pump spectral range and correcting the WL dispersion. The data were calibrated using a holmium oxide filter. The analysis of the samples kinetics was performed in CarpetView software (Light Conversion) by applying global analysis. Briefly, the global analysis assumes a scheme of discreet compartments that are connected by linear rate kinetics. The excitation pulse will populate one or more compartments, and the population will flow between the compartments, according to the selected connectivity scheme. The time-dependent populations of the compartments,
ci (
t), are described as follows:
where
I(
t) is the excitation pulse and
is the characteristic decay time of the
ith compartment. When a sequential model is applied, each time-dependent population will be assigned a spectrum known as evolution-associated fluorescence spectrum (EAFS) in the case of time-resolved fluorescence data and evolution-associated difference spectrum (EADS) in the case of transient absorption data, which will represent the different evolutionary steps in the spectral evolution. In general, EADS represent mixtures of coexisting molecular states, but provide information about the spectral dynamics and time evolution of the system. In the ideal case, the EADS represent the true species associated spectra of the real photochemical species.
Additionally, the TCSPC data were investigated using the EasyTau 2 software (PicoQuant) using a multi-exponential reconvolution method. This type of analysis performs a convolution of the kinetic decays obtained at each of the probed emission wavelengths with the measured instrumental response function. The IRF was measured separately for each pump wavelength.
3. Results
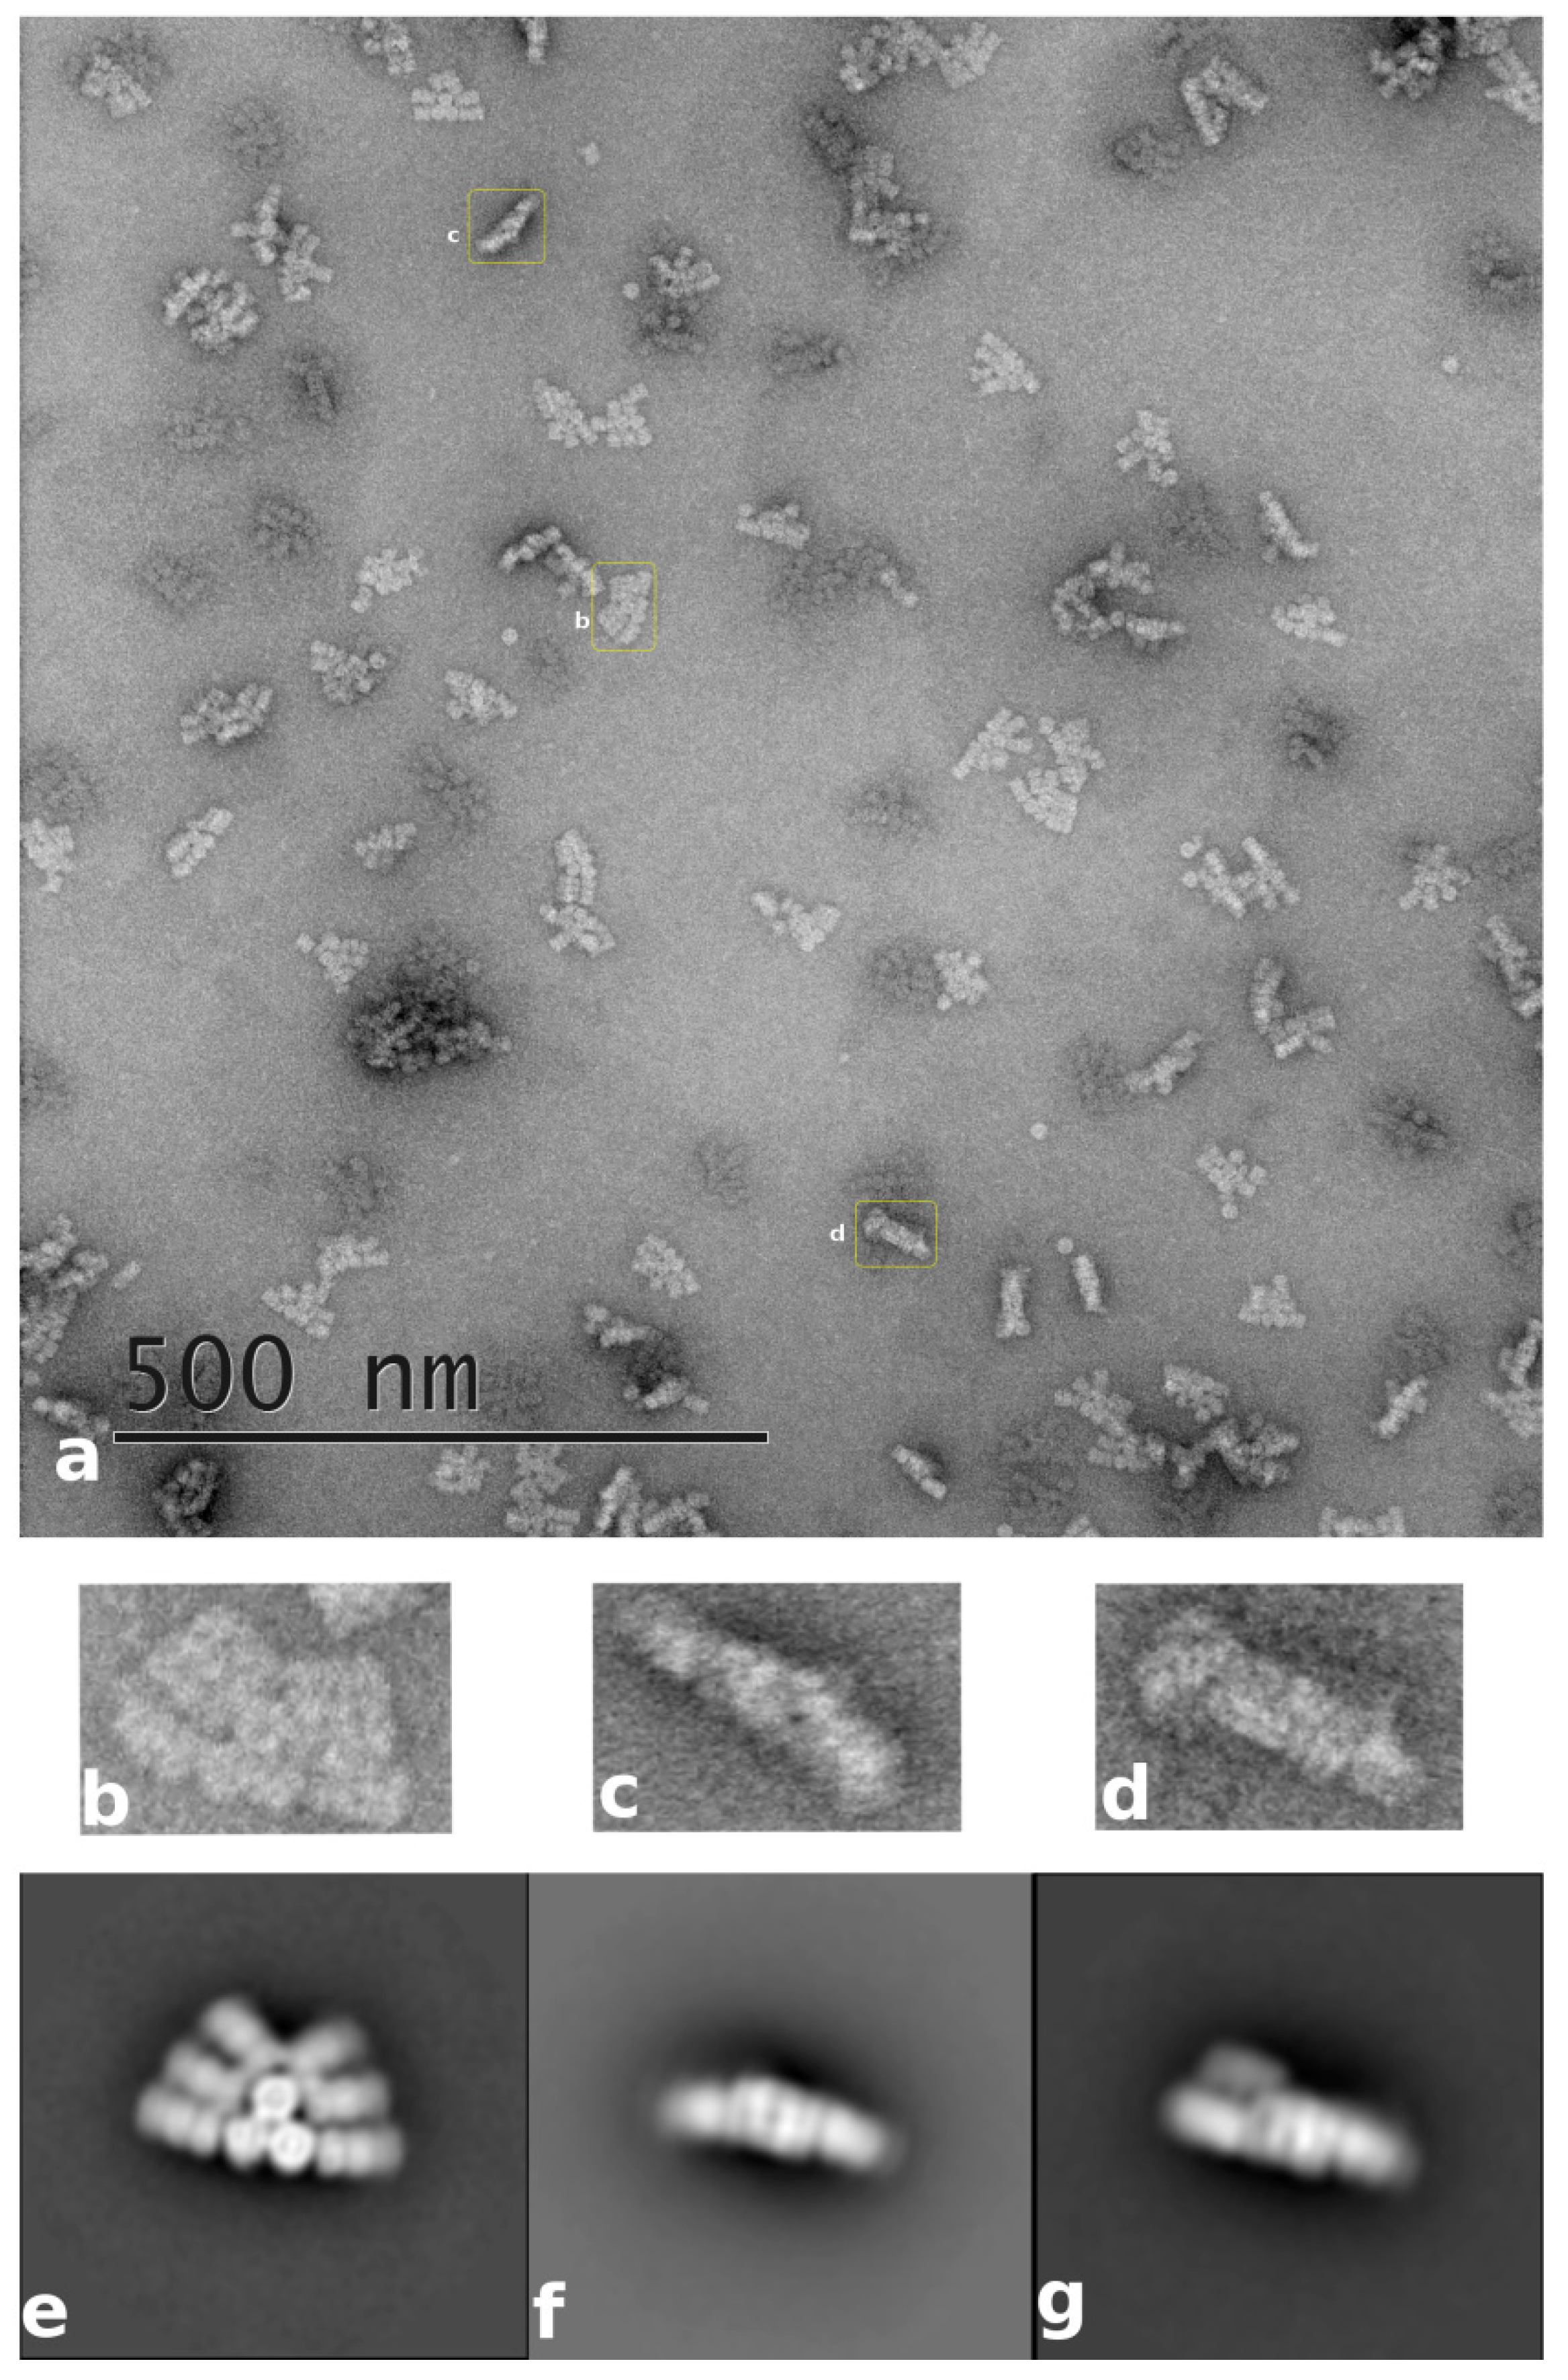
PBPs purity was evaluated for each fraction extracted from the chromatography column. Only fractions presenting a purity grade of at least 4, for each of the two PBPs, were considered suitable for further analysis. Prior to the spectroscopic analysis, the concentration of both PC and APC was adjusted to 3 mg/mL. Negative staining electron microscopy was used to study the purity characteristics and morphology of the PBS. The micrographs obtained showed a homogeneous structure with a high purity degree. From a morphological perspective, we found that the A. platensis PBS has a hemidiscoidal shape with two structural compartments, a tricylindrical core, and six rods. Reference-free 2D class averaging were generated from 6200 particles manually picked. This showed that the cylinder core is formed by four trimeric discs of allophycocyanin, while each rod is assembled from three PC hexamers (
Figure 1). In addition, we noticed a high preferential orientation of PBS particles (side view). As a consequence, we only obtained 5 different views of the PBS, from which only three were good enough to be representative (
Figure 1).
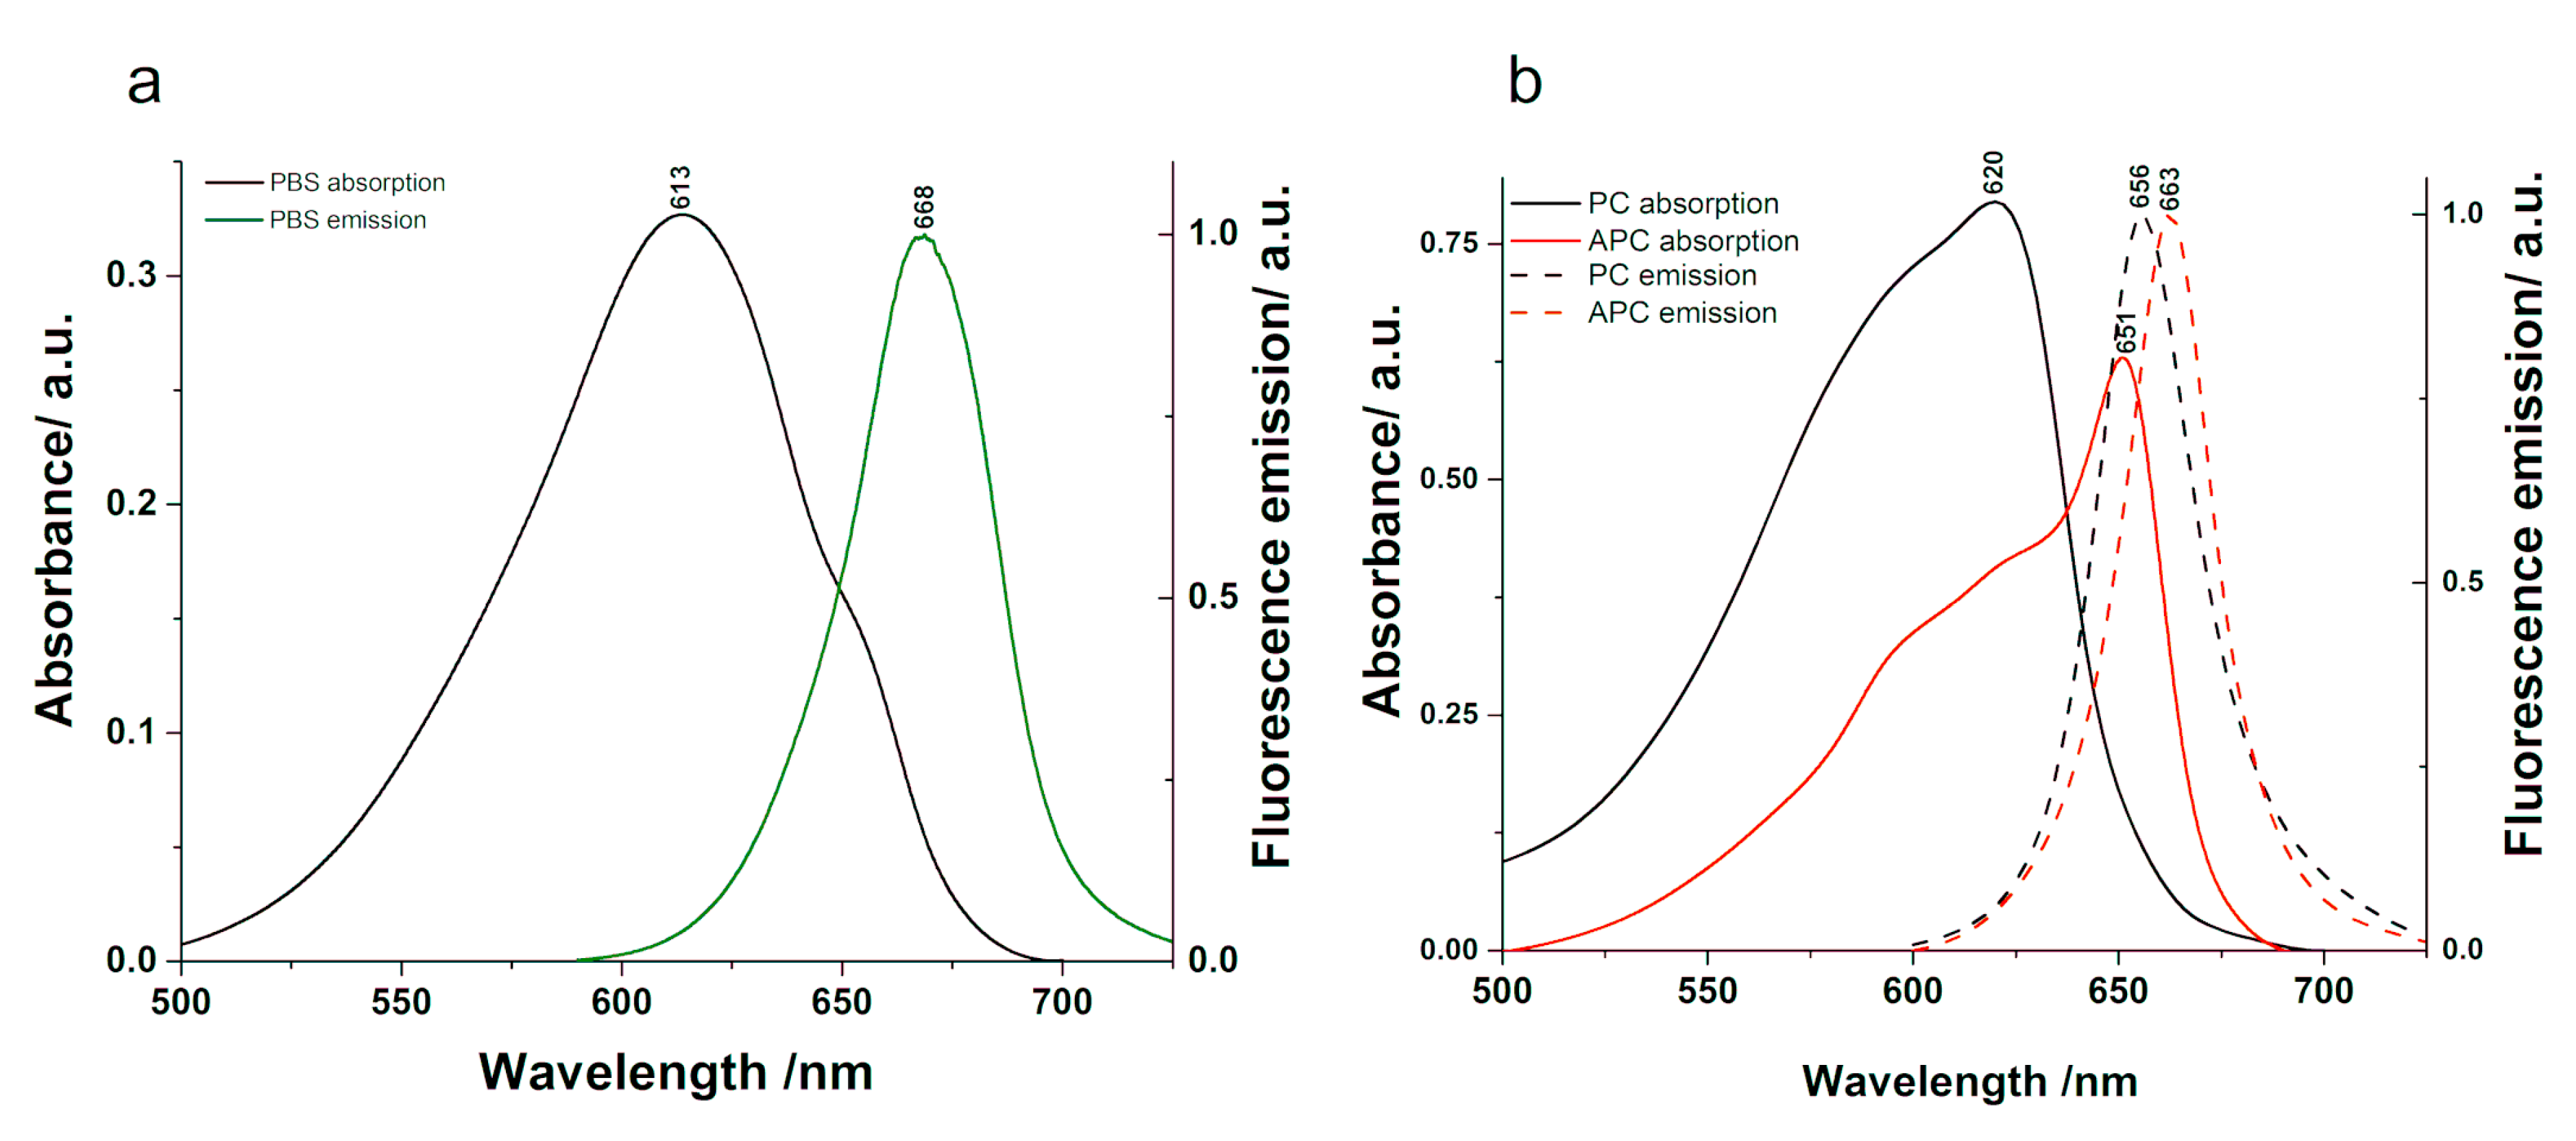
We investigated the steady-state optical properties of the PBS and its subcomponents, PC and APC. The spectra characteristic to the absorption and fluorescence emission excited at 580 nm are presented in
Figure 2. The absorption spectra exhibit broad spectral widths, which reflect the quantity of various chromophores absorbing the incoming radiation. However, the fluorescence emission spectra show narrower spectral widths due to the fluorescence emission originating only from a fraction of the existent chromophores. The absorption maximum of the PBS is located at 613 nm with a clear shoulder at 657 nm, and its emission maximum is observed at 668 nm. PC presents an absorption maximum at 620 nm and a maximum of fluorescence emission at 656 nm, while APC has an absorption maximum at 651 nm with a plateau at 620 nm and emits fluorescence at 663 nm. In order to investigate the absorbance details in the PBPs and PBS, we calculated the second derivative of their absorption spectra (see
Supplementary Material Figure S1). The second derivative of the PC absorption allowed us to observe the fine details of the spectrum. A minimum identified at 628 nm may be characteristic to the absorption of the fluorescing chromophores in the β-subunit, while another at 594 nm was assigned to the sensitizing chromophores in the same subunit according to Mimuro et al. [
35]. This assignment is derived from the model that involves sensitizing chromophores, which absorb and then transfer the excitation energy to the fluorescing chromophores, which emit the radiation. The second derivative of APC shows a minimum at 652 nm and two smaller bands located at 620 and 593 nm. Based on previous studies [
36], the low-energy α chromophores in APC trimers absorb radiation at 630 nm and 653 nm, while the higher energy β chromophores absorb at 575 nm and 620 nm; therefore, the 620 nm minimum could indicate the absorbance of the higher energy chromophores, while the one at 652 nm could indicate the absorbance of the lower energy chromophores. The PBS absorption spectrum presents a minimum at 656 nm close to the absorption maximum of APC and smaller minima at 634, 618, and 608 nm.
3.1. Ultrafast Dynamics in Phycocyanin
3.1.1. Time-Resolved Fluorescence
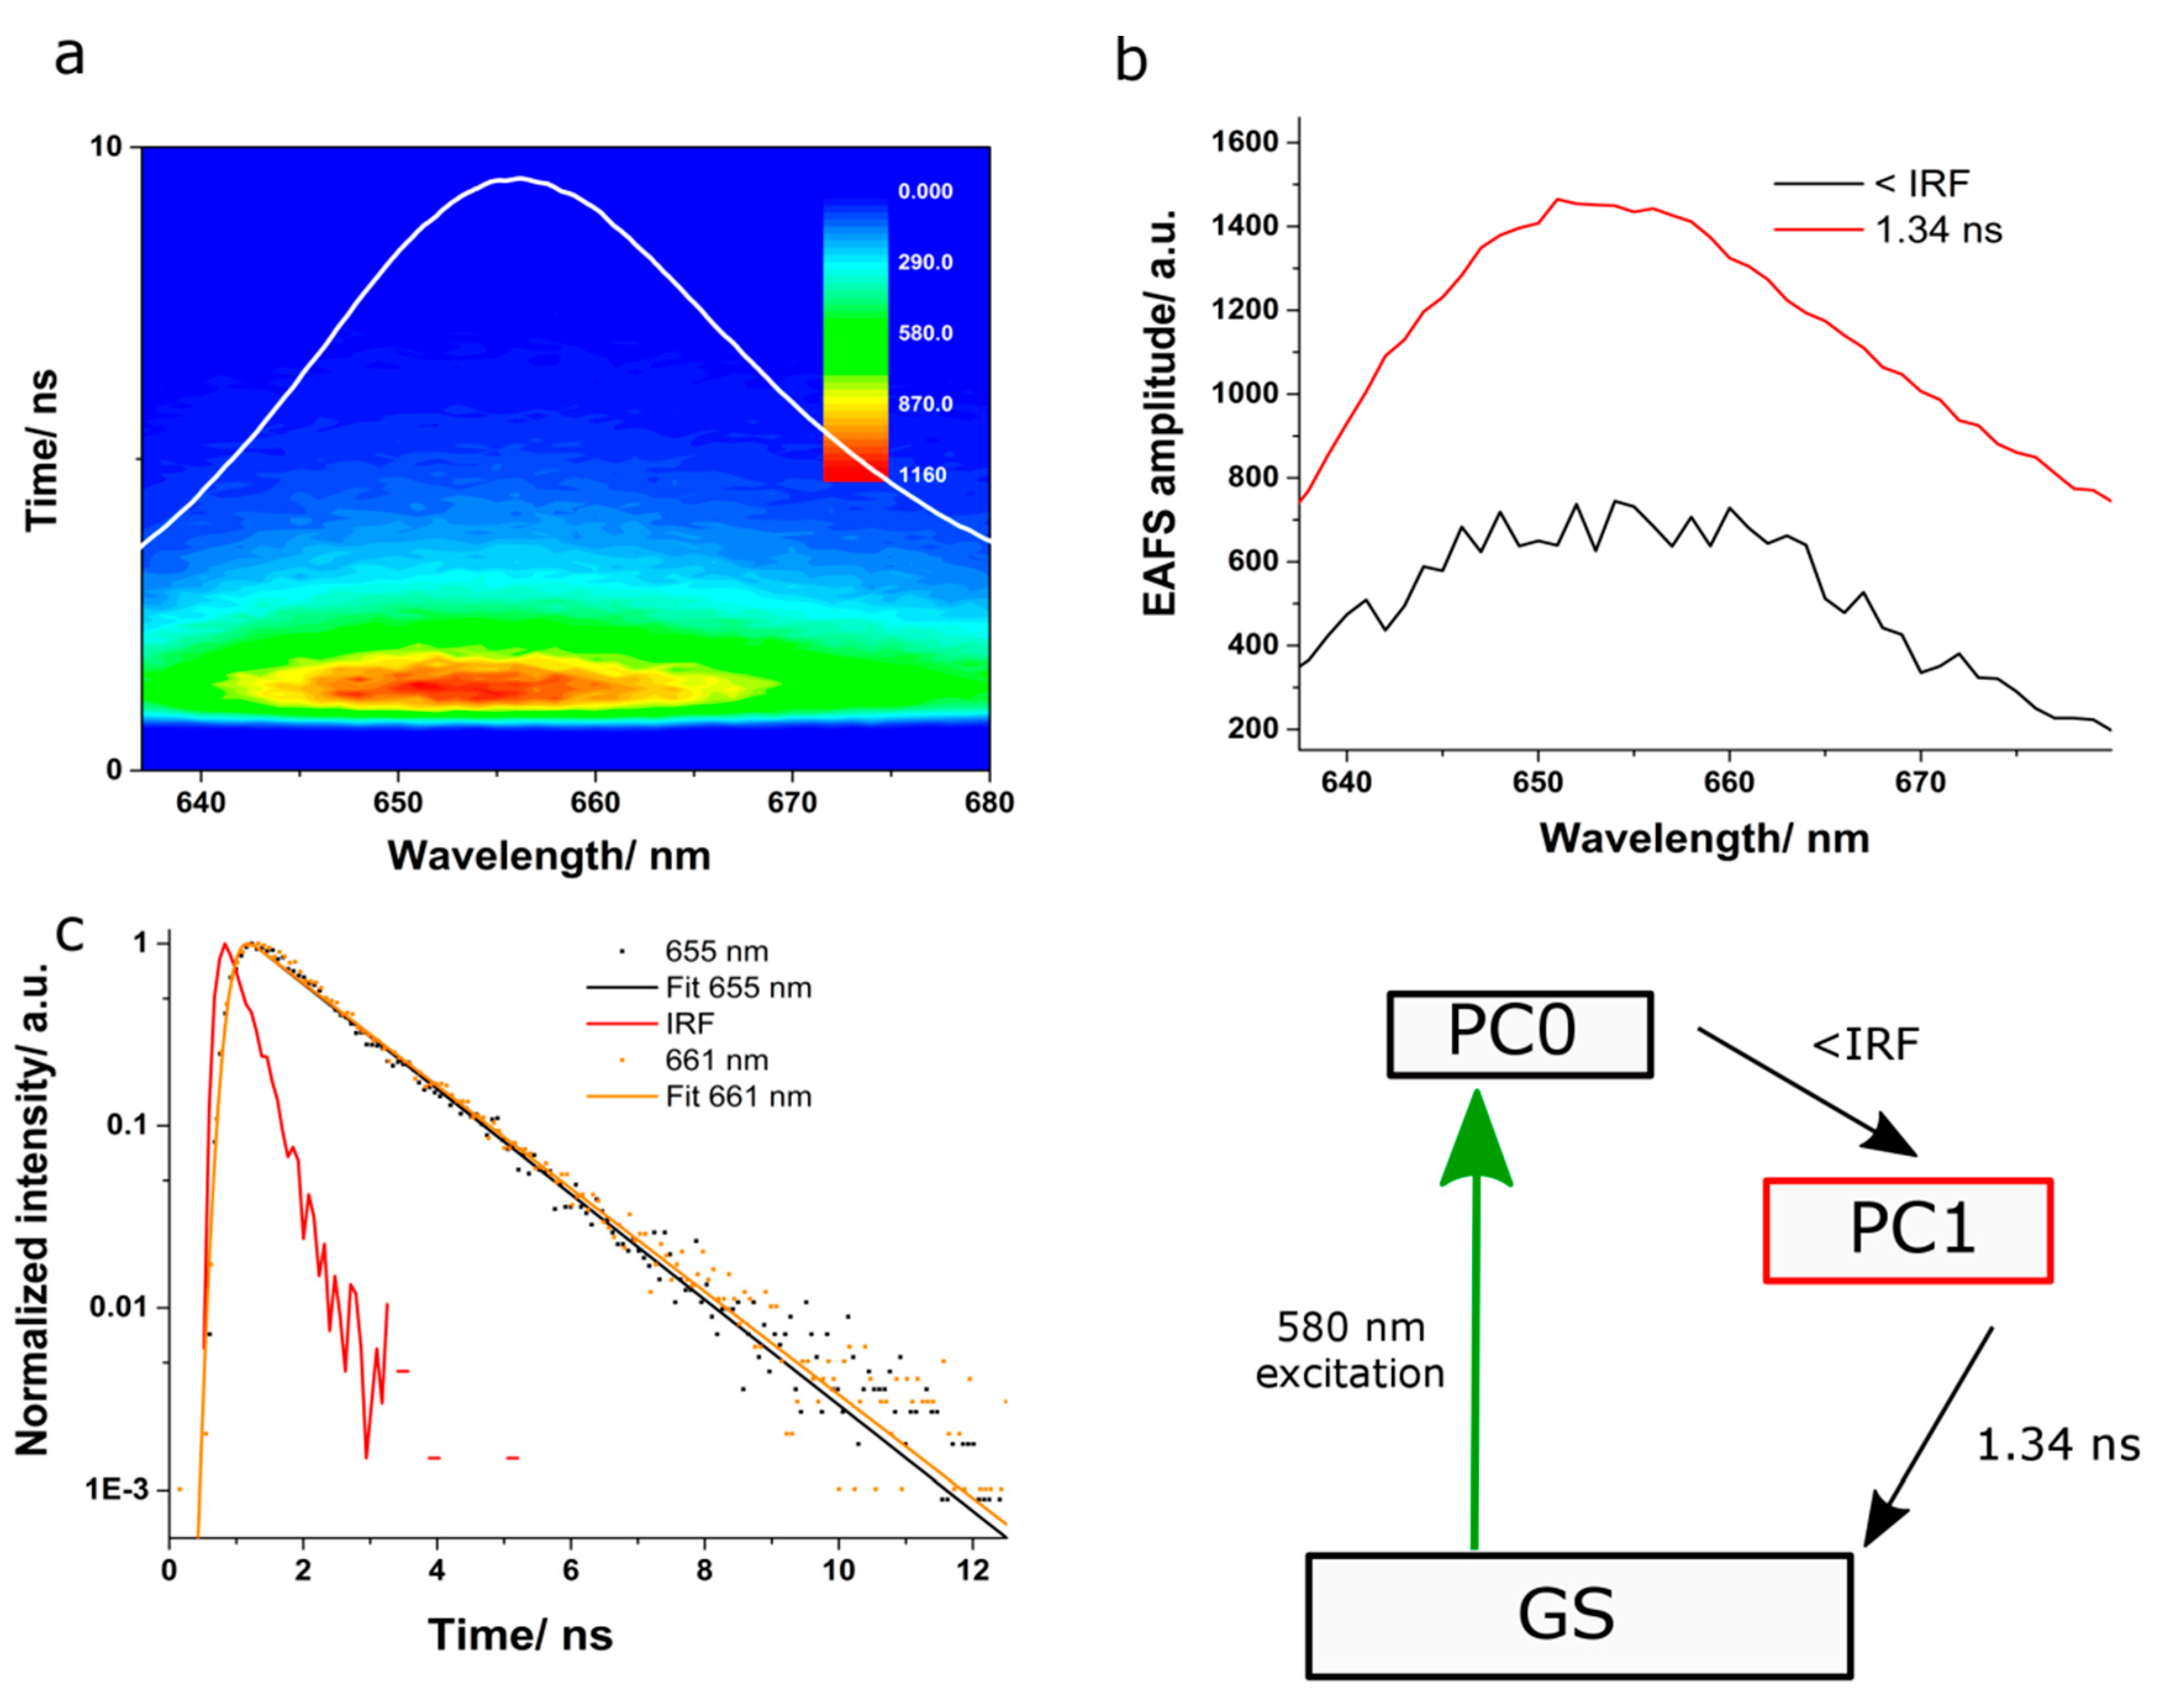
The fluorescence kinetics of PC was studied by exciting the sample at 580 nm, and the emission was monitored over the spectral region 640 to 680 nm. The spectra showed a fluorescence maximum around 650 nm. We probed several exponential reconvolution models and found out that a satisfactorily fit was obtained with a bi-exponential decay model with one component at 1.34 ns and one in the time scale of our IRF (
Figure 3). The resulted EAFS were similar to the fluorescence spectrum of PC, with maxima around 650 nm. The EAFS associated to the long component exhibited higher amplitude and a broader spectrum, indicating higher fluorescence yield. We assign the longer kinetic component of 1.34 ns to the fluorescence lifetime of the terminal emitting chromophores in PC. However, the lifetime of the shorter kinetic component was limited by the temporal resolution of our system.
3.1.2. Transient Absorption
Time-resolved absorption spectroscopy was further employed to investigate the ultrafast dynamics in PC.
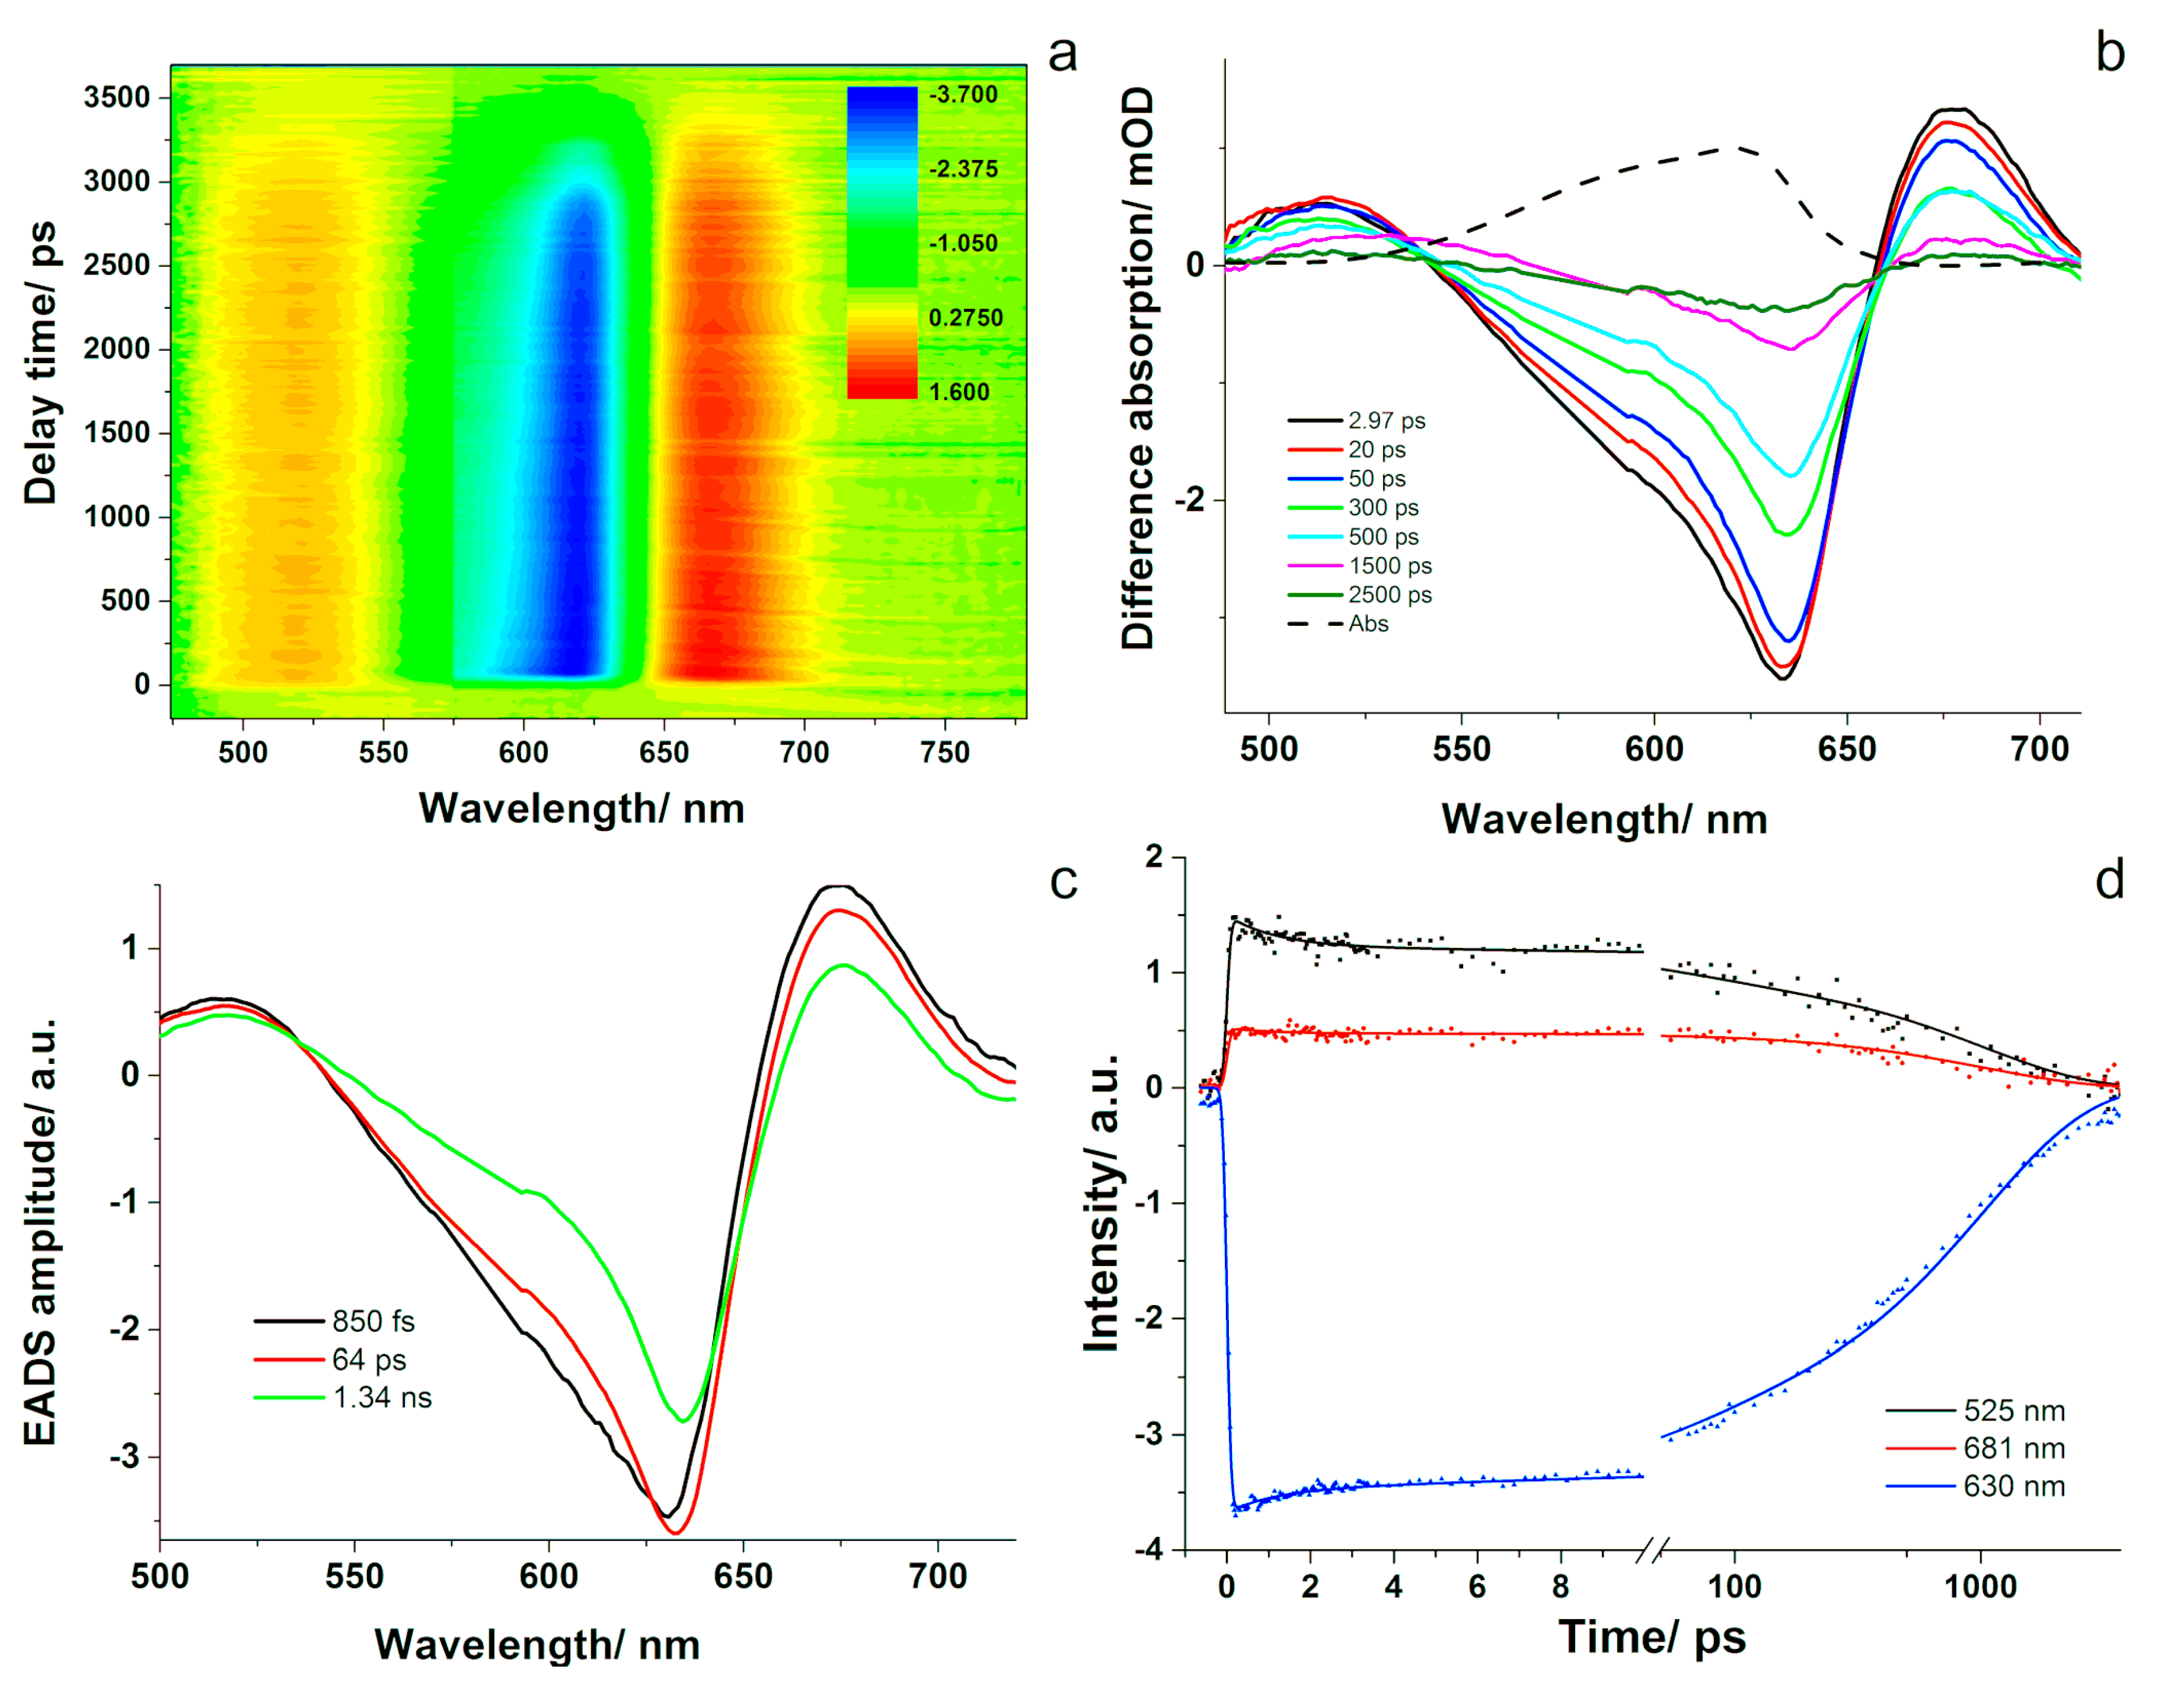
Figure 4a depicts the difference absorption signal as a function of the probed wavelength and time delay between pump and probe pulses. Bleaching of the ground state occurred immediately after excitation, as well as positive absorption changes at the wings of the absorption band (
Figure 4b). The bleaching signal recovered with increasing the delay between pump and probe pulses and showed a red-shift of a few nm as the ground state was repopulated. This effect was observed in the 570–660 nm spectral region and the kinetic curves decayed toward zero on a rather long time scale. In the 500–530 and 660–710 nm spectral ranges, positive absorption changes were observed on both sides of the bleaching band. Both of them decayed on a similar time scale as the bleaching band.
The data were evaluated using global analysis and a sequential decay model with three compartments. Thus, the three-dimensional surface data was decomposed into three simple time-dependencies of compartment populations and three evolution-associated difference spectra assigned to each compartment (
Figure 4c). We obtained an ultra-short decay component of around 1 ps, a middle component of 64 ps, and a long one that was kept constant at the value obtained from the TCSPC experiment of 1.34 ns. The EADS allow visualizing the amplitude evolution as a function of wavelength, as well as the spectral dynamics of the excited states of PC. The spectra associated to the different evolutionary steps looked similar to one another, differing only in their amplitude and presenting a small red-shift of 4 nm from the fastest decay to the longest one. The first associated spectrum presented a minimum at 630 nm, which corresponds well with the 629 nm band assigned to PC resolved in the absorption spectrum of the phycobiliproteins from A. marina [
37], as well as the band resolved in the second-derivative absorption spectrum of PC presented in
Figure S1 that is assigned to the ground state bleach of PC. The two positive bands located around 571 and 675 nm correspond to excited state absorption, while the negative band at longer wavelengths could indicate stimulated emission. We assume that the ultrafast 850 fs component represents energy transfer between the α-84 and β-84 chromophores. A similar value (of approximately 500 fs) was reported for PC isolated from Mastigocladus laminosus and A. marina, respectively, using time-resolved absorption [
38,
39]. The ground state bleaching observed in the second and third EADS shifted to 632 and 634 nm, respectively, and it can be assigned to spectrally different forms of β-84 chromophores. This suggests that the excitation energy is transferred among spectrally different forms of the β-84 chromophores in 64 ps, which relax afterwards back to the ground state in 1.34 ns.
3.2. Ultrafast Dynamics in Allophycocyanin
3.2.1. Time-Resolved Fluorescence
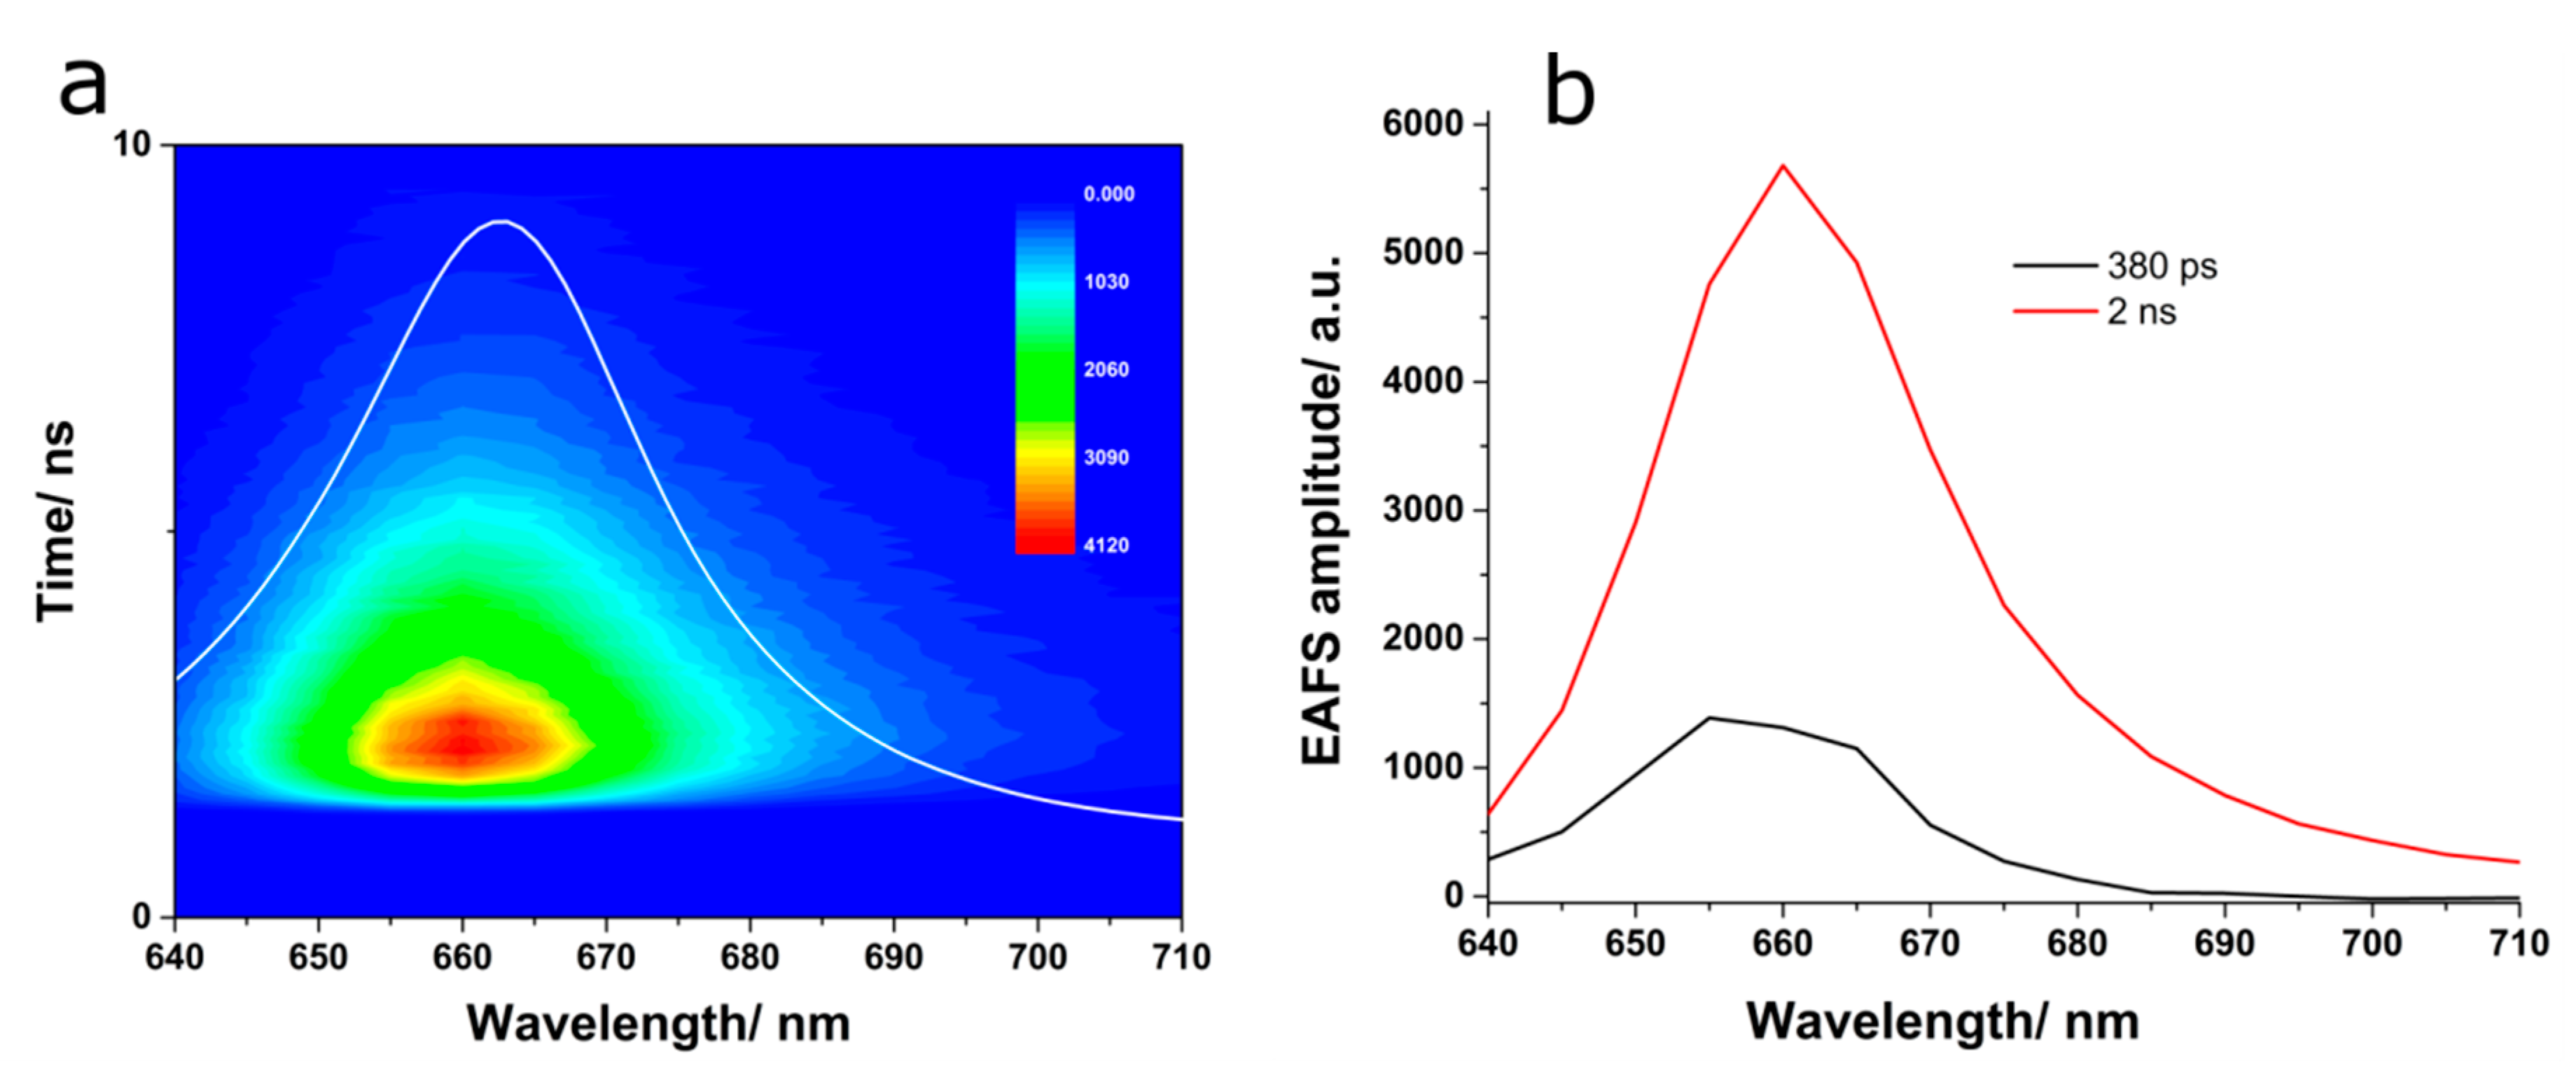
The fluorescence kinetics of APC excited at 580 nm was monitored over the spectral region extending from 640 to 710 nm, and the data are displayed in
Figure 5a. Global analysis was applied to investigate the fluorescence kinetics of APC using a sequential model and two compartments. In order to obtain a satisfactory fitting, two spectro-kinetic components were needed. The values of the time components were 380 ps and 2 ns. The EAFS connected to the first compartment showed a maximum at 655 nm, while the one characteristic to the second compartment presented a maximum at 660 nm, which was similar to the steady-state emission spectrum of APC (
Figure 5b). Additionally, the short EAFS presented a sudden decrease at emission wavelengths longer than 665 nm. The presence of the faster kinetic component showing a fluorescence maximum shifted to shorter wavelengths may indicate the emission from spectrally different chromophores that transfer their energy to the terminal emitter in APC right after the excitation. The long component obtained here represents the fluorescence lifetime of the final emitting chromophores in APC. Since the value of the short component is in the time range of our IRF, this kinetic component could be limited by the temporal resolution of our detection system and not represent the true decay time associated to the energy transfer among the chromophores in APC. To understand the origin of this component, we performed transient absorption experiments, as presented in the next section.
3.2.2. Transient Absorption
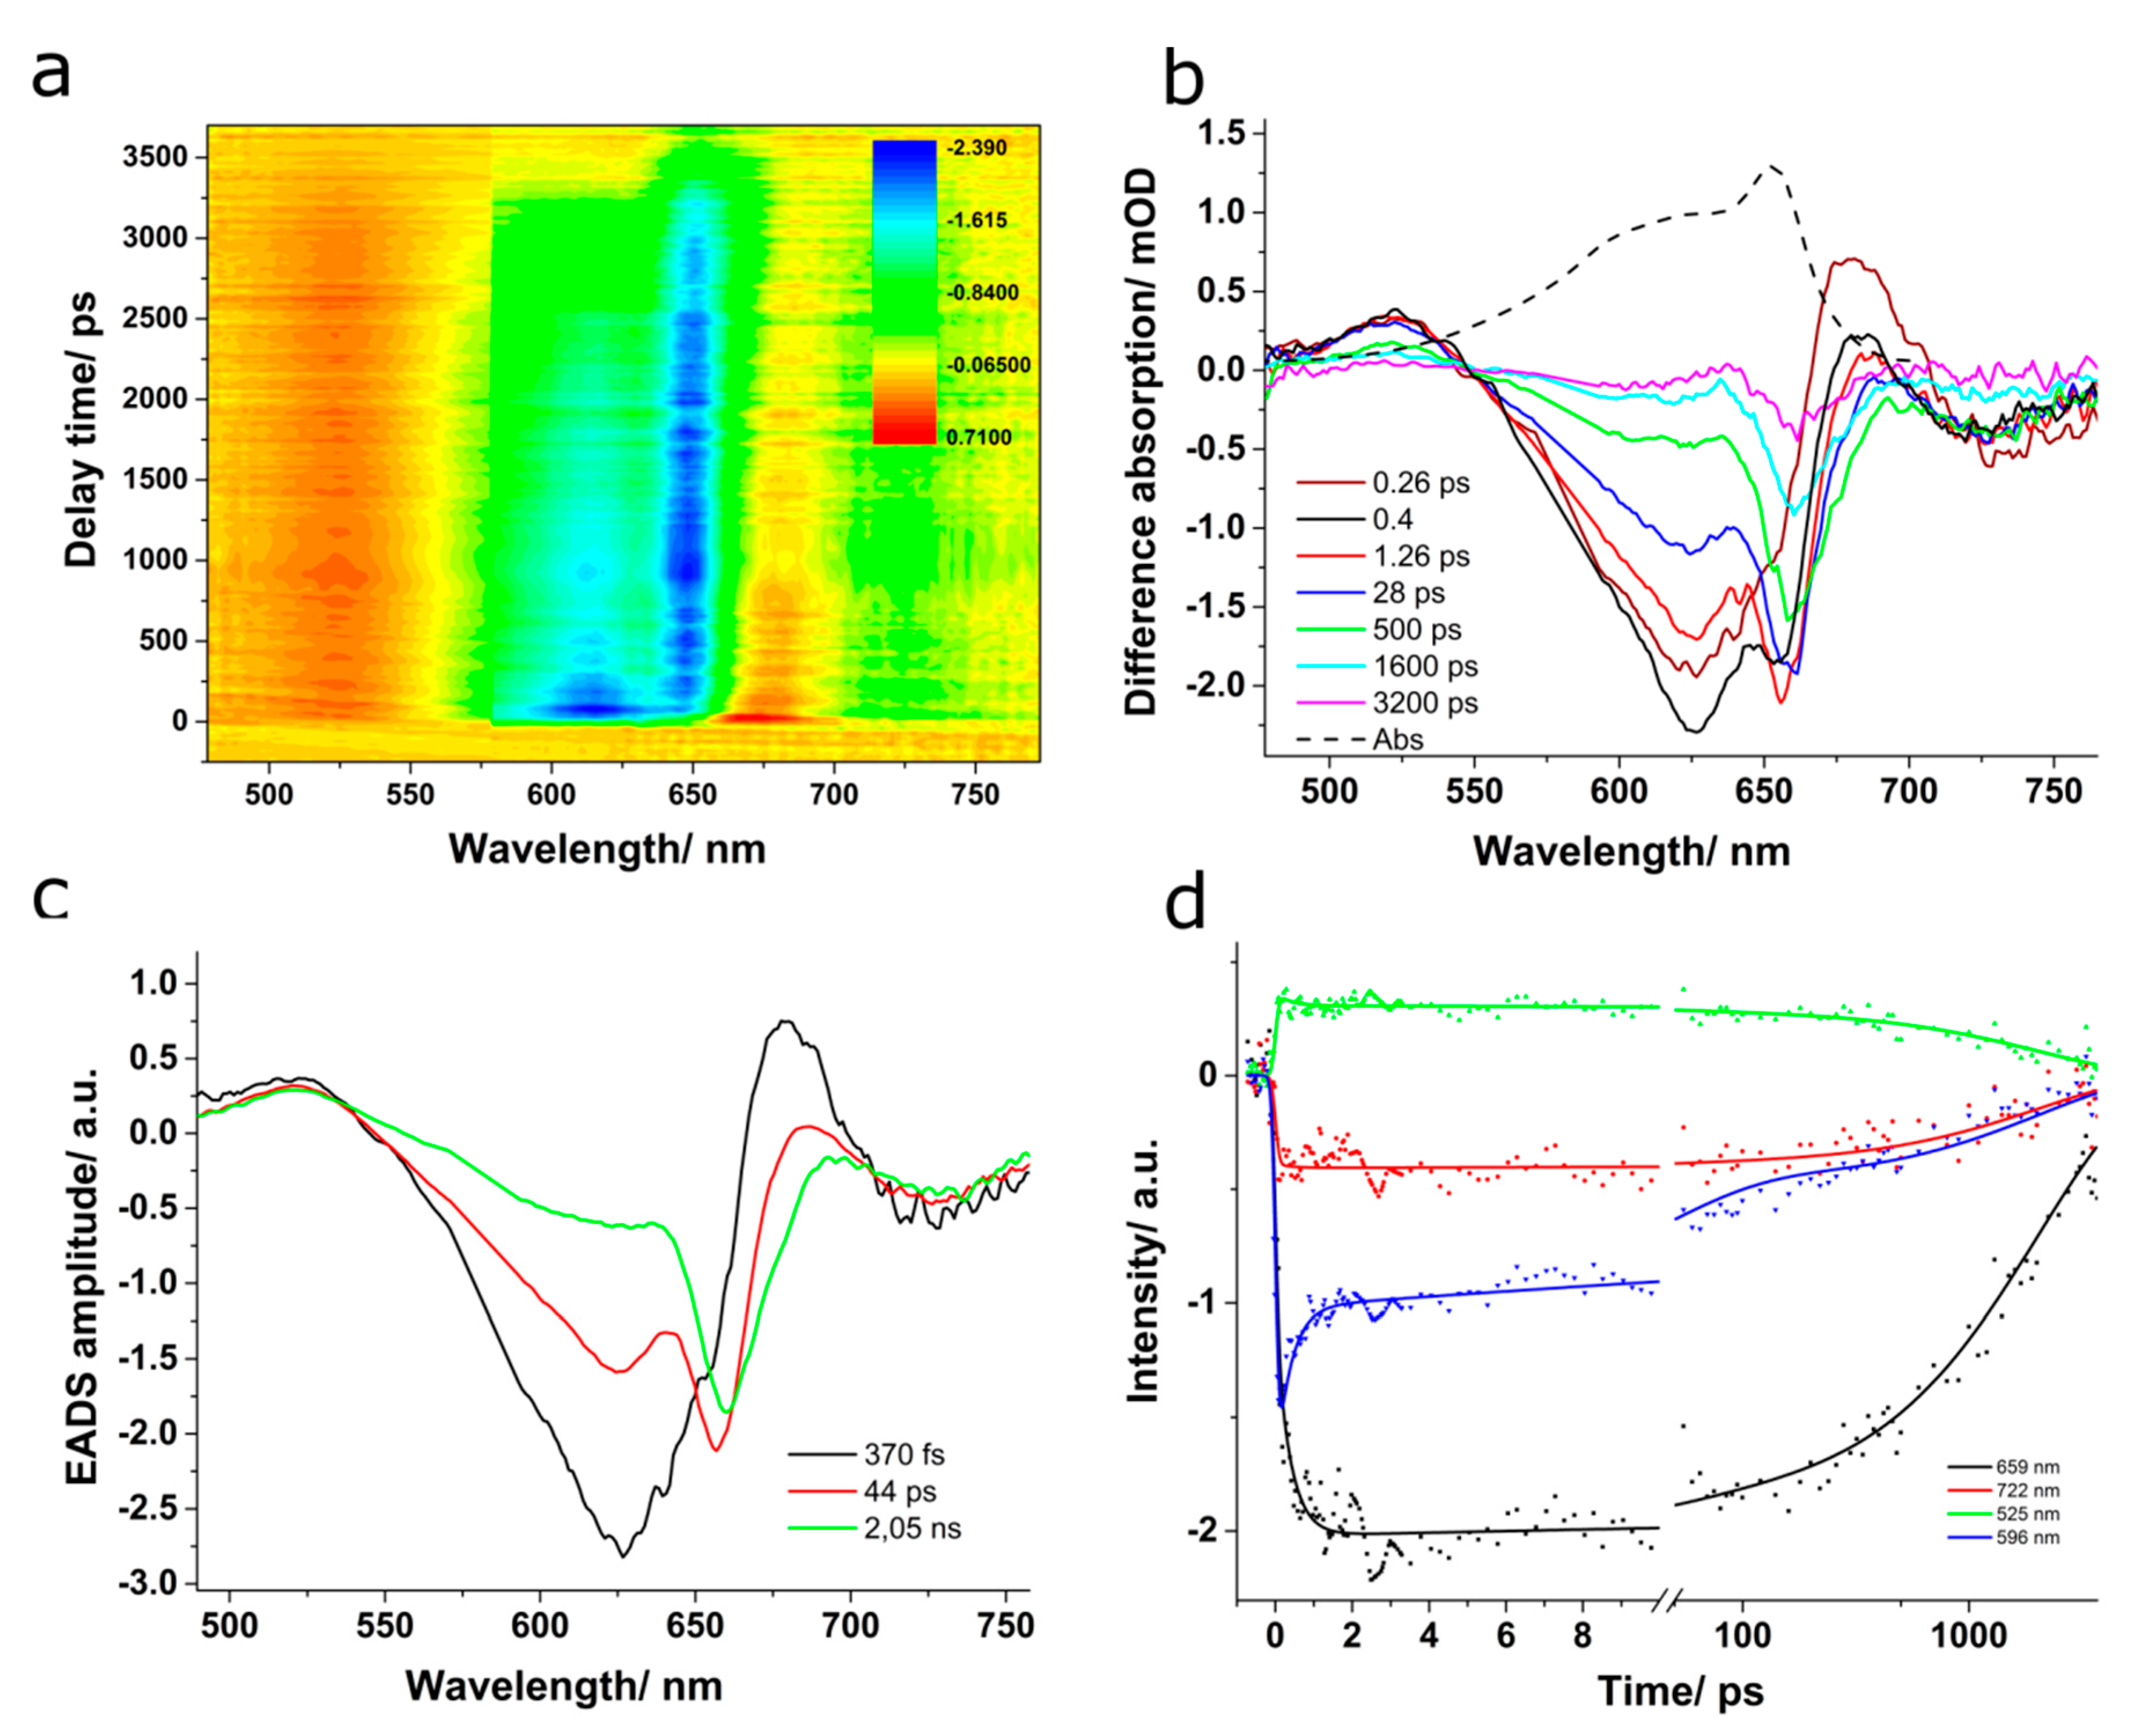
The TA results obtained using 580 nm pump pulses are given in the
Figure 6 panel (a), showing the differential absorption signal as a function of the probed wavelength and delay time between pump and probe pulses. The blue regions are negative values normally associated with ground state bleaching, while the red ones are positive values typically assigned to excited states absorption. Representative TA spectra are shown in panel (b). At 260 fs after excitation, an immediate bleaching around 620 nm and two positive absorption bands in the 480–540 nm and 670–700 nm spectral regions were observed, as well as a stimulated emission negative band in the 700–760 nm region. At 400 fs following excitation, a second bleaching appeared around 655 nm that slowly shifted to longer wavelengths with increasing the delay time. The bleaching around 620 nm showed a rapid recovery in a few hundreds of fs followed by a slow, long recovery. The 650 nm bleaching, one the other hand, presented slower recovery, similar to the kinetics of the 480–540 nm and the 700–760 nm bands. The induced absorption in the 670–700 nm spectral region observed immediately after excitation persisted until 1–2 ps; then, it decreased and became negative (2–150 ps) and subsequently increased again approaching the zero line.
The TA data were investigated with global analysis using three compartments and a sequential transfer model, and the results are presented in
Figure 6c,d. The sequential model should mimic well the excitation transfer inside the APC trimer, and the results obtained here indicated the presence of both fast and slow EET processes. The kinetic components describing the kinetics of APC trimer had values of 370 fs, 44 ps, and 2 ns. Examples of kinetic traces recorded at various wavelengths with their fitted curves are given in
Figure 6d.
The fastest process identified in our TA experiment took place on a time scale of a few hundreds of fs (<500 fs) and showed an associated EADS with a minimum at 626 nm, two maxima at 677 and 522 nm, and another minimum at longer wavelengths, centered around 724 nm. At 620 nm, the absorption spectrum of APC presented a shoulder, which was considerably discussed upon in previous studies [
36,
40] and attributed to the absorption of the higher energy chromophores (see
Supplementary Material Figure S2). Therefore, the minimum observed in the associated evolutionary difference spectrum can be assigned to the ground-state bleaching of the high-energy chromophores in APC. This suggests that immediately after the ultrashort laser excitation, we observed the localization of the excitation energy on one of the two phycocyanobilin (PCB) chromophores within approximately 400 fs. The 44 ps component showed an associated spectrum with two minima at 625 and 656 nm, where the high energy, respectively the low-energy PCB chromophores absorb. Therefore, this component should reflect the energy transfer between pairs of low and high-energy PCB chromophores. Finally, the 2 ns EADS component exhibited a minimum at 660 nm, which was red-shifted from the previous EADS by a few nm. Additionally, a slower recovery was observed on the red side of the minimum and a broad shoulder around 615 nm. Given the minimum at 660 nm, which we believe reflects the stimulated emission of APC chromophores and the comparable value to the fluorescence lifetime identified using TCSPC, we assigned this kinetic component to the radiative and non-radiative relaxation of the system back to the ground state.
Similar ultrafast dynamics were observed when APC was excited using 600 nm laser pulses (not shown here). A noticeable difference was that both bleaching bands, the 620 nm and 650 nm, were observed immediately after the excitation pulse. With increasing the time delay, the 620 nm blue-shifted to 609 nm, while the 650 nm red-shifted to 665 nm and presented a broadening on the red side of the band. The obtained kinetic components were comparable to the 580 nm pump pulse case, with a slight increase to 450 fs observed for the ultrafast kinetic component and a small decrease of the third decay time to 1800 ps.
3.3. Excitation Energy Transfer in the Phycobilisome Antenna
3.3.1. Time-Resolved Fluorescence
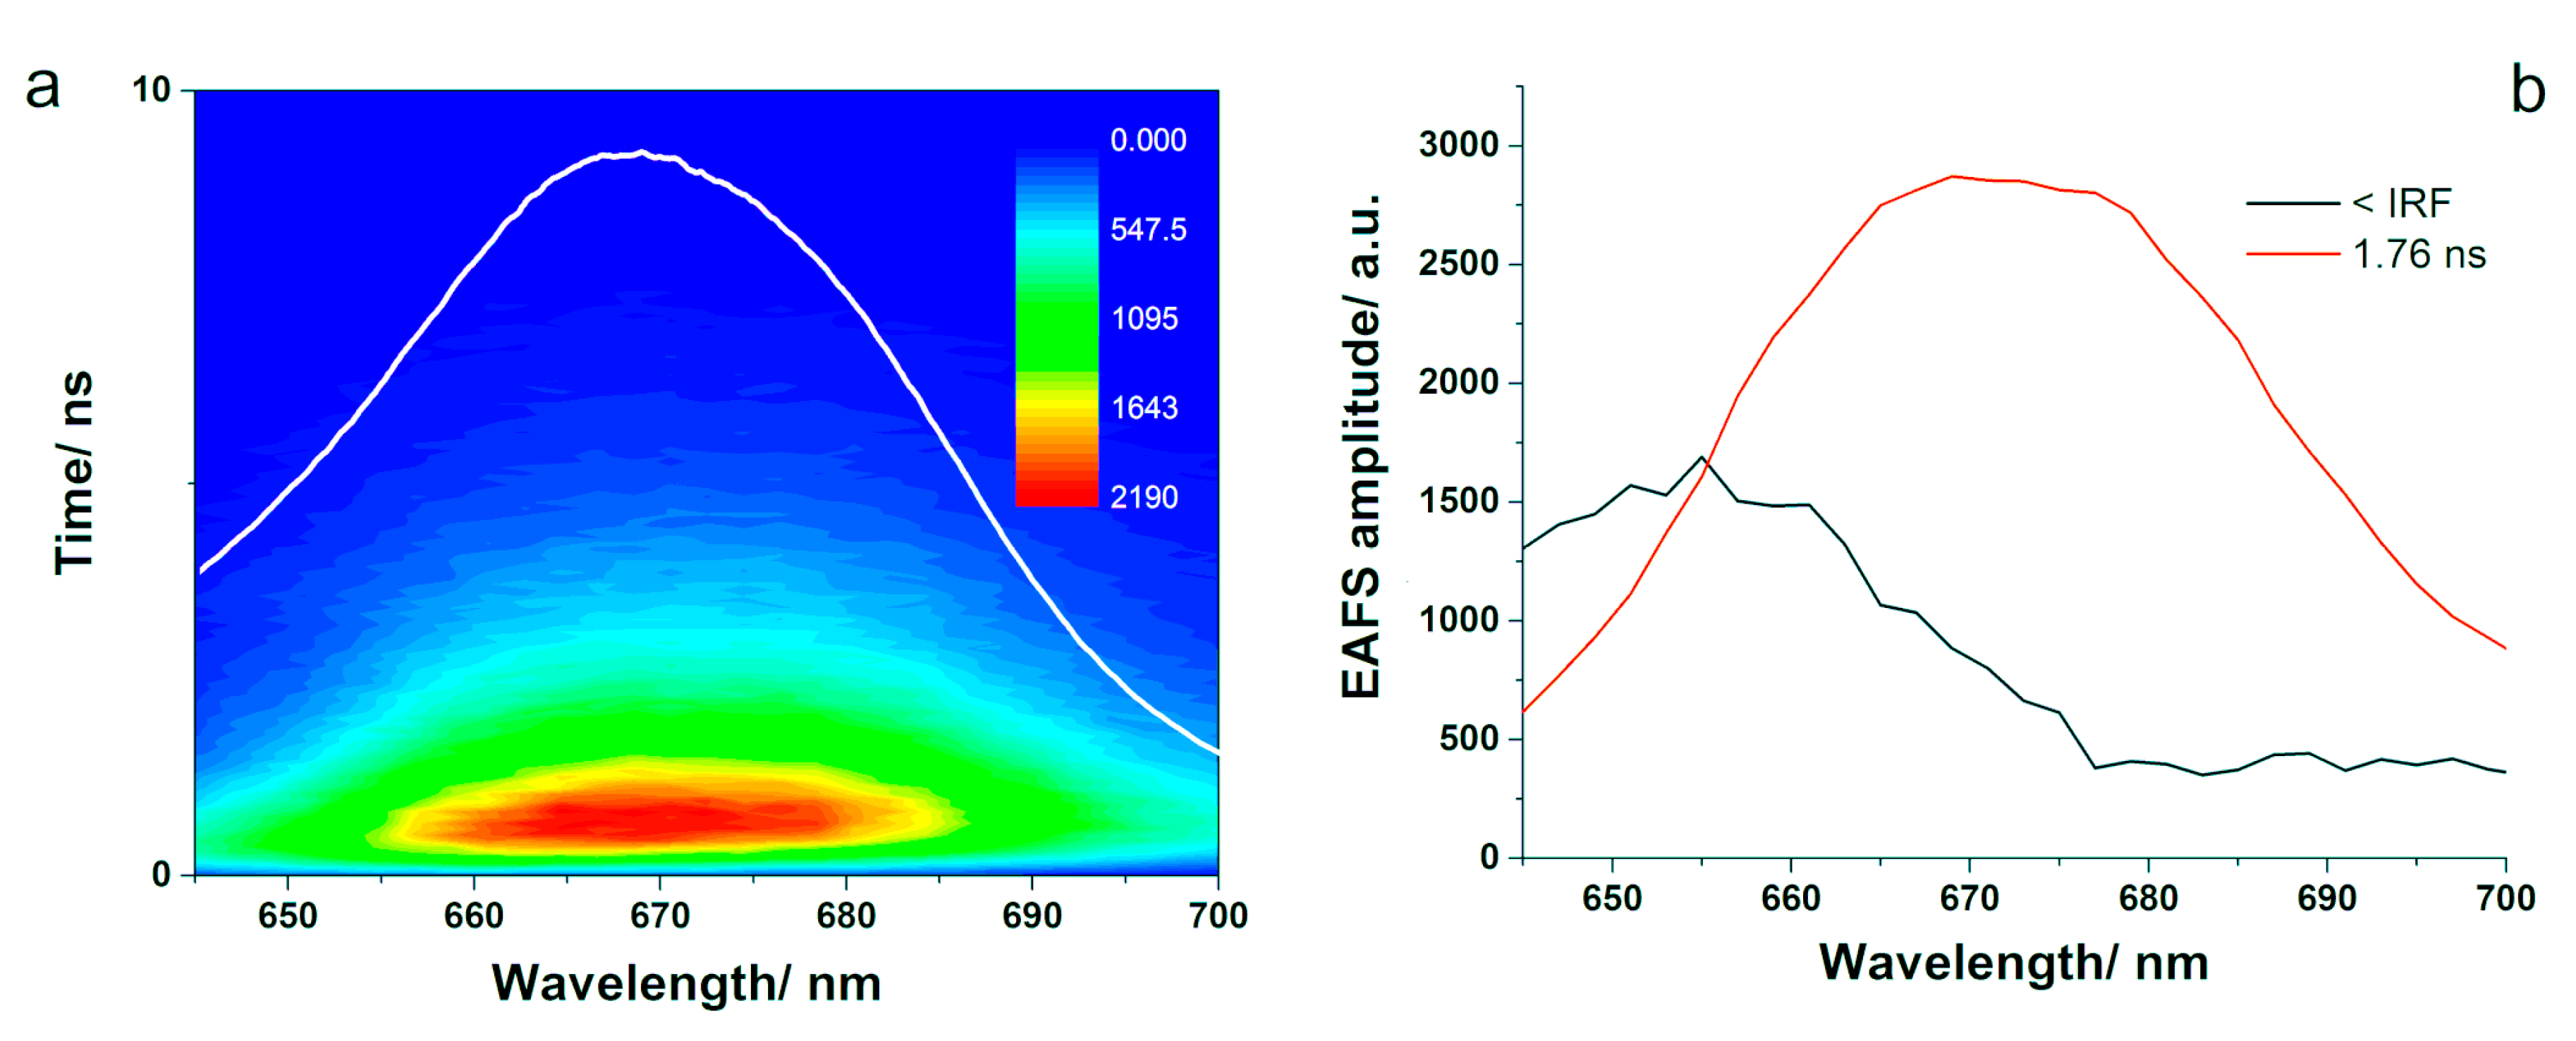
The fluorescence kinetics of the PBS was recorded in the 645–700 nm spectral region after the system was pumped with 580 nm laser pulses. The resulted TCSPC data are presented in
Figure 7. The fluorescence emission spectra showed a maximum around 660 nm with a red-shift toward 670 nm for emission spectra recorded at later time moments. The fluorescence kinetics was subject to global analysis fitting, assuming a simple sequential mode. We supposed that the excitation energy was transferred between different molecular species inside the PBS among the most energetically efficient route. The fluorescence kinetics of the PBS required two spectro-kinetic components for a satisfactory fit. We obtained a short component in the range of the IRF of our system and a long component of 1.77 ns. The resulted EAFS showed maxima at 655 nm and 668 nm, respectively. Additionally, the short EAFS decreased markedly until approximately 676 nm. The first component showed smaller amplitude compared to the second one, which could indicate smaller fluorescence yield induced by excitation energy transfer to the terminal emitter [
41]. Moreover, the maximum of the short EAFS component was observed at 655 nm and matched the fluorescence emission maximum of PC; however, it also presented similarities to the short EAFS obtained in APC. Therefore, this kinetic component may be associated to PC or to a spectral form of PCB in APC that transfers the excitation energy to the terminal emitter in APC. The peaks correspond well with the species-associated spectra reported by van Stokkum et al. for the time-resolved emission spectra recorded from a wild-type PBS from Synechocystis. They reported peaks at 649 and 660 nm, which were assigned to PC 650 and APC 660, respectively [
42]. Additionally, Tian et al. reported global fitting analysis of the time-resolved fluorescence data obtained for a wild-type PBS and obtained among faster kinetic components a decay time of 118 ps and one of 1.6 ns. The decay spectrum associated to the shorter kinetic component showed a positive peak at 645 nm with a negative one at 680 nm, similar to our short EAFS, and was assigned to the excitation energy transfer to APC, while the longer component peaked at 667 nm and was assigned to excited-state equilibrated PBSs [
19].
We performed a reconvolution analysis of the same data using the EasyTau2 software, which resulted in comparable decay components that were dependent on the pump and emission wavelengths. The mean value for the long component was 1.9 ns, while the one for the short component was 460 ps. The short component grew with increasing the detection wavelength from 640 to 665 nm and dominated the fit for this spectral region. Above 657 nm, the longer component dominated the fit. The calculated decay times together with the corresponding relative amplitudes are presented in
Figure S3 (see Supplementary Material). The fact that the short component identified in our study varied with the emission wavelength may suggest that it encompasses several components and it is limited by the time-resolution of our system. However, the fluorescence emission of the latter component was detected, and its lifetime was calculated to 1.6–1.9 ns, depending on the pump pulse and confirmed by the TCSPC experiments on APC (see
Figure 5).
3.3.2. Transient Absorption
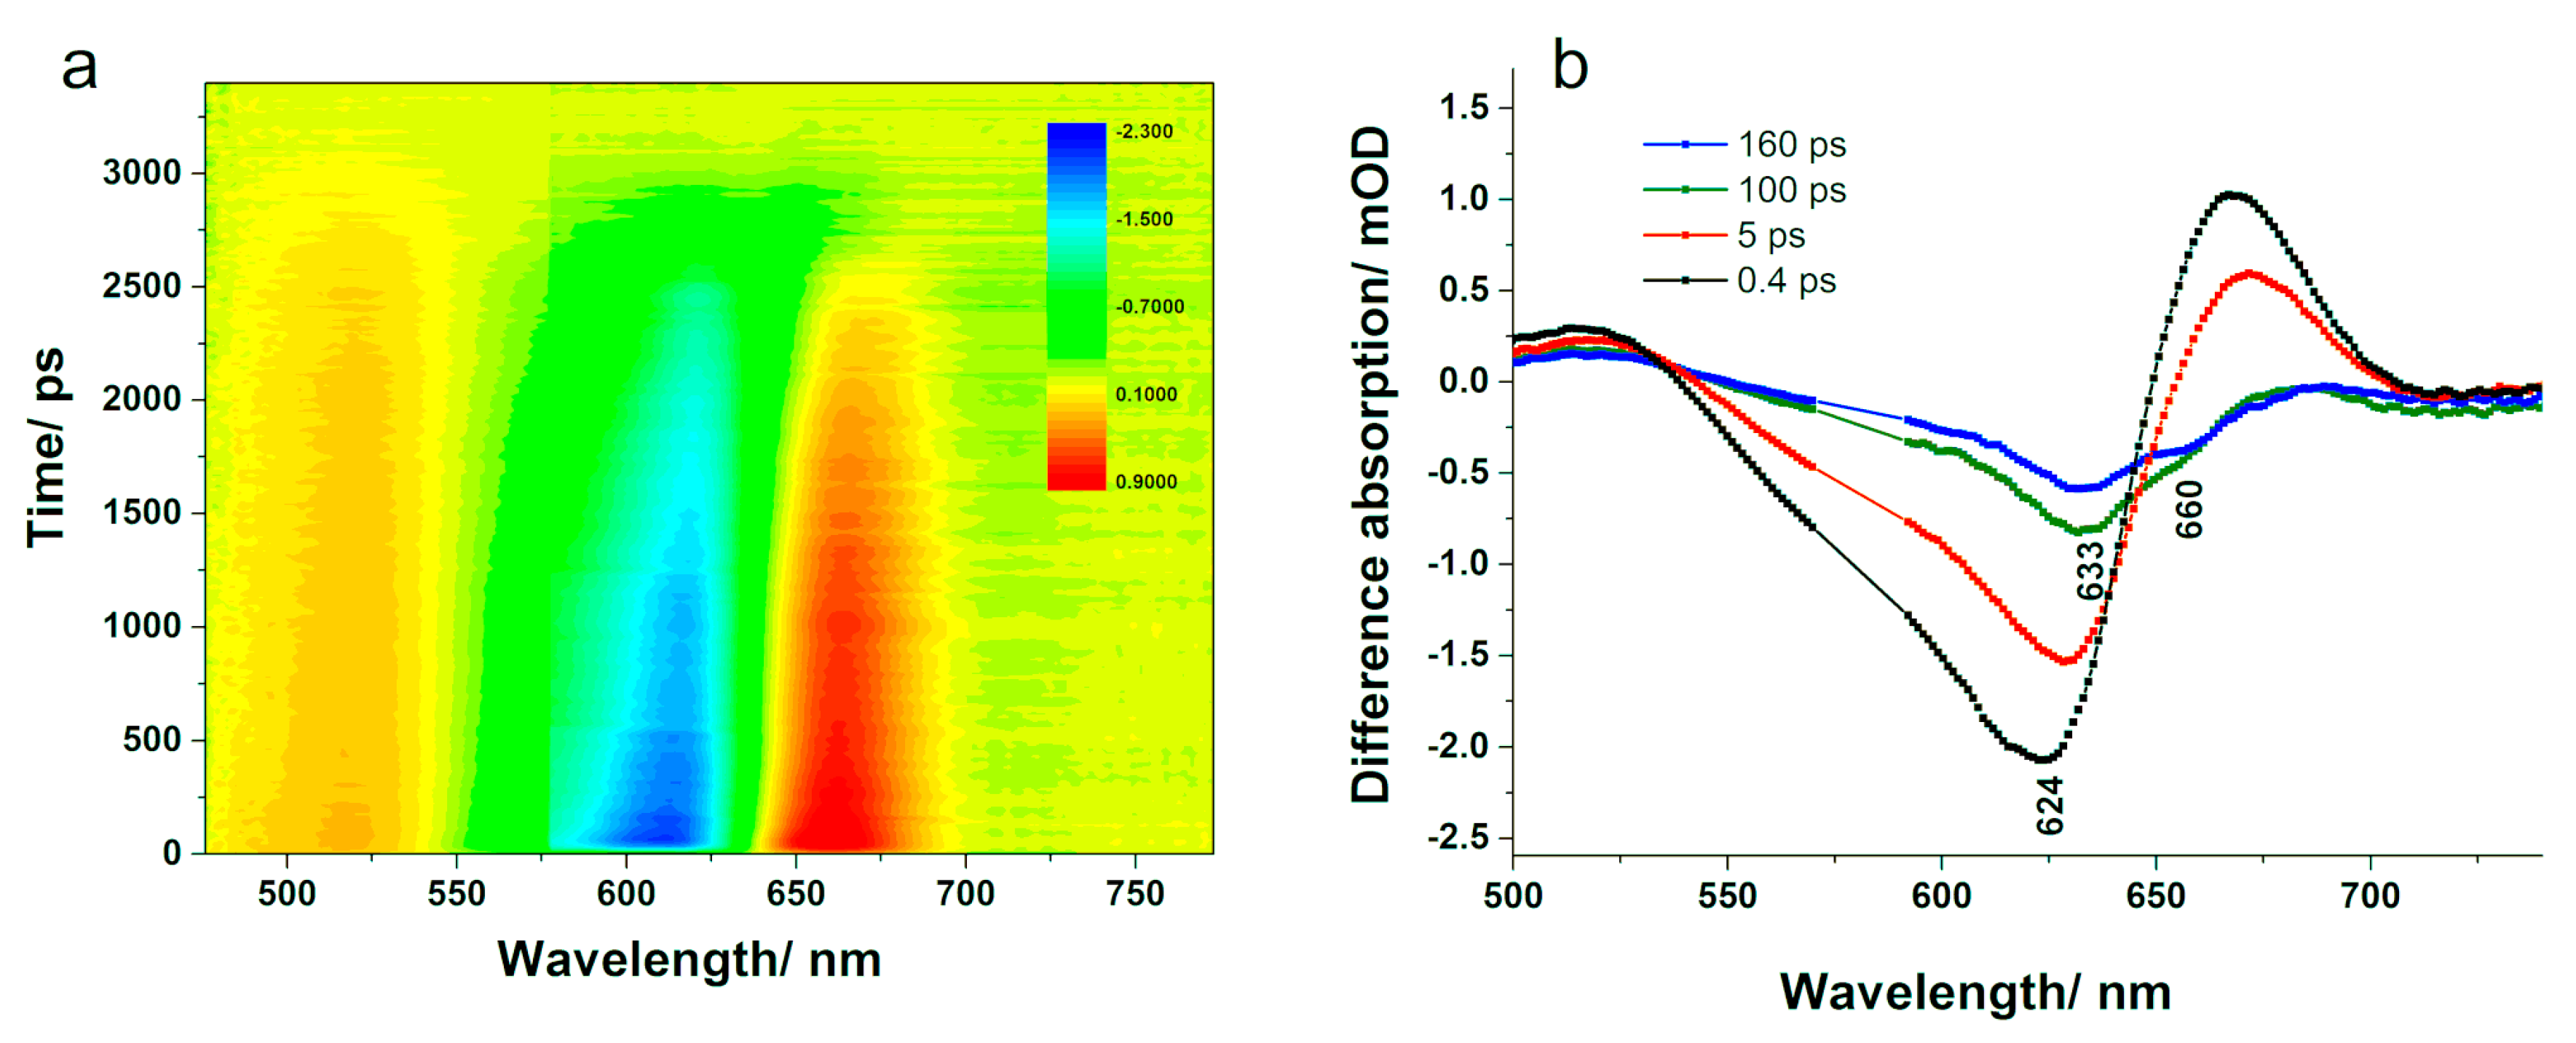
Further, we applied time-resolved absorption spectroscopy to map the energy transfer processes within our PBS sample and identify the ultrafast decay times.
Figure 8b shows the difference absorption spectra obtained at various delay times when the PBS was excited at 580 nm. A bleaching of the ground state centred at 624 nm appeared immediately following the laser excitation, within the first 400 fs. Concomitantly, two positive absorption bands were observed: a smaller one in the 470–550 nm and a stronger one in the 650–700 nm spectral range. The latter band was already reported in the scientific literature, and it was suggested that it could represent an excited state absorption of PC, since it emerged together with the bleaching band [
43]. The former band decayed with dynamics similar to the bleaching band; however, the latter one decayed within 1–100 ps, after which it became negative and increased again approaching the zero line. A more recent study suggested that since the 650–700 nm positive band decays faster than the 470–550 nm one, it cannot be assigned to an excited state absorption and associated it instead to a temporary electrochromic response of phycocyanobilin chromophores that are in the ground state and in the proximity of the excited ones [
41]. After reaching its maximum, the bleaching band started to decrease and its peak shifted to 633 nm until 100 ps delay time. Increasing the pump-probe delay, the bleaching disappeared without any further shift within approximately 1000 ps. Additionally, at delays longer than 140 ps, the difference absorption spectra showed a rise in the bleaching band at 648 nm, close to where the absorption of APC is, followed by a negative band of lower intensity centered at 660 nm, which could be assigned to stimulated emission of APC. This band decreased without any wavelength shift in more than 1000 ps.
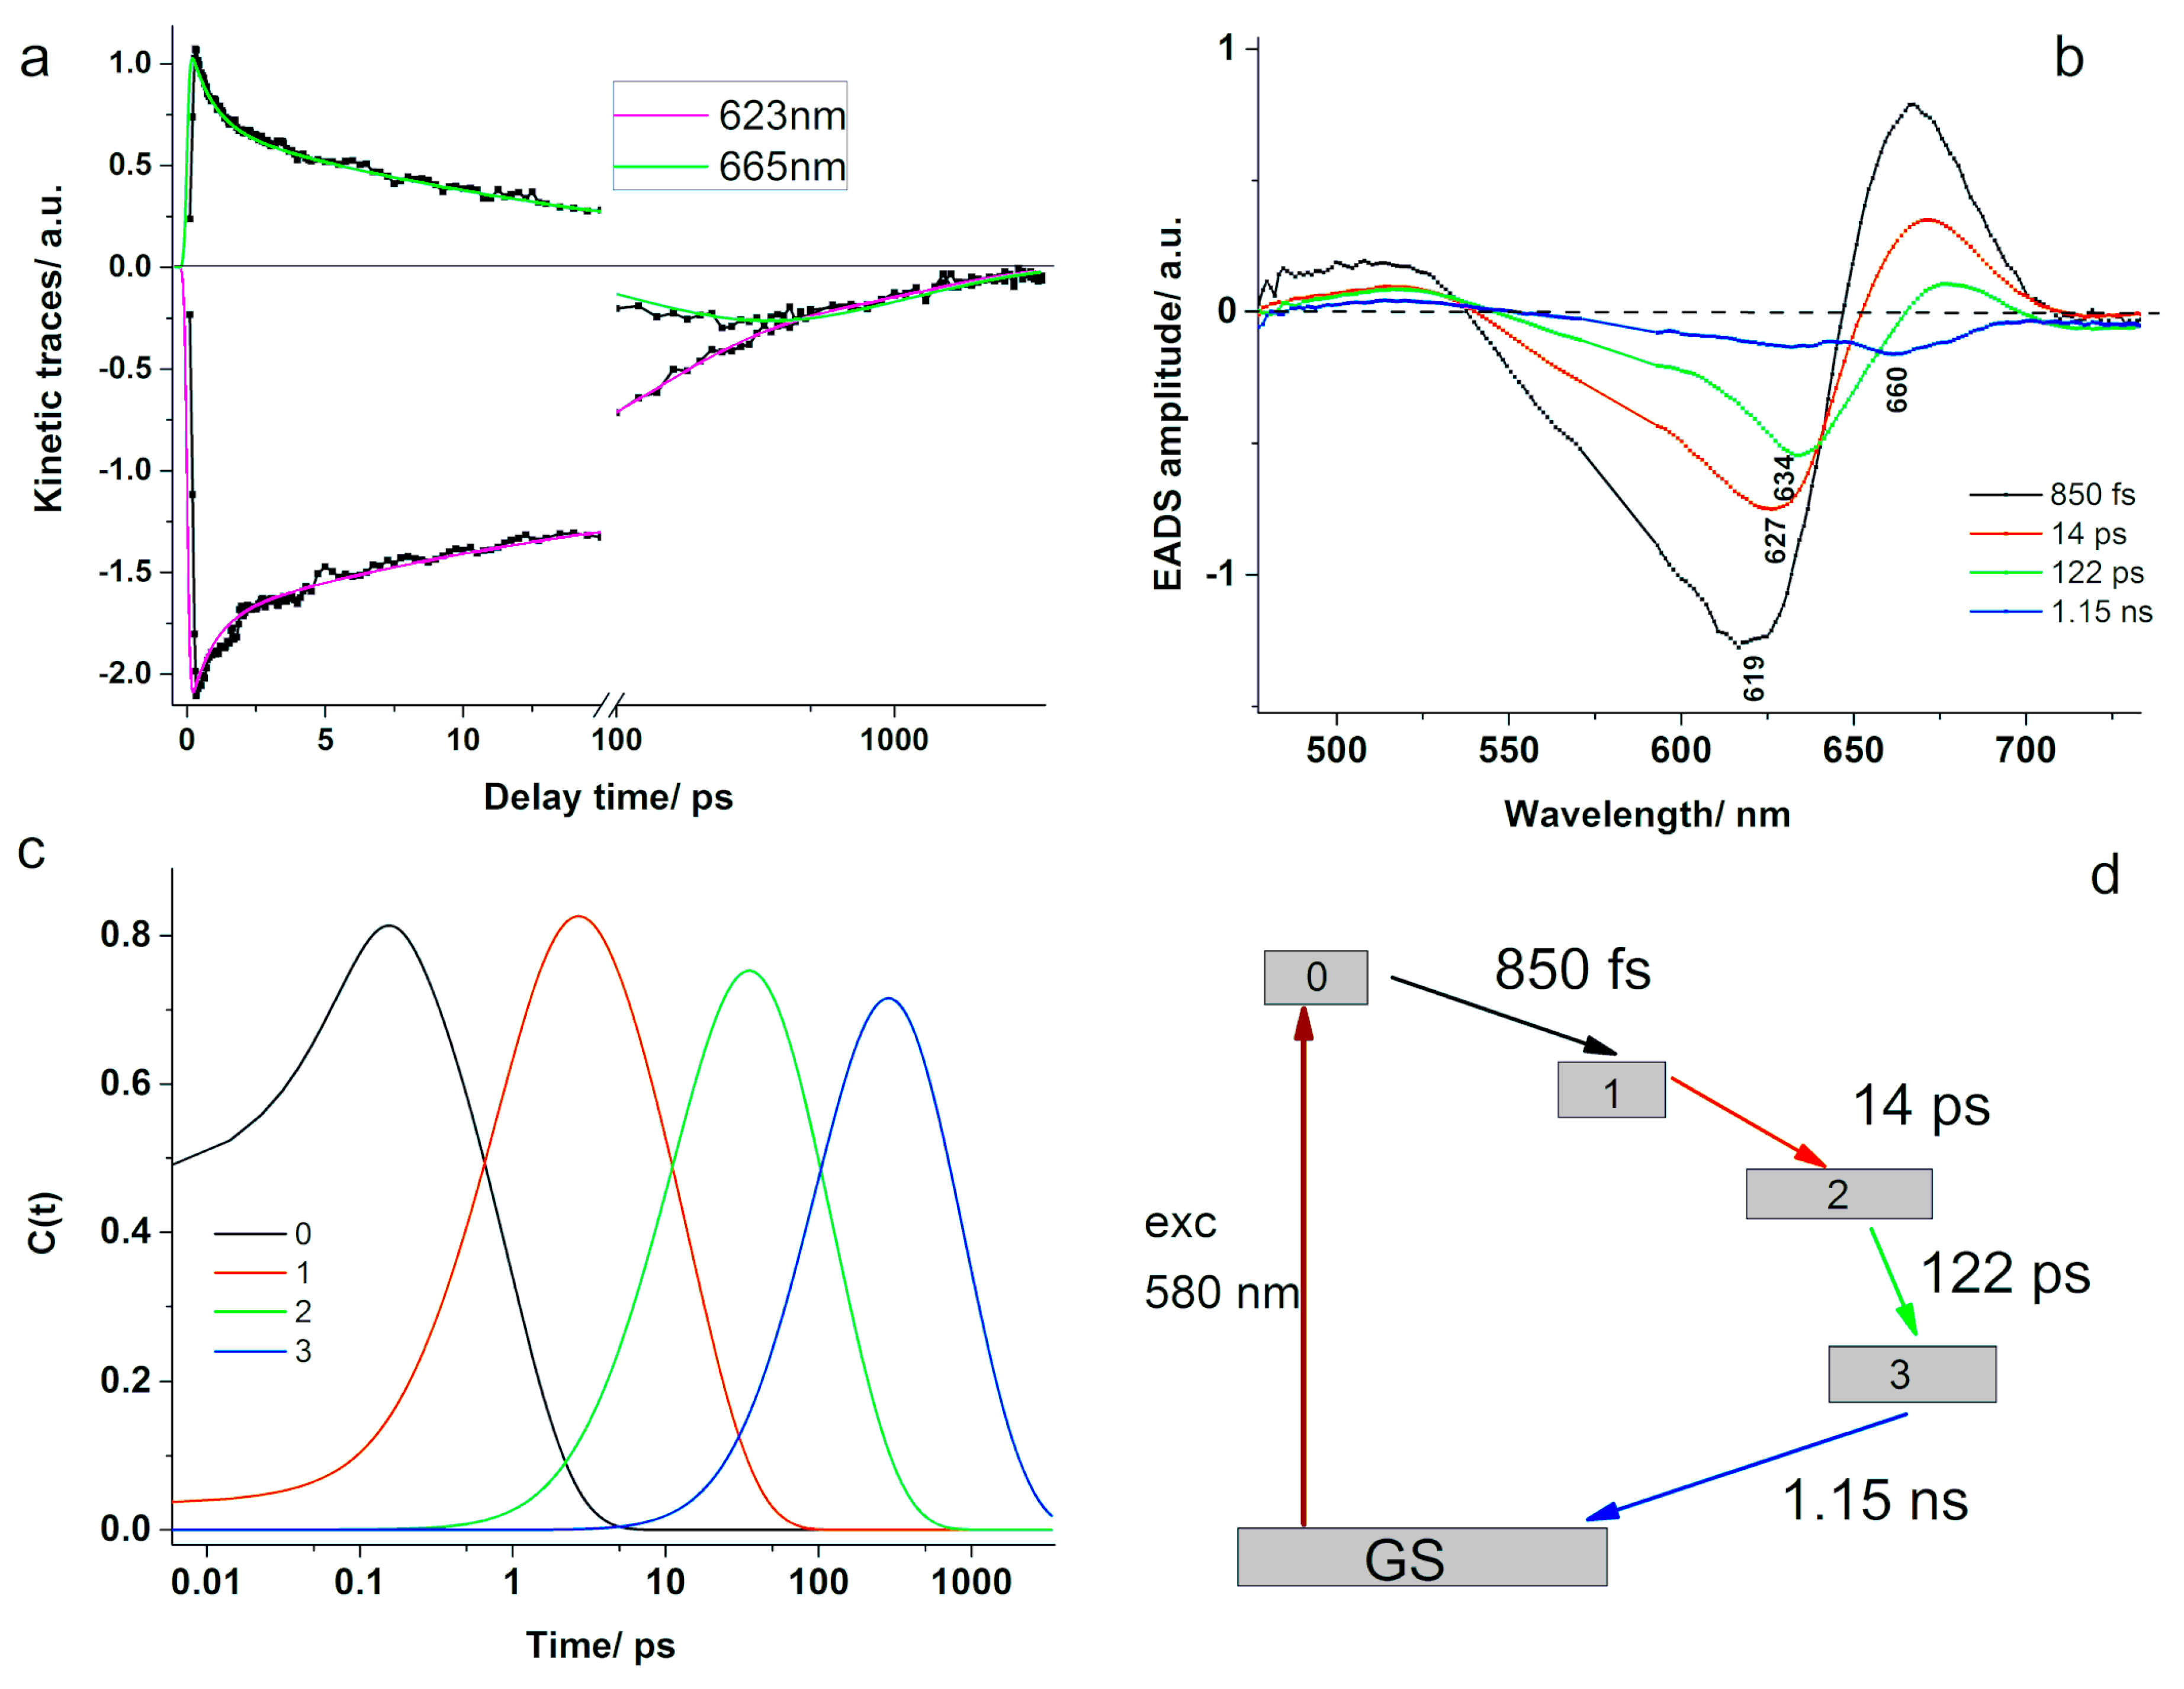
In order to get more insight into the ultrafast dynamics and their spectral characteristics, we applied global analysis considering a sequential model with four compartments. The excitation energy was funneled from the high-energy components within the PBS to the lower energy ones and finally to the terminal emitter. The evolution-associated difference spectra and the time-dependent concentrations are presented in
Figure 9b,c. The resulted lifetimes associated to the decay of each compartment were τ
1 = 850 fs, τ
2 = 14 ps, τ
3 = 122 ps, and τ
4 = 1.15 ns. The values obtained here compare well with the results reported previously [
25,
26,
41], as we discuss further on.
The EADS characteristic to the 850 fs component was described by a negative band centred at 619 nm and positive values above 647 nm and below 540 nm. The negative band at 619 nm indicates the ground-state bleaching of PC, especially the α-84 chromophore, which should absorb at this wavelength [
41]. We assign this component to the ultrafast equilibration of excitation energy between the sensitizing and fluorescing chromophores in PC. This value is comparable to the one obtained above for the energy transfer between the α-84 and β-84 chromophores in PC using TA experiments (see
Figure 3). A similar sub-picosecond value of 888 fs was reported before in the literature for the PBS extracted from T. vulcanus and the spectro-kinetic component presented a minimum at 620 nm. The decay time was assigned to ultrafast kinetics along the PC rod to the APC core mainly on the observation that the species-associated difference spectra showed positive values above 650 nm [
25]. Another similar result to ours was recently published by Niedzwiedzki et al. [
41], which reported a value of 700 fs for the energy transfer between α-84 and β-84 chromophores in a PBS extracted from A. marina grown in low white light.
The second EADS presented a minimum at 627 nm, which corresponded well to the 629 nm band resolved in the absorption spectrum of PBS from A. marina [
37] and was assigned to phycocyanin. Moreover, it resembled well the second evolutionary spectrum obtained for PC, showing positive values above 652 nm with a peak at 670 nm. Therefore, we assign the 14 ps kinetic component to the energy transfer between PC disks in the rods. Similarly, Niedzwiedzki et al. [
41] obtained a time component of 14 ps, which was assigned to the energy transfer between spectral variants of β-84 PCB.
The third EADS showed a local minimum at 634 nm, a positive band centered at 676 nm, and another weak negative band peaking at 713 nm. We assign the 122 ps kinetic component to the rod to core energy transfer. A comparable value was reported by Zhang et al. for the 640 nm excitation of a rod–core complex from Anabaena variablis [
44]. Additionally, Niedzwiedzki et al. [
41] reported a kinetic component of 142 ps for the energy transfer between spectral variants of β-84 PCB in PC, based on the minimum observed at 637 nm in the resulted species associated spectrum; however, their analysis was performed on a PBS free of APC. The EADS associated to the last compartment presented negative values throughout the entire spectral region, showing a minimum at 660 nm close to where APC emits. This could indicate that the radiative and non-radiative decay of the final emitting chromophores from the excited state back to the ground state took place in 1.15 ns. Although the value is shorter than the fluorescence lifetime of 1.8 ns obtained from the TCSPC experiments on APC, the numbers are comparable.
We should mention here that the decrease of EADS amplitude was more clearly observed for the PBS than for PC and APC because for the PBPs, the process of ground-state repopulation was not over in the 3600 ps delay scan used in the measurement. The situation was different in the PBS, because of the presence of linker proteins that maintain the PBS compact and interact with the chromophores, therefore influencing the decay by providing additional decay pathways. In the case of PC and APC, the linker proteins are not present, being removed during purification since they are unstable in aqueous solution outside the PBS complex. The difference absorption spectra recorded at long delay times (above 1000 ps) in the case of PC and APC presented bleaching bands around 630 nm for PC and around 660 nm in the case of APC of rather significant intensities (−1 mOD for both PC and APC compared to −0.17 mOD for PBS), while the process in the PBS was already finished at a delay time of 1700 ps.
The results obtained here are in good agreement with the data reported by van Stokkum et al. for a wild-type PBS consisting of a three-cylinder core composed of four APC disks and six rods made of up to three PC hexamers, respectively a mutant PBS comprised of rods with a single hexamer, both extracted from Synechocystis [
42]. Global fitting of the time-resolved fluorescence spectra uncovered three kinetic components in the ps time scale assigned to intra-rod, rod to core, and whole PBS equilibration. Additionally, ns time-scale kinetic components were reported for the final decay of the PBS core (1.68 ns), as well as for the unconnected rods in the short rod PBS (1.2 ns). In our TCSPC experiments, the fast lifetimes could not be resolved due to the limited temporal resolution of our system; however, the final decay presented similar value to the wild type PBS. The two longest lived kinetic components obtained from the transient absorption experiments (622 nm pump pulses) reported for the wild-type PBS in the above-mentioned paper are comparable to ours: 132 ps and 1.2 ns in [
42] versus 122 ps and 1.15 ns obtained here. The equilibration of the wild-type PBS was completed in 132 ps, after equilibration of PC pigments in 5 ps and rod to core energy transfer in 59 ps. Moreover, a similar decrease of the EADS amplitude was observed (bleach and stimulated emission area), which was assigned to annihilation processes taking place in the complexes absorbing two or more photons. A more similar rod to core equilibration time to ours was reported for the PBS with short rods (19 ps versus 14 ps obtained here). The results reported in [
42], as well as those reported by Niedzwiedzki et al. [
41], and the ones reported here show that apart from minor dynamic differences, the kinetics obtained for PBSs extracted from different strains of cyanobacteria can be compared, regardless if their structures are similar or differing. The weak dissimilarities can in some cases be attributed to the conditions used for investigating the PBSs, such as excitation intensities and wavelengths, and of course, the temporal resolution of the analyzing systems.
4. Discussions and Conclusions
The current work reported the ultrafast kinetic components of the excitation energy transfer in the phycobilisome extracted from A. platensis, as well as in its structural components, phycocyanin and allophycocyanin, which was reported here for the first time. The aim was to coherently connect the time dynamics in these “simpler” structural components in order to understand the more complex behavior of the phycobilisome, in view of its further use as solar concentrator for a photo voltaic device.
The time-resolved fluorescence investigations on phycobiliproteins resolved the fluorescence lifetime of the emitting chromophores and resulted in values of 1.34 ns for phycocyanin and 1.8 ns for allophycocyanin. A component on the time scale of a few hundreds of ps was resolved additionally in each case; however, this was limited by the temporal resolution of our time-resolved fluorescence system.
Transient absorption experiments were further employed to identify the ultrafast energy transfer time components. We summarized in
Table 1 the decay times obtained for each phycobiliprotein and the phycobilisome. The energy transfer process within the phycobiliproteins was explained using three time components. The longest time component in each phycobiliprotein was assigned to the fluorescence lifetime of the final emitting chromophores that decay through radiative and non-radiative processes. Two other kinetic components were identified: a middle component lasting some tens of picoseconds and a short one in the sub-picosecond range. This ultrashort component in phycocyanin was assigned to the energy transfer between α-84 and β-84 chromophores. In allophycocyanin, a faster time component of less than 400 fs was detected and attributed to the localization of the excitation energy on one of the two chromophores. The middle component obtained for phycocyanin was assigned to the equilibration energy among spectrally differing β-84 chromophores, depending on the actual chromophore–protein arrangement. In the case of allophycocyanin, the middle component was attributed to the energy transfer between pairs of low and high-energy phycocyanobilin chromophores, based on the two minima observed in the evolution-associated spectra, which corresponded to their absorption.
The energy transfer process was further mapped within the phycobilisome composed of phycocyanin rods and an allophycocyanin core and was explained using four decay times. An ultrashort component of 850 fs was assigned to the excitation energy transfer between α-84 and β-84 chromophores inside phycocyanin hexamers. The ultrashort decay time of 370 fs obtained for allophycocyanin did not find a correspondent in the case of phycobilisome, which was mainly due to the phycobiliproteins configuration, but also because the pump pulse should be mostly absorbed by the phycocyanin. Therefore, this kinetic component would be superimposed by other energy transfer processes. The second component detected in the phycobilisome (14 ps) was shorter than the middle ones observed in the phycobiliproteins. The intra-rod phycocyanin equilibration is expected to take place on a shorter time scale due to the phycobiliproteins configuration in the assembled phycobilisome. Additionally, the energy transfer between the phycocyanobilin chromophores within the hexamers of phycocyanin and, respectively, the trimers of allophycocyanin, should be overlapped by the dominant energy transfer between the two phycobiliproteins. A third decay time of 122 ps was identified in the phycobilisome, which indicated the rod to core energy transfer to the final emitting phycocyanobilin chromophores in the allophycocyanin core, that play the role of the terminal emitter. From there, the system returned to the ground state through radiative and non-radiative decay in more than 1 ns.


