Article

Analysis of the Possibility of Using Drill-Type Electrodes for Air Ionization

Faculty of Electrical Engineering, Automatic Control and Informatics, Opole University of Technology, 45-758 Opole, Poland
*
Author to whom correspondence should be addressed.
Appl. Sci. 2020, 10(11), 4030; https://doi.org/10.3390/app10114030
Submission received: 11 May 2020 / Revised: 8 June 2020 / Accepted: 9 June 2020 / Published: 11 June 2020

Abstract

:
In this article, the authors present the results of the analysis of the ionization efficiency of drill-type needle electrodes in air. The analysis was carried out on the basis of experimental laboratory measurements, examined at alternating voltages. Drill-type electrode systems of different diameters were adopted for the tests. The ionization efficiency for this type of electrode has been characterized by values of characteristic voltages, such as the initial voltage of the corona voltage and the sparking voltage. The obtained results were compared with the results of classical conical needle electrodes. The ionization efficiency of drill-type electrodes has been shown to be higher than that of classical conical needle electrodes.

1. Introduction

In the high voltage technique, primary significance lies in the dielectric strength of air in the electrode systems, between which there is an uneven distribution of electric field intensity. The classic electrode systems, between which there is an uneven distribution of the electric field, are spark gap needles—needles with different needle geometries. From the insulation technology point of view, this issue is fully recognized.
Around the needle electrodes, the electric field intensities are the highest and therefore exhibit partial discharges around them (corona, sparking), which are used in various technological processes and equipment [1,2,3,4,5]. Examples are electrostatic precipitators for flue gas purification or devices for ozonizing drinking water in water supply networks [6,7]. In electrostatic precipitators, where there is a strongly uneven distribution of the electric field between the needle electrodes, the moving dust is electrified, captured and precipitated into containers and further processed [8,9,10,11]. In systems for the ozonation of drinking water, for the purpose of improving its biological properties and sanitary parameters, needle spark gaps are used to generate partial discharge and, consequently, to ionize the air and produce ozone to treat the produced drinking water [12,13,14]. Ozone processes are also used to reduce the toxicity and destructive environmental impact of municipal and industrial wastewater [15,16,17]. This mainly concerns emergencies, such as can be seen in Poland in 2019. In this example, the failure involved the unsealing of Warsaw’s main sewer and the entry of approximately 3 million liters of wastewater into the Vistula River. It is in this emergency situation that the technology of ozonation was used to reduce the toxicity of the wastewater discharged into the river.
In both of the above-mentioned applications, the choice of needle electrodes is crucial for the technological processes, as well as their performance and energy efficiency [18,19]. The purpose of the research, results of which are presented in this article, was to determine the ionization efficiency of the drill-type needle electrodes. Eleven pairs of drill-type electrodes with diameters ranging from 0.5 mm to 1.5 mm were tested in this respect. The ionization efficiency of these electrodes has been characterized by the characteristic voltage values: the initial corona voltage Uo and the breakdown voltage Ub. In order to determine the electrical strength of systems with such electrodes, which is important for safety reasons, the results of the measurements of breakthrough voltages Ub in the eleven tested systems were also presented. The obtained results were compared with the corresponding results, characterizing two classic needles—needle electrode systems, of different geometry.

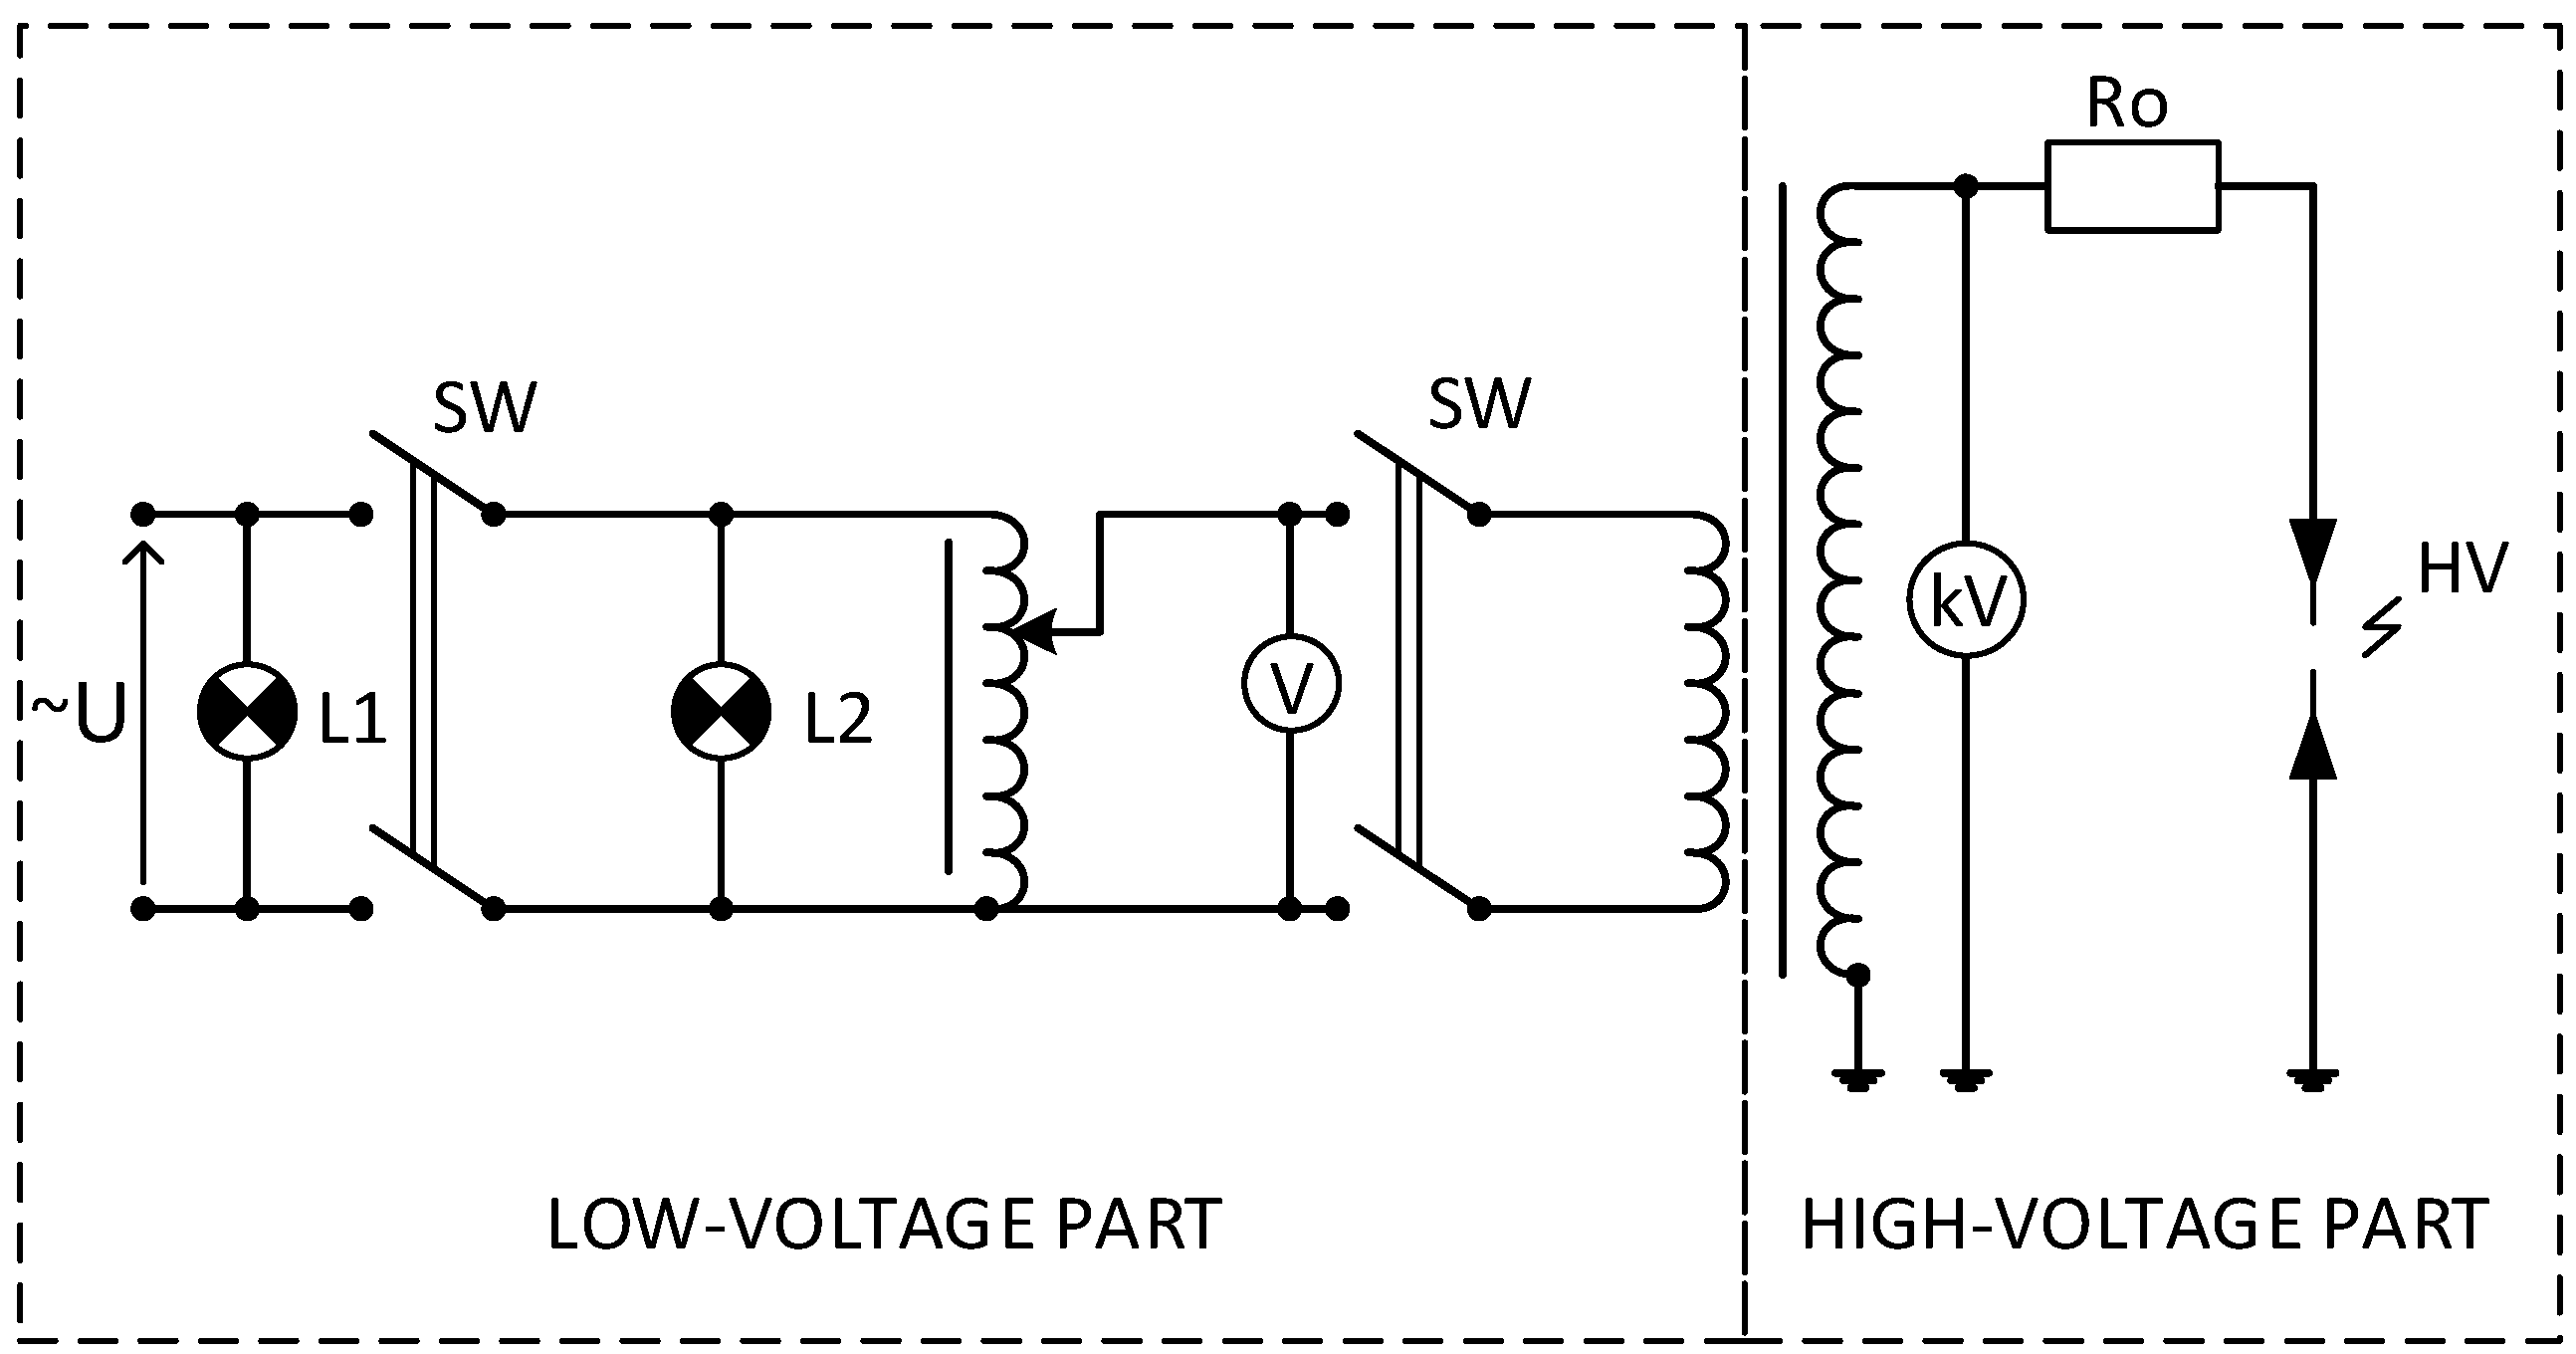
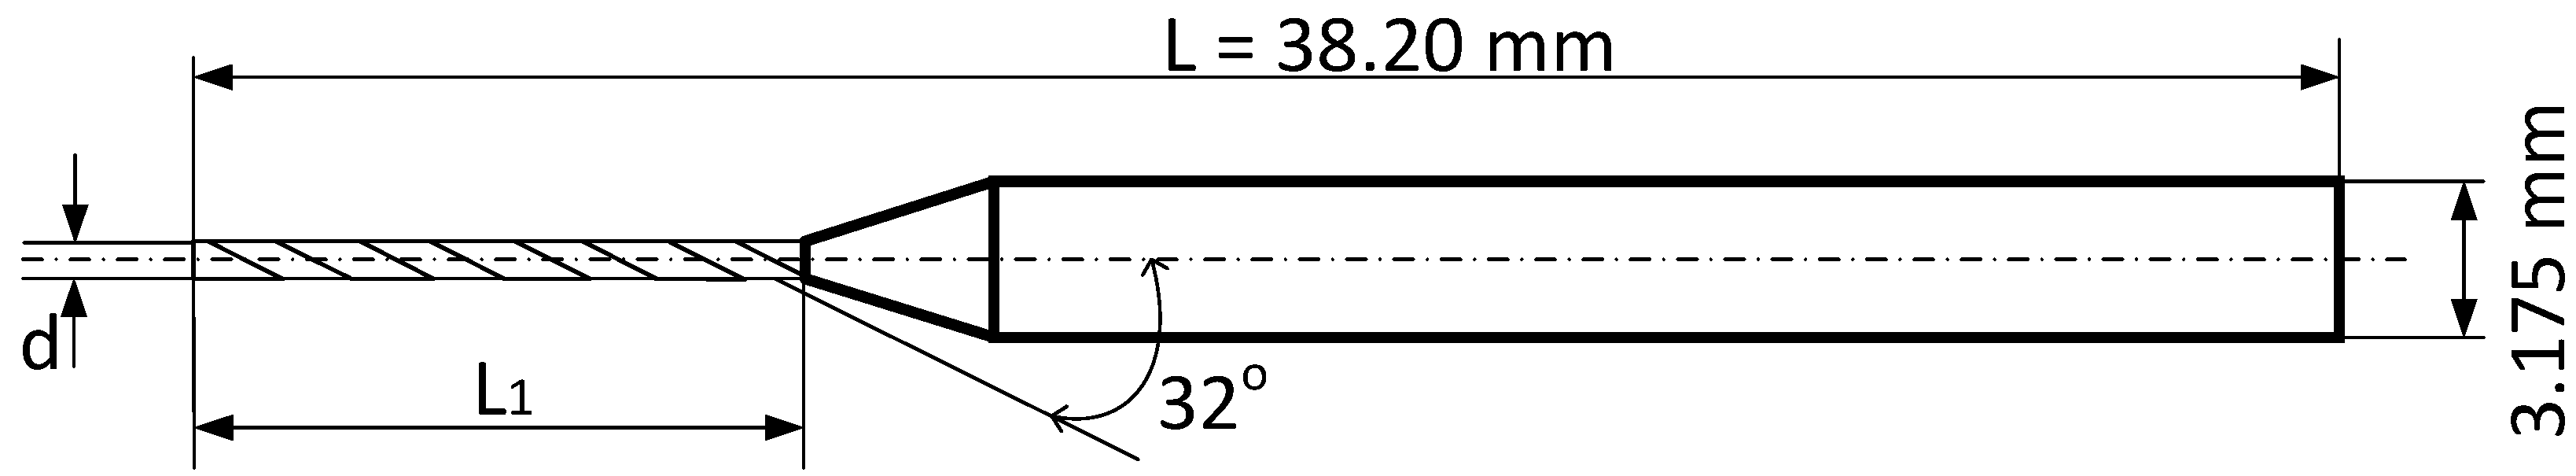
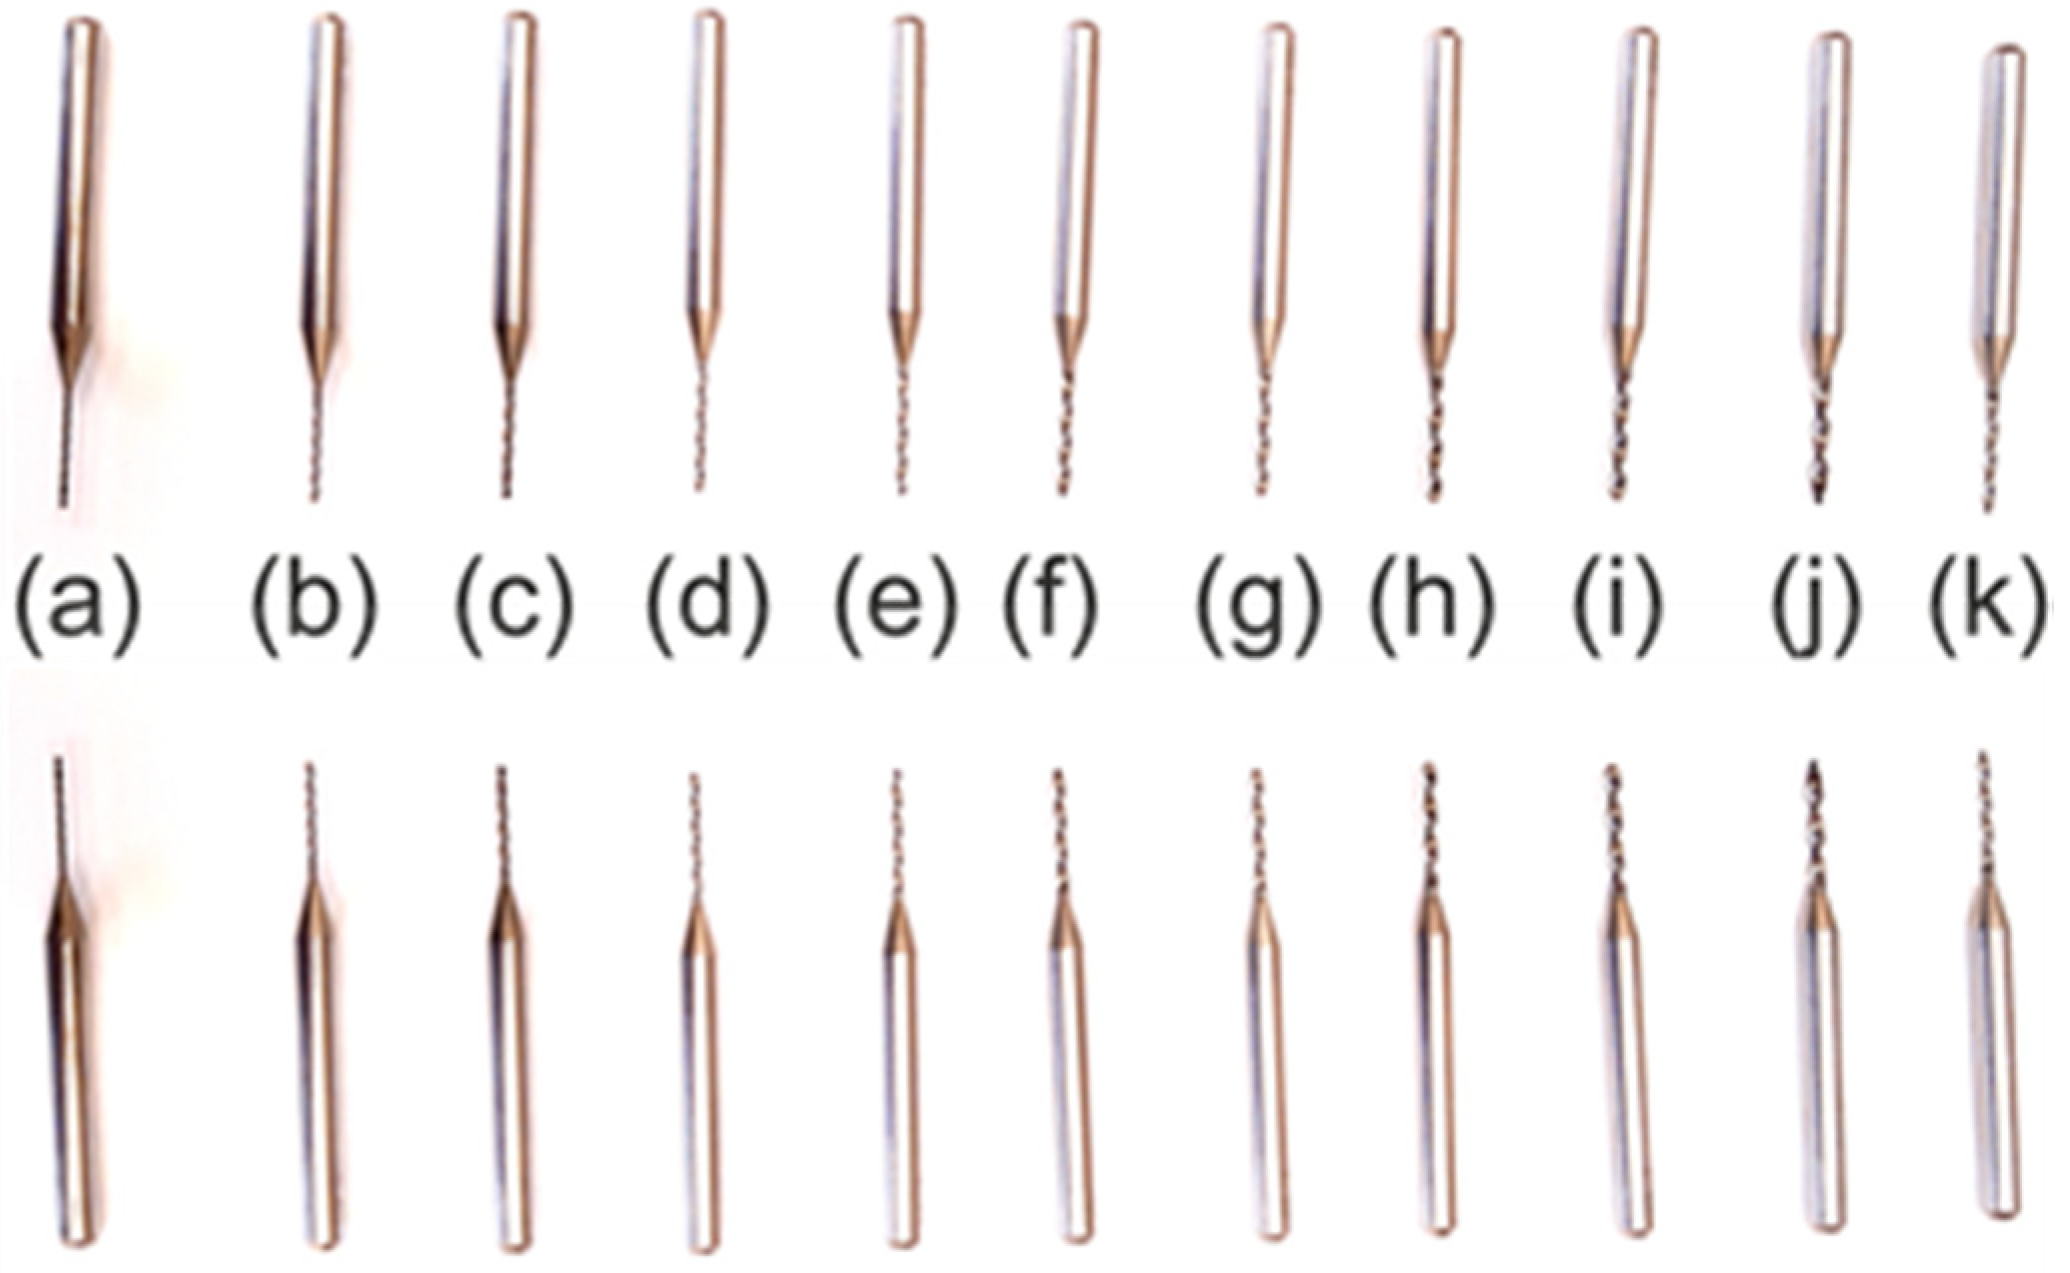
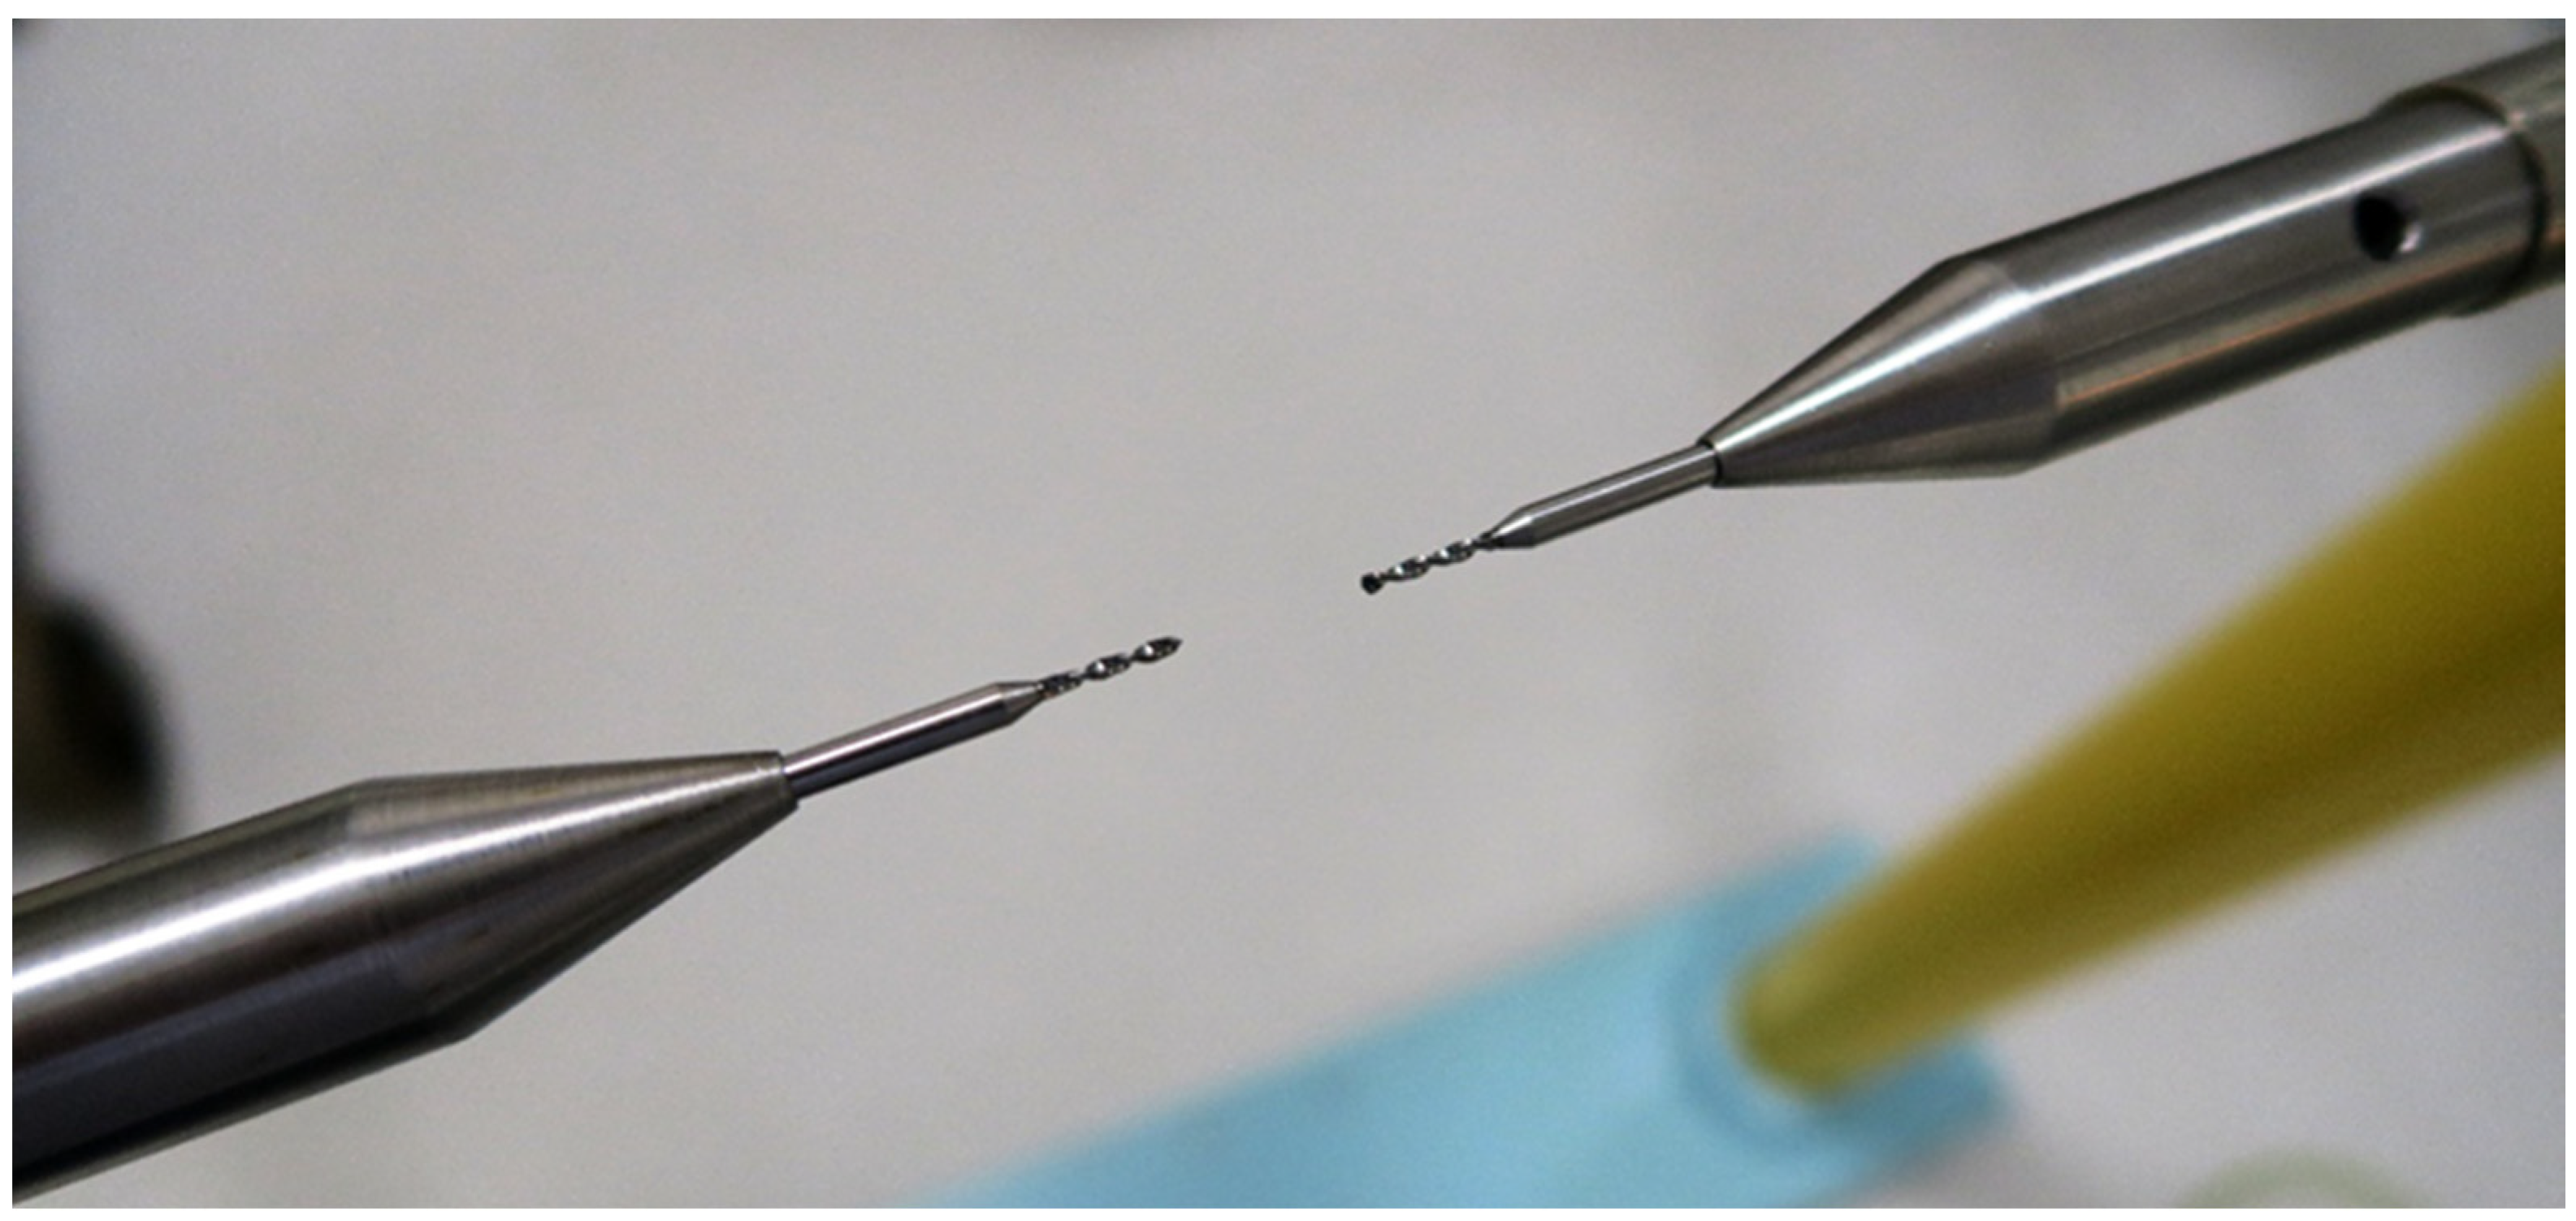
2. Measuring System, Characteristics of Drill-Typed Electrodes, Research Programme

Measurements of characteristic voltages of partial discharges between drill-type electrodes were taken in a typical high voltage coil in the High Voltage Laboratory. The basic elements of the high voltage test system were a control panel with protections and a test transformer with an upper voltage of 110 kV (Figure 1). A single-phase test transformer (TP110) with a rated gear ratio of 220/110,000 (V/V) was used, supplied with 50 Hz alternating voltage. The supply voltage to the electrode system was measured on the high voltage side by an electrostatic kilovoltmeter. Additional measurement on the low voltage part was carried out using a voltmeter that was built into the control panel.
The control panel allows automatic adjustment of the high voltage rise, at a speed of 1 kV/s. The drill-type needle spark gaps were tested in the test system and constituted a load of a capacitive nature. The voltage increase was manually controlled in about 1 kV steps every 10 s. During the breakdown of the air layer between the drill-type electrodes, the test transformer changed its operation from an idle state to a short-circuit state; it must therefore be switched off immediately. The system was switched off by an immediate circuit breaker or by overcurrent protection. At the moment of the flashover, breakdowns were generated in the whole system. They threatened the insulation of the test transformer and measuring apparatus—including computers near the high voltage coil. To limit and suppress them, a water resistor was installed directly on the test transformer which limited the current to mA range (max. 100 mA for this system).
The metrological conditions for all tested electrode systems were identical: ambient temperature 20 °C, air humidity 52%. Due to the basic and experimental scope of research, the impact of metrological conditions at this stage was not analyzed.
The standard needle electrodes used in the High Voltage Laboratory were conical electrodes with a 45° cone angle. The term “needle electrode” is extensively discussed in the literature and the theoretical approach to this issue is contained, among others, in the papers [20,21]. Based on this literature, the maximum electrical field strengths in the needle—needle system can be calculated after modelling the electrodes with hyperboloids. It is made possible by the following formulas (1)–(3).
E m a x = E m e a n × β = U s × c o s α s i n 2 α × l n c t g α 2
β = c o s α s i n 2 α × l n c t g α 2
For the small angle (α < 7°), formula (1) can be simplified to formula (3):
E m a x = U s × 1 α 2 × l n 2 α
Eleven different diameters of the drill-type needle electrodes were selected for the test: from 0.5 mm to 1.5 mm, with a change of 0.1 mm. Drill-type electrodes based on PCB (Printed Circuit Boards) drill technology made of HSS (High Speed Steel) steel were used. They are characterized by high hardness and, due to their being doped with chromium, increased chemical resistance. Figure 2 shows a sketch of a drill-type electrode with a diameter of 1 mm. Figure 3 shows an image of 11 pairs of drill-type electrodes used in measurements. Figure 4 shows an image of a measuring spark gap with mounted drill-type electrodes, prepared for measurements. The main measurement criterion is the visual observation of the appearance of the corona phenomenon on the HV electrode and the determination of the voltage value at which the phenomenon occurred.
Measurements included three characteristic voltages: corona voltage Uo, sparking voltage Us and breakdown voltage Ub. These voltages were measured for each of the eleven pairs of drill-type electrodes. For each pair of drill-type electrodes and the adopted distance, measurements were made three times. Arithmetic mean was calculated from the obtained values, which was averaged, converted through a test transformer gearbox (500) and rounded to two decimal places. In this way, results under further analysis were expressed in kilovolts. For averaged results, their scatter was determined by determining the standard deviation. Measurements for each pair of drill-type electrodes were made in the range of distance from 2 cm to 16 cm, increasing the distance every 2 cm. In this way, eight measuring points were obtained for each pair of drill-type electrodes and for each characteristic voltage. The results of the electrical strength measurements of the air were affected by the atmospheric conditions under which the measurements were made. Their impact was taken into account when calculating the appropriate correlation coefficient.
In order to obtain reference characteristics to allow for the comparison of results relating to the systems with the drill-type electrodes, measurements were also made in two systems of needle electrodes. Needle electrodes with needle angles of 45° and 20°, respectively, were used. The way of performing tests in these systems was the same as in systems with drilling elements.

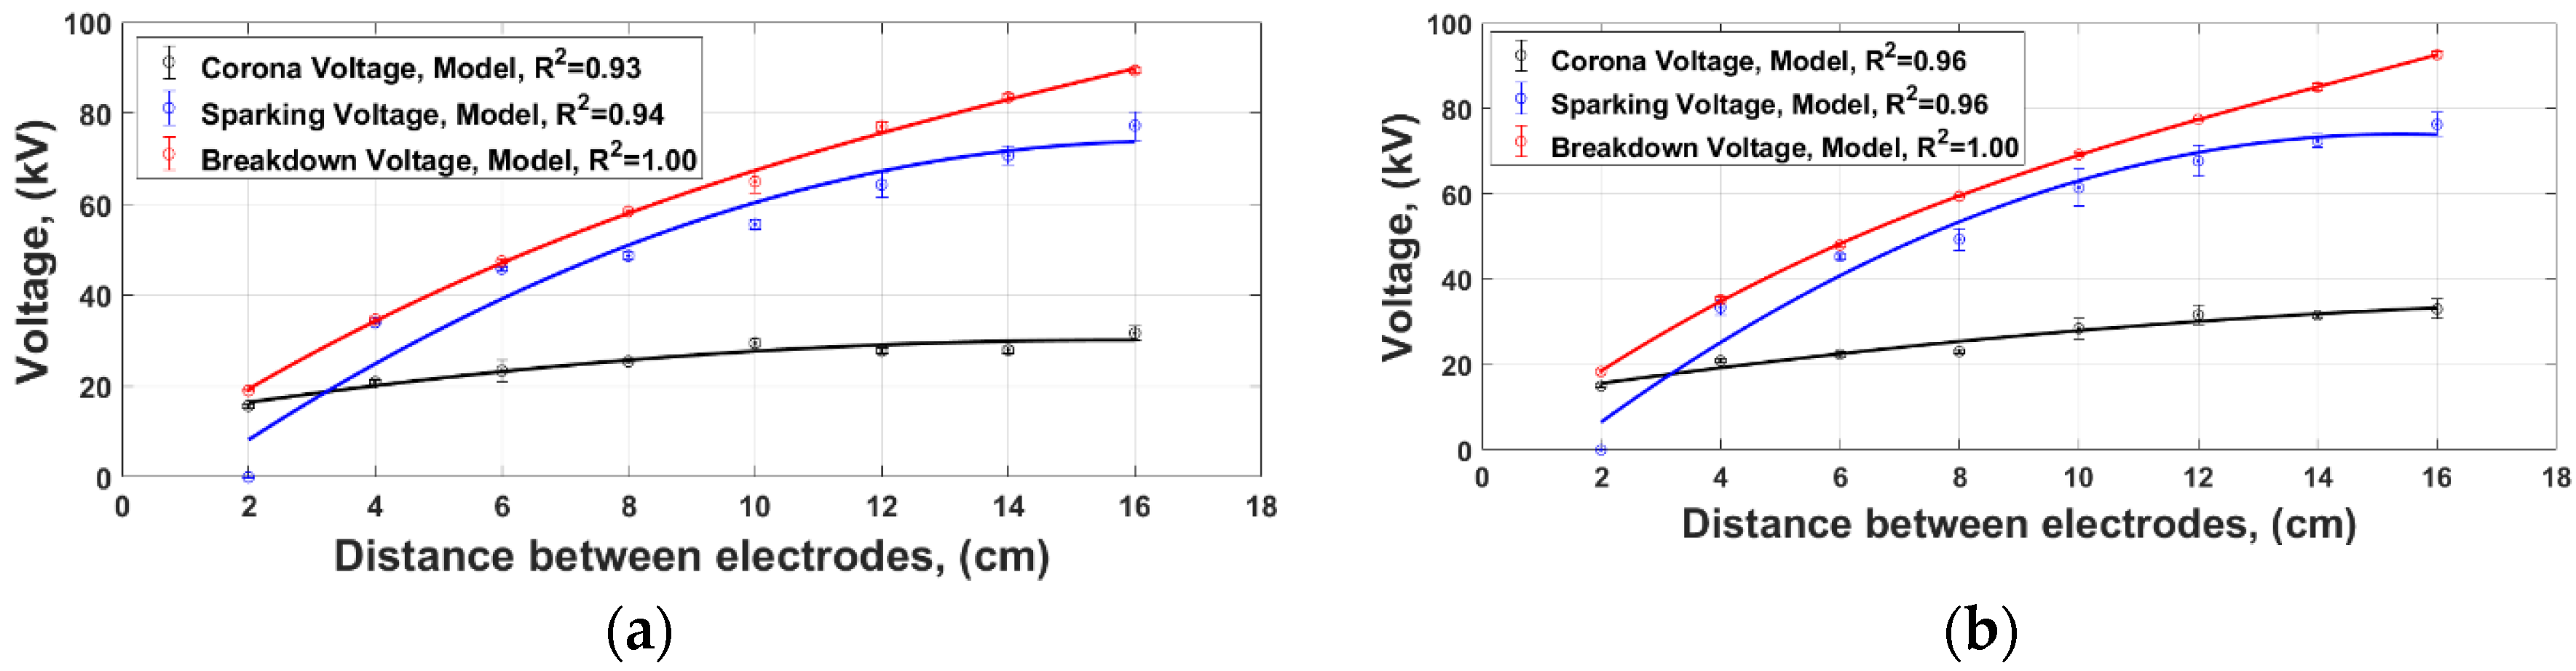
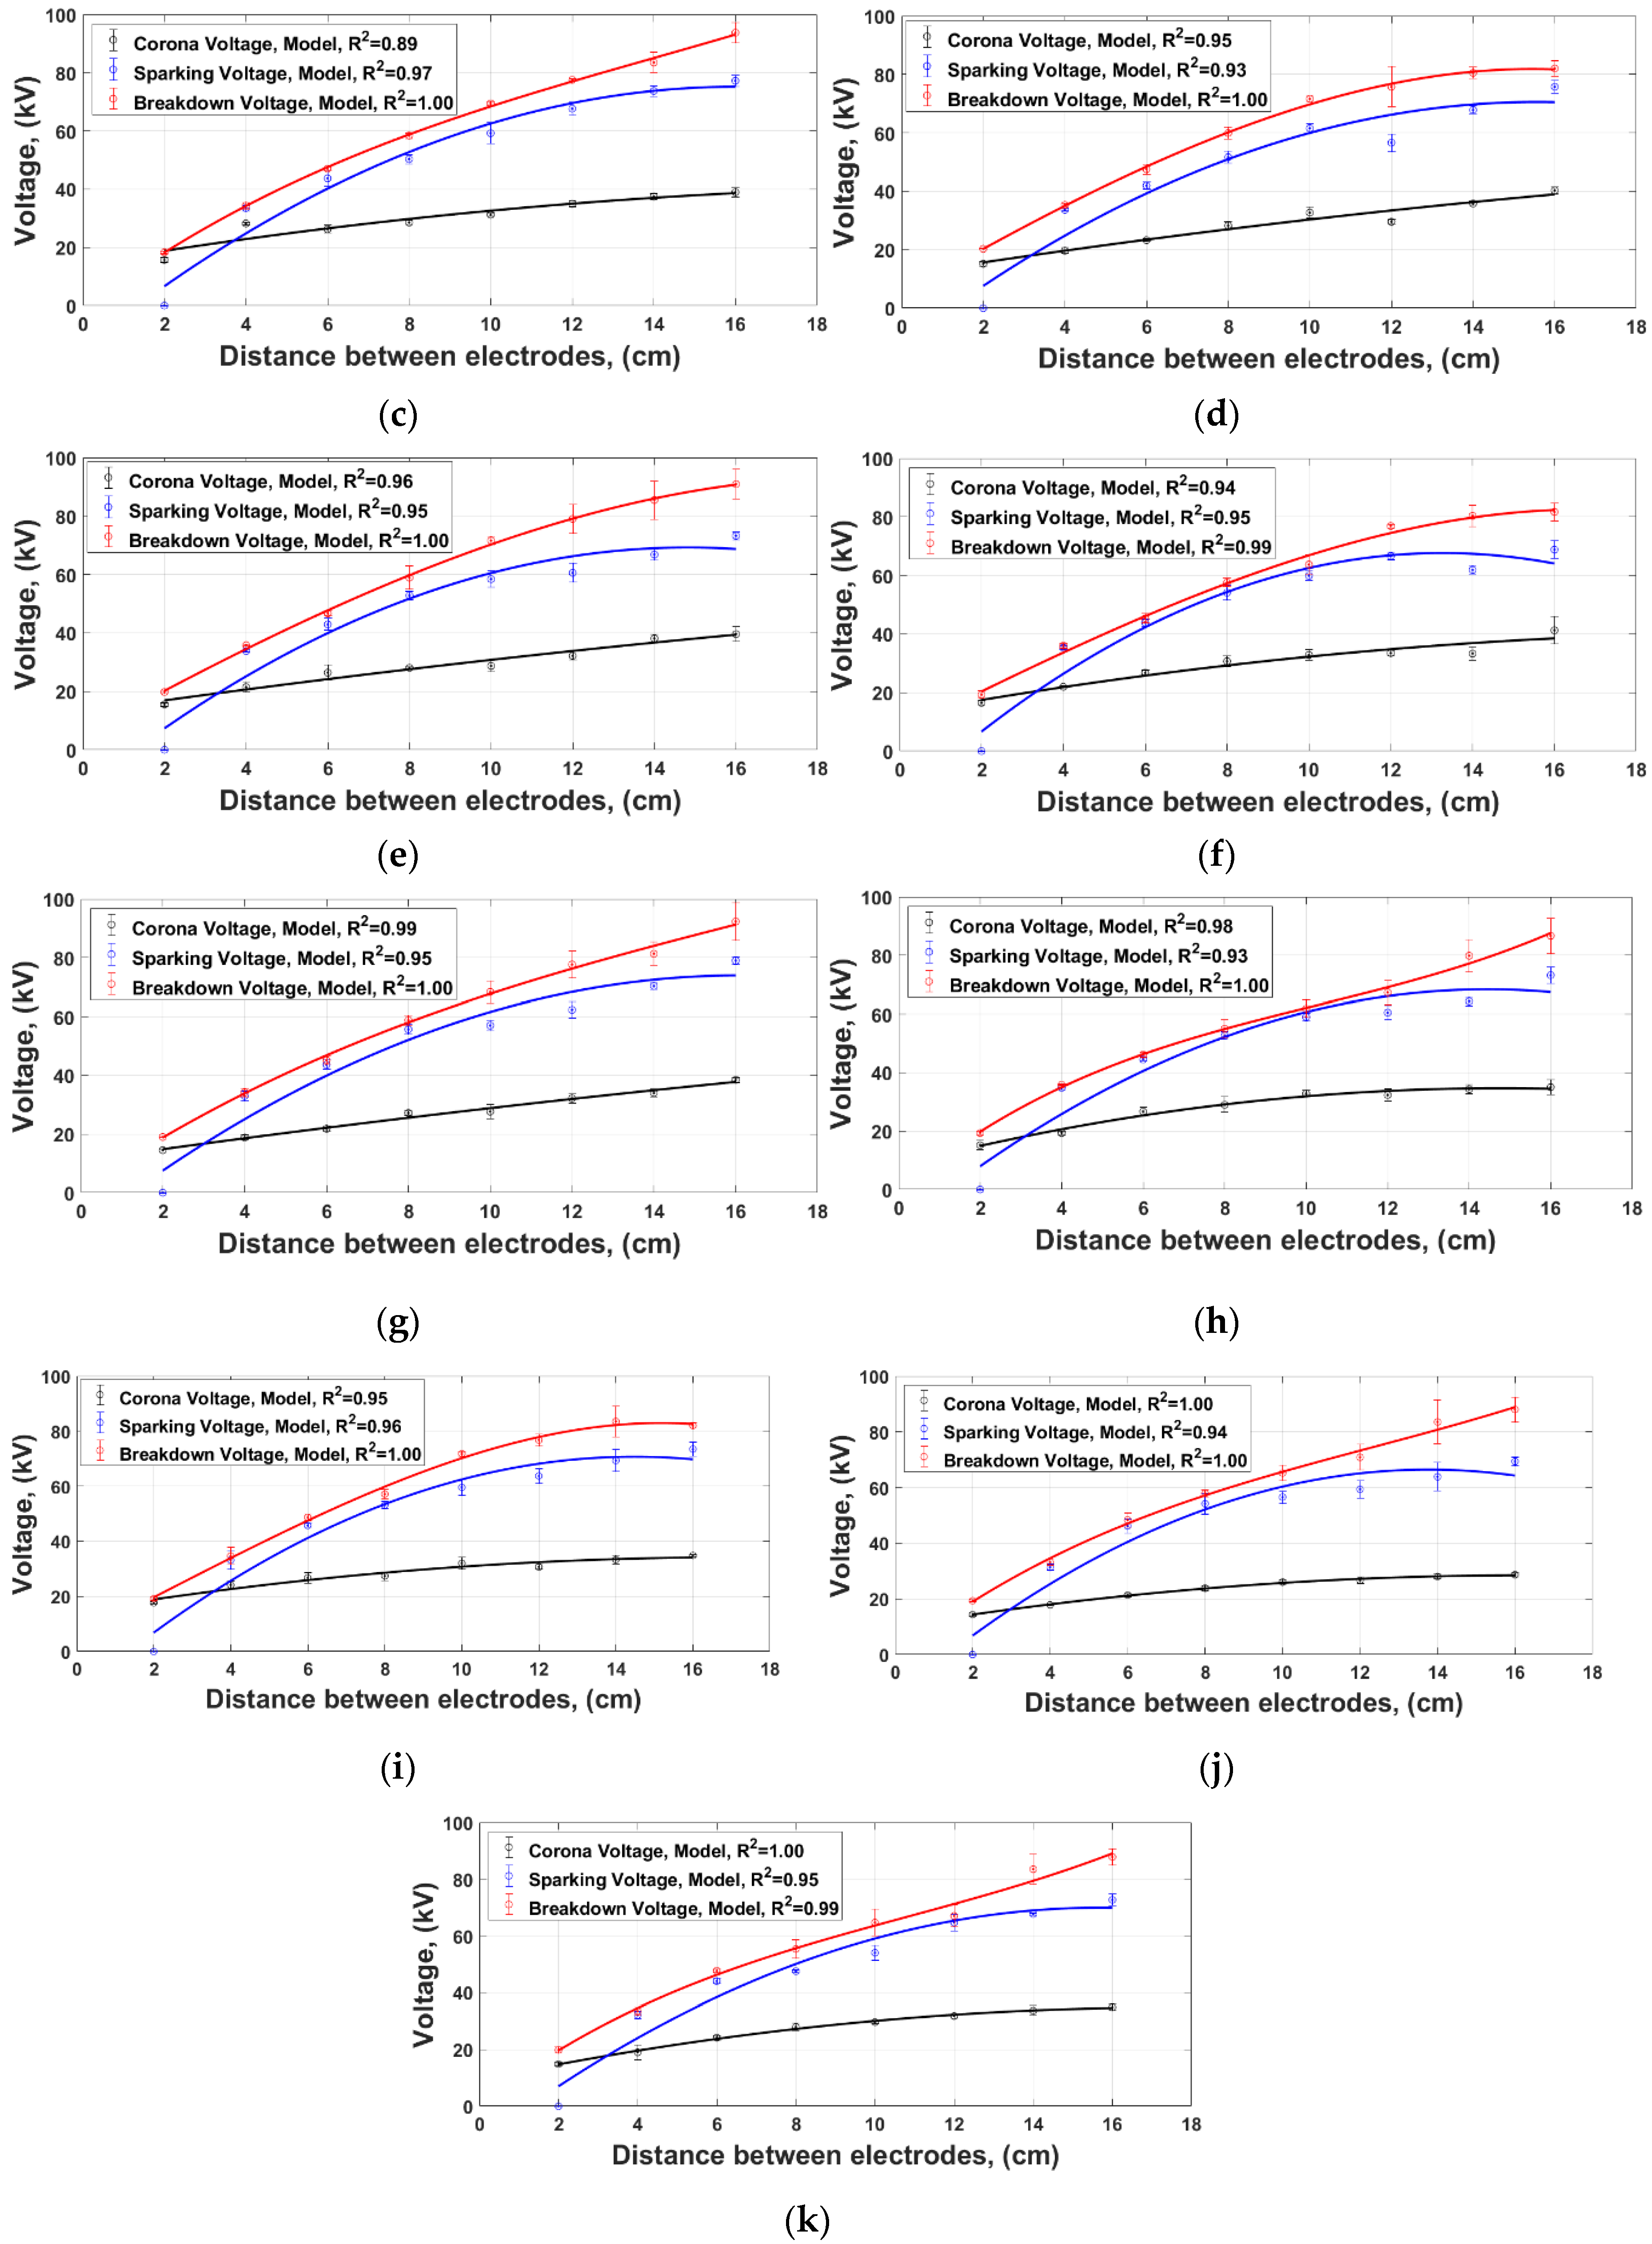
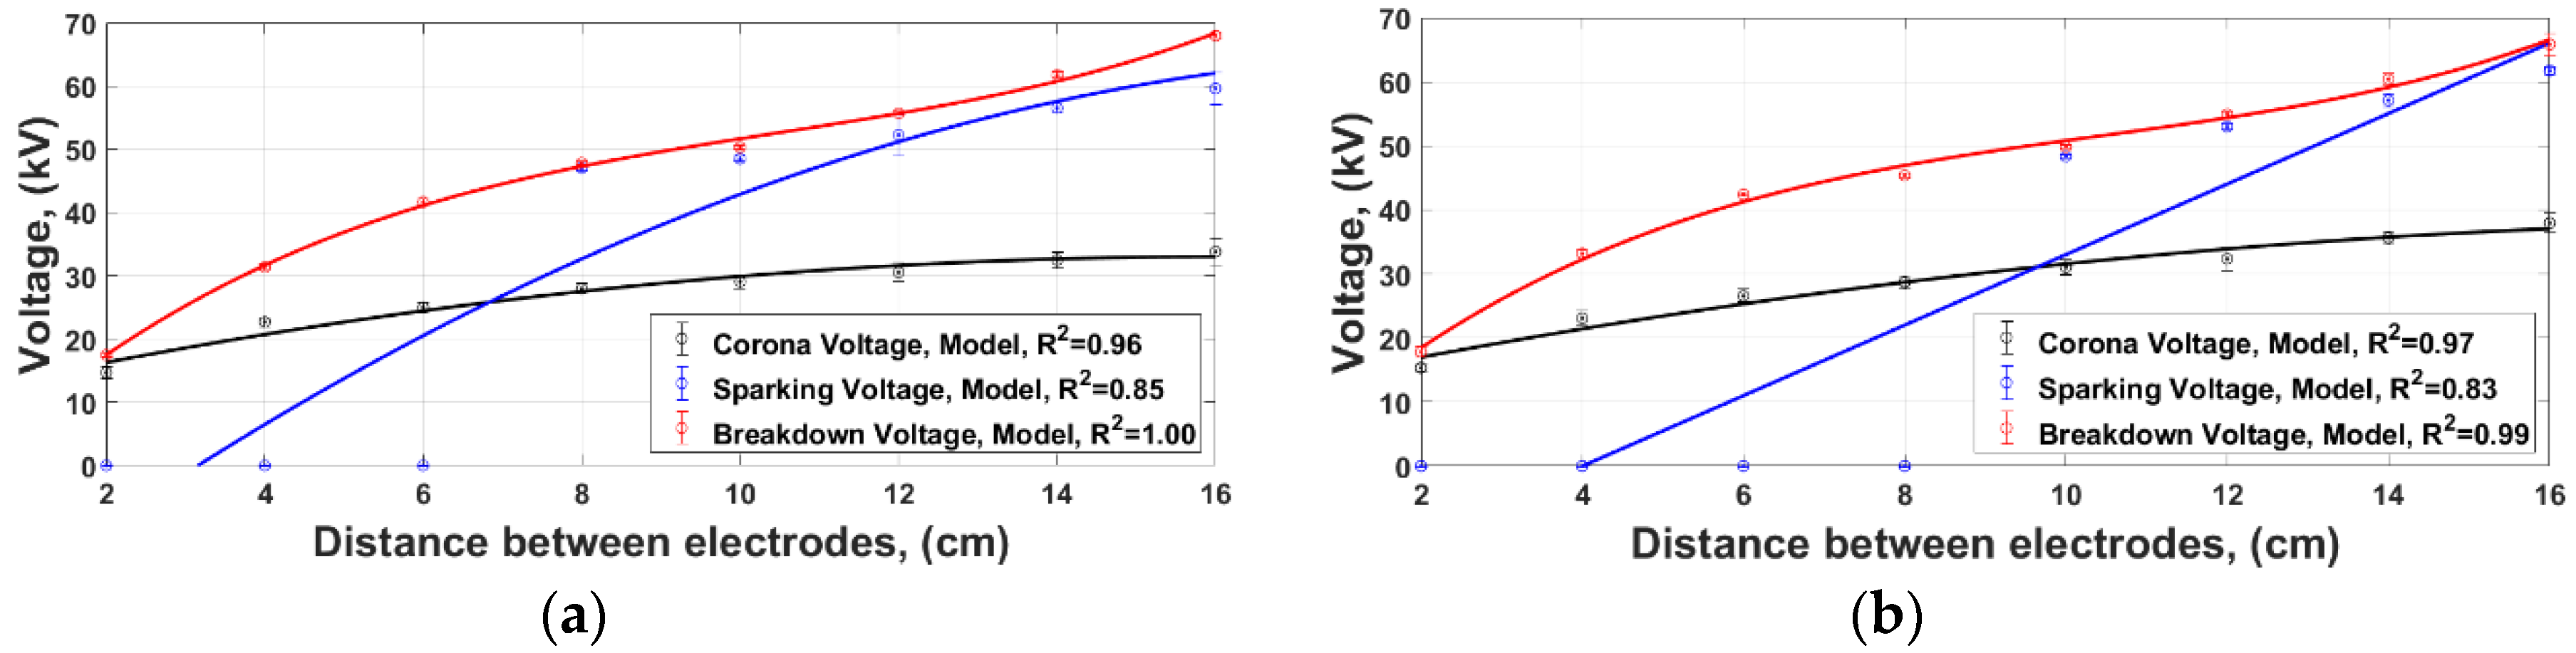
3. Results of Measurements of Characteristic Voltages of Partial Discharges Generated between Drill-Type and Needle Electrodes in Different Geometries

Figure 5 shows the results of the measurements of voltages Uo, Us and Ub as a function of the distance between electrodes, obtained in the systems of drill-type electrodes of different diameters d: a—0.5 mm, b—0.6 mm, c—0.7 mm, d—0.8 mm, e—0.9 mm, f—1.0 mm, g—1.1 mm, h—1.2 mm, i—1.3 mm, j—1.4 mm, k = 1.5 mm. For comparison of the results obtained in the measurements with the use of drill-type electrodes (Figure 5), Figure 6 presents results of the measurements of characteristic voltage discharges generated in the needle spark gaps, with two different needle angles: α = 20° and α = 45°.
The same results, but in an approach allowing for an accurate comparison of the voltage values for the three selected distances (8 cm, 12 cm and 16 cm) between the selected electrodes, are shown in Figure 7 and Figure 8.
Figure 9 and Figure 10 show the spatial distribution of the obtained results. In this approach, the results obtained in the measurements made in systems with drill-type electrodes, as well as in systems with needle electrodes, are presented in comparison. The combined analysis of the presented results makes it possible to compare Uo, Us, Ub voltages, and consequently, to compare the effectiveness of their ionization. It also enables the comparison of drill-type and needle spark gaps of different geometries in this respect.

4. Analysis and Interpretation of Results

Figure 5 shows the dependence of the voltage values Uo, Us, Ub on the distance between electrodes for eleven systems of drill-type electrodes of different diameters. Distances between electrodes are expressed in centimeters and values of Uo, Us, Ub are expressed in kilovolts. In Figure 5, each of the eleven presentations (from a to k) shows three waveforms. The first shows the Uo voltage waveform as a function of the distance between electrodes, the second shows the Us voltage waveform and the third shows the Ub voltage waveform. The presentations demonstrated in Figure 5 enable the evaluation of results obtained, both in terms of compliance with the data published in the literature and compliance with the physical understanding of the mechanism of the development of partial discharges occurring in fields of non-uniform intensity. In diagrams shown in Figure 5, at each measuring point the calculated standard deviation of the results is marked. After the analysis of the variability of waveforms, it can be concluded that the values of their standard deviations are small, while their maximum values do not exceed 10% of the measured voltage. The analysis of results of Uo, Us and Ub voltage measurements generated in drill-type electrode systems shows that differences in values of individual waveforms are subtle and a different approach is necessary to make them visible.
It should be noted here that the voltage measurements are point-based (one point for each distance between electrodes) and as such should be represented on diagrams as single points (or bars). For the purpose of the analysis, the registered measuring points are described with regression curves, which represent models of Uo, Us and Ub voltage waveforms as a function of distance between electrodes.
Models of the corona voltage Uo, over the whole range of measured distances (up to 16 cm), regardless of the diameter of the drill-type electrodes, are difficult to distinguish, the waveforms overlap.
A comparison of the models of the waveforms of the sparking voltages occurring in the systems of drill-type electrodes of different diameters indicates an equal course of these relationships in the range from 2 cm to 12 cm. At longer distances between electrodes (12 to 16 cm), waveforms of the voltage models are clearly distinguishable.
Figure 5 also shows the model waveforms of the breakdown voltage values Ub for the eleven tested systems of drill-type electrodes. In terms of safety, knowing the dependence of the breakdown voltage Ub on the distance between the drill-type electrodes, is the most important. The comparison shows that initially, up to a distance of 6 cm, regardless of the diameter of the drill-type electrodes, waveforms are very similar. With the distances of the drill-type electrodes above 6 cm, curves vary – differences in the breakdown voltage values Ub reach about 10%. The highest values of the breakdown voltage between drill-type electrodes are found for drill-type electrode systems with a diameter of 0.7, 0.8 and 0.9 mm.
Comparative characteristics relating to the corona voltage, sparking voltage Us and breakdown voltage Ub occurring between needle electrodes with two different needle angles are shown in Figure 6. Relationships relating to these spark gaps are similar to those shown in Figure 5. In order to compare waveforms recorded in the drill-type and needle spark gaps and to show differences between them, the exact values of Uo, Us and Ub voltages for the three selected distances (8 cm, 12 cm and 16 cm) between electrodes are presented in Figure 7 and Figure 8 for each of the examined systems. For example, for drill-type spark gaps (Figure 7a) with a distance between the electrodes of 8 cm, the highest value of breakdown voltage Ub is 59.9 kV (for electrodes with 0.8 mm diameter), the lowest value is 55.0 kV (for electrodes with 1.2 mm diameter), the maximum scatter of results for the eleven tested pairs is approximately 6%. At a distance of 12 cm between the drill-type electrodes (Figure 7b), the voltage Ub values are, respectively: highest 79.04 kV (electrode diameters 0.9 mm) and lowest 67.0 kV (electrode diameters 1.5 mm), and the maximum scatter of results is 9%. For a distance of 16 cm between the drill-type electrodes (Figure 7c) the highest Ub value is 93.72 kV (electrode diameters 0.7 mm), the lowest value is 81.68 kV (electrode diameters 1.0 mm) and the scatter of results is 7%. In a similar way, it is possible to trace the variability of each of the characteristic voltages, both for drill-type electrode systems (Figure 7) and for the needle electrode systems (Figure 8).
In order to facilitate the analysis and formulation of general conclusions from the bar graphs shown in Figure 7 and Figure 8, mean values and standard deviations were calculated for each characteristic voltage and for each electrode system. Results are presented in Table 1.
The obtained results, in a very synthetic form, are also presented as three-dimensional distributions (Figure 9). These distributions refer, respectively, to the corona voltage (Figure 9a), sparking voltage (Figure 9b), and breakdown voltage (Figure 9c). The advantage of the presented three-dimensional systems is the fact that they enable the simultaneous determination of the influence on the values of the recorded voltage of the distance between electrodes, the diameters of the drill-type electrodes, and the angles of the needle electrodes.
In Figure 9 and Figure 10, the maximum values are represented by red and the zero values by blue. The presented three-dimensional distributions effectively visualize the areas where the highest and lowest characteristic voltage values have been recorded. The analysis of results presented in the form of three-dimensional distributions confirm conclusions drawn when interpreting the collective waveforms of characteristic voltages (Figure 5, Figure 6, Figure 7 and Figure 8).

5. Conclusions

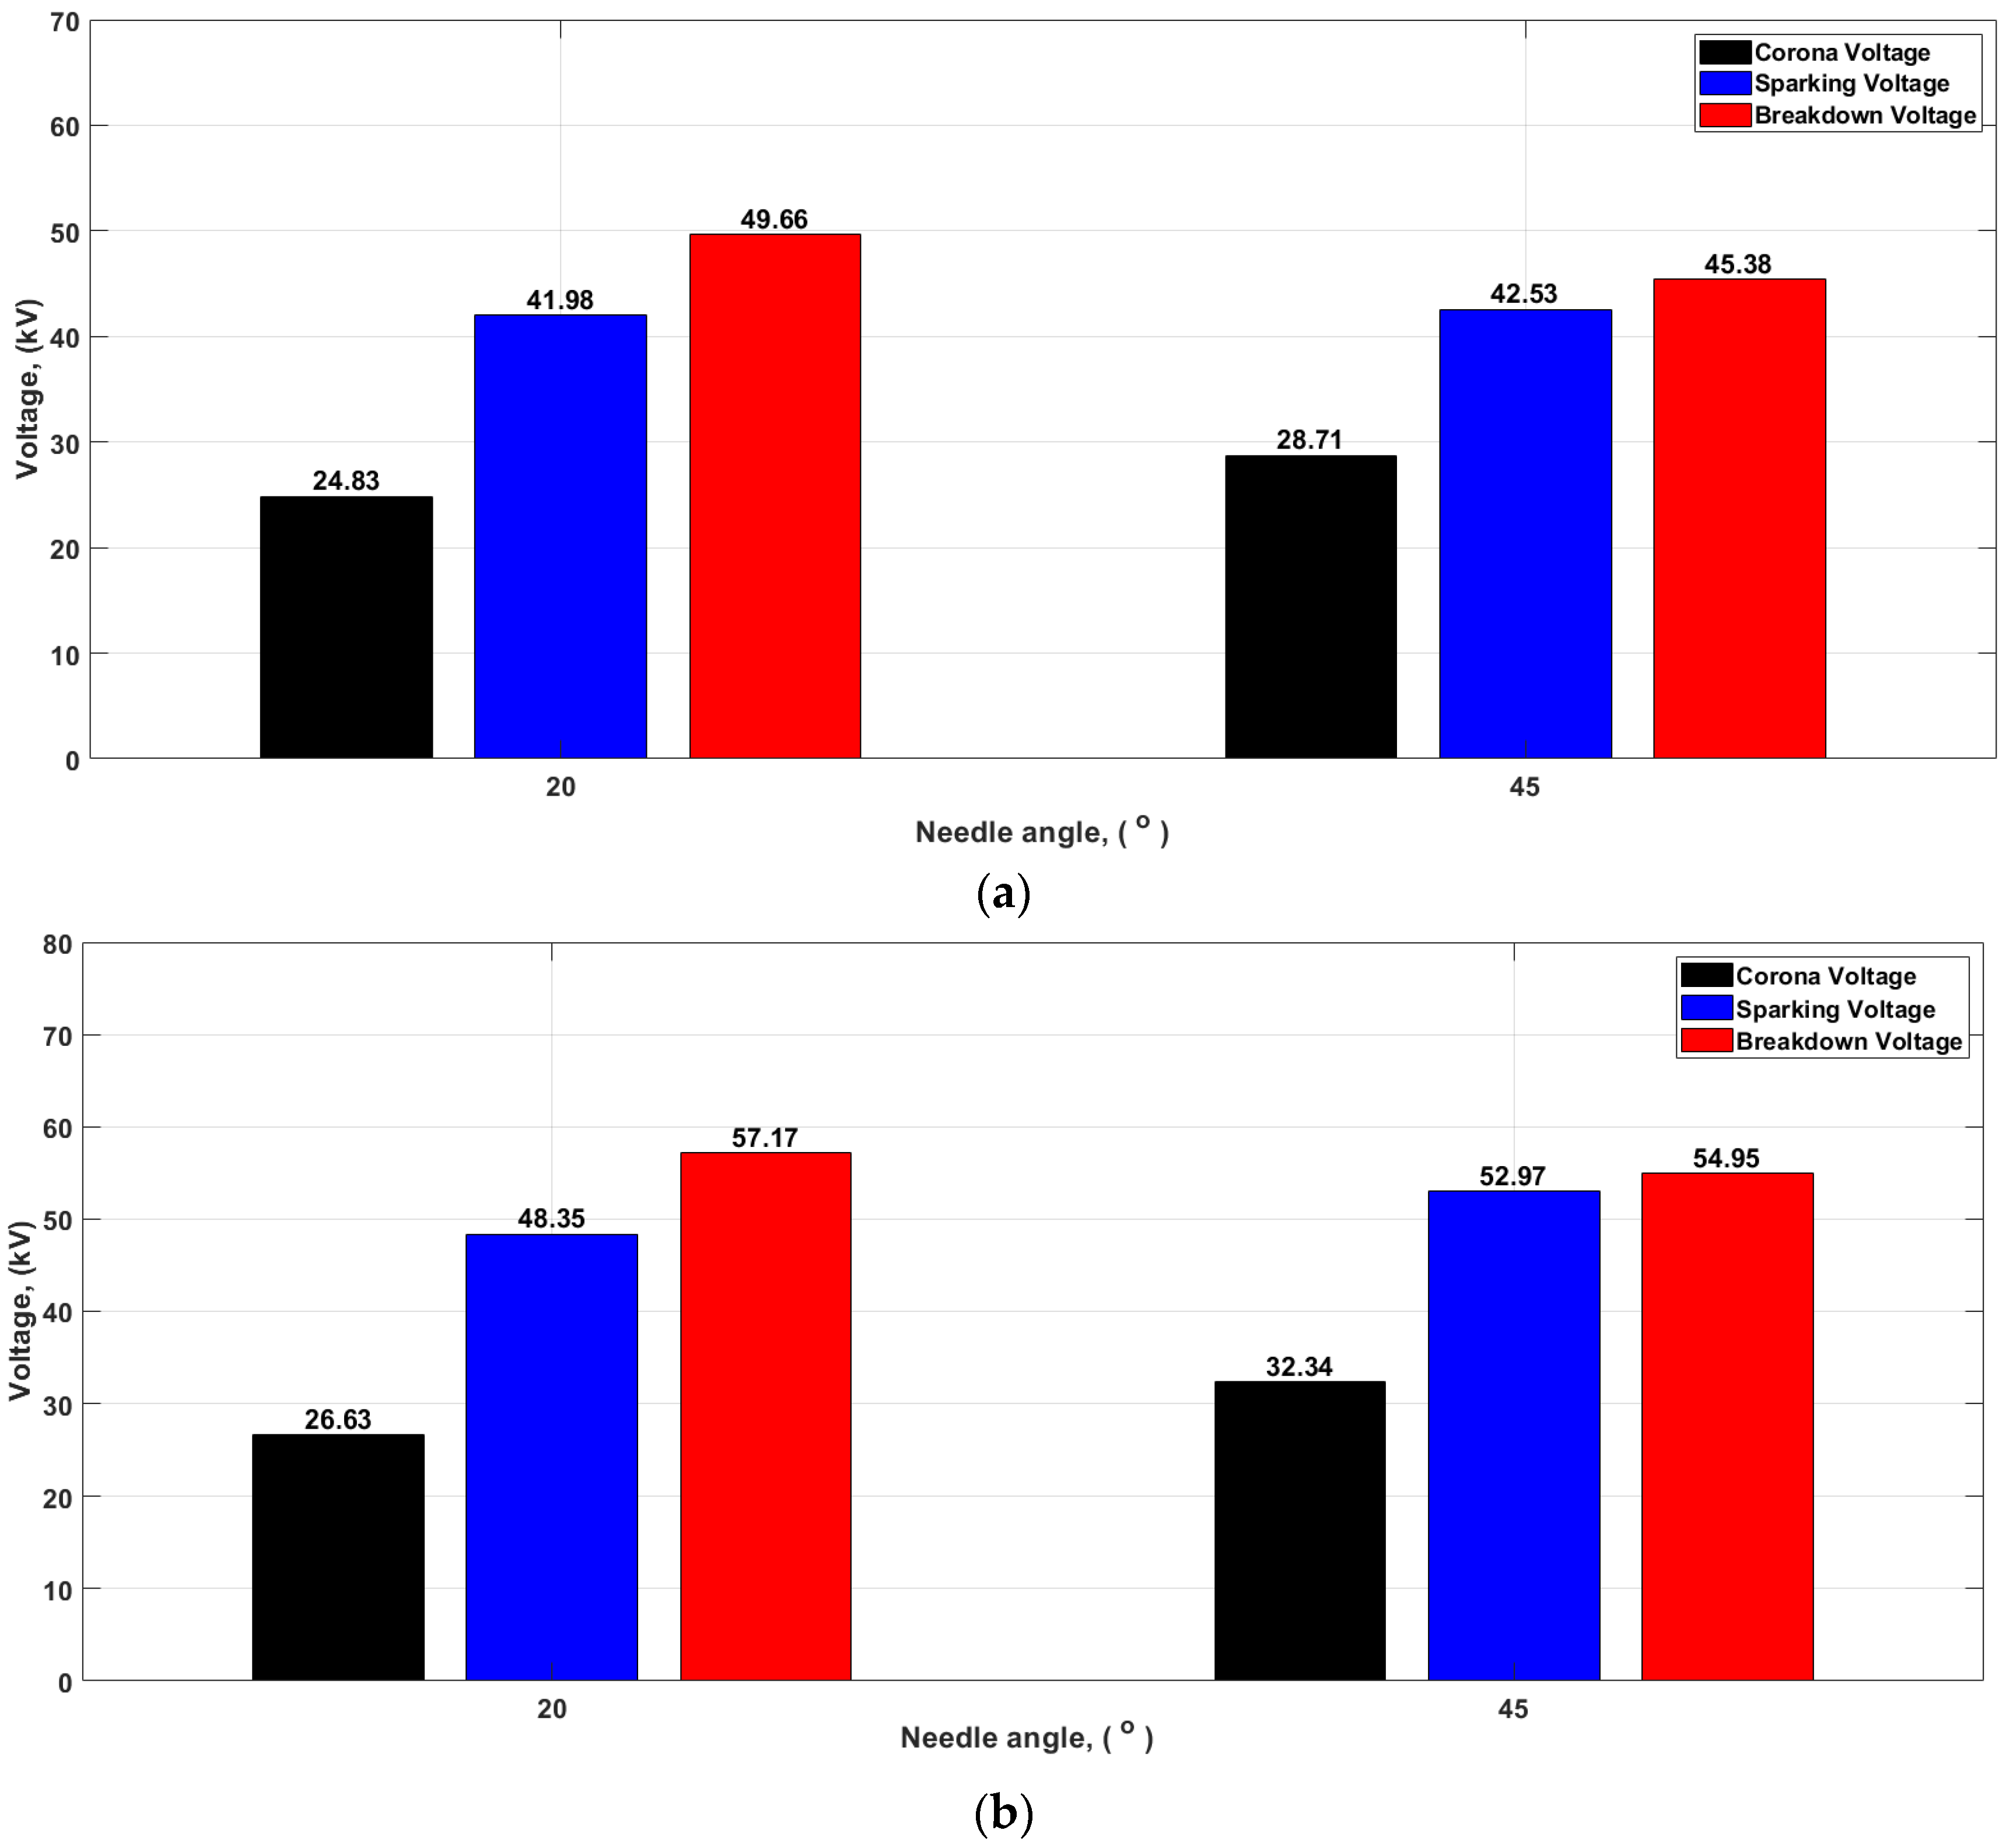
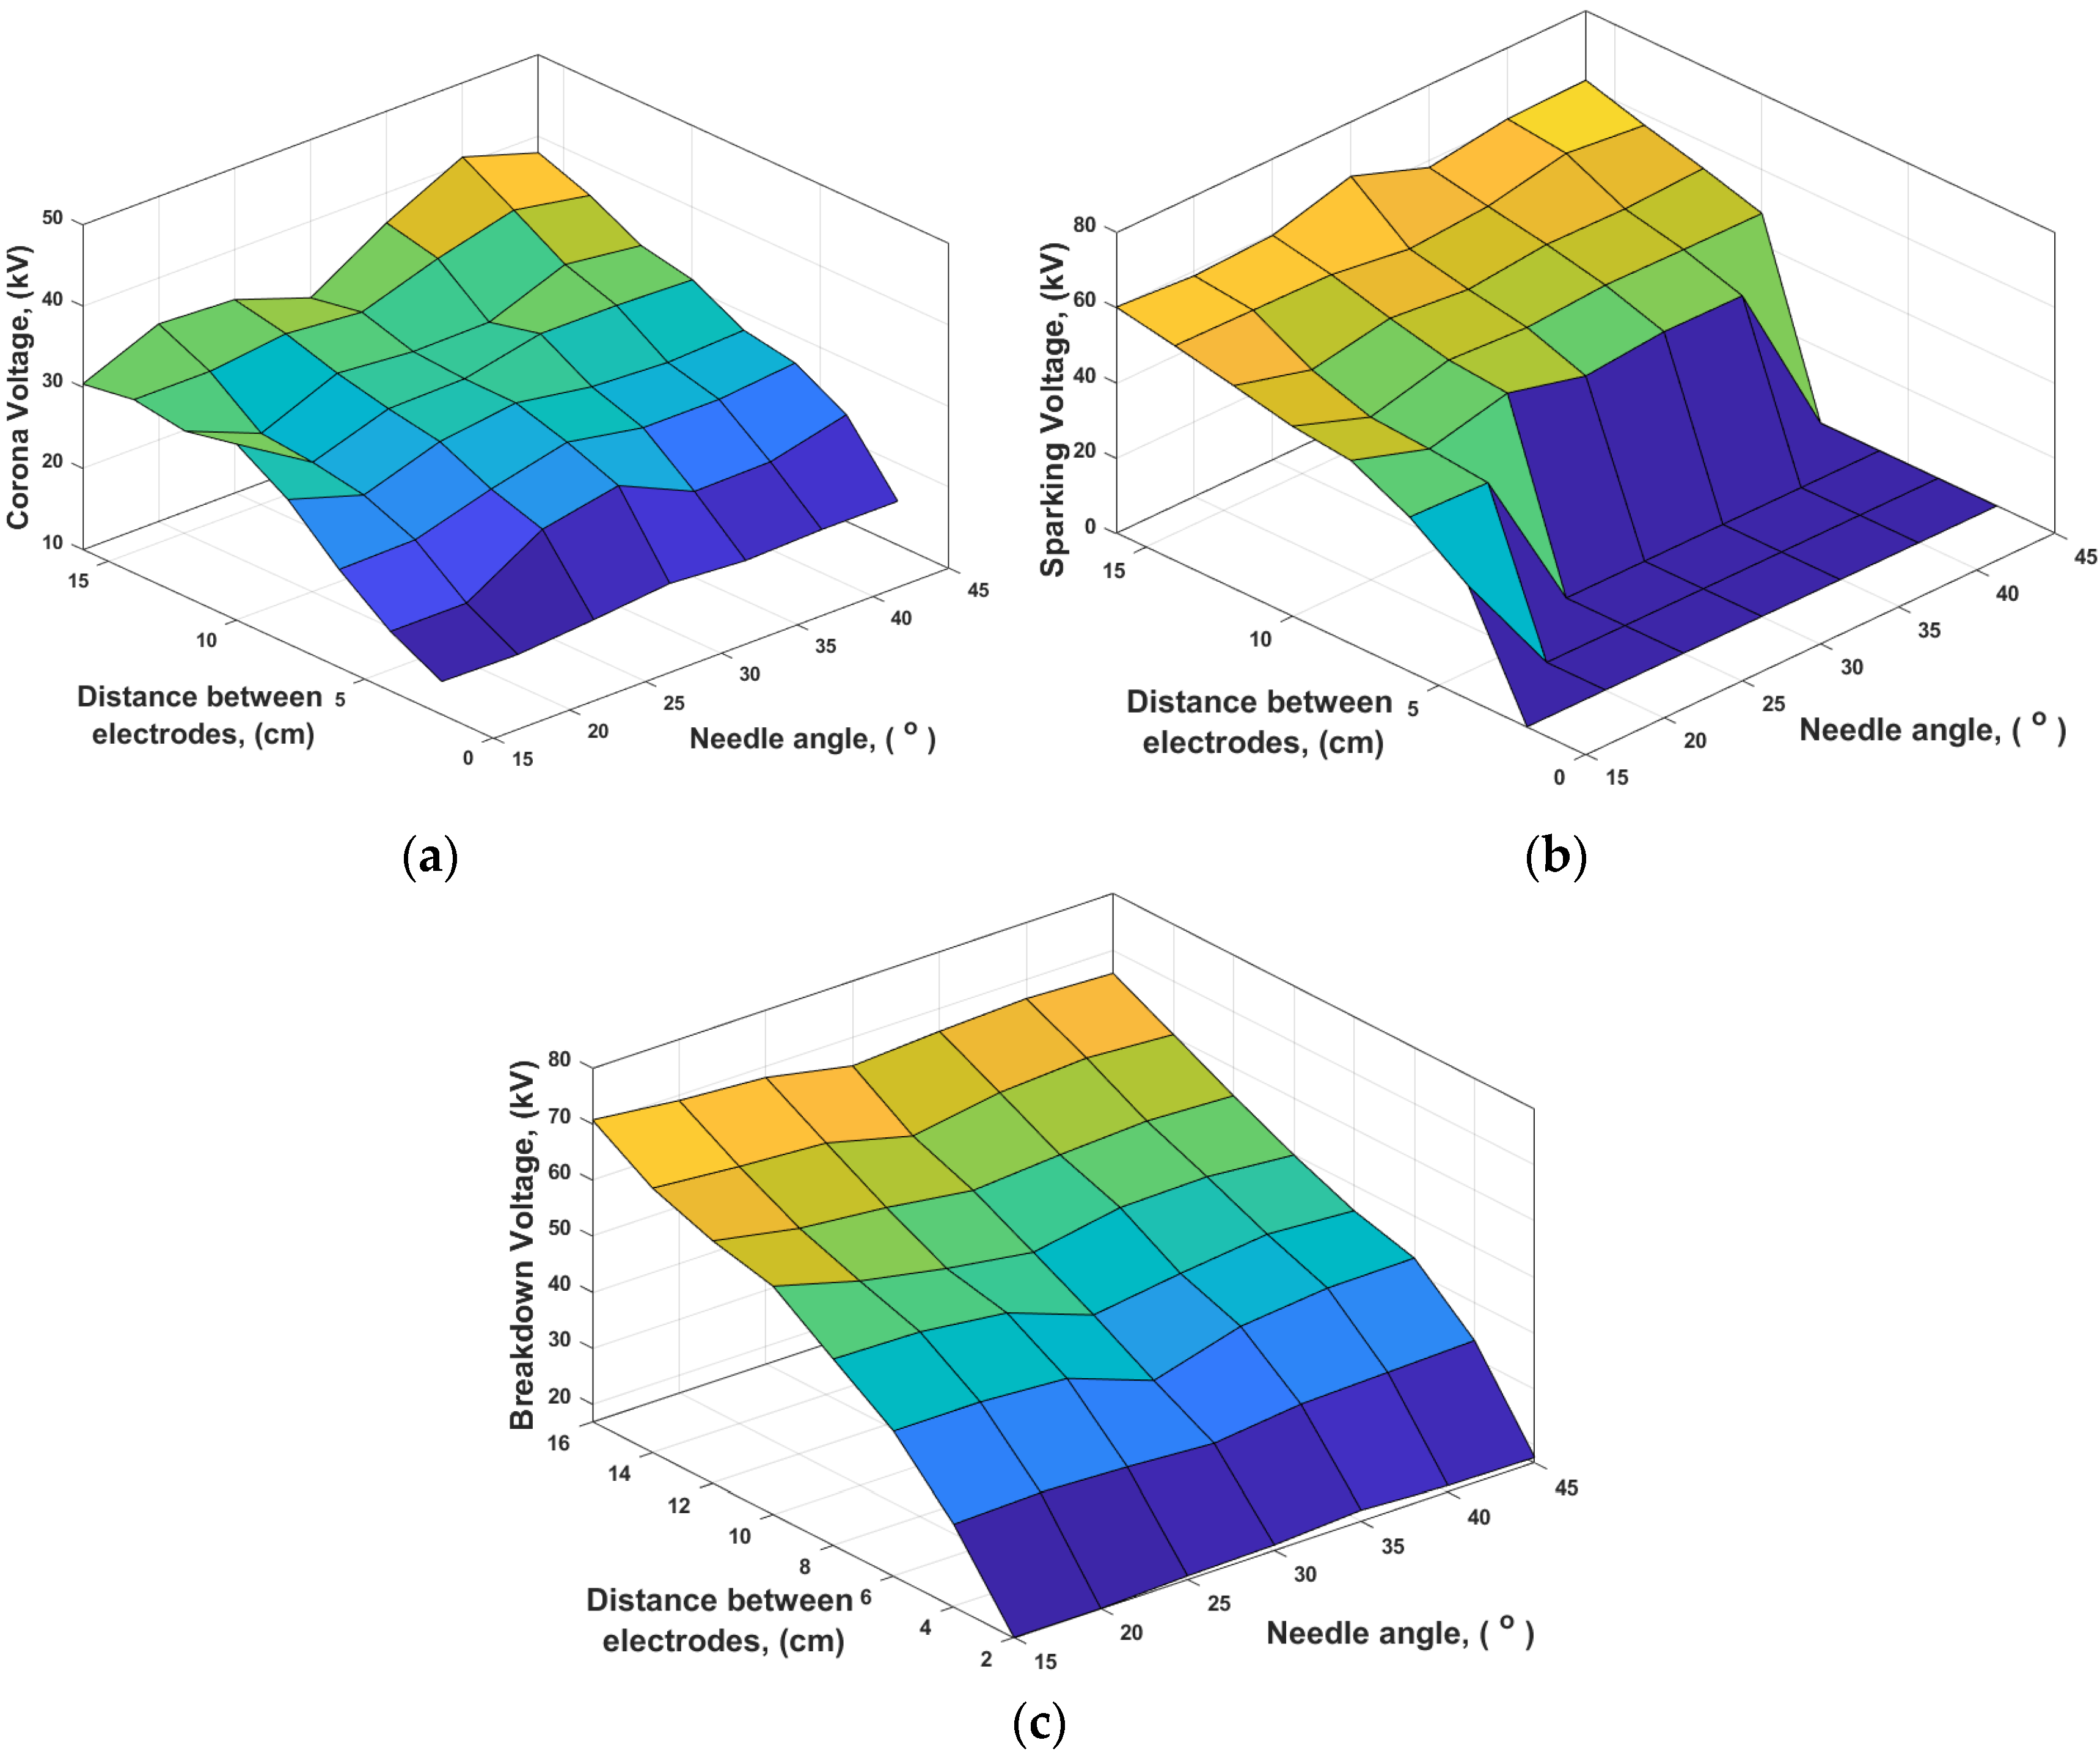
  • Results of air strength measurements in non-homogeneous fields between the drill-type electrodes are similar to results characterizing air strength in electric fields between the needle electrodes.
  • The strength of the air (the value of the breakdown voltage Ub) between the drill-type electrodes is higher than that of the needle systems. This difference is more evident in a system with needle electrodes with a larger needle angle generated between the corona electrodes with the cone angle 45°, the difference is between 22% and 27%. In a needle system with electrodes with the 20° angle, these differences range from 14% to 24%.
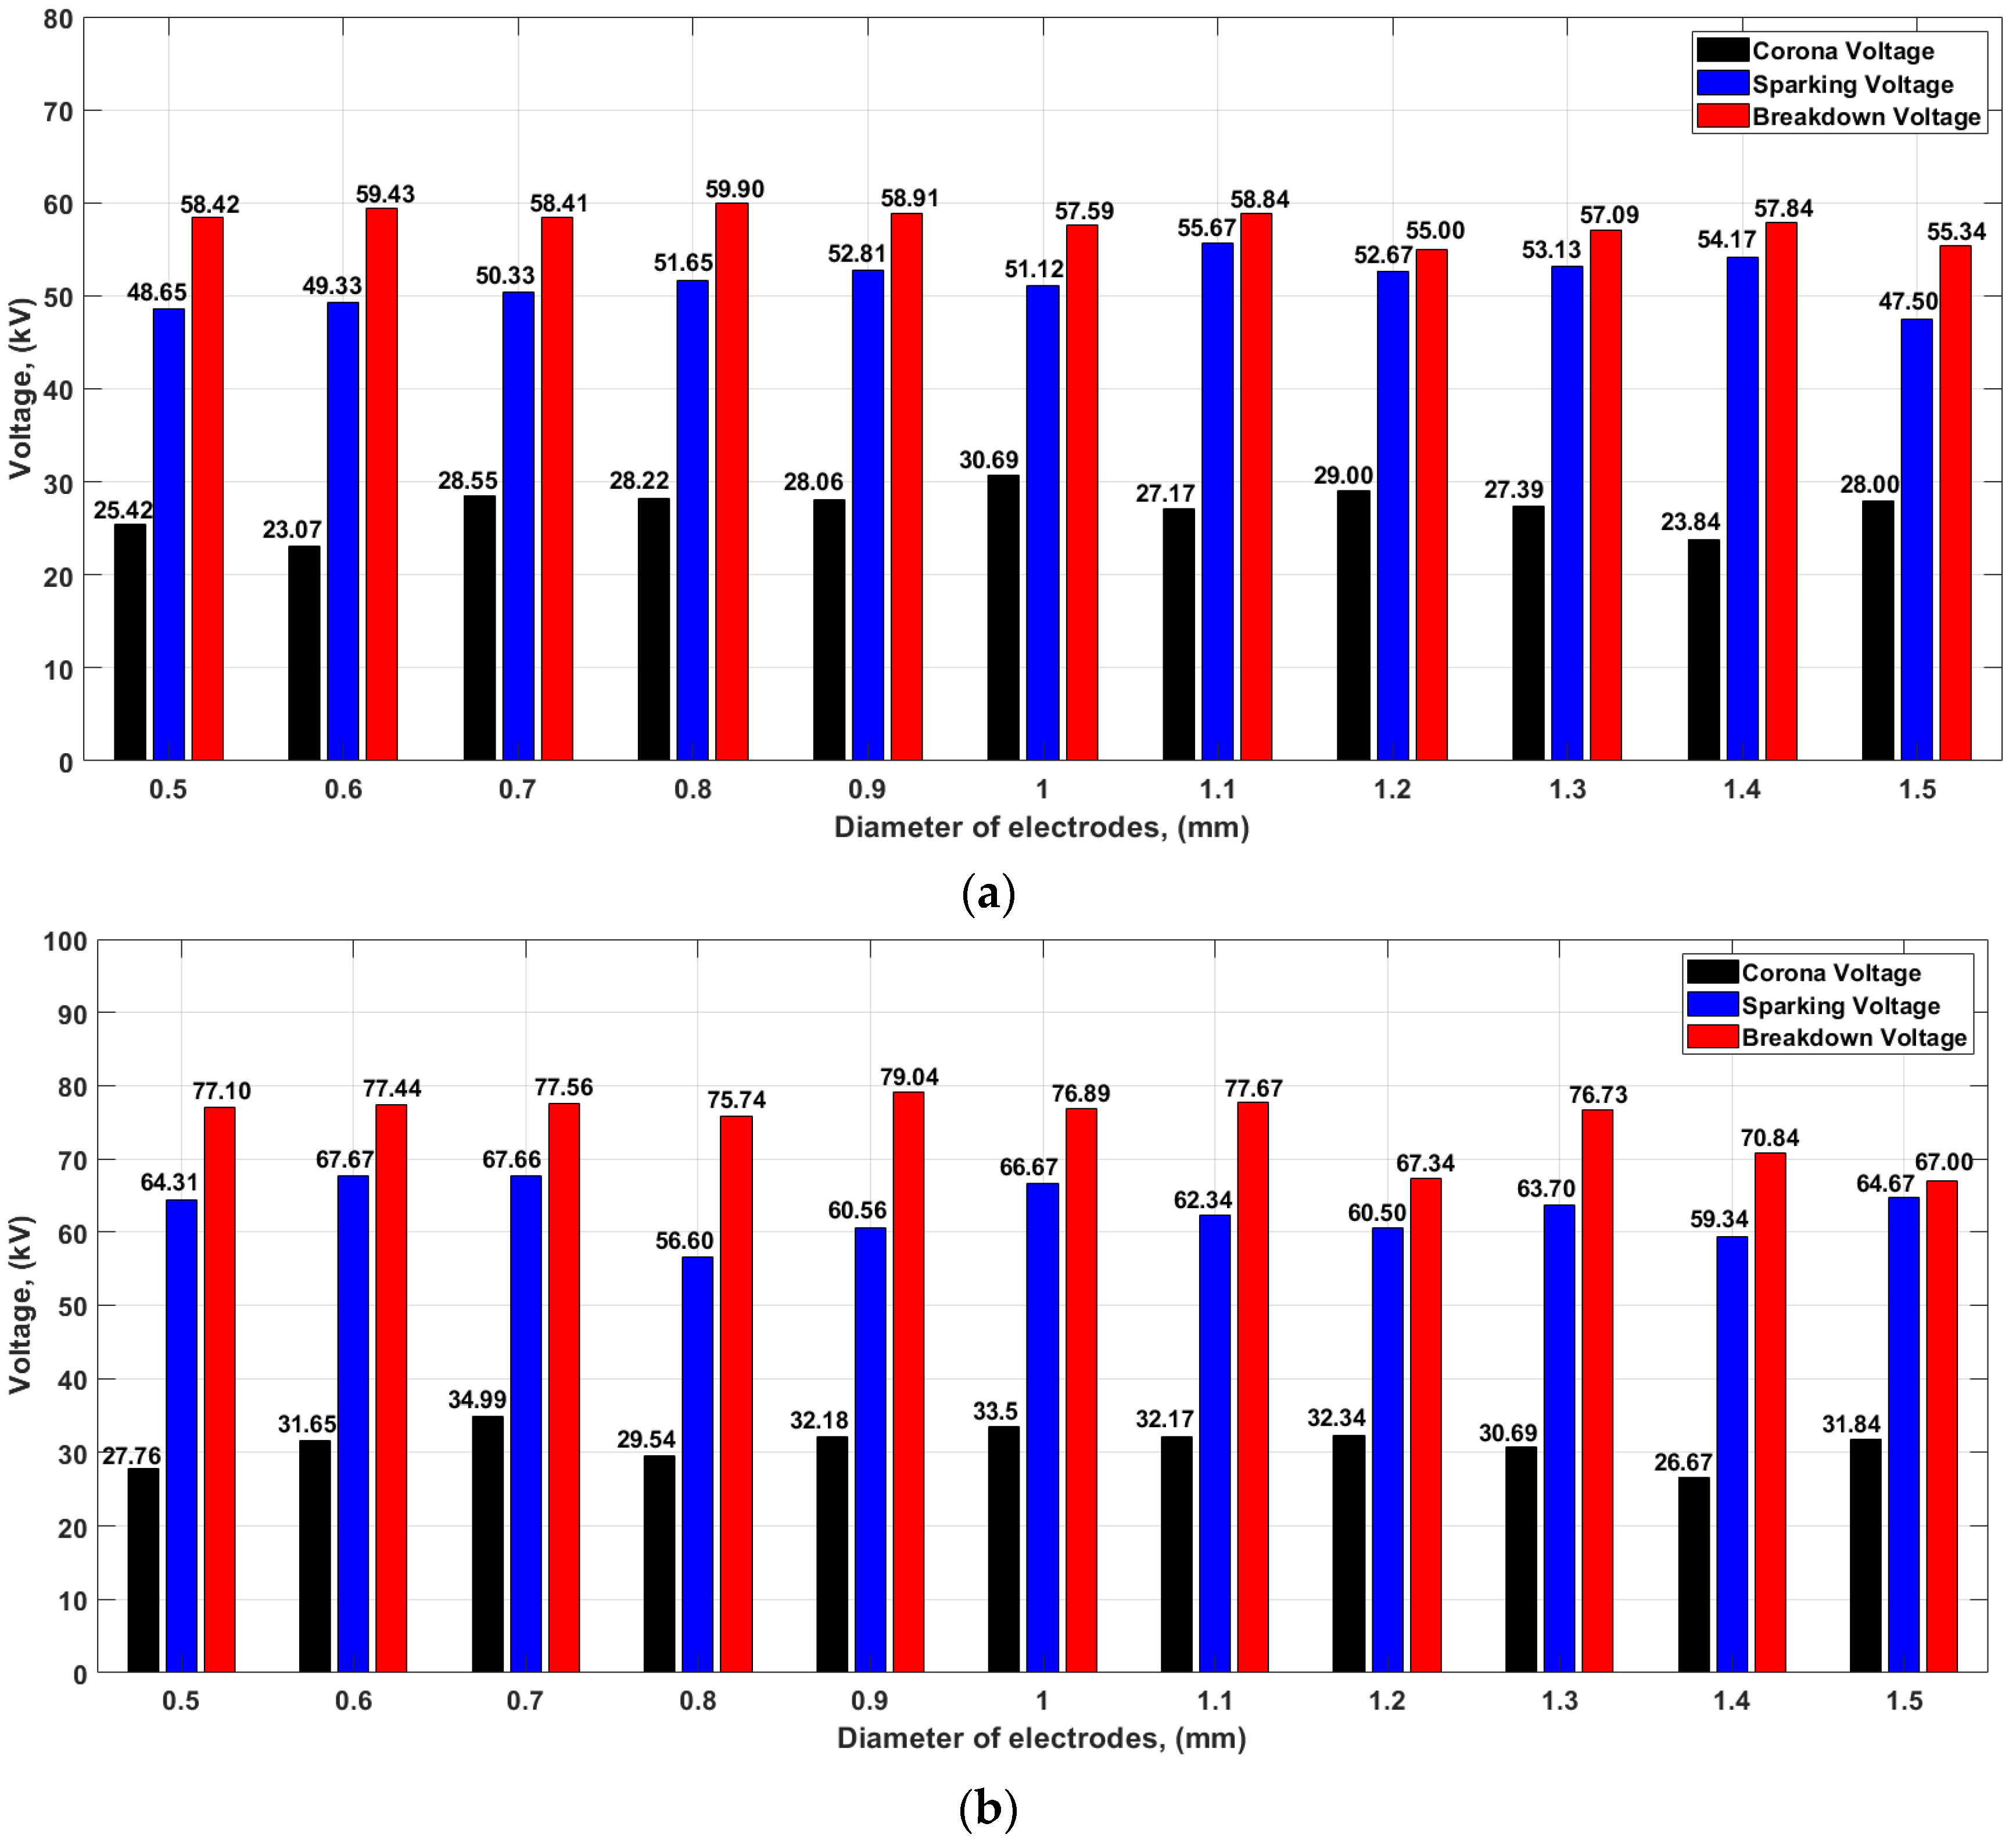
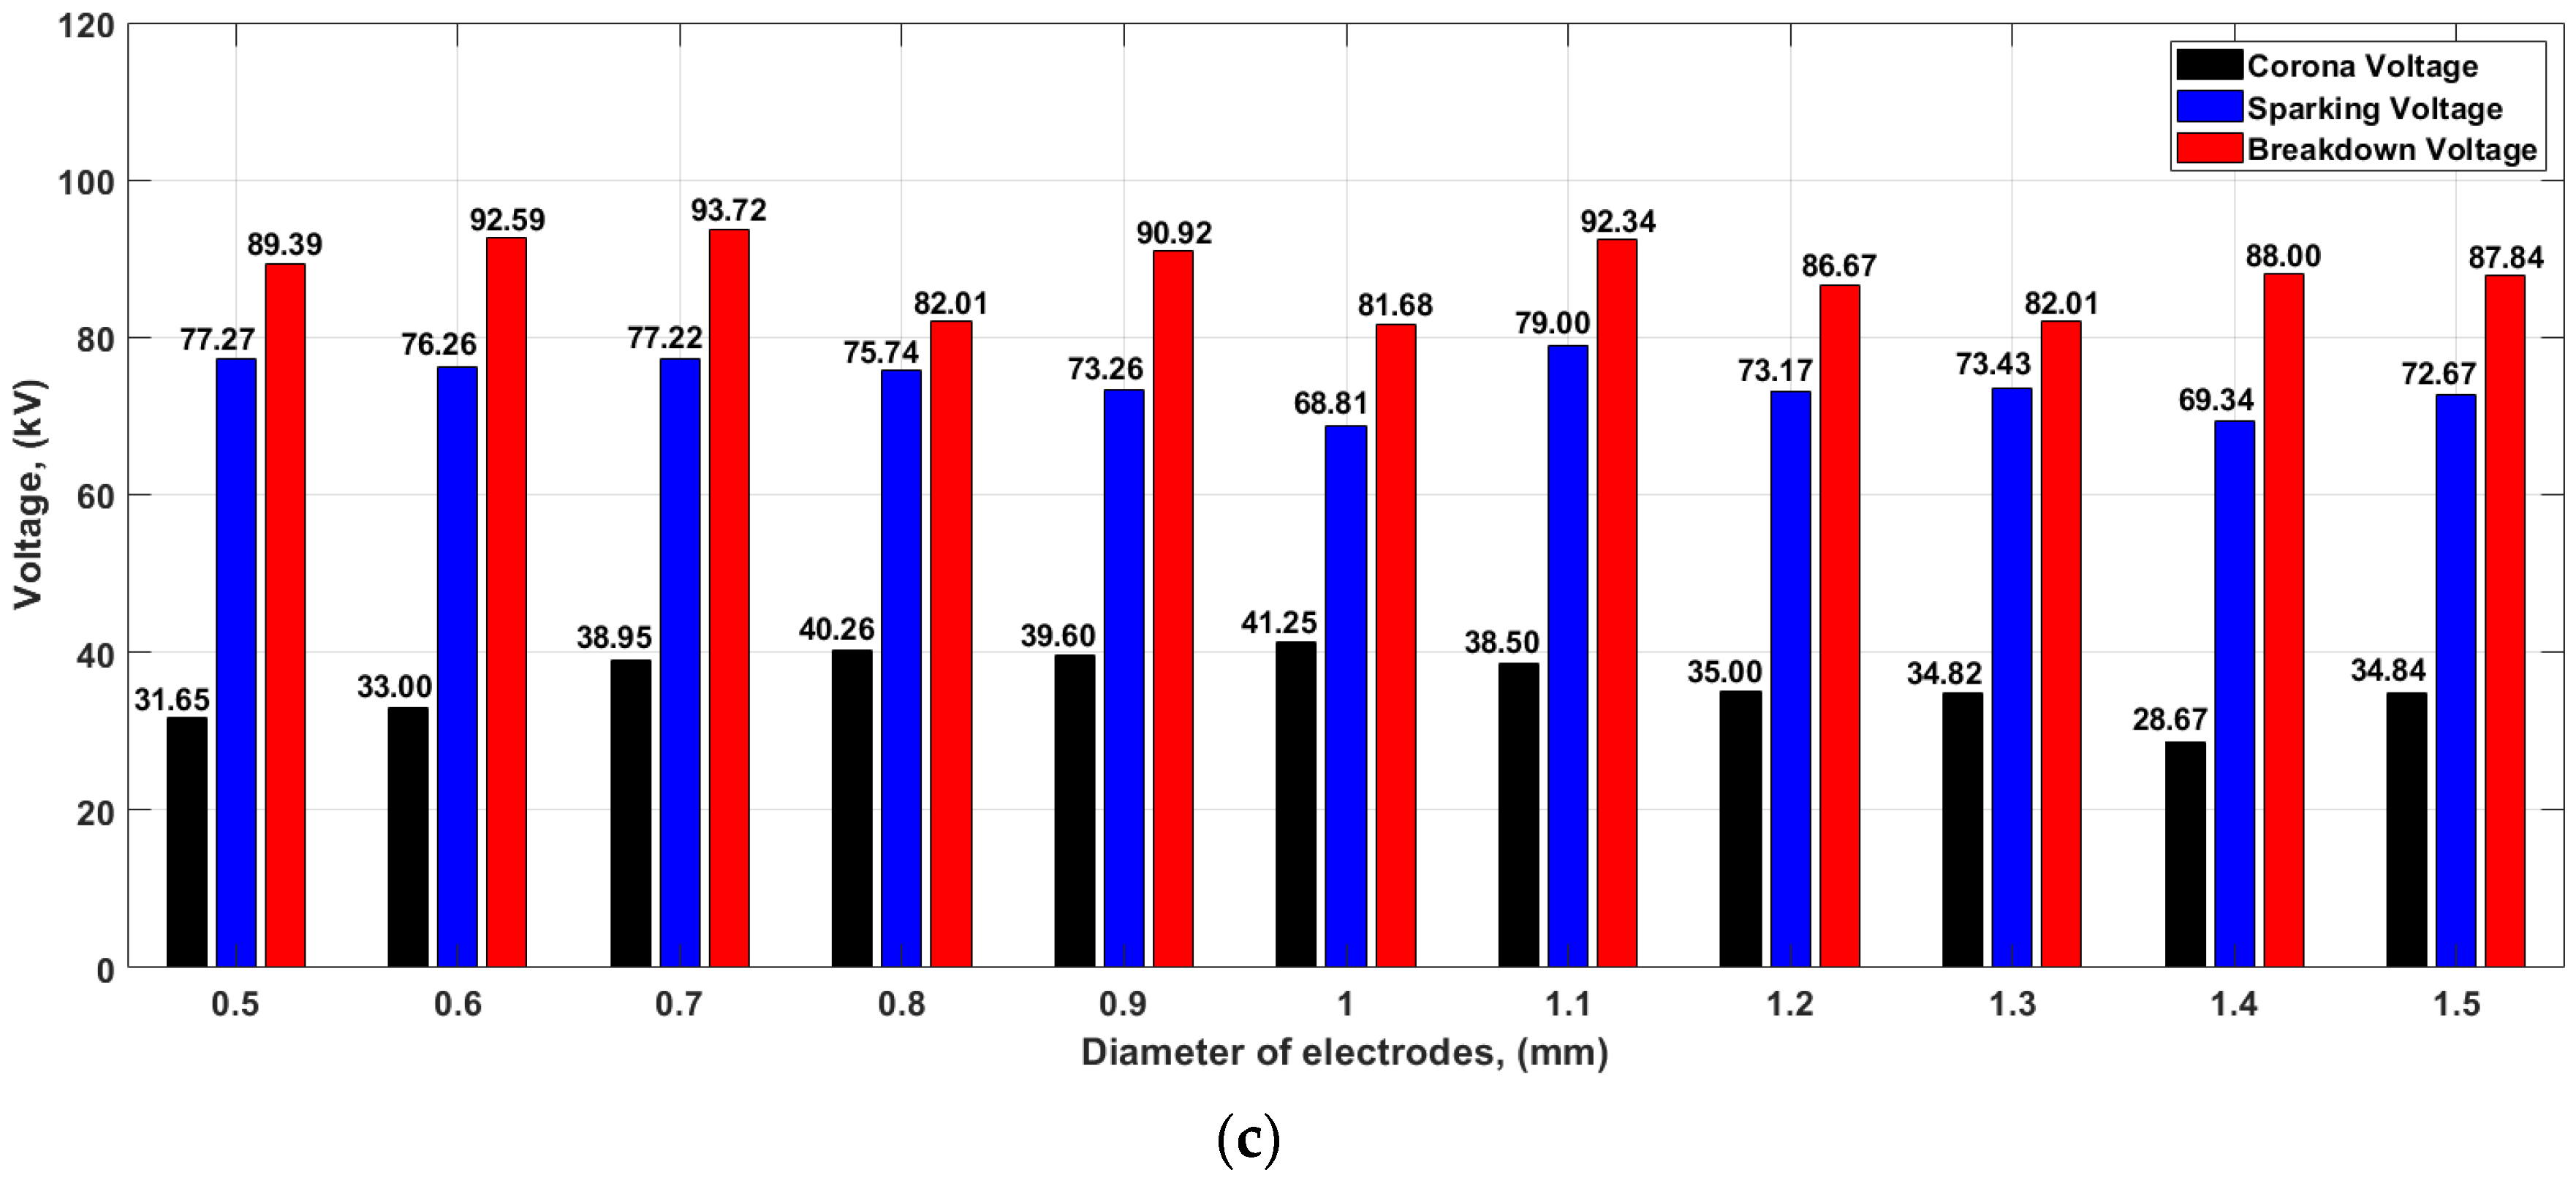
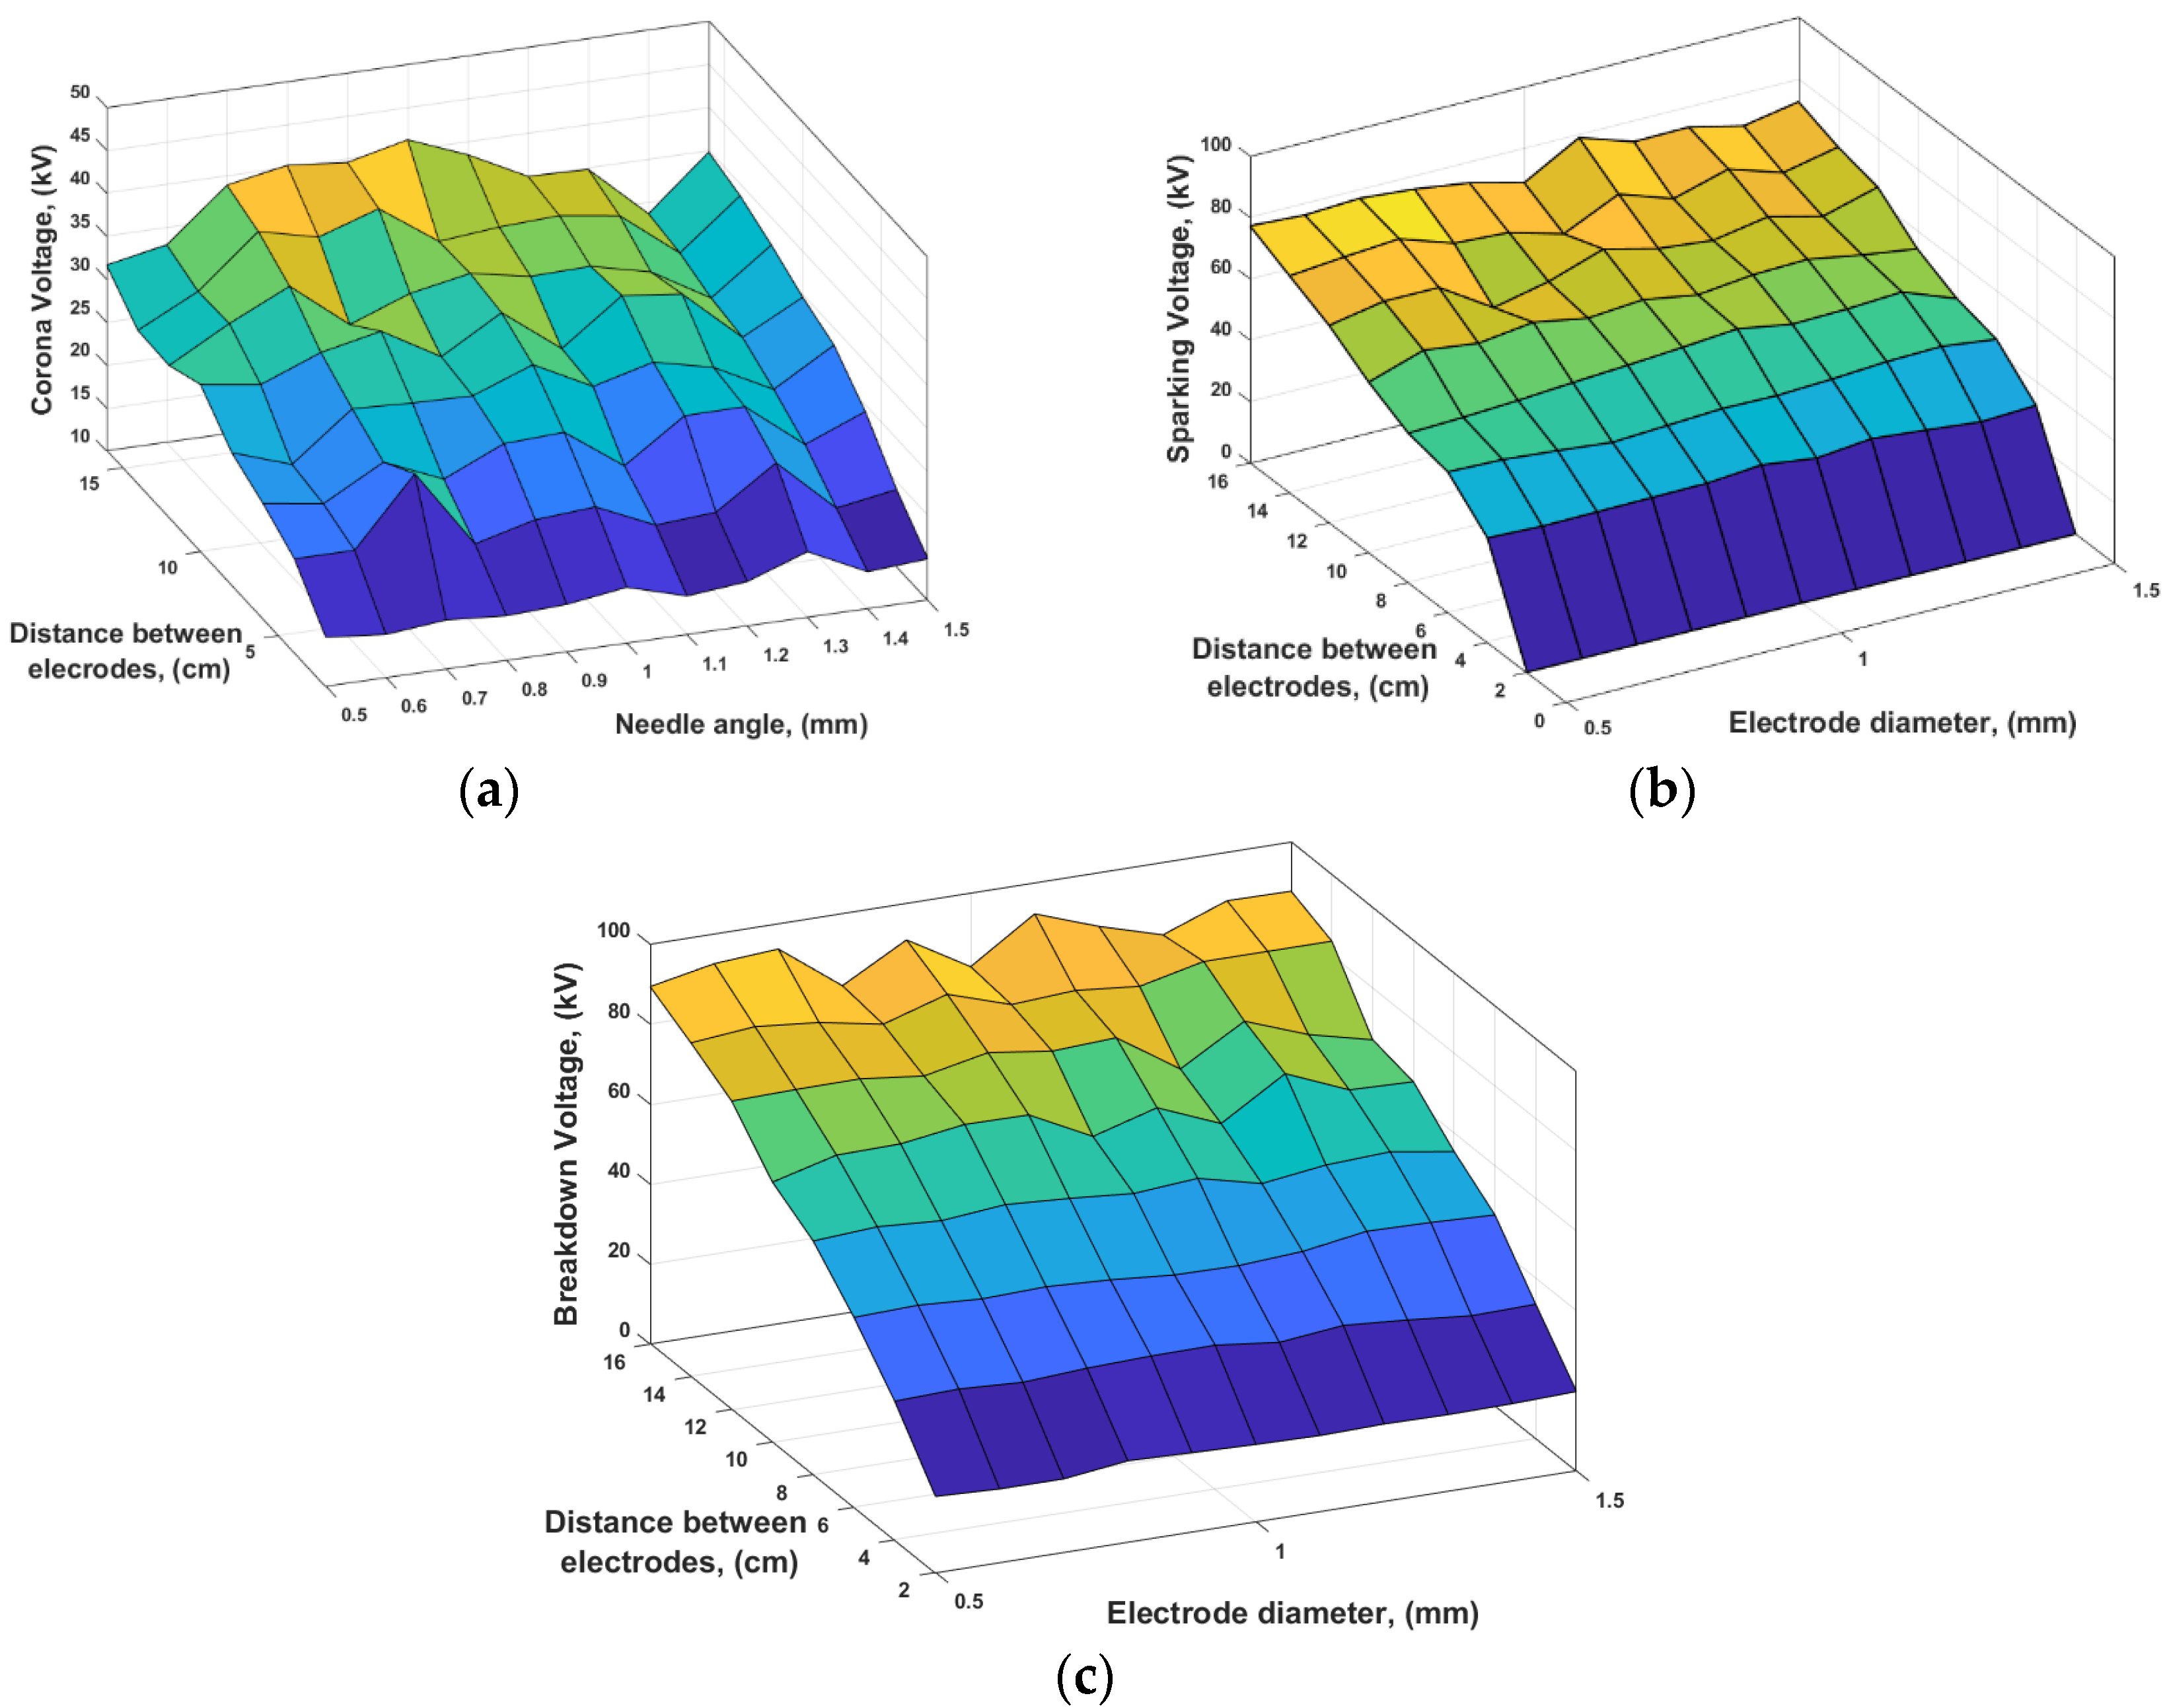
  • Diameters of the drill-type electrodes have little influence on the voltage values characterizing the air strength. The scatter of results of drill-type electrodes, depending on their diameter, is: for Uo voltage—from 8% to 12%, for sparking voltage Us—from 4% to 7% and for breakdown voltage Ub—from 2% to 9%.
  • The ionization efficiency of the electrode system, expressed as the ratio of the initial voltage value of the corona voltage Uo to the breakdown voltage Ub value, determines at what percentage of the breakdown voltage value the air ionization processes between the electrodes begin. From the point of view of the electrical strength of the air, the higher the corona voltage Uo value, the more favorable the system. In technological processes, such as air purification by means of its flow between the electrodes producing a non-homogeneous field (air filters) or ozonization of water or wastewater, the opposite is true. We try to make sure that the purification processes start as early as possible, i.e., at the lowest possible corona voltage Uo. The lower the corona voltage Uo value, the more economically and technically efficient the type of used electrodes. The ionization efficiency of drill-type electrodes is significantly higher than that of the needle electrodes. For a distance of 8, 12 and 16 cm between the drill-type electrodes, the ionization efficiency is 47%, 43% and 41%. For the needle electrodes and for the same distance, the ionization efficiency is 50%, 47% and 50%, respectively, and for needle electrodes with the 45° needle angle it is 63.3%, 59% and 58%.
  • The results presented above justify the undertaking of future research on models of drill-type systems, which represent large-size real systems, in terms of their ionization efficiency. The research should include the determination of ionization efficiency not only of the models of systems with drill-type electrodes, which reproduce large-size designs of technical systems, but also comparative research, with structural models using classic needle electrodes.

Author Contributions

Conceptualization, J.S. and M.K.; Methodology, J.S.; Validation, M.K., Formal Analysis, J.S.; Data Curation, J.S. and M.K.; Supervision, J.S.; Writing—Original Draft Preparation, J.S.; Writing—Review and Editing, M.K.; Visualization, M.K. All authors have read and agreed to the published version of the manuscript.

Funding

This research received no external funding.

Conflicts of Interest

The authors declare no conflict of interest.

References

  1. Kim, H.J.; Han, B.; Woo, C.G.; Kim, Y.J. Ozone Emission and Electrical Characteristics of Ionizers with Different Electrode Materials, Numbers, and Diameters. IEEE Trans. Ind. Appl. 2017, 53, 459–465. [Google Scholar] [CrossRef]
  2. Bo, Z.; Yu, K.; Lu, G.; Mao, S.; Chen, J.; Fan, F.G. Nanoscale discharge electrode for minimizing ozone emission from indoor corona devices. Environ. Sci. Technol. 2010, 44, 6337–6342. [Google Scholar] [CrossRef] [PubMed]
  3. Kim, K.H.; Szulejko, J.E.; Kumar, P.; Kwon, E.E.; Adelodun, A.A.; Reddy, P.A.K. Air ionization as a control technology for off-gas emissions of volatile organic compounds. Environ. Pollut. 2017, 225, 729–743. [Google Scholar] [CrossRef] [PubMed]
  4. Nagi, Ł.; Kunicki, M. Ionizing radiation generated by the electrical discharges from medium and high voltage in the air. In Proceedings of the 2017 17th IEEE International Conference on Environment and Electrical Engineering and 2017 1st IEEE Industrial and Commercial Power Systems (Europe, EEEIC/I and CPS Europe), Milan, Italy, 6–9 June 2017. [Google Scholar]
  5. Nagi, Ł.; Kozioł, M.; Wotzka, D. Analysis of the spectrum of electromagnetic radiation generated by electrical discharges. IET Sci. Meas. Technol. 2019, 13, 812–817. [Google Scholar] [CrossRef]
  6. Tian, Y.; Yuan, X.; Xu, S.; Zhou, X.; Zhang, Z. Drinking water disinfection based on strong electric field discharge and hydrodynamic cavitation. In Proceedings of the 42nd IEEE International Conference on Plasma Science, Belek, Antalya, Turkey, 24–28 May 2015. [Google Scholar]
  7. Kusumandari, K.; Saraswati, T.E.; Oktaviana, R.I.; Almas, K.F.; Puspitadindha, H.A. Water sterilization using plasma corona discharge. AIP Conf. Proc. 2019, 2202, 20035. [Google Scholar]
  8. Brocilo, D.; Chang, J.S.; Findlay, R.D.; Kawada, Y.; Ito, T. Modelling of the effect of electrode geometries on the corona discharge current-voltage characteristic for wire-plate electrostatic precipitators. In Proceedings of the Conference on Electrical Insulation and Dielectric Phenomena, Kitchener, ON, Canada, 14–17 October 2001. [Google Scholar]
  9. Bahri, M.; Haghighat, F. Plasma-based indoor air cleaning technologies: The state of the art-review. Clean Soil Air Water 2014, 42, 1667–1680. [Google Scholar] [CrossRef]
  10. Zylka, P. Evaluation of Ozone Generation in Volume Spiral-Tubular Dielectric Barrier Discharge Source. Energies 2020, 13, 1199. [Google Scholar] [CrossRef] [Green Version]
  11. Sakudo, A.; Yagyu, Y.; Onodera, T. Disinfection and Sterilization Using Plasma Technology: Fundamentals and Future Perspectives for Biological Applications. Int. J. Mol. Sci. 2019, 20, 5216. [Google Scholar] [CrossRef] [PubMed] [Green Version]
  12. Kim, H.-R.; Cho, C.H.; Chang, I.-S.; Lee, J.-H. Bromate Free Disinfection of Drinking Water using a High Voltage Impulse (HVI) Technique. In Proceedings of the 44th IEEE International Conference on Plasma Science, Atlantic City, NJ, USA, 21–25 May 2017; p. 1. [Google Scholar]
  13. Elserougi, A.A.; Ahmed, S.; Massoud, A. Transformer-less Grid-Connected High-Voltage Marx Pulse Generator with Unity Power Factor for Domestic Drinking Water Disinfection. In Proceedings of the Qatar Foundation Annual Research Conference Proceedings, Doha, Qatar, 22–23 March 2016; Hamad bin Khalifa University Press: Doha, Qatar, 2016; p. 1. [Google Scholar]
  14. Zhai, Y.; Liu, S.; Xiang, Q.; Lyu, Y.; Shen, R. Effect of Plasma-Activated Water on the Microbial Decontamination and Food Quality of Thin Sheets of Bean Curd. Appl. Sci. 2019, 9, 4223. [Google Scholar] [CrossRef] [Green Version]
  15. El-Tayeb, A.; El-Shazly, A.H.; Elkady, M.F.; Abdel-Rahman, A. Simulation and Experimental Study for Degradation of Organic Dyes Using Dual pin-to-plate Corona Discharge Plasma reactors for Industrial Wastewater Treatment. Contrib. Plasma Phys. 2016, 56, 855–869. [Google Scholar] [CrossRef]
  16. Pervez, N.; Rashid, A.; Alam, A.H. Analysis of HV Plasma Corona Reactor Treatment System for Industrial Waste Water. In Proceedings of the 14th International Conference on Frontiers of Information Technology, (FIT), Islamabad, Pakistan, 14–16 December 2016; pp. 269–273. [Google Scholar]
  17. Amrial, M.; Kusumandari, K.; Saraswati, T.E.; Suselo, Y.H. Textile Wastewater Treatment by Using Plasma Corona Discharge in a Continuous Flow System. In Proceedings of the International Conference on Advanced Materials for Better Future 2018, Solo, Indonesia, 15–16 October 2018. [Google Scholar] [CrossRef]
  18. Jiang, B.; Zheng, J.; Qiu, S.; Wu, M.; Zhang, Q.; Yan, Z.; Xue, Q. Review on electrical discharge plasma technology for wastewater remediation. Chem. Eng. J. 2014, 236, 348–368. [Google Scholar] [CrossRef]
  19. Lukes, P.; Clupek, M.; Babicky, V.; Sunka, P. Ultraviolet radiation from the pulsed corona discharge in water. Plasma Sources Sci. Technol. 2008, 17, 024012. [Google Scholar] [CrossRef]
  20. Florkowska, B.; Wlodek, R. Pulse Height Analysis of Partial Discharges in Air. IEEE Trans. Electr. Insul. 1993, 28. [Google Scholar] [CrossRef]
  21. Czerwonka, J.; Kozioł, M.; Skubis, J. Wpływ geometrii elektrod ostrzowych na wytrzymałość powietrza w polu niejednostajnym. Przegląd Elektrotechniczny 2018, 94, 152–155. [Google Scholar] [CrossRef]
Figure 1. Diagram of the high voltage test system: U—supply voltage (230 V); SW—voltage switch; L1, L2—operating status indicator lights; V—voltmeter; kV—kilovoltmeter; Ro—water resistor (1.1 MΩ).
Applsci 10 04030 g001
Figure 2. The sketch of the drill-type needle electrode. The diameter 2R of the needle part is 1 mm, length L1—8.5 mm, handle diameter ϕ—3.175 mm, total length 38.2 mm.
Applsci 10 04030 g002
Figure 3. General view of 11 pairs of drill-type electrodes selected for testing of different diameters d (in millimeters): 0.5—(a); 0.6—(b); 0.7—(c); 0.8—(d); 0.9—(e); 1.0—(f); 1.1—(g); 1.2—(h); 1.3—(i); 1.4—(j); 1.5—(k).
Applsci 10 04030 g003
Figure 4. Spark gap with drill-type electrodes (2R = 1 mm), prepared for measurements.
Applsci 10 04030 g004
Figure 5. Comparative characteristics of voltage: sparking voltage, corona voltage and breakdown voltage for a needle—needle system with drill-type electrodes of different diameters d (in millimeters): 0.5—(a); 0.6—(b); 0.7—(c); 0.8—(d); 0.9—(e); 1.0—(f); 1.1—(g); 1.2—(h). 1.3—(i); 1.4—(j); 1.5—(k).
Applsci 10 04030 g005aApplsci 10 04030 g005b
Figure 6. Comparative characteristics of the corona voltage sparking voltage and breakdown voltage for needle electrode systems, with two different needle angles: 20°—(a) and 45°—(b).
Applsci 10 04030 g006
Figure 7. The value of the corona voltage, sparking voltage and breakdown voltage for the systems of drill-type electrodes of different diameters: (a) distance 8 cm, (b) distance 12 cm, (c) distance 16 cm.
Applsci 10 04030 g007aApplsci 10 04030 g007b
Figure 8. Voltages of the corona voltage, sparking voltage and breakdown voltage for the needle–needle systems, with different needle angles for three distances between electrodes: (a) distance 8 cm, (b) distance 12 cm, (c) distance 16 cm.
Applsci 10 04030 g008aApplsci 10 04030 g008b
Figure 9. Spatial diagrams showing changes in the corona voltage Uo (a), sparking voltage Us (b) and breakdown voltage Ub (c) in partial discharges generated in systems of drill-type electrodes depending on the distance between electrodes and the diameter of the drill-type electrodes.
Applsci 10 04030 g009
Figure 10. Spatial diagrams showing changes in the corona voltage Uo (a), sparking voltage Us (b) and breakdown voltage Ub (c) in partial discharges generated in systems of drill-type and needle electrodes depending on the distance between electrodes and their needle angles [21].
Applsci 10 04030 g010
Table 1. Comparison of mean values and standard deviations for characteristic voltages Uo, Us and Ub of partial discharges generated in different spark gaps, for three distances between electrodes.
Lp.Distance between Electrodes
(cm)
Type of ElectrodesType of Characteristic Voltage
Corona Voltage
Uo (kV)
Sparking Voltage
Us (kV)
Breakdown Voltage
Ub (kV)
Average ValueStandard DeviationAverage ValueStandard DeviationAverage ValueStandard Deviation
18drill-type27.222.2651.552.4657.891.56
needle α = 20°24.830.5741.980.7549.660.57
needle α = 45°28.710.9942.530.6345.380.29
212drill-type32.222.4363.103.5974.854.33
needle α = 20°26.631.0248.352.8757.170.75
needle α = 45°32.341.7452.970.4954.950.49
316drill-type36.053.9971.203.2587.934.43
needle α = 20°34.301.9658.640.7569.020.49
needle α = 45°37.961.5161.720.7565.841.78

