Article

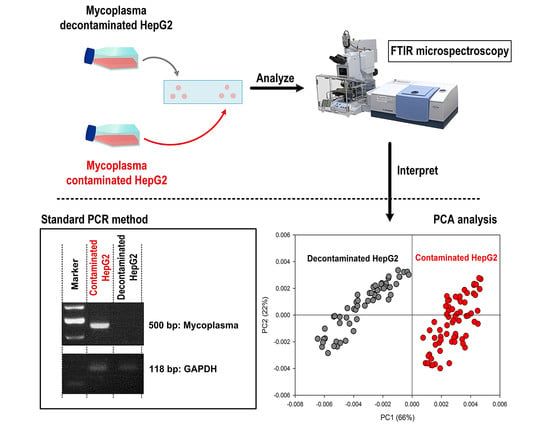
FTIR Microspectroscopy for the Assessment of Mycoplasmas in HepG2 Cell Culture

by
Piman Pocasap
1,2,
Natthida Weerapreeyakul
1,2,*,
Cholpajsorn Junhom
3,
Preeyaporn Plaimee Phiboonchaiyanan
4,
Montra Srisayam
5,
Apiyada Nonpunya
6,
Boondaree Siriwarin
7,
Munthipha Khamphio
8,
Chaiyachet Nanok
9,
Kanjana Thumanu
10,
Waraporn Tanthanuch
10 and
Sahapat Barusrux
11
1
Division of Pharmaceutical Chemistry, Faculty of Pharmaceutical Sciences, Khon Kaen University, Khon Kaen 40002, Thailand
2
Human High Performance and Health Promotion Research Institute, Khon Kaen University, Khon Kaen 40002, Thailand
3
Department of Biopharmacy, Faculty of Pharmaceutical Sciences, Burapha University, Chonburi 20131, Thailand
4
Department of Pharmacology, College of Pharmacy, Rangsit University, Pathumthani 12000, Thailand
5
Department of Microbiology, Faculty of Science and Technology, Pibulsongkram Rajabhat University, Phitsanulok 65000, Thailand
6
Merz Healthcare (Thailand) Company Limited, Bangkok 10110, Thailand
7
School of Pharmacy, Walailak University, Nakhon Si Thammarat 80160, Thailand
8
Molecular Biotechnology Laboratory, School of Biotechnology, Institute of Agricultural Technology, Suranaree University of Technology, Nakhon Ratchasima 30000, Thailand
9
The Office of Disease Prevention and Control 7 Khon Kaen 40002, Thailand
10
Synchrotron Light Research Institute (Public Organization), Nakhon Ratchasima 30000, Thailand
11
School of Allied Health Science, Walailak University, Nakhon Si Thammarat 80161, Thailand
*
Author to whom correspondence should be addressed.
Appl. Sci. 2020, 10(11), 3766; https://doi.org/10.3390/app10113766
Submission received: 15 April 2020 / Revised: 25 May 2020 / Accepted: 27 May 2020 / Published: 29 May 2020
(This article belongs to the Special Issue Biological and Medical Applications of Vibrational Spectroscopy)

Abstract

:
To assess the presence and absence of mycoplasma contamination in cell culture, Fourier transform infrared (FTIR) microspectroscopy, coupled with multivariate analysis, was deployed to determine the biomolecular changes in hepatocellular carcinoma cells, HepG2, before and after mycoplasma contamination. The contaminated HepG2 cells were treated with antibiotic BM-Cyclin to decontaminate the mycoplasma, and polymerase chain reaction (PCR) was then performed to confirm the presence or the absence of mycoplasma contamination. The contaminated and decontaminated HepG2 cells were analyzed by FTIR microspectroscopy with principal component analysis (PCA) and peak integral area analysis. The results showed that the FTIR spectra of contaminated HepG2 cells demonstrated the alteration in the IR spectra corresponding to the lipid, protein, and nucleic acid regions. PCA analysis distinguished the spectral differences between the groups of mycoplasma-contaminated and -decontaminated cells. The PCA loading plots suggest that lipid and protein are the main contributed molecules for the difference between these two cell groups. Peak integral area analysis illustrated the increase of lipid and nucleic acid and the decrease of protein contents in the contaminated HepG2 cells. FTIR microspectroscopy is, therefore, proven to be a potential tool for assessing mycoplasma removal by monitoring biomolecular alterations in cell culture.

Graphical Abstract

1. Introduction

Mycoplasma is a significant issue in research laboratories as contaminants in cell culture. The bacterial contamination potentially leads to disastrous laboratory results since mycoplasma can alter the infected host cell at a molecular level, providing inaccurate and unreliable experimental data. The bacteria compete with the host cell and deplete their nutrients, which consequently disrupt host cell metabolism, morphology, and function at a molecular level. The molecular alterations reportedly include, e.g., interference of nucleic acid synthesis, disruption of amino acid and lipid metabolism, chromosomal aberrations, cell membrane leakage, and interference with signal transduction [1,2]. Mycoplasmas are small prokaryotic bacteria, in the Mollicutes genus, that lack a cell wall around their cell membranes [3]. The organisms are naturally resistant to many commonly used antibiotic drugs, such as those targeting cell wall synthesis or beta-lactam antibiotics [4]. Mycoplasma contamination rates have been reported around 15%–35% and could be as high as 70% [5]. This data suggests that mycoplasma contamination could simply spread among vulnerable medium. Good aseptic techniques should be, therefore, complied with in order to reduce the infection rate, as well as routine contamination checks.
FTIR microspectroscopy has been known as a nondestructive, label-free, sensitive, inexpensive, and potential analytical method with several useful applications in biomedical research [6]. The IR spectra provide the data relating to specific bonding vibrations, which refer to a specific functional group present in a tested sample [7]. The technique has been used to investigate or discriminate cells before and after treatment in several studies since it yields the information on biological component alterations. For example, cell death induction by different compounds against U937 leukemia cells was examined and discriminated against using FTIR microspectroscopy, yielding the information on biomolecule variations among different stages of cell death [8]. FTIR spectra from cancerous kidney and ovarian cells could also be segregated from their normal counterparts, indicating cellular component alteration toward cancer progression [9,10]. These studies have demonstrated the effectiveness of FTIR microspectroscopy to define biomolecular changes during different stages of the cell.
Since mycoplasma contamination causes alteration of biochemical composition (i.e., lipid, protein, and nucleic acid) in their host cells [11,12], the detection of overall biomolecular compartments, therefore, seems to be useful for examining the effect of mycoplasma contamination in the host cell, as well as discriminating them from decontaminated cells. To the best of our knowledge, only one publication has applied FTIR spectroscopy for determination of the biocomponent changes of glioblastoma cells contaminated by specific mycoplasma species (M. bovis) [13]. The previous study reported that biomolecular components in a human glioblastoma cell line (DBTRG) detected by FTIR microspectroscopy were altered during mycoplasma infection. The result showed that FTIR microspectroscopy can be applied for the detection of mycoplasma contamination in cell culture samples [13]. However, the multitude of mycoplasma effects on different cells could be in a different manner and to different degrees [2]. In this study, we propose the use of FTIR microspectroscopy to investigate the biochemical variation before and after the removal of mycoplasma contamination in HepG2 cells. The cells were collected before and after decontamination by antibiotic BM-Cyclin treatment. Contaminated and decontaminated cells were then identified using the standard mycoplasma detection PCR (polymerase chain reaction) method. Moreover, the universal primer [14] covering most of the mycoplasma strains regularly found in cell culture [15] was used in the study to represent mycoplasmas commonly detected in cell culture labs. The IR spectra between mycoplasma-contaminated and -decontaminated cells were analyzed using multivariate analysis to detect biochemical alteration inside the cells, as well as to indicate markers (wavenumber-representing biomolecules) discriminating between mycoplasma contamination and decontamination. Then, histogram analysis was used to determine biomolecular change, which is relevant to the total alteration in each biomolecular region and can be useful for predicting the increase/decrease of each relevant biomolecule. The obtained data from this study could provide the information on potential FTIR microspectroscopy techniques on the assessment of mycoplasma impact on cellular biomolecules, as well as implying a new mycoplasma detection method in cultured cells.

2. Experimental Section

2.1. Materials

Culture media (DMEM), penicillin/streptomycin, 0.25% trypsin-EDTA (1X), and fetal bovine serum (FBS) were bought from GIBCO®, Invitrogen (Grand Island, NY, USA). BM-Cyclin was purchased from Roche (Mannheim, Germany). A FlexiGene DNA kit was bought from Qiagen (Hilden, Germany). All other chemicals and reagents were of molecular biology grade.

2.2. Cell Lines and Culture

The human hepatocellular carcinoma cell HepG2 (ATCC# HB-8065) were cultured in DMEM supplemented with 10% FBS, 100 units/mL penicillin, and 100 µg/mL streptomycin. Cells were cultured in a T25 flask and incubated at 37 °C in a humidified 5% CO2 atmosphere. The HepG2 cells were also maintained and sampled in the exponential phase of growth (40%–80% confluence) throughout the experiments due to the different growth stages that could affect the biochemical components inside the cell detected by FTIR microspectroscopy [16].

2.3. Antibiotic Treatment of Mycoplasmas Contaminants

Mycoplasmas treatment was performed in HepG2 cells cultured in T25 flasks (1 × 10⁶ cells/mL). The treatment protocols using BM-Cyclin were performed, following the manufacturer’s instructions. Briefly, two rounds of sequential one-week treatment of mycoplasma-infected HepG2 cells with BM-Cyclin were performed. A cycle of treatment was conducted with 10 µg/mL final concentration of tiamulin (pleuromutilin derivative) for 3 days and followed by 5 µg/mL final concentration of tetracycline derivative for another 4 days. This cycle was repeated, so the total treatment days were 14 days. During the treatment, the HepG2 cells were cultured in BM-Cyclin containing medium without other antibiotic drugs. The cells were cultured in antibiotic-free media for an additional 7 days before sampling to ensure that the alterations detected by PCR and FTIR microspectroscopy were not contributed by BM-Cyclin treatment.

2.4. DNA Extraction

The HepG2 cells were harvested by trypsinization and centrifuged at 540× g for 5 min. The supernatant was discarded, and DNA was extracted according to the FlexiGene DNA Kit protocol. The cell sample was lysed by lysis buffer. Cell nuclei and mitochondrial were collected by centrifugation. The collected pellet was re-suspended and incubated in a denaturation buffer. Isopropanol was added to precipitate DNA. The precipitate was collected by centrifugation, washed with 70% ethanol, and air-dried. The DNA sample was suspended in the hydration buffer before analysis by PCR.

2.5. PCR-Based Detection of Mycoplasmas

The HepG2 cells were detected for the presence of mycoplasmas with PCR amplification and were carried out in 25 µL of 10× PCR buffer with 25 mM MgCl2, 1 mM dNTPs mix, 5 U/µL Taq DNA polymerase, and 10 pmol of each mycoplasma primers (Table 1). Then, 3 µL template DNA was prepared. The PCR cycling profile was performed as follows: initial denaturation at 95 °C for 5 min; 30 cycles at 95 °C for 1 min, annealing temperature 45 °C for 1 min, 72 °C for 1 min, and a final extension at 72 °C for 10 min. A housekeeping gene, glyceraldehyde-3-phosphate dehydrogenase (GAPDH), was used as the positive control (Table 1). PCR reaction of GAPDH was carried out with a thermal cycle as initial denaturing for 5 min at 95 °C, then for 30 cycles at 95 °C for 30 s, 56 °C for 30 s, 72 °C for 30 s, and a final extension at 72 °C for 10 min. PCR products were checked by electrophoresis on 2% agarose gel stained with ethidium bromide and the products visualized under UV illumination.

2.6. FTIR Microspectroscopy

FTIR measurements were carried out at the IR end station, Synchrotron Light Research Institute (Public Organization), Nakhon Ratchasima, Thailand. Sample preparation was performed as previously described [19]. Briefly, mycoplasma-contaminated and -decontaminated HepG2 cells (at ~80% confluence) were harvested by trypsinization, centrifuged (540× g, 5 min), washed twice by 0.85% sodium chloride (w/v), and re-suspended in 10 µL of 0.85% sodium chloride. Five microliters of resuspended cells were spotted onto a Low-e microscope slide (MirrIR, Kevley Technologies, Chesterland, OH, USA) and then vacuum-dried for 10 min in the desiccator. The spotted cells were quickly rinsed with distilled water to discard the remaining salts, and then vacuum-dried. The washed and dried cells were stored in a desiccator before analysis by FTIR microspectroscopy.
The Bruker Hyperion 2000 microscope (Bruker Optics Inc., Ettlingen, Germany), equipped with a nitrogen-cooled MCT (HgCdTe) detector with a 36 × IR objective and connected with Bruker Vertex 70 spectrometer, was used for IR data acquisition. The spectral acquisition was processed in reflection mode by collecting 64 scans, 68 × 68 µm aperture size with 4 cm−1 resolution, covering the range of 4000–600 cm−1. OPUS 6.5 (Bruker) software was used for data acquisition and instrument control.
The significant variation between the data group was identified by principal component analysis (PCA) in the spectral range of 3050–2800 and 1800–900 cm−1 by using Unscrambler 9.7 software (CAMO, Oslo, Norway). Data were processed by taking the second derivative, using the Savitzky–Golay algorithm with nine points of smoothing to minimize the effects of variable baselines. The processed data was normalized with extended multiplicative signal correction (EMSC) to account for differences in sample thickness and correcting for scattering artifacts. Six PCs were chosen for analysis and loading for each PC was plotted for each sample. The peak area integration was conducted by OPUS 6.5 (Bruker) software. After that, the primary spectral integrated peak area from (1) the lipid region: 3000–2800 cm−1, (2) the protein region: 1700–1450 cm−1, and (3) the nucleic acid region: 1280–900 cm−1 were processed and represented as a histogram. The primary amide I spectral region (1550–1750 cm−1) was analyzed for the secondary protein structure by a curve-fitting analysis based on the Gaussian and Lorentzian algorithm.
Curve fitting of FTIR spectra was applied to study the submolecular information contained in the 1550–1750 cm−1 spectral interval (amide I region). The curve fitting process aims to study the absorption bands of a sample separately. The primary spectra are used to determine the number and the position (maximal IR intensity wavenumber) of the bands constituted in a spectral interval used in the classification model. The absorption bands are numbered 1 to 5 and designated as (1) turn, (2) β-sheet/turn, (3) α-helix, (4) β-sheet 1, and (5) β-sheet 2, respectively. The area for every absorption band is expressed as a percentage of the total area of its corresponding spectral interval.

2.7. Statistical Analysis

The significance of the difference between the histogram area of lipid, protein, and nucleic acid in the mycoplasma-contaminated and -decontaminated group was determined using the paired t-test and considered statistically significant at p < 0.05.

3. Results and Discussion

3.1. Detection of Mycoplasma by PCR

The standard conventional PCR technique was used to determine the contamination of mycoplasma. The result illustrates that HepG2 cells were infected by mycoplasma before BM-Cyclin treatment. In addition, the eradication of mycoplasma was completed after the antibiotic treatment (Figure 1).

3.2. Spectral Observation

FTIR spectra of mycoplasma-contaminated and -decontaminated HepG2 were acquired in the range of 3600–800 cm−1 (Figure 2A). The primary FTIR of the two groups displayed similar peak profiles and absorbance intensity. The second derivative spectra were also conducted from the primary FTIR spectra to resolve the overlapping peaks in the primary spectra and to spot differences between spectra of each cell group (Figure 2B).
The IR spectral ranges were categorized into three regions by the major biological components presented in each region [19,20]: (1) the lipid region (3000–2800 cm−1) is assigned for the phospholipid bilayer of the cell and organelle membranes. The fatty acid side chains consist of the repeated CH2- and CH3- moieties that yield the stretching vibration in the lipid region. (2) The protein region (1700–1450 cm−1) is assigned for the amide bonds. Amino acids bind to each other to form proteins, with the peptide bond giving two sharp bands near 1600 cm−1, amide I (stretching vibration) and amide II (bending vibration). (3) The nucleic acid region (1280–900 cm−1) is assigned for phosphodiester bonds. Nucleic acids bind to each other to form DNA/RNA through the phosphodiester bond, which yields several peaks around 1200 cm−1.
Figure 2B displays the average of second derivative FTIR spectra of mycoplasma-decontaminated and -contaminated HepG2 cells with biomolecule region assignment as lipid, protein, and nucleic acid regions. The spectral subtraction (Figure 2B) indicates that the differences between mycoplasma-treated cells and-untreated cells occurred mainly in the lipid and protein regions. Notably, the differences in the second derivative spectra between the two groups would be in the opposite direction when compared to the primary spectra.
The second derivative spectra results illustrate the change of biomolecule content upon mycoplasma contamination, as reflected in the change in peak intensity and also the molecular bond rearrangements, as indicated by peak broadening or shifting in lipid, protein, and nucleic acid regions. In the lipid region, the alteration of the peak intensities was found at 2923 and 2852 cm−1, which relate to asymmetric and symmetric stretching of CH2 in the lipid side chain (Figure 3A). The lipid head group (phospholipid ester; 1743 cm−1) was also decreased in the contaminated group. Moreover, the second derivative spectra of contaminated cells exhibited a peak at 3010 cm−1 (assigned as -HC=CH- stretching in unsaturated fatty acid [21]), which was shifted to 3006 cm−1 (unsaturated lipid [21,22]) after removal of mycoplasma contamination (Figure 3A). The peak intensity observed at 3006 and 1743 cm−1 in the mycoplasma-decontaminated HepG2 cells represents the proportion of unsaturated fatty acid and total lipid, respectively [23]. The presence of the peaks at 1477 and 1467 cm−1 in the decontaminated cells (assigned as the specific peaks for the orthorhombic lipid phase) also indicates the change of polymorphism of the lipid bilayer [24]. It indicates that the structural compactness of the lipid bilayer in host cells is affected by mycoplasma decontamination.
The changes in the amide I band, intermolecular β-sheet (1639 cm−1), and α-helix (1650 cm−1) also appear, as shown in Figure 3B. The change in amide II displayed a duplex peak at 1544 and 1552 cm−1 after the HepG2 cells were decontaminated from mycoplasma (Figure 3B). Identified nucleic acid was observed as the PO2 asymmetric stretching vibrations around 1225 cm−1 for DNA and the PO2 symmetric stretching vibrations at 1085 cm−1 for RNA. The nucleic acid region at 1236 cm−1, designated as the PO2 of DNA, was increased in the contaminated group. There was no change of the peak at 1085 cm−1, which is assigned to νsPO2 of RNA. The peak at 968 cm−1, designated as the DNA/RNA ribose phosphate main chain, was also decreased in the contaminated cells (Figure 3C). Moreover, the major alteration in the nucleic acid region was observed at 1236 and 1224 cm−1 (Figure 3C), which are conformational specific bands of A-DNA (predominant) and B-DNA, respectively [25]. In contaminated cells, the peak intensity at 1236 cm−1 was high and later found to be decreased along with the increasing intensity of the peak at 1241 cm−1, after the cells were treated. The result indicates the conformational changes from A-DNA to B-DNA after the mycoplasma was removed.
Accordingly, the FTIR spectra indicate the alterations in all biomolecular regions. The different wavenumbers between decontaminated and contaminated cells are summarized in Table 2 with the band assignment [7,26]. Mycoplasma affects eukaryotic cells at a molecular level of lipid, protein, and nucleic acid, including, e.g., interruption of nucleic acid synthesis, chromosomal aberration, alteration of protein type and level, disruption of cellular membrane component and structure, and several cellular biochemical processes, which consequently promote cellular transformation [2]. Our result defines most, if not all, of these effects on the cells, according to the alteration of IR absorption bands. The major changes detected by FTIR were observed on lipid, protein, and nucleic acid bands, as seen in Table 2, that can be used as a specific marker for mycoplasma contamination indicators.

3.3. PCA and Histogram Analysis

PCA was further used to discriminate the two sets of spectra in terms of statistics. PCA is a data analysis technique used to discriminate against a multivariate data set. In this study, PCA was used to analyze the scatter of the datasets acquired from the two different groups of the experiment. The PCA score plot (Figure 4A) demonstrates that the second derivative spectra of mycoplasma-decontaminated cells and -contaminated cells could be separated. The discrimination is mainly accounted for by PC1 (66%, x-axis), and lesser separation along PC2 (22%, y-axis).
Analysis of the PCA loading plots (Figure 4B,C) was used to determine the regions of the FTIR spectrum, which mostly contributed to the clustering (Figure 4A). The secondary spectra of the contaminated cells could be distinguished from the decontaminated cells by the positive PC1 scores (Figure 4A). The positive values of PC1 loading in the lipid region (Figure 4B) at 2969 cm−1 (assigned to νas of H−CO), 2941 cm−1as of CH3 [27]), 2908 cm−1 (assigned to νs of CH2 and CH3 of lipid [28]), 2865 cm−1 (C−H stretching [29]), and 2838 cm−1s of CH3 [27]) were heavily loaded for PC1, which separated the negative score of the spectra of the decontaminated cells from the positive score of the spectra of the contaminated cells (Figure 4B).
The high negative of PC1 loading at 2923 and 2852 cm−1 (assigned as the C−H stretching of lipids band) could be due to a higher lipid in mycoplasma-contaminated HepG2 cells. Moreover, the other negative values of PC1 loading of the respective peaks at 3005 and 2956 cm−1 (assigned as unsaturated lipid [21,22] and saturated fatty acid [22]) were loaded for PC1, which separated the positive score of the spectra of the contaminated cells from the negative score of the spectra of the decontaminated cells.
The high positive values of PC1 loading in the protein region (Figure 4C) at 1648 cm−1 (assigned as random coil [30]), 1544 cm−1 (α-helix of amide II band [31]), and 1639 cm−1 (β-sheet structure of amide I band of proteins [30,32]), respectively, were heavily loaded for PC1, which separate the negative score of the spectra of the decontaminated cells from the positive score of the spectra of the contaminated cells (Figure 4C). The other positive values of PC1 loading were found at 1720 cm−1 (assigned as C=O stretching band of (i) fatty acid ester or (ii) nucleic acid [29]), 1624 cm−1 (β-sheet of amide I band [30]), 1512 cm−1 (δCH (C−H in phenyl ring) [29]) and 1477 cm−1 (CH2 bending of the methylene chains in lipids; orthorhombic stage or packed stage of the lipid bilayer [24,29]). These data indicated that the α-helix and β-sheet bands of protein structures were most strongly responsible for discriminating the decontaminated cells from the contaminated cells.
Our result showed that all of the discriminating wavenumbers are from both lipid and protein regions (Figure 4B,C, and Table 2). No discriminating wavenumber from the nucleic acid region was observed. The result is in agreement with data from the inspection of second derivative spectra, suggesting that differences between mycoplasma-decontaminated and -contaminated HepG2 cells are affected by the intracellular lipid and protein contents.
A histogram in Figure 5 aims to present a quantitative analysis, which relates the integrated areas of specific bands to the biocomponent contents inside the cells. The area integrals of each biocomponent (i.e., lipid, protein, and nucleic acid) were calculated from the primary spectra upon baseline correction. The histogram result shows that the mycoplasma-contaminated HepG2 cells contain lesser amounts of lipid and nucleic acid, with higher protein content than the decontaminated HepG2 cells.
The second derivative spectra of protein exhibited the highest discrimination upon mycoplasma contamination, especially at the amide I band, according to PCA. We, therefore, applied a curve-fitting analysis to determine the change of the secondary structure of protein during mycoplasma contamination. The curve-fitting analysis predicts the secondary structures presented under the amide I band (1550–1750 cm−1), i.e., as an α-helix and a β-sheet [20]. In this study, the peaks of the secondary protein structures were simulated and categorized into 5 components consisting of a turn, an α-helix, and a β-sheet (Figure 6). Our result showed that the percentage of β-sheet (1638 and 1624 cm−1) increased significantly, suggesting that not only the content of protein was altered upon mycoplasma contamination, but also the conformation.

3.4. Spectral Marker Inspection

Mycoplasma contamination can induce cytopathic changes to the host cells by competing with host cells for biosynthesis precursors and nutrients as well as altering DNA/RNA synthesis. The mycoplasmas significantly affect cellular metabolism, morphology, and function, which consequently promote cellular transformation [12]. Our FTIR result confirms that there are alterations in the cellular biomolecules in the mycoplasma-contaminated cells. The major change was observed in the lipid region between 3000–2800 cm−1. The reduction of lipid content in the contaminated cells could be explained by the release of a cytolytic phospholipase by mycoplasmas that hydrolyzes the lipid membrane during host-cell invasion [33]. The phospholipid head group (1743 cm−1) was also decreased with its nonpolar part by mycoplasma infection.
The protein content was increased in the infected cells (1700–1450 cm−1). The expression of (1) mycoplasma genes to facilitate their survival and reproduction, as well as (2) the host gene counteracting the infection [1], possibly resulted in the enhancement of intracellular proteins as translation products. Housed in the host cells, mycoplasma activates many of its genes and produces various peptide products that facilitate its invasion [34]. On the other hand, the host cell responds by overexpressing several genes, including cell-cycle and growth regulators, and the immune response leads to specific protein expression to counteract the infection [35]. A study in the leukemic cell line using reverse-phase protein array reported that 19% of proteins expressed in host cells were affected by mycoplasma contamination, and the most affected are apoptotic-related proteins, reflecting cellular stress [36]. The previous experiments using FTIR to detect cell death revealed that the secondary protein β-sheet was increased upon apoptotic induction [8,20,37]. This could explain the increase of β-sheet observed in our study as a host-cell response to mycoplasma infection by expressing apoptotic-related proteins.
The subtle decrease was detected in the nucleic acid region (1280–900 cm−1). The alteration upon mycoplasma contamination on nucleic acids could be contributed by both host cells and the mycoplasma itself. (1) Mycoplasma contamination was previously reported to disrupt the cell-cycle transition of the host cell. The cells infected with mycoplasma were arrested in G1, leading to a reduction of the cell population in the S phase, and, subsequently, less cell population undergoing proliferation [38]. During the S phase, the IR nucleic acid peaks markedly increase, owing to the DNA deconvolution (for DNA replication), which makes the nucleic acid visible to IR light. On the contrary, the DNA is tightly packed in the form of chromatin and chromatid in the G1 and G2/M phases, which appear as opaque subjects to IR light [39]. Therefore, the decrease of nucleic acid content in the study could be due to the reduction of cells in the S phase during mycoplasma contamination. (2) Upon entry into the host cell, mycoplasmas multiply and the number of mycoplasmas far exceeds the number of infected host-cells, often over 1000-fold [11]. Therefore, the nucleic acid region could increase due to the multiplication of the mycoplasma genome, outnumbering host cells. Taken together, the final results from the present study show the decrease of nucleic acid. However, without any detailed information, it is hard to conclude whether it is the host cell or the mycoplasma genome that affects the observed FTIR spectra.
The data from our study demonstrate that lipid and protein contents are sensitive, biochemical components during mycoplasma contamination. The analysis of second derivative spectra and PCA showed that lipid and protein regions were responsible for the discrimination between decontaminated and contaminated cells. Our result is in agreement with previous studies indicating that the lipid and protein regions, but not the DNA region, were the determinants for mycoplasma contamination [13]. This possibly explains why the PCR and DNA staining methods, such as DAPI, which depend on the alteration of nucleic acid, could sometimes yield false-positive or negative results and are possibly unreliable.
The pattern of biomolecular changes from our study was varied from the previous study. The difference mycoplasma strains, as well as infected cell-type, could contribute to the observed difference in effects. Some mycoplasma species affect no cytopathic changes, whereas others could interfere with several intracellular processes [5]. Mycoplasma can interfere with the host cells and disrupt several molecular processes, which consequently result in cellular biomolecular alteration. Our study demonstrates the application of FTIR microscopy for the cell line inspection of mycoplasma contamination because FTIR spectra reflects the biomolecular alteration. Notably, there is still the possibility that the antibiotic used for mycoplasma treatment, as well as the mycoplasma itself, could cause permanent cytopathic changes [36,40], reflecting in the IR spectra of the cell sample. A medium- and long-term study collecting FTIR spectra of mycoplasma-free cells, with and without antibiotic treatment, should be performed to spot the irreparable alteration that possibly takes time to notice. Nevertheless, our result primarily demonstrates that FTIR spectroscopy is as effective as conventional PCR to detect mycoplasma contamination before and after antibiotic treatment.
Many mycoplasma detection methods have been developed, such as DNA-RNA hybridization, immunofluorescence staining, biochemical detection utilizing 6-MPDR, ELISA, and PCR. Among them, PCR has been reported to be more rapid and sensitive than the other methods. PCR also shows better sensitivity even with a diluted sample and, therefore, has been used as the standard method for mycoplasma detection [41]. The drawback of a conventional PCR assay is that it requires many steps to confirm the result, as well as being a time-consuming process [42]. FTIR microspectroscopy offers the advantages because it is a fast, simple, and sensitive method that is nondestructive to the sample, label-free, and inexpensive, while providing accurate and reliable results. FTIR microspectroscopy should be considered as an alternative application to detect whether cells are infected with mycoplasma.
Consequently, our study demonstrates the IR technique for monitoring biomolecular alteration in a cell model for biomedical research as well as detecting mycoplasma contamination. With the practical advantages of FTIR microspectroscopy, this technique has proven to be a useful and complementary approach to study biological samples regularly when there is a FTIR facility.

4. Conclusions

In this study, FTIR microspectroscopy was used to distinguish the spectral differences between mycoplasma-contaminated and -decontaminated HepG2 cells. The mycoplasma decontamination was confirmed by the standard PCR method. The FTIR results indicated the alteration of intracellular biomolecules. Subsequently, the PCA analysis suggested that lipid and protein are the major biochemical components altered during mycoplasma infection, possibly by causing cytopathic effects to the host cells. Our result suggests the use of FTIR microspectroscopy as a potential approach to study the effects of mycoplasma contamination in a cancer cell line. The technique has proved to be useful for detecting whether the cells are cleared from mycoplasmas following a treatment to eliminate the contamination by monitoring the alteration of cellular biomolecules caused by mycoplasma infection. With the FTIR microspectroscopy advantages, this approach can be used to save the cells that cannot be discarded when contaminated and can be used on a regular basis in research labs that are equipped with this instrument to ensure a mycoplasma-free cell line.

Author Contributions

Conceptualization, N.W. and S.B.; methodology, P.P., N.W., C.J., K.T., and W.T.; formal analysis, P.P., C.J., P.P.P., M.S., A.N., B.S., M.K., and C.N.; investigation, P.P., C.J., P.P.P., M.S., A.N., B.S., M.K., and C.N.; validation, K.T. and W.T.; resources, N.W.; data curation, P.P., C.J., P.P.P., M.S., A.N., B.S., M.K., and C.N.; visualization, P.P., N.W., and C.J.; writing—original draft, P.P., N.W., and C.J.; writing—review and editing, P.P. and N.W.; funding acquisition, N.W.; project administration, N.W. and S.B. All authors have read and agreed to the published version of the manuscript.

Funding

This work has received a scholarship under the Post-Doctoral Training Program from Khon Kaen University (Grant no. PD-2563-09) and a grant from Khon Kaen University (Grant no. 2559-KKU-SLRI-01-08).

Conflicts of Interest

The authors have no conflict of interest to declare.

References

  1. Rottem, S. Interaction of mycoplasmas with host cells. Physiol. Rev. 2003, 83, 417–432. [Google Scholar] [CrossRef] [Green Version]
  2. Drexler, H.G.; Uphoff, C.C. Mycoplasma contamination of cell cultures: Incidence, sources, effects, detection, elimination, prevention. Cytotechnology 2002, 39, 75–90. [Google Scholar] [CrossRef] [PubMed]
  3. Malygina, T.Y.; Mouzykantov, A.A.; Medvedeva, E.S.; Baranova, N.B.; Chernova, O.A.; Chernov, V.M.; Trushin, M.V.; Aminov, R.I. Antimicrobial resistance in mollicutes: Known and newly emerging mechanisms. FEMS Mirobiol. Lett. 2018, 365. [Google Scholar] [CrossRef]
  4. Chernova, O.A.; Medvedeva, E.S.; Mouzykantov, A.A.; Baranova, N.B.; Chernov, V.M. Mycoplasmas and their antibiotic resistance: The problems and prospects in controlling infections. Acta Nat. 2016, 8, 24–34. [Google Scholar]
  5. Degeling, M.H.; Maguire, C.A.; Bovenberg, M.S.; Tannous, B.A. Sensitive assay for mycoplasma detection in mammalian cell culture. Anal. Chem. 2012, 84, 4227–4232. [Google Scholar] [PubMed] [Green Version]
  6. Sahu, R.; Mordechai, S. Fourier transform infrared spectroscopy in cancer detection. Future. Oncol. 2005, 1, 635–647. [Google Scholar] [CrossRef] [Green Version]
  7. Bellisola, G.; Sorio, C. Infrared spectroscopy and microscopy in cancer research and diagnosis. Am. J. Cancer Res. 2011, 2, 1–21. [Google Scholar]
  8. Zelig, U.; Kapelushnik, J.; Moreh, R.; Mordechai, S.; Nathan, I. Diagnosis of cell death by means of infrared spectroscopy. Biophys. J. 2009, 97, 2107–2114. [Google Scholar] [CrossRef] [Green Version]
  9. Sablinskas, V.; Velicka, M.; Pucetaite, M.; Urboniene, V.; Ceponkus, J.; Bandzeviciute, R.; Jankevicius, F.; Sakharova, T.; Bibikova, O.; Steiner, G. In Situ Detection of Cancerous Kidney Tissue by Means of Fiber ATR-FTIR Spectroscopy; SPIE: Bellingham, WA, USA, 2018; Volume 10497. [Google Scholar]
  10. Theophilou, G.; Lima, K.M.; Martin-Hirsch, P.L.; Stringfellow, H.F.; Martin, F.L. ATR-FTIR spectroscopy coupled with chemometric analysis discriminates normal, borderline and malignant ovarian tissue: Classifying subtypes of human cancer. Analyst 2016, 141, 585–594. [Google Scholar]
  11. Rottem, S.; Kosower, N.; Kornspan, D. Contamination of tissue cultures by mycoplasmas. Biomed. Tissue Cult. 2012, 35–58. [Google Scholar] [CrossRef] [Green Version]
  12. Timenetsky, J.; Santos, L.M.; Buzinhani, M.; Mettifogo, E. Detection of multiple mycoplasma infection in cell cultures by PCR. Braz. J. Med. Biol. Res. 2006, 39, 907–914. [Google Scholar] [PubMed] [Green Version]
  13. Wehbe, K.; Vezzalini, M.; Cinque, G. Detection of mycoplasma in contaminated mammalian cell culture using FTIR microspectroscopy. Anal. Bioanal. Chem. 2018, 410, 3003–3016. [Google Scholar] [PubMed] [Green Version]
  14. Dreolini, L.; Cullen, M.; Yung, E.; Laird, L.; Webb, J.R.; Nelson, B.H.; Hay, K.A.; Balasundaram, M.; Kekre, N.; Holt, R.A. A rapid and sensitive nucleic acid amplification technique for mycoplasma screening of cell therapy products. Mol. Ther. Method Clin. Dev. 2020, 17, 393–399. [Google Scholar]
  15. Ali, S.; Mahmood, A. Microbial and viral contamination of animal and stem cell cultures: Common contaminants, detection and elimination. JSRT 2017, 2, 8. [Google Scholar] [CrossRef] [Green Version]
  16. Mourant, J.R.; Yamada, Y.R.; Carpenter, S.; Dominique, L.R.; Freyer, J.P. FTIR Spectroscopy demonstrates biochemical differences in mammalian cell cultures at different growth stages. Biophys J. 2003, 85, 1938–1947. [Google Scholar] [CrossRef] [Green Version]
  17. Gedye, C.; Cardwell, T.; Dimopoulos, N.; Tan, B.S.; Jackson, H.; Svobodova, S.; Anaka, M.; Behren, A.; Maher, C.; Hofmann, O.; et al. Mycoplasma infection alters cancer stem cell properties in vitro. Stem. Cell. Rev. 2016, 12, 156–161. [Google Scholar]
  18. Chuerduangphui, J.; Proyrungroj, K.; Pientong, C.; Hinkan, S.; Budkaew, J.; Pimson, C.; Chumworathayi, B.; Hanond, P.; Ekalaksananan, T. Prevalence and anatomical sites of human papillomavirus, Epstein-Barr virus and herpes simplex virus infections in men who have sex with men, Khon Kaen, Thailand. BMC Infect. Dis. 2018, 18, 509. [Google Scholar]
  19. Junhom, C.; Weerapreeyakul, N.; Tanthanuch, W.; Thumanu, K. FTIR microspectroscopy defines early drug resistant human hepatocellular carcinoma (HepG2) cells. Exp. Cell Res. 2016, 340, 71–80. [Google Scholar] [CrossRef]
  20. Machana, S.; Weerapreeyakul, N.; Barusrux, S.; Thumanu, K.; Tanthanuch, W. FTIR microspectroscopy discriminates anticancer action on human leukemic cells by extracts of Pinus kesiya; Cratoxylum formosum ssp. pruniflorum and melphalan. Talanta 2012, 93, 371–382. [Google Scholar] [CrossRef]
  21. Bouyanfif, A.; Liyanage, S.; Hequet, E.; Moustaid-Moussa, N.; Abidi, N. FTIR microspectroscopy reveals fatty acid-induced biochemical changes in C. elegans. Vib. Spectrosc. 2019, 102, 8–15. [Google Scholar] [CrossRef]
  22. Dreissig, I.; Machill, S.; Salzer, R.; Krafft, C. Quantification of brain lipids by FTIR spectroscopy and partial least squares regression. Spectrochim. Acta A 2009, 71, 2069–2075. [Google Scholar]
  23. Naumann, A. Fourier transform infrared (FTIR) microscopy and imaging of fungi. In Advanced Microscopy in Mycology; Dahms, T.E.S., Czymmek, K.J., Eds.; Springer: Berlin/Heidelberg, Germany, 2015; pp. 61–88. [Google Scholar]
  24. Boncheva, M.; Damien, F.; Normand, V. Molecular organization of the lipid matrix in intact Stratum corneum using ATR-FTIR spectroscopy. Biochim. Biophys. Acta 2008, 1778, 1344–1355. [Google Scholar] [CrossRef] [PubMed] [Green Version]
  25. Whelan, D.R.; Bambery, K.R.; Puskar, L.; McNaughton, D.; Wood, B.R. Quantification of DNA in simple eukaryotic cells using Fourier transform infrared spectroscopy. J. Biophotonics 2013, 6, 775–784. [Google Scholar] [CrossRef] [PubMed]
  26. Talari, A.C.S.; Martinez, M.A.G.; Movasaghi, Z.; Rehman, S.; Rehman, I.U. Advances in Fourier transform infrared (FTIR) spectroscopy of biological tissues. Appl. Spectrosc. Rev. 2017, 52, 456–506. [Google Scholar]
  27. Maity, D.; Kanti Bain, M.; Bhowmick, B.; Sarkar, J.; Saha, S.; Acharya, K.; Chakraborty, M.; Chattopadhyay, D. In situ synthesis, characterization, and antimicrobial activity of silver nanoparticles using water soluble polymer. J. Appl. Polym. Sci. 2011, 122, 2189–2196. [Google Scholar] [CrossRef]
  28. Rehman, I.; Movasaghi, Z.; Rehman, S. Vibrational Spectroscopy for Tissue Analysis; CRC Press: Boca Raton, FL, USA, 2012. [Google Scholar]
  29. Movasaghi, Z.; Rehman, S.; ur Rehman, D.I. Fourier transform infrared (FTIR) spectroscopy of biological tissues. Appl. Spectrosc. Rev. 2008, 43, 134–179. [Google Scholar]
  30. Kong, J.; Yu, S. Fourier transform infrared spectroscopic analysis of protein secondary structures. Acta Bioch. Biophys. Sin. 2007, 39, 549–559. [Google Scholar] [CrossRef] [Green Version]
  31. Kumosinski, T.F.; Farrell, H.M. Determination of the global secondary structure of proteins by Fourier transform infrared (FTIR) spectroscopy. Trends Food Sci. Tech. 1993, 4, 169–175. [Google Scholar] [CrossRef]
  32. Baldassarre, M.; Li, C.; Eremina, N.; Goormaghtigh, E.; Barth, A. Simultaneous fitting of absorption spectra and their second derivatives for an improved analysis of protein infrared spectra. Molecules 2015, 20, 12599–12622. [Google Scholar]
  33. Zhu, H.; Liu, P.; Du, J.; Wang, J.; Jing, Y.; Zhang, J.; Gu, W.; Wang, W.; Meng, Q. Identification of lysophospholipase protein from Spiroplasma eriocheiris and verification of its function. Microbiology 2017, 163, 175–184. [Google Scholar] [CrossRef]
  34. Madeira, H.M.F.; Gabriel, J.E. Regulation of gene expression in mycoplasmas: Contribution from mycoplasma hyopneumoniae and mycoplasma synoviae genome sequences. Genet. Mol. Biol. 2007, 30, 277–282. [Google Scholar]
  35. Hopfe, M.; Deenen, R.; Degrandi, D.; Köhrer, K.; Henrich, B. Host cell responses to persistent mycoplasmas—Different stages in infection of HeLa cells with Mycoplasma hominis. PLoS ONE 2013, 8, e54219. [Google Scholar] [PubMed]
  36. Hoff, F.W.; Hu, C.W.; Qutub, A.A.; Qiu, Y.; Graver, E.; Hoang, G.; Chauhan, M.; de Bont, E.S.J.M.; Kornblau, S.M. Mycoplasma contamination of leukemic cell lines alters protein expression determined by reverse phase protein arrays. Cytotechnology 2018, 70, 1529–1535. [Google Scholar] [CrossRef] [PubMed] [Green Version]
  37. Holman, H.Y.; Martin, M.C.; Blakely, E.A.; Bjornstad, K.; McKinney, W.R. IR spectroscopic characteristics of cell cycle and cell death probed by synchrotron radiation based Fourier transform IR spectromicroscopy. Biopolymers 2000, 57, 329–335. [Google Scholar] [CrossRef]
  38. Gerlic, M.; Horowitz, J.; Horowitz, S. Mycoplasma fermentans inhibits tumor necrosis factor α-induced apoptosis in the human myelomonocytic U937 cell line. Cell Death Differ. 2004, 11, 1204. [Google Scholar]
  39. Boydston-White, S.; Gopen, T.; Houser, S.; Bargonetti, J.; Diem, M. Infrared spectroscopy of human tissue. V. Infrared spectroscopic studies of myeloid leukemia (ML-1) cells at different phases of the cell cycle. Biospectroscopy 1999, 5, 219–227. [Google Scholar] [CrossRef]
  40. Moullan, N.; Mouchiroud, L.; Wang, X.; Ryu, D.; Williams, E.G.; Mottis, A.; Jovaisaite, V.; Frochaux, M.V.; Quiros, P.M.; Deplancke, B.; et al. Tetracyclines disturb mitochondrial function across eukaryotic models: A call for caution in biomedical research. Cell Rep. 2015, 10, 1681–1691. [Google Scholar] [CrossRef] [Green Version]
  41. Uphoff, C.C.; Drexler, H.G. Comparative PCR analysis for detection of mycoplasma infections in continuous cell lines. Vitro Cell Dev. Biol. Anim. 2002, 38, 79–85. [Google Scholar] [CrossRef]
  42. Ishikawa, Y.; Kozakai, T.; Morita, H.; Saida, K.; Oka, S.; Masuo, Y. Rapid detection of mycoplasma contamination in cell cultures using sybr green-based real-time polymerase chain reaction. Vitro Cell Dev. Biol. Anim. 2006, 42, 63–69. [Google Scholar]
Figure 1. Mycoplasma detection in the HepG2 cells by polymerase chain reaction (PCR) before and after BM-Cyclin treatment (n = 3). glyceraldehyde-3-phosphate dehydrogenase (GAPDH) served as an internal control. bp, base pair.
Applsci 10 03766 g001
Figure 2. (A) Average Fourier transform infrared (FTIR) primary and (B) second derivative spectra of mycoplasma decontaminated (67 spectra from triplicate samples) and contaminated (58 spectra from triplicate samples) HepG2 cells. Standard deviation was indicated in the primary spectrum and displayed as the parallel band with relevant color.
Applsci 10 03766 g002
Figure 3. Average second derivative spectra (9 points smoothed with EMSC normalized) in the (A) lipid (3000–2800 cm−1), (B) protein (1700–1450 cm−1), and (C) nucleic acid (1280–900 cm−1) regions of decontaminated (67 spectra from triplicate samples) and contaminated (58 spectra from triplicate samples) HepG2 cells.
Applsci 10 03766 g003
Figure 4. (A) Principal component analysis (PCA) score plot on PC1 and PC2 and (B) their relevant loading plots from the lipid and (C) protein regions represent the wavenumbers discriminating the differences between decontaminated (67 spectra from triplicate samples) and contaminated (58 spectra from triplicate samples) HepG2 cells. The wavenumbers with loading scores ≥ 0.1 or ≤ −0.1 are significant.
Applsci 10 03766 g004
Figure 5. Histogram representing the mean integral areas of the respective lipid (3000–2800 cm−1), protein (1700–1450 cm−1), and nucleic acid (1280–900 cm−1) regions of mycoplasma-decontaminated and -contaminated cells. Data are presented as mean ± SD (n = 3). *, p < 0.05, paired t-test., ncontaminated = 58 and ndecontaminated = 67.
Applsci 10 03766 g005
Figure 6. A percentage of the integral area of the secondary structure proteins corresponds to a curve-fitting analysis. Inset graphic illustrates FTIR absorbance of amide I band contour with best-fit 50% Gaussian/Lorentzian individual component bands. RMS error < 0.005 in all treatment groups. Data are presented as mean ± SD (n = 3). *, p < 0.05, paired t-test.
Applsci 10 03766 g006
Table 1. Nucleotide sequence of mycoplasma universal primers.
TargetsSequences (5′‒3′)Product Size
Mycoplasmas [17]F: GGCGAATGGGTGAGTAACACG500
R: GGATAACGCTTTGCGACCTATG
GAPDH [18]F: TCATCAGCAATGCCTCCTGCA118
R: TGG GTG GCA GTG ATG GCA
Table 2. FTIR bands of the mycoplasma-contaminated HepG2 cells compared to decontaminated HepG2 cells and their assignments [7,21].
Wave
Number
(cm−1)
Primary Spectral Difference *PCA
Score Plot **
Functional
Group
Vibrational
Mode ***
Band
Assignment
PC1PC2
2923🡳(–)(–)−(CH2)nνas(CH2)Lipid
2852🡳(–)(–)−(CH2)nνs(CH2)Lipid
1743🡳 (–)−CH2−COORν(C=O)Phospholipid esters
1712🡳 C=Oν(C=O)Nucleic acid
1650🡱++O=C−N−H80% ν(C=O)/20% ν(CN)Amide I peptide
1639🡱+
1624🡱 (–)
1552🡳 O=C−N−H60% γ(NH)/
30%ν(CN)/10% ν(CC)
Amide II peptide
1544🡱++
1512🡱 -δCHCH in phenyl ring
1467🡳 +−(CH2)nδCH2Lipid
1380🡳 C−CH3γs(CH3)Lipid
1236🡱 RO−PO2−ORνas(PO2)DNA/RNA, phospholipid ester
1170🡳 R−COO−R’νas(CO)Ester
1052🡳 C−O−Pν (COP)Phosphate ester
968🡳 PO32νas(PO32)DNA/RNA ribose
* 🡱: increase, 🡳: decrease; ** +: positive value of PC loading, (–): negative value of PC loading; *** ν: stretching, δ: bending, γ: wagging, twisting, and rocking, as: asymmetric, s: symmetric

