1. Introduction
The fault of the traction power-supply system (TPSS) directly results in the operation disturbance of railway trains because electric railways use electrical energy as an energy source. Therefore, system faults must be quickly identified and responded to, which is achieved by protective relays. In other words, protective relays are designed to monitor breakdowns and prevent breakdown impacts. Thus, they are very important for the stable operation of the system [
1,
2,
3,
4].
The autotransformer (AT) feeding method, which is applied to electric railways in many countries, supplies power to the line through an AT with twice the rated voltage of the load (i.e., train). In other words, it comprises a trolley wire (TF) that connects the neutral point of an AT with the rail to supply power to the load, and a feeder (AF) to absorb the return current of the load in the rail [
5,
6,
7,
8]. Unlike the conventional electric power system, substations that serve as a power source have a disconnected wire form instead of a network form; thus, short circuit fault at a distance from the power source can be confused with the load current. Additionally, because the load of the TPSS has a large capacity of approximately 15 [MVA] in terms of high-speed trains and rapid operation, the load current has great variability. Accordingly, the AC TPSS is characterized by asymmetrical single phases due to moving loads (such as trains); the TPSS characteristics differ significantly from conventional balanced three-phase power systems.
In addition, it is essential to establish performance verification procedures at the development stage because it is essential to ensure the reliability of the protective relay operation on railways where safety is important. However, many studies have been conducted on the fault analysis of railway systems, but little research has been conducted on the performance evaluation of relays in railways [
9,
10,
11,
12].
Generally, in power systems, the performance test of protective relay can be divided into steady and dynamic tests. A steady test is a method of injecting a specific voltage and current into a protective relay to determine whether it operates. A dynamic test tests the response characteristics of the protective relay by injecting a waveform that reflects the operating characteristics or environment of the system wherein the protective relay is equipped. A steady characteristic test of protective relay for railroads can be performed using general commercial testing devices including an amplifier that generates waveforms. However, a dynamic characteristic test can be performed through hardware in the loop simulation (HILS) in connection with the relay by simulating system operation environments through an expensive simulator such as digital real-time simulator (DRTS) [
13,
14,
15,
16]. However, DRTSs are not easy to construct, as they are expensive and require more effort than electromagnetic transients (EMT) simulators for transient state analysis. Additionally, the best way to test the protective relay with the correct system fault waveform is to obtain voltage and current waveforms from the protective relay installed in the actual TPSS as a common format for transient data exchange for power systems (COMTRADE) file and then inject it into the protective relay that needs to be tested.
Therefore, this paper proposes a new digital simulator for the railways called protective relay digital simulator for railway (PREDIS-R), which enables the accurate and efficient testing of protective relay performance at a low cost at the laboratory level. The proposed digital simulator has the following configurations and features. First, it provides an environment where users can create waveforms or import them from outside. In other words, users can create the desired test waveform on a digital simulator or import a fault waveform implemented by measurement or an external EMT simulator. The waveform generated is amplified to the potential transformer (PT) and current transformer (CT) levels of the train substation via a real-time amplifier. The amplified voltage and current waveform are injected into the protective relay, and it can perform an operational performance test. Additionally, the operating test of the protective relay can monitor the pickup time and operating protective elements of the protective relay to review the correct operation of the protective relay on the users’ intended fault waveform.
2. Development of Protective Relay Digital Simulator for Railways
2.1. Performance Scheme
The main role of the protective relay is to analyze the waveform of the input voltage and current to determine any fault and provide output for the operation of the circuit breaker (CB). To test the performance of these protective relays, the simulator must enter a waveform that accurately reflects the characteristics of the faulty and steady states of the system and read the status information of the protective relay operating according to the input waveform.
Figure 1 shows the performance scheme of the PREDIS-R proposed herein. It was developed to be able to use fault data obtained from the field or enter waveform data obtained through presimulation based on an EMT simulation tool (i.e., power system computer aided design/electromagnetic transients with DC (PSCAD/EMTDC) [
17], electro magnetic transients program (EMTP), etc.) into the protective relay simulators in the international standard COMTRADE format to simulate the fault of the system. Similarly, when external faulty waveform data input is loaded into the digital protective relay simulator used to test the performance of the protective relay, PREDIS-R generates the same waveform as the protective relay with the input waveform and outputs it.
Moreover, a function that can create a separate waveform is applied to the protective relay simulator to reflect the characteristics of the TPSS, which does not have the EMT simulation result waveform or cannot be implemented by EMT simulation. Thus, when creating a waveform internally, PREDIS-R generates the exact waveform that the user intends and outputs it to a protective relay.
The proposed PREDIS-R comprises hardware for loading external test waveforms or generating test waveforms directly showing motion information to users and software setting up test waveforms, controlling simulators, and storing and outputting operating information.
2.2. Basic Formula for Relay Setting
The Zone 1 distance relay setting can be configured as follows in Equation (1), considering the protection range of 90%:
where
Z1 is the relay input impedance for Zone 1,
Z55 is the unit line impedance per length based on 55 kV [Ω/km],
L1 is the line length between the substation (SS) and sectioning post (SP) [km], and CF is the conversion factor considering the CT and PT ratios.
The Zone 2 distance relay setting can be configured as follows in Equation (2), considering the protection range of 120%:
where
Z2 is the relay input impedance for Zone 2, and
L2 is the length between two substations [km].
The input impedance of the distance relay between Zone 1 and Zone 2 is 33.83 Ω and 66 Ω, respectively.
2.3. Configuration
Figure 2 shows the data flow in the hardware of the developed digital simulator. The control system of the simulator is designed to output the waveform set by the user accurately through software. Additionally, operation information of the relay is obtained by communication between the protective relay and the simulator, and the status change information of the CB is output to the display device.
The control system of the simulator comprises an amplifier, signal generator, and signal receiver. The signal generator and receiver print out the test waveform and obtain the output information of the protective relay. For this purpose, it is configured to enable digital and analog input and output.
Figure 3 shows the role of each input and output terminal. The digital input (DI) part checks the status of the protective relay, and the analog input (AI) part acquires the monitored voltage and current signals from the protective relay. The digital output (DO) part creates the signal to operate the CB and the analog output (AO) part injects the test waveform into the protective relay. The waveforms from AO are small signals of 10 Vp.
Figure 4 shows the hardware configuration diagram of the PREDIS-R. The amplifier was applied to generate the waveform output with the voltage and current levels of the protective relay installed in the real environment of the TPSS. The protective relay converts the voltage and current of the system through the PT (55,000 V: 110 V) and CT (800 A: 5 A) to monitor the fault occurrence. However, because the waveform output from the signal generation and reception parts is small (10 Vp), amplification of the signal at the same level as the output from the actual switchgear in the substation is necessary. To amplify the level of the installed PT and CT secondary side, the amplification rate of the voltage and current was set to be 18 and 1.34 times, respectively, and the signal could be amplified up to 180 Vp and 9 Ap, respectively.
The operating information of the protective relay and the change in the status of the CB according to the signal sent to the CB can be checked by the user in real time through the monitor.
Figure 5 shows the fabricated PREDIS-R.
The simulator performance scheme in
Figure 1 has been implemented to allow users to intuitively use it through the user-based main interface shown in
Figure 6. The elements and functions that constitute the main interface are listed in
Table 1.
Various protective components in integrated relay are applied to the TPSS. The distance relay is used as the main protective relay to protect the TPSS from ground faults and short circuit faults. Further, the high resistance ground fault current is difficult to distinguish; thus, an overcurrent relay is used for back-up protection. Additionally, a reclosing relay to reclose the CB and an under-voltage relay for alarm and CB opening in the event of a power outage is also used. To test the performance of these various relay elements, various types of waveforms must be generated by software. For this, PREDIS-R developed and applied a function that can receive external input or generate the waveform for performance testing.
2.3.1. External Input Waveform
Obtain the input waveform that can occur from the TPSS implemented externally and use it to test the performance of the protective relay. For example, the waveform of each condition must be entered to examine the performance of the protective relay under steady-state load current and fault occurrence. As shown in
Figure 7, the simulation results of PSCAD/EMTDC can be converted into COMTRADE format and inputted into the protective relay. This enables the performance test of protective relays in various ways, such as the location of fault, type of fault, and load current. In addition, the test waveform reliability can be improved because the output is based on simulation results.
2.3.2. Internal Waveform Generation
Test waveforms can be implemented according to users’ needs. For this purpose, PREDIS-R is designed to allow voltage, current, and phase control. Considering the variation ratio of substation PT and CT, it can be adjusted within Max 120 V, Max 9 A, and 0–180°, respectively, and implemented for continuous inputs.
The AC TPSS can easily distinguish between steady and faulty states because the supply voltage level is high and the difference between the load and fault currents is large. However, the load current includes harmonics, because it converts the power through the inverter to control the speed of the train.
Figure 8 shows the use of the harmonic generation function to test whether the protective relay is malfunctioning because of harmonics.
PREDIS-R also includes the capability to monitor test progress and test results in real time. The signals obtained from the waveform input, output, and protective relay on the simulator are printed on the screen to provide an intuitive understanding to users, as shown in
Figure 9. This screen shows the operating protective elements and operating time during the performance test of the protective relay.
3. Verification of the PREDIS-R
PREDIS-R verification is divided into two main categories. The first is output performance verification, which checks whether the waveform output to the protective relay is implemented correctly when the waveform is received from the external input and outputs the desired waveform from the simulator. The second is output performance verification for waveforms, which is generated by the user.
First, to check the basic output performance, the voltage and current amplification rate of the amplifier that amplifies according to the operating voltage and current of the relay against the voltage signal generated by the simulator was verified. For this purpose, various sizes of sinusoidal wave voltage were inputted into the amplifier.
Table 2 shows the amplitude of the input and output currents for the current amplifier. The amplification rate of the current amplifier is 1.34 times, showing an average error rate of 0.9% in the amplification range.
Table 3 shows the amplitude of the input and output voltages for the voltage amplifier. The amplification rate of the voltage amplifier is 18 times, showing an average error rate of 0.07% in the amplification range. As the error rate averages are very small, they are confirmed to be amplified according to their design conditions. The output performance under a continuously changing amplification waveform was verified against the external input waveform and internally generated waveform.
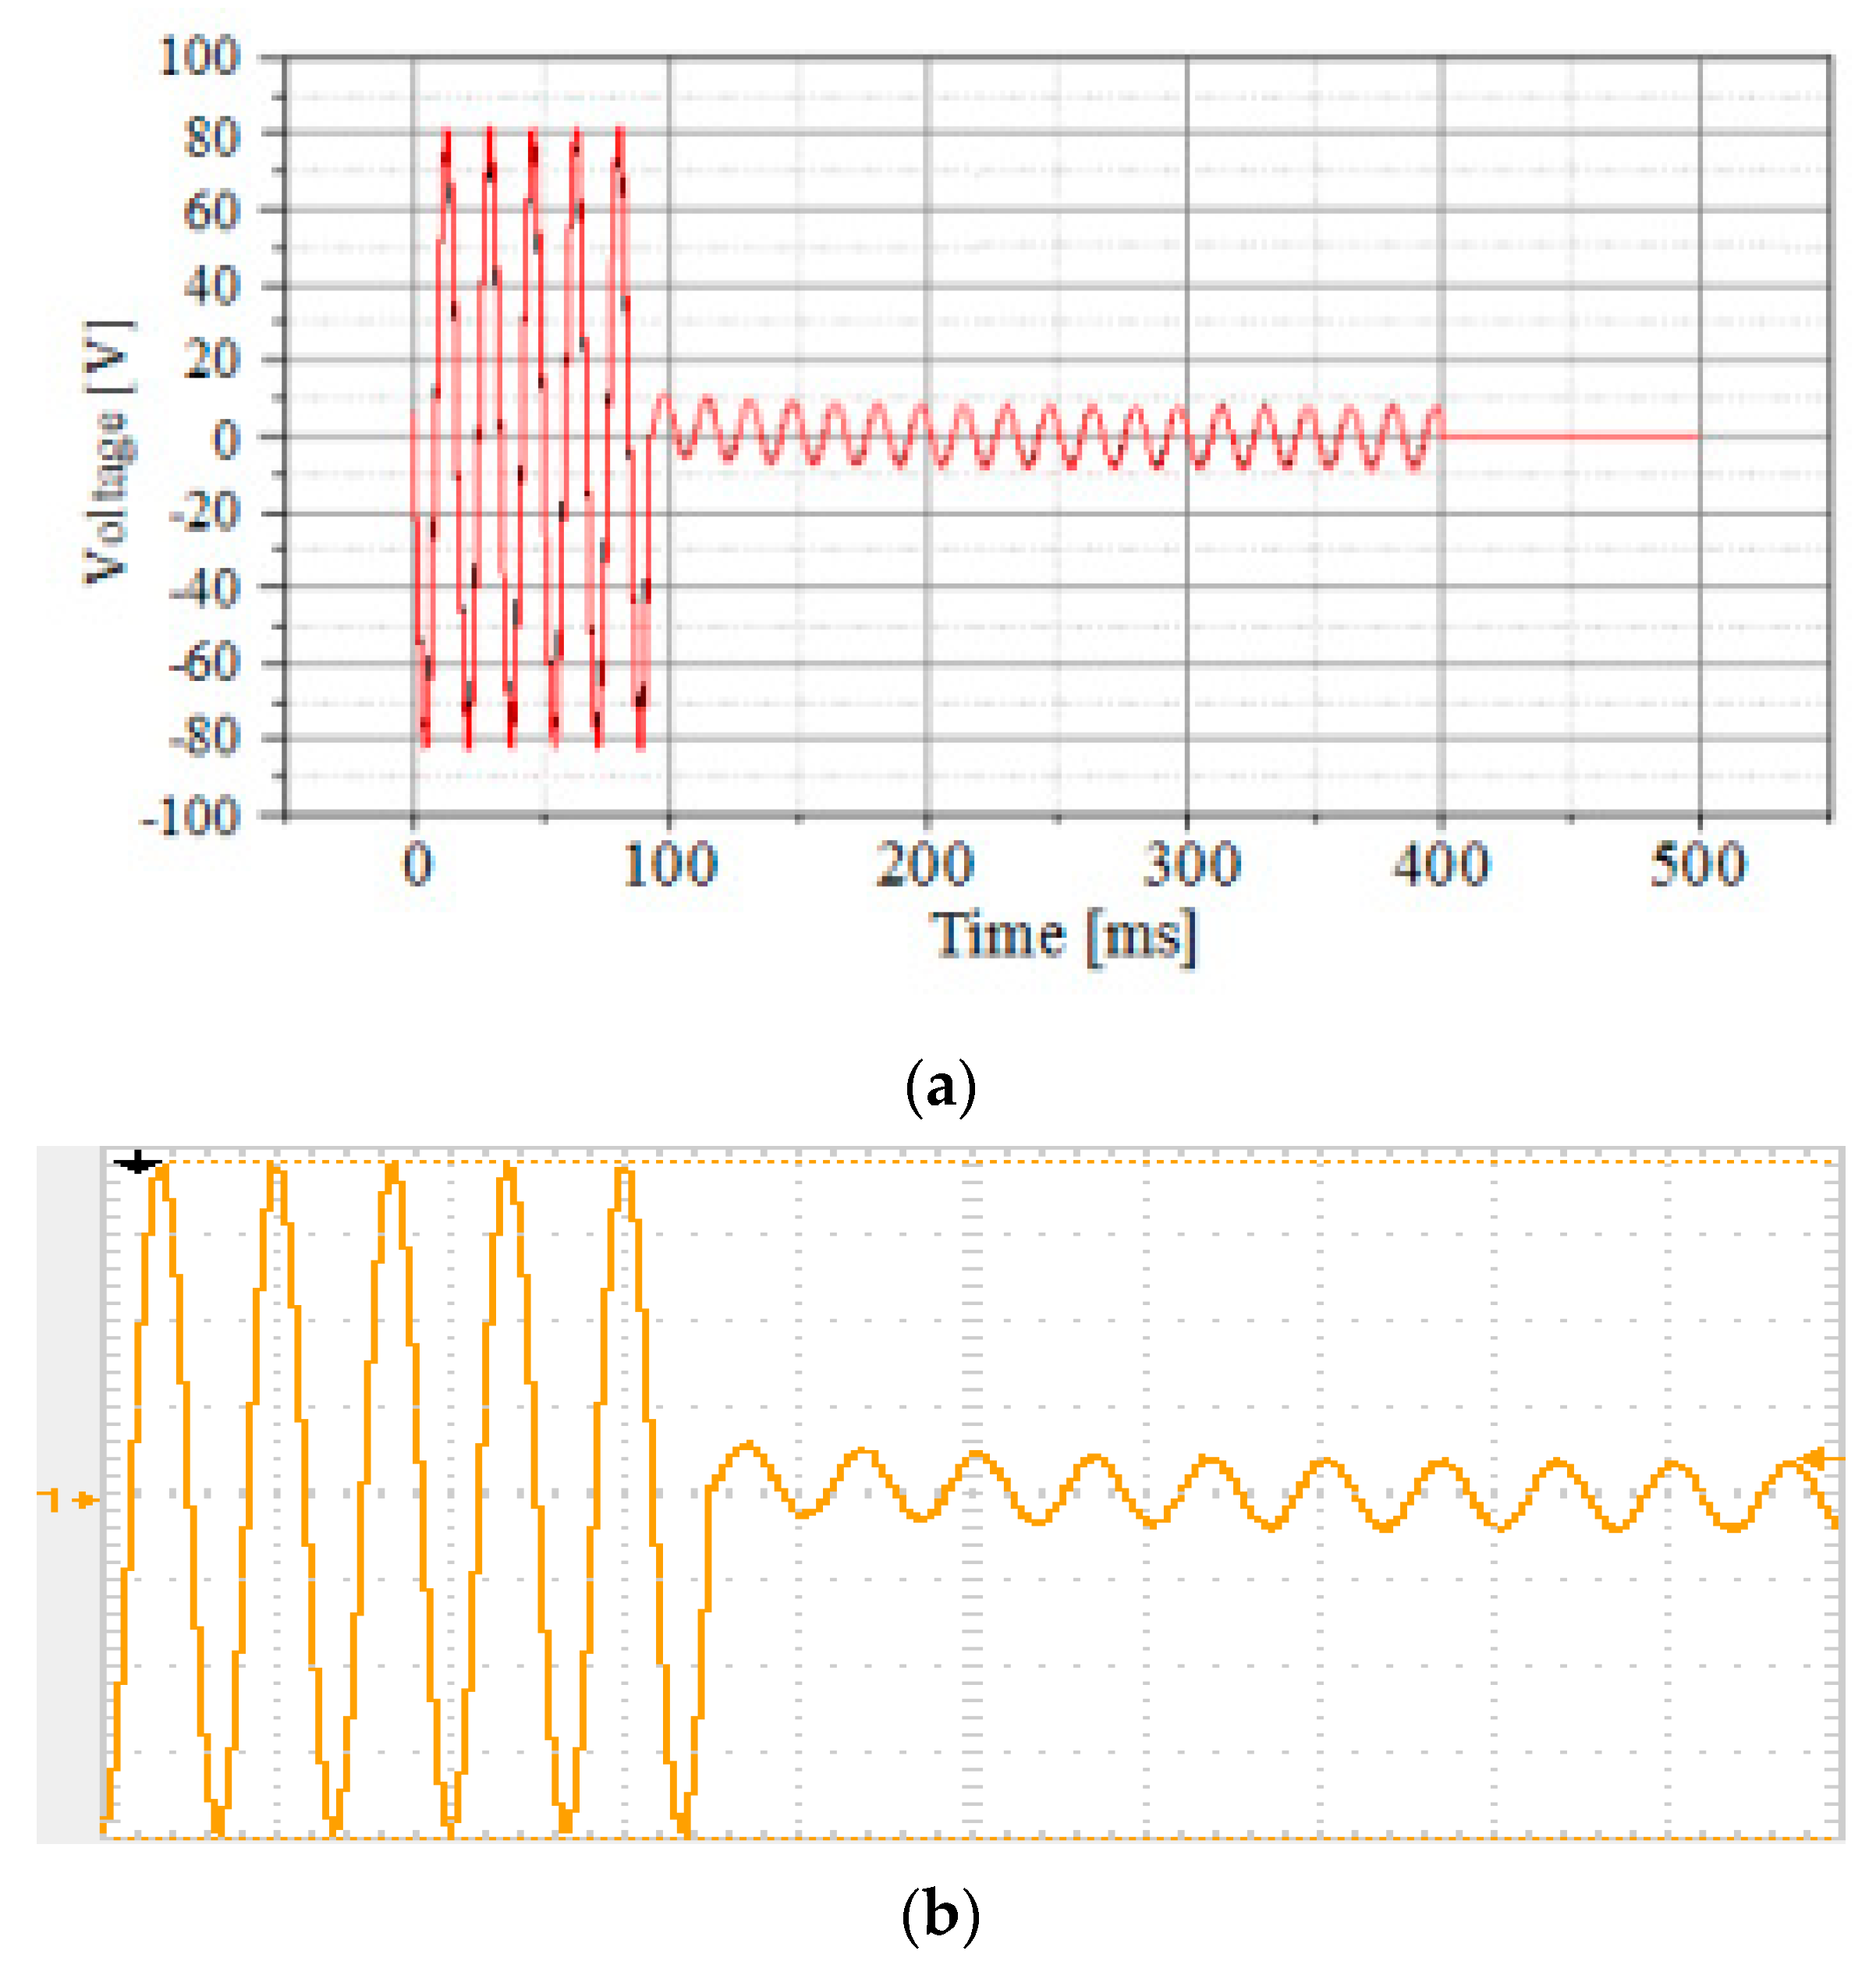
To verify that the external input waveform is accurately implemented with the protective relay, the COMTRADE file generated using PSCAD/EMTDC was entered into the simulator, and then the output waveform was checked, as shown in
Figure 10. Upon comparing, the maximum value of the COMTRADE input waveform was 77.06 V, while the maximum value of the output waveform of the simulator was 78.4 V, showing that it is possible to output accurate waveforms with an error rate of 1.73%.
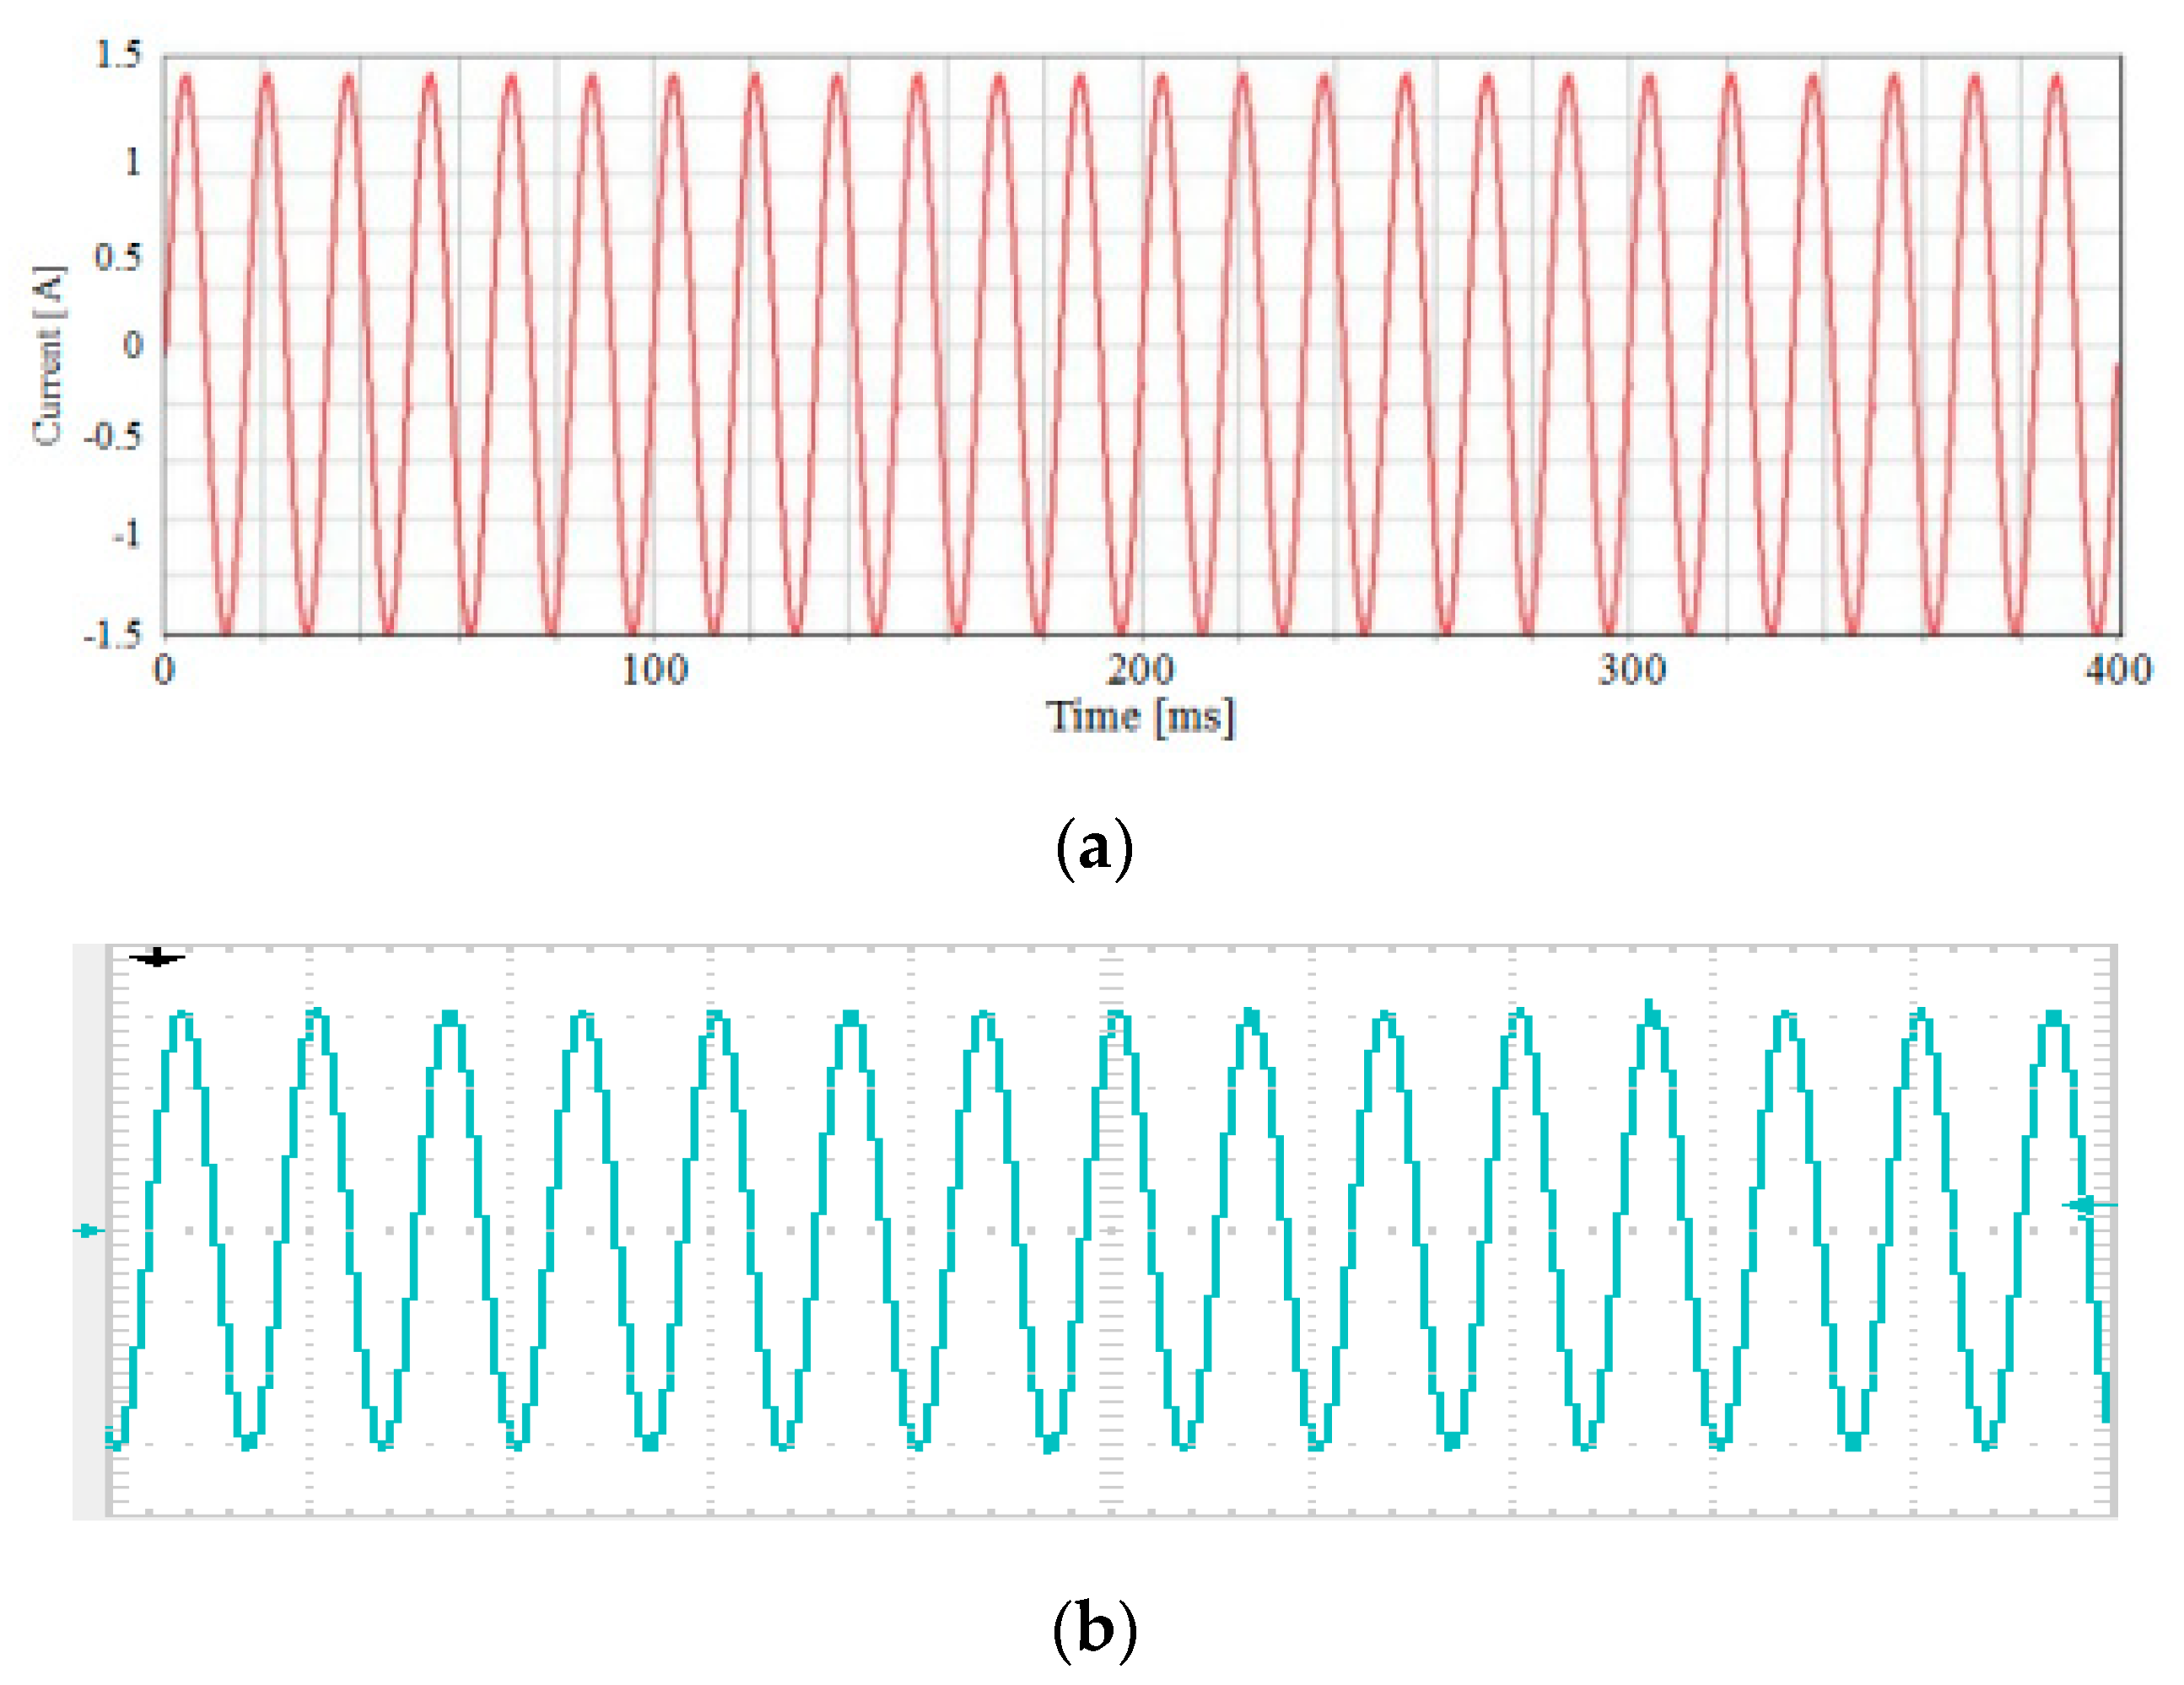
To ensure that the correct output is produced when generating the desired waveform, simulator input/output waveform comparison was performed using a waveform generation function, as shown in
Figure 11. The CT ratio used to measure the output waveform was 400 mV/A. The maximum value of the waveform set on the simulator was 1.4 A, and the maximum value of the output waveform was 1.5 A; thus, it was confirmed that accurate waveforms can be generated and output.
4. Case Study
As PREDIS-R is a simulator for testing the performance of the protective relay for the railway system, a case study was conducted according to the scenarios given in
Table 4 to validate the performance test results of protective relay. The input waveform used in the case study consists of both the external input waveform and internal waveform generated by the user.
First, using PSCAD/EMTDC, the TPSS was modeled to reflect the actual domestic data, and then the contingency was simulated. In this case, the fault voltage and current waveform were converted into COMTRADE format and entered into the digital simulator interconnected to the protective relay; then, it was checked whether the relay worked with the simulator. To facilitate checking the operation of the relay, the fault resistance was assumed to be 0 Ω. Each protective relay element must operate in coordination depending on the voltage and current measurement position, such as the incoming panel and distributing panel of the substation and the location of the relay. However, this study does not consider them, as it focuses on verifying the performance of a simulator that injects abnormal waveforms into the relay and monitors the operating status of the relay.
The TPSS model using PSCAD/EMTDC in the simulation of Case 1 through Case 4 is shown in
Figure 12, and the detailed parameters of the system are shown in
Table 5.
It was modeled using the actual data of the TPSS, and checking the location of the fault simulated for each case is possible. The system is mainly divided into the substation (SS), sub-sectioning post (SSP), and SP. Each division has an AT to compensate for voltage drop. In SS, a Scott transformer is in operation, which can receive power from the utility and transform the three-phase voltage level of 154 kV to 55 kV on a single phase. This is a characteristic of the autotransformer feeding system and is intended to output twice the voltage applied to the electric train load in the substation. The autotransformers are installed at SS, SSP, and SP—one each at the up and down tracks to supply power. Each division is about 10 km apart, and the reason for operating the autotransformer is to compensate the voltage drop. In this feeding scheme, the installation interval of the substation can be extended. The neutral point of the autotransformer is commonly grounded together with rails and protective wires at 2.8-km intervals within the catenary section, and it causes an offset of the communication inductive interference.
To check the operation of the protective relay software, the distance relay protecting the TPSS was modeled using PSCAD/EMTDC.
Figure 13 shows the relay operating trajectories for each case, and a detailed operating time comparison with simulators is shown in
Table 6.
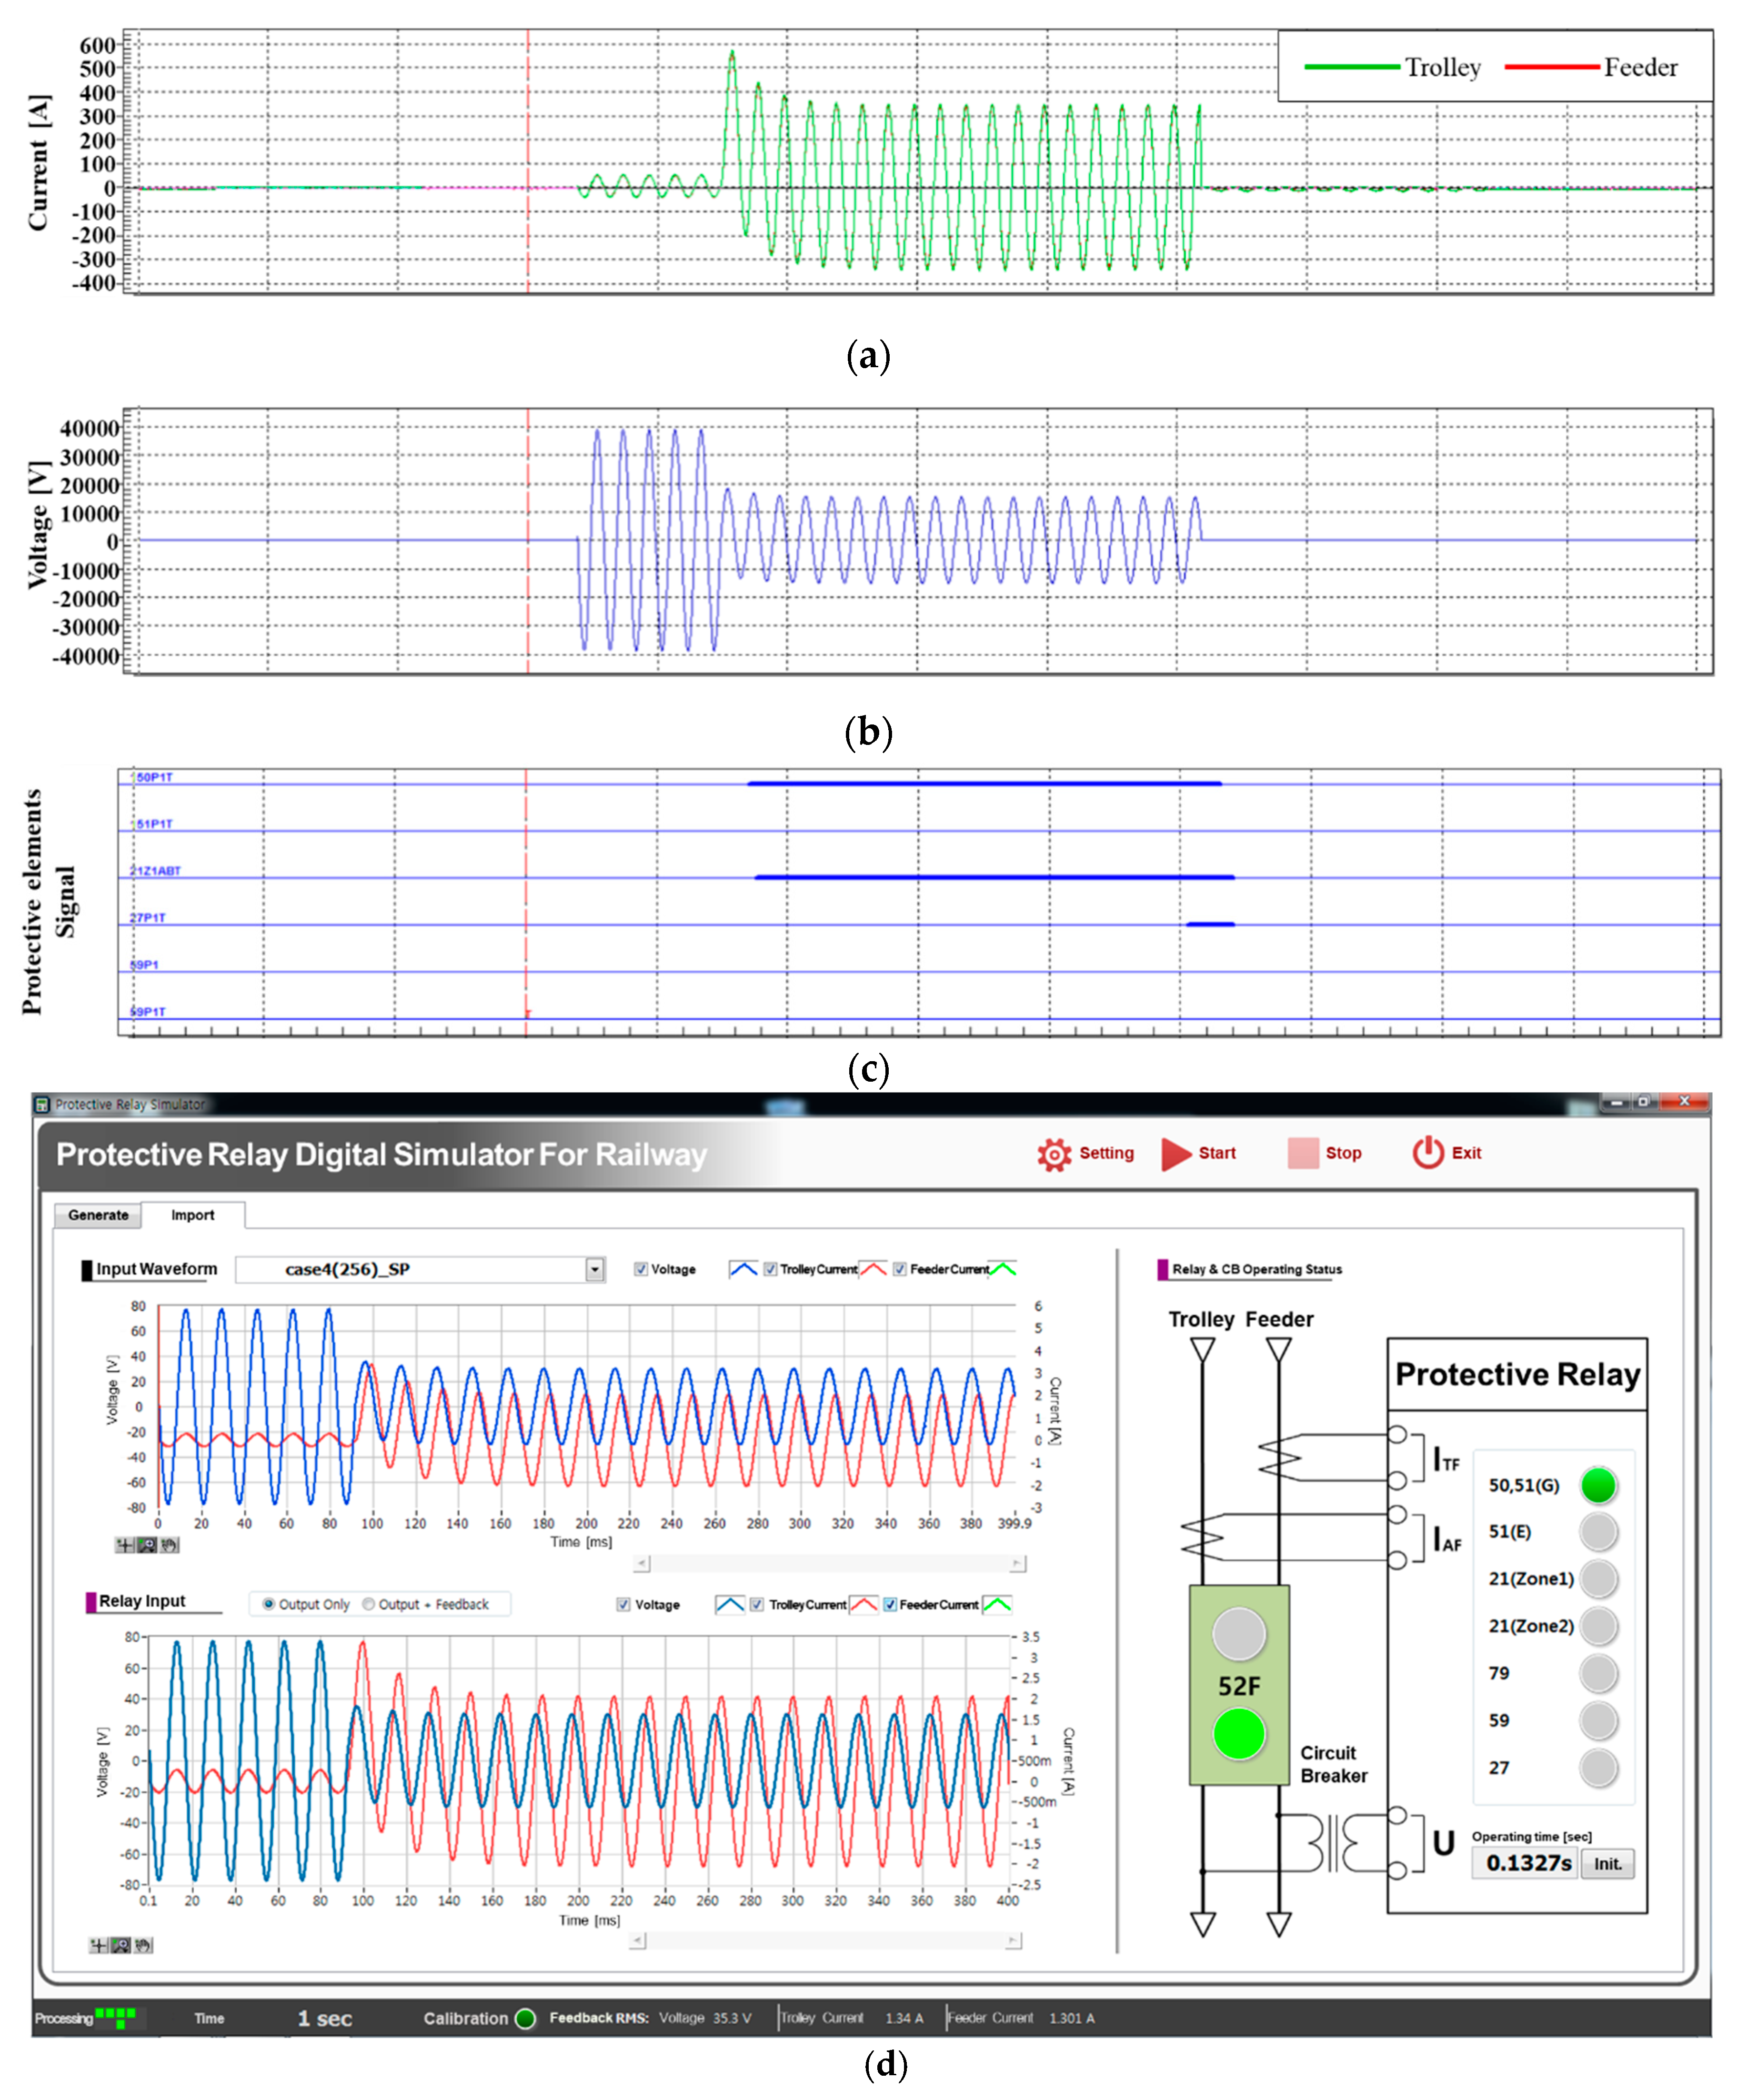
Figure 14 represents the results for Case 1. The distance relay element and overcurrent element of the integrated protective relay were operated within one cycle owing to trolley-rail short circuit fault near the SS. Each relay was used as the main protective relay and the back-up protective relay in the TPSS.
Figure 15 shows the input and output waveform information and relay operation information displayed on the simulator interface. It is possible to intuitively identify the relay elements that operate in response to a simulated fault.
Figure 16 shows the result for Case 2 and the simulator interface output screen. Similar to Case 1, it is confirmed that the proposed simulator imports the COMTRADE file correctly and displays the results appropriately after checking the protective relay behavior.
Figure 17 and
Figure 18 represent the resulting waveforms corresponding to Cases 3 and 4, respectively, which are cases of feeder-rail short circuit fault near SS and SP, respectively. It was confirmed that identical to the previously simulated trolley-rail short circuit fault, the relay operated when an analog signal was input into the protective relay, and the result was accurately outputted from the simulator.
Table 6 compares the operating time of the relay using the simulator with the relay operating time using the PSCAD/EMTDC. It is verified that both sides have been properly modeled with a smaller error in the operating time, and it is expected to be able to perform accurate simulations through cross-validation on both platforms when validating and testing the performance of protective relays later. The operating time of the relay shows the sequential operation of the protective elements, and the last operating protective element is time-overcurrent relay.
The current of the TPSS contains harmonics owing to the switching element of the train, and the protective relay must not operate on these currents including the inrush currents of the transformer. Therefore, as a simulator for testing protective relays, including a function generating harmonics to enable flexible testing in various ways is necessary.
Figure 19 shows the test waveform applied in Case 5, which is assumed to be the load current containing harmonics generated randomly by the simulator. The harmonic component included is 13.5% of the second harmonics and 4.9% of the third harmonics.
Figure 20 represents the results of a protective relay malfunction test for waveforms containing harmonics in
Figure 19. The protective relay did not work, implying that the simulator injected the correct test waveform and displayed the relay’s same operating information as the actual operation.
5. Conclusions
Simulator development is essential when developing or testing new protective relays because it is time consuming and costly to verify performance on the real system; moreover, the test space is limited. To solve these real-world engineering problems, this paper presented and validated the modern testing simulator for protective relay in the TPSS. The developed simulator has the appropriate amplification rate to inject analog signals into the integrated relay and have a function to input external COMTRADE files and generate the simulator’s self-waveform. It was also confirmed that the relay behaves the same as in the actual system under various contingency fault simulations, and the harmonics generation function also works accurately through the relay’s malfunction test.
As a result, by using this proven digital simulator, it is possible to replicate in the laboratory electrical faults that have been detected in the real field without running the test on the real infrastructure, which can significantly speed up testing. The simulator developed in this study is expected to be used in the future to develop new protective relays or validate protective relay algorithms.


