1. Introduction
The goal of HR has always been to match the best candidate with the best position. Competency-based human resource management is one of the most important efforts this search has inspired (
Chouhan and Srivastava 2014). The effectiveness of an organisation is driven by its people, especially its leaders; hence, closing the performance gap between an organisation’s potential in human resources and its actual performance is essential (
Sharma 2015). Since human resources are the primary source of value creation in the services sector, competency mapping and management are particularly crucial (
Alexander and Shalini 2022). In these businesses, it is crucial to continuously emphasize the impact of competence mapping and evaluation on key organisational elements that affect performance (
Waiker et al. 2022). The actual effects of competency mapping on performance, learning, and development, and ultimately all other HR initiatives, must be understood by management, particularly HR managers (
Lafave et al. 2021). Competency mapping is a strategic HR approach for monitoring the effectiveness and growth of an organisation’s human resources (
Lee and Pant 2020). It is widely seen that the HR system may use this paradigm to connect human resources with subordinate goals and the larger vision and purpose of the firm (
O’Brien et al. 2022).
A company’s success is often defined by its people, especially those who create its strategy and are in charge of its action plans, especially in a highly unpredictable corporate environment (
Bemmami et al. 2021). How well a leader controls himself, his job, and others ultimately determine his effectiveness (
Kumar and Bhanu 2022). This calls for mapping, creating, and effectively using many different abilities, ranging from knowledge-level to behaviour-level competencies (
Singh and Snigdha 2016). It is evident that competence mapping affects the management scope’s strategic dimensions (
Silva et al. 2019).
Gaining a competitive advantage depends on a company’s personnel being able to use cutting-edge technology, superior goods, and a continual inflow of cash to join the market (
Coombe et al. 2022). The effectiveness of a company’s technical tools depends on how effectively it can utilise them; these tools are rated on how well the advantages are presented (
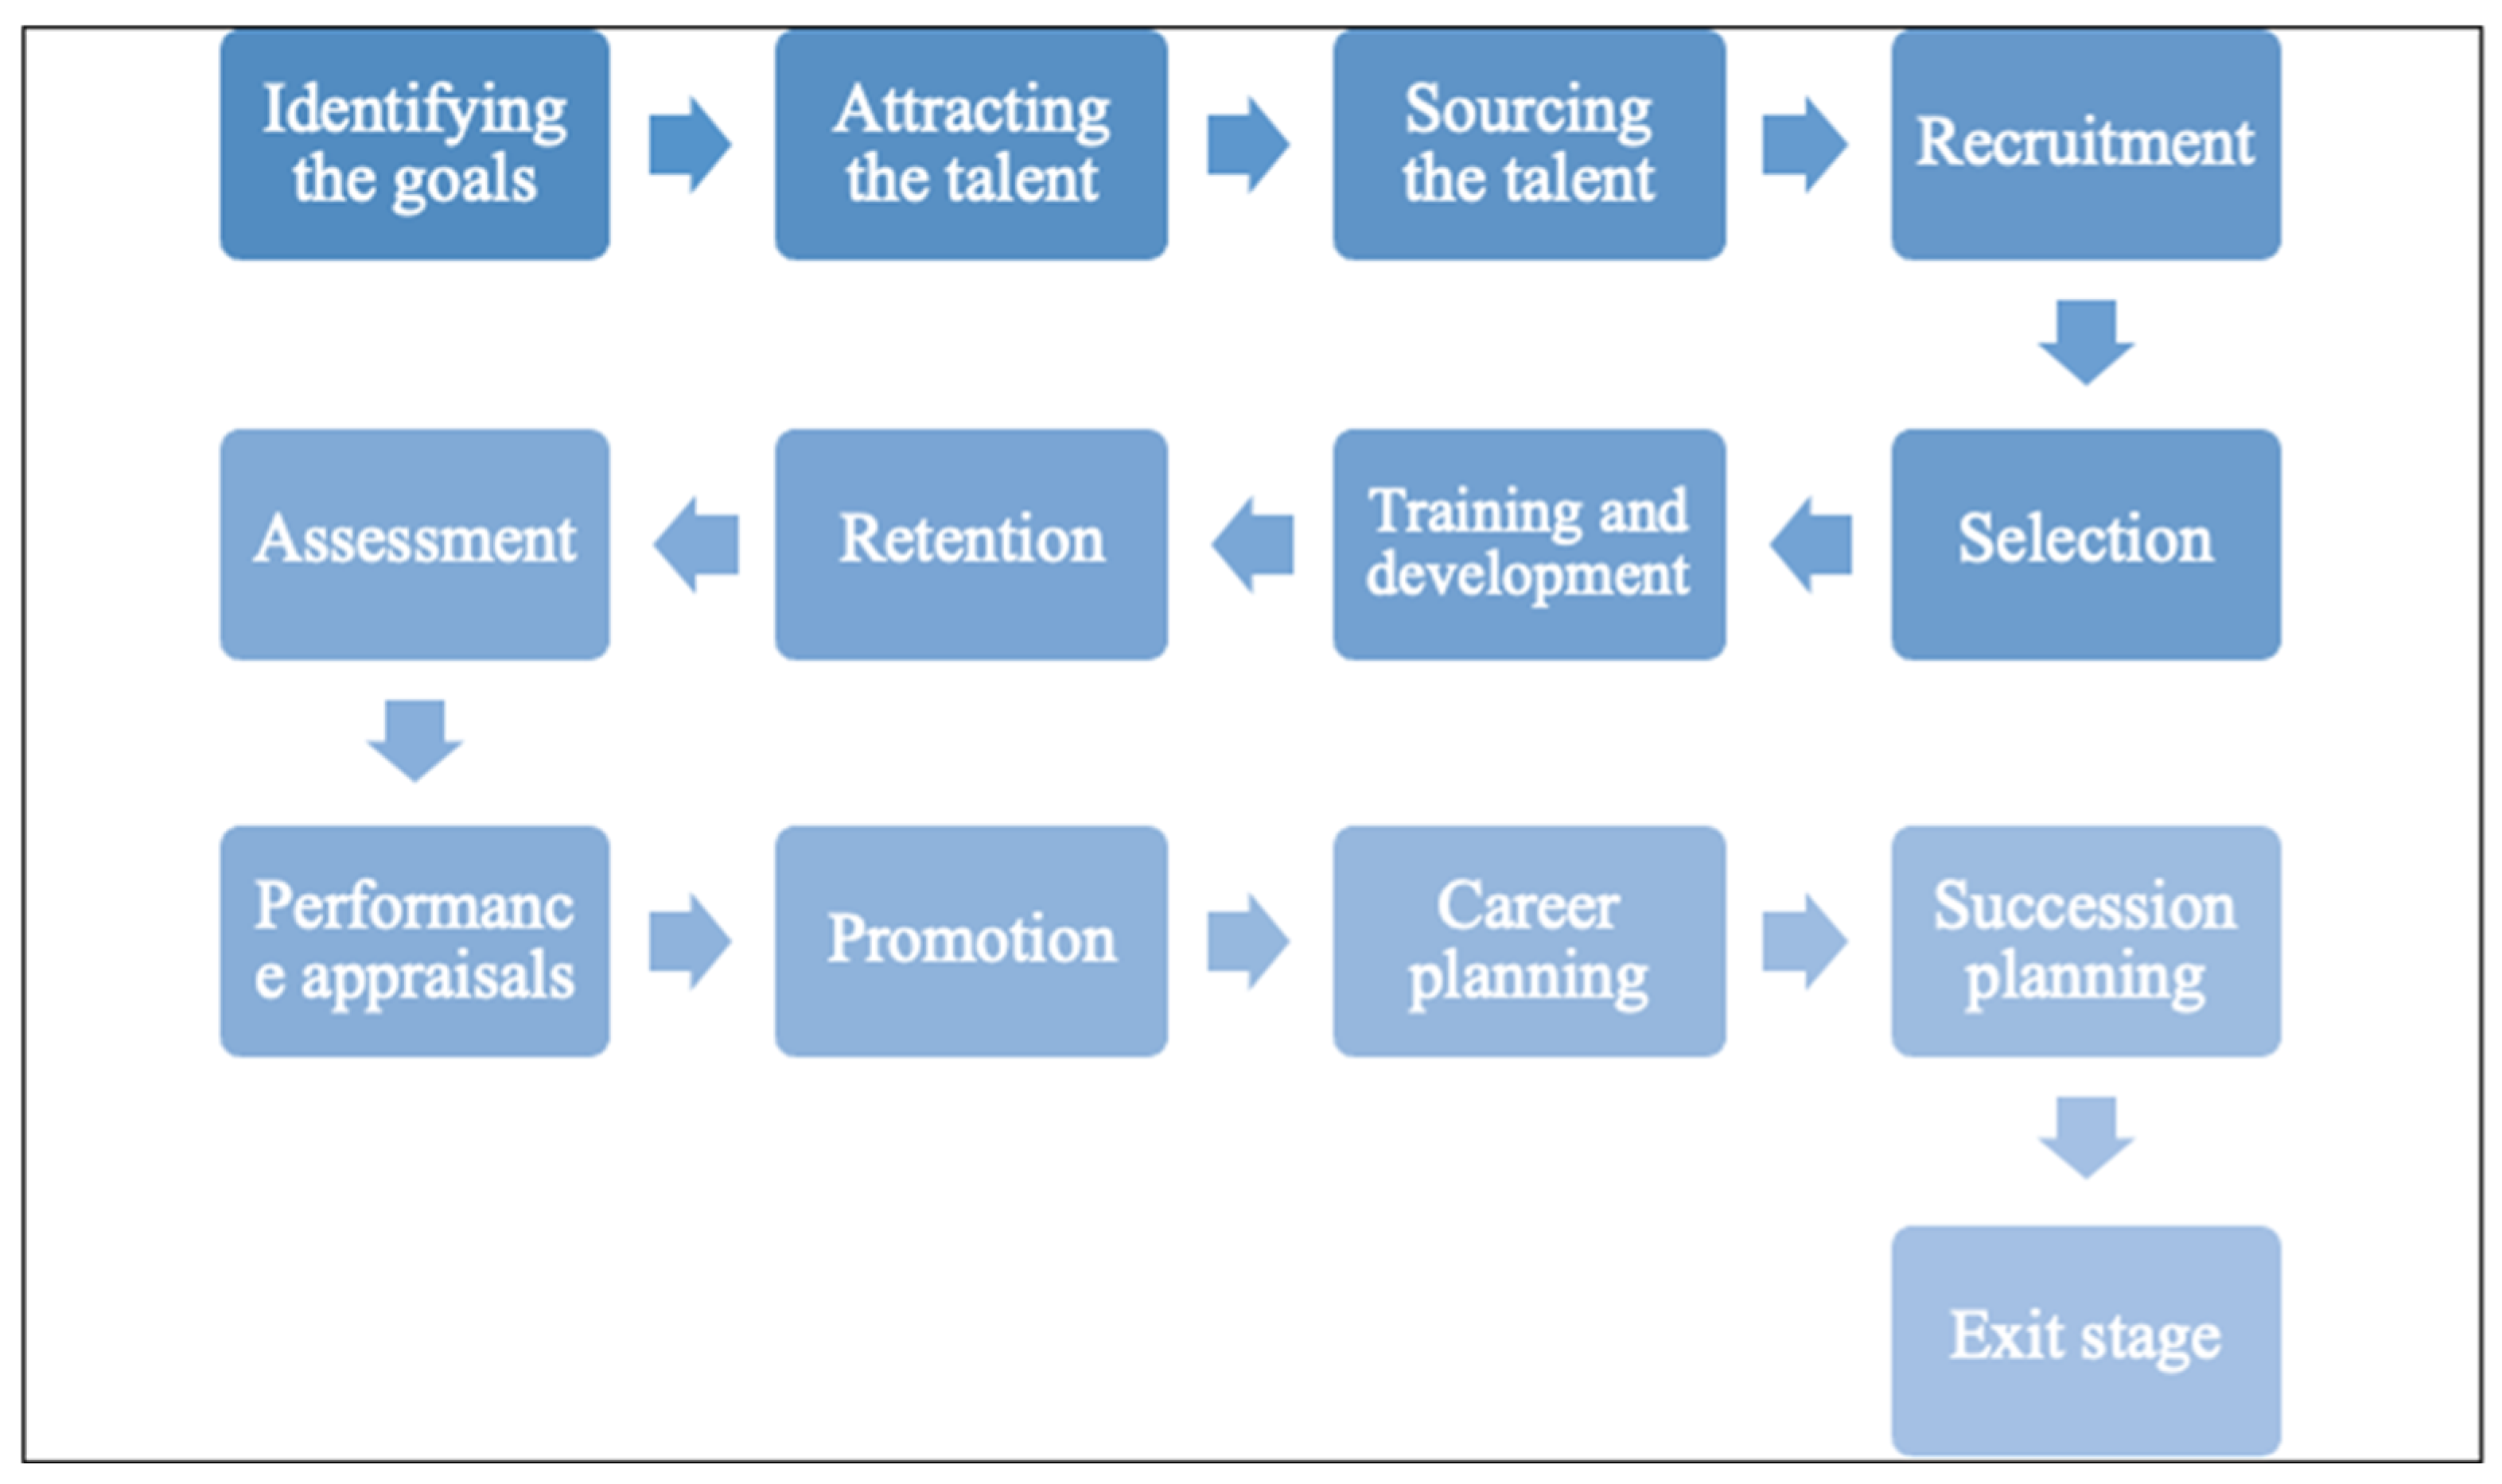
McLagan and Suhadolnik 1989). Below
Figure 1, shoes the talent management process as followed in IT sector.
The Indian IT sector has become more significant to the Indian economy and has contributed to employment creation (
Mani 2013). The success of the Indian IT sector in terms of services and business models has been acknowledged worldwide (
Waghmare et al. 2021;
Saxena and Gujral 2018;
Shivanjali et al. 2019). The client-focused approach, delivery style, protocols, and team orientation of Indian IT organisations are seen to be crucial for their success. However, the industry has its problems (
Saxena et al. 2022).
The following are the most important problems that the IT industry management faces.
Companies need help finding skilled workers who can help them establish and maintain a competitive edge.
Creating and maintaining a committed and competent staff has become an enormous task in today’s highly globalised and competitive market environment.
There are few recognized methods for identifying abilities and potential in personnel.
The factors affecting work positions within the organisation and job performance are quite varied (
Nabi et al. 2014).
Some of these important issues are the focus of the present study. The study tried to put a number on the breadth and depth of skills held by workers in India’s IT industry. The research also sought to identify any discrepancies between the competencies that managers should ideally possess and those they do.
In this research paper, there are five sections. The first section covers the introduction to competency mapping, its evolution timelines, talent management process, and taxonomy of competency for the Indian IT sector. In the next section, a literature review is presented, highlighting the studies of different researchers in this regard. In continuation with the same, the research gap is also identified. In the third section, the research methodology is included. In the same, information regarding population, sample size, sampling technique, survey instruments, data collection, research objectives, hypotheses, statistical tools and techniques, and the scope of the study is discussed. In the fourth section, results and discussions are presented after the collection and analysis of data. In the last, i.e., the fifth section, conclusions are derived from this study and research.
2. Review of Literature
Competence is the collection of observable traits and abilities that support and enhance a job’s effectiveness or performance (
Nayak 2015). The word “competence” initially surfaced as a notion for performance motivation in a 1959 essay written by R.W. White (
Jaman and Hossain 2015). The phrase was defined in “Planning the Executive Development Program” by Craig C. Lundberg in 1970 (
Kumar 2015). The phrase gained popularity when David McClelland published a ground-breaking article in 1973 titled “Testing for Competence Rather Than for Intelligence.” The State Department hired McClelland to utilise the phrase to identify traits shared by high-performing embassy agents and to aid in the recruitment and development of such agents (
Awasthi and Sharma 2016). Awasthi & Sharma exploited the idea regarding performance development and have subsequently popularised it. Its vastly disparate uses cause great confusion (
Awasthi and Sharma 2016).
According to some academics, competence may be defined as the state or quality of being appropriately or highly qualified, having the capacity to carry out a certain function, or as a mix of practical and theoretical knowledge, cognitive abilities, behaviour, and values utilised to enhance performance (
Coombe et al. 2022). For instance, systems thinking, emotional intelligence, persuasion and negotiating abilities, and managerial competence may all be included (
Bemmami et al. 2021).
Competency is a complex and wide-ranging notion that, according to studies on the subject, is defined differently by many scientists. Johansson & Wallo conducted in-depth interviews with several training experts to thoroughly consider what constitutes competence (
Johansson and Wallo 2020). “There is no obvious and distinct consensus about what creates competence,” he said after the interviews.
Effective work performance is based on an individual’s management skills. In today’s cutthroat global market, organisations must put much effort into creating competence models to assist them in identifying the essential skills required to become more successful and competitive in future endeavours (
Worlikar and Aggrawal 2017). Dubious and Rothwell observe that competencies are features that people have and use in methods that are acceptable and consistent in order to get the results you want. The knowledge, talents, features of one’s self-image, social motivations, traits, and thinking are examples of attributes, behaviours, attitudes, and behaving, feeling, and thinking in these ways (
Che Rusuli et al. 2017 ). Competition becomes an integral component of the business, prompting the executives to either occupy a position of competition in the market or to coexist with rivals in the current market (
Ravi and Jayasheela 2016;
Salahat and Majid 2016;
Sani et al. 2016). This raises the likelihood of imitation within the organisation. Competencies are located in workers; physical systems are simpler to copy than management system abilities or a company’s culture (
Singh and Snigdha 2016). This study’s goal is to investigate how this can be achieved, from an organisational viewpoint, with a special emphasis on how the executives’ abilities affect the overall performance of the company to outperform the market competitors (
Rahman and Pande 2016). Most recently, there has been rising interest among academics in the raising and growth of competence indicators to improve organisational and managerial performance and capacities (
Lee and Pant 2020).
The executive class has become very important inside the organisation and is subject to tough challenges in conceptualising and separating capabilities from actual competencies for the organisation’s overall growth (
Alexander and Shalini 2022;
Estrada et al. 2022;
Sharma 2015). However, many theoretical and empirical studies have focused on defining and identifying skills.
Researchers have divided skills into many groups, including hard and soft capabilities: skills, performance standards, and a hierarchy-based categorisation. The organisational and analytical skills are seen as challenging (
Coombe et al. 2022). Creativity, interpersonal communication, and behavioural skills are examples of soft abilities. The definition of threshold competences is the bare minimum necessary for effective performance, while performance competencies are characterised as the abilities and knowledge that truly distinguish between the average and outstanding performers in a hierarchical manner (
Shivanjali et al. 2019).
Szafrański et al. (
2022) probed the future and quality of personnel in the context of problems pertaining to the digitalisation of the economy, such as Industry 4.0, and discovered that linking IT skills and knowledge to the requirements of enterprises and the employment market is an escalating issue for community and training institutions in making development decisions for the region. In this research, a literature evaluation was conducted in the context of potential candidates’ professional abilities in the IT profession in the era of corporate automation and digitalisation. The availability of prospective employee competency resources is determined by a number of elements, including the candidate’s fit to the job description, the date of the offer’s publication, and the candidate’s schooling completion.
Through competency mapping,
Ramola and Rangnekar (
2020) emphasised workers’ understanding of diverse skills and how these skills were used by employees contributing to the organisation. Employees were found to be knowledgeable about skills such as communication, leadership, technical, marketing, and data analysis. Communication, teamwork, decision-making, accounting, and marketing abilities are among the numerous talents that employees possess. The key benefits of competence mapping include increased sales, company profit, and more prospects for advancement.
Through competence mapping,
Sakthi (
2018) focuses on employee understanding of different types of skills and how these skills are employed by employees contributing to the organisation. Communication, leadership, technical, marketing, and data analysis are all determined to be employees’ capabilities. Employees have a wide range of skills, including communication, teamwork, decision-making, accounting, and marketing, and competency mapping has several major benefits, including higher sales, corporate profit, and more prospects for progress.
The process of categorising involves creating a general list of managerial abilities that may help managers perform a variety of tasks more effectively (
Singh and Snigdha 2016). Research that does consider the competency-based viewpoint sometimes primarily concentrates on either the function of organisational strategy or the organisational role of culture in acquiring management skills or in developmental projects that may aid in completing the gaps. However, more effort needs to be made to comprehend the relationship between the systemic effects of all these characteristics on executive and organisational effectiveness, especially in a scenario where the dynamic changes are occurring at a rapid pace. How employees behave is quite concerning.
3. Research Gap
The literature evaluations mentioned above revealed that although research in other industries was conducted, they still need to address the competence mapping of information technology professionals. According to NASSCOM’s annual stock-taking exercise, the IT services sector is expected to increase by almost two times from the pre-pandemic levels of fiscal year 2019, reaching $227 billion and employing a total of 5 million people.
Most research showed that recruiting and selection were only ever addressed in general terms in the past. The human resource team would typically use a set of tools and techniques to assess the IT professionals’ competency, but due to technological advancements and difficulties with remote work brought on by the pandemic, the emphasis has shifted to include a set of behavioural traits in addition to IT expertise. The competencies are mapped following an employee’s behavioural traits and technical skill set. The mediating impact of competence mapping in connection to recruitment and selection has yet to be studied via research.
Rajiv Gandhi Chandigarh Technology Park’s (RGCTP) inauguration in September 2005 has proven to be a turning point in the northern region of India economic change. Numerous information technology/information-technology-enabled services (IT/ITeS) businesses have been drawn to it, and it has also aided in the expansion of IT operations. The literature evaluations above demonstrated that the research was performed for IT professionals who worked in Bangalore or Delhi NCR. Due to the IT/ITeS sector’s employment of almost 200,000 people in these cities and the region’s rapidly expanding technical institutes, job opportunities have significantly increased. The recruiting and selection processes have yet to be the subject of any studies attempting to undertake a quantitative assessment.
4. Research Methodology
Research Objectives
Hypotheses of the Study
H0a: There is no significant relationship between the demographic variables and competencies of IT professionals.
H1a: There is a significant relationship between the demographic variables and competencies of IT professionals.
H0b: There is no significant difference in factors in competency mapping of IT professionals.
H1b: There is a significant difference in factors in competency mapping of IT professionals.
The respondents for this research were people working in the Information Technology sector only. The study was conducted in the month of November 2022. The study was based on an exploratory research design. The questionnaire contained two parts: the demographic profile of the respondent and the relevant statements to infer the factors contributing to competency mapping. The study pattern randomly selected samples using random sampling techniques within the population selected. The aim was to tentatively obtain 600 samples from area sector of the population in the present study. A self-structured questionnaire was formulated, pre-tested, and then applied to gather information with the aim of solving the explored problem (
Chouhan and Srivastava 2014). In the questionnaires, 5 points of the Likert scale technique were used and considered appropriate for this study, as it involved the systematic collection of observable, measurable data and statistical analysis of data. The research aimed to qualitatively identify the relationships among a specified set of variables.
This study was framed within the positivist research framework, which was quantitative, with the main purpose being to describe and explain the survey method. Primary data were collected through different methods, including questionnaires, personal interviews, and scheduled methods from IT professionals. Secondary data included data collected from various sources, published as well as unpublished research work, books, magazines, government reports, brochures, journals, periodicals, and research papers presented at various conferences and internet websites. An extensive literature survey was conducted to collect secondary data to identify different variables, potential contemporary issues, and clarity of concepts.
Descriptives
The coding for different items are as follows (see
Table 1)
Statistical Tools Used
The information gathered from the polls was outlined and investigated with the utilisation of SPSS 23.0. This programme works with precision and presents data of unwavering quality, and it was therefore easy to decipher the information so gathered.
Detail of Tools applied in data analysis.
5. Results and Discussion
Objective 1: To examine the demographic variables of IT professionals (see Table 2) According to the demographic study, the majority of respondents (53.10%) were below 25 years, while the minority (only eight) were above 45. In the data sample, the distribution of respondents by gender was reasonably equal. Approximately 57% of responses were male, with 43% of respondents being female. Similarly, the sample had an almost equal number of married and single persons when eight respondents who indicated “Other” as their marital status were excluded. The majority of responders had advanced degrees (37%), most likely doctorates or above; only a small percentage (15%) had were yet to graduate. Additionally, data from descriptive demographic analysis indicated that professionals in the IT sector were well compensated, since only 14% of respondents in the sample had a monthly salary of less than INR 20,000.
Additionally, almost 48% of respondents earned more than INR 60,000 a month. This was also explained by the fact that most workers in the sample had the longest tenure in the IT sector (more than 15 years), being about 48% of the sample, while 24% had experience ranging from 10 to 15 years. Notably, most respondents, that is, almost 73%, worked less than or equal to 8 h each day in IT organisations. This has a number of implications regarding the industry’s work culture, flexibility, and efforts to achieve work–life balance. A larger percentage of employees were also part of nuclear families, which could comprise two to five individuals. The respondents were divided into groups based on the employee group they belonged to, i.e., whether they worked in the company’s HR department or as technical IT specialists. In this study sample, the technical staff made up around 45 percent of the workforce, while HR made up about 55 percent. This also indicates a balance between the various worker categories, making comparing how each group views competence mapping easier.
Objective 2: To identify factors in competency mapping among IT professionals.
The first step in writing this part was to perform a thorough literature search to determine the various abilities that individuals working in information technology (IT) organisations need. Thirty-two of these competencies were taken from the evaluation process in total. Factor analysis was used to condense the examination of such a large number of statements, since it was extremely complicated to analyse claims simultaneously. By using this method, similar competencies could be grouped into linked entities known as factors. Exploratory factor analysis utilising principal component analysis (PCA) was used for this aim. According to
Hair et al. (
2006), factor extraction is based on an eigenvalue of 1 or above, and Varimax rotation is utilised to obtain factor loadings of at least 0.5 or greater.
Exploratory factor analysis for competencies of IT professionals
The abilities of IT professionals are shown in the following table with descriptive data, including mean and standard deviation. (see
Table 3) As can be observed, the majority of the items have a mean close to or higher than 4, and the standard deviation is somewhat close to 1. This suggests that most respondents agreed that individuals working in IT organisations must possess certain abilities, such as conceptual, interpersonal, and technical skills, as well as behavioural or knowledge-based competencies.
Then, factor analysis was used to distil these components into factors and confirm the constructions’ factor architecture. The factor analysis findings for these components are shown in
Table 4 and
Table 5. As can be seen in
Table 4, all of the items’ extracted communalities are more than 0.5, which shows that the extracted factor adequately accounts for all of the items’ variations. Between 0.567 and 0.903 is the generally recognised cutoff number for communalities, with optimum values close to or larger than 0.6 (
Eaton et al. 2019).
KMO values and values for Bartlett’s sphericity test results are shown in the last section of
Table 4. While Bartlett’s test determines whether the variables are interrelated, KMO assesses sample adequacy. In order to determine if a sample is large enough for performing research, the Kaiser–Meyer–Olkin (KMO) formula is used. The KMO value should be more than 0.5. Values between 0.5 and 0.7 are regarded as average, values between 0.7 and 0.8 are good, values between 0.8 and 0.9 are very good, and values above 0.9 are excellent; this shows that the sample is large enough for factor analysis. Whether the correlation matrix is an identity matrix, which would suggest whether the variables are unrelated, is determined using the Bartlett’s test of sphericity. Using Bartlett’s test of sphericity, the variables’ multicollinearity was examined. The result of Bartlett’s test should be at most 0.05. (
Field 2009). The constructs utilised to achieve the second objective’s KMO and Bartlett’s test values were computed, and it was discovered that they were above the established standard (
Table 4). This demonstrated that the data could be used for factor analysis.
The table listed below, i.e.,
Table 5 lists the factor loadings for the three retrieved components (EFA) after the use of exploratory factor analysis. According to
Hair et al. (
2006), the average factor loading of all the factor items was over 0.70. The data reduction method was used to solve the construct validity problem, and all of the data items were heavily weighted in their respective aspects. Principal component analysis was utilised to perform the exploratory factor analysis, and the Varimax rotation approach was used.
Factor 1 accounts for 26.17% of the data’s variation, factor 2 accounts for 23.60%, and the last factor accounts for 20.83%. Together, the three variables account for 70.61 percent of the data variation. This is seen as a fair price to pay for obtaining the best factor analysis findings. When the eigenvalue is larger than 1, the extracted component or factor can likely account for all the data variation.
The findings in
Table 6 also provide alpha values that demonstrate a trustworthy level of internal consistency across all the variables. The findings are trustworthy since Cronbach’s alpha values are higher than the threshold of 0.7 recommended by
Nunnally and Bernstein (
1994).
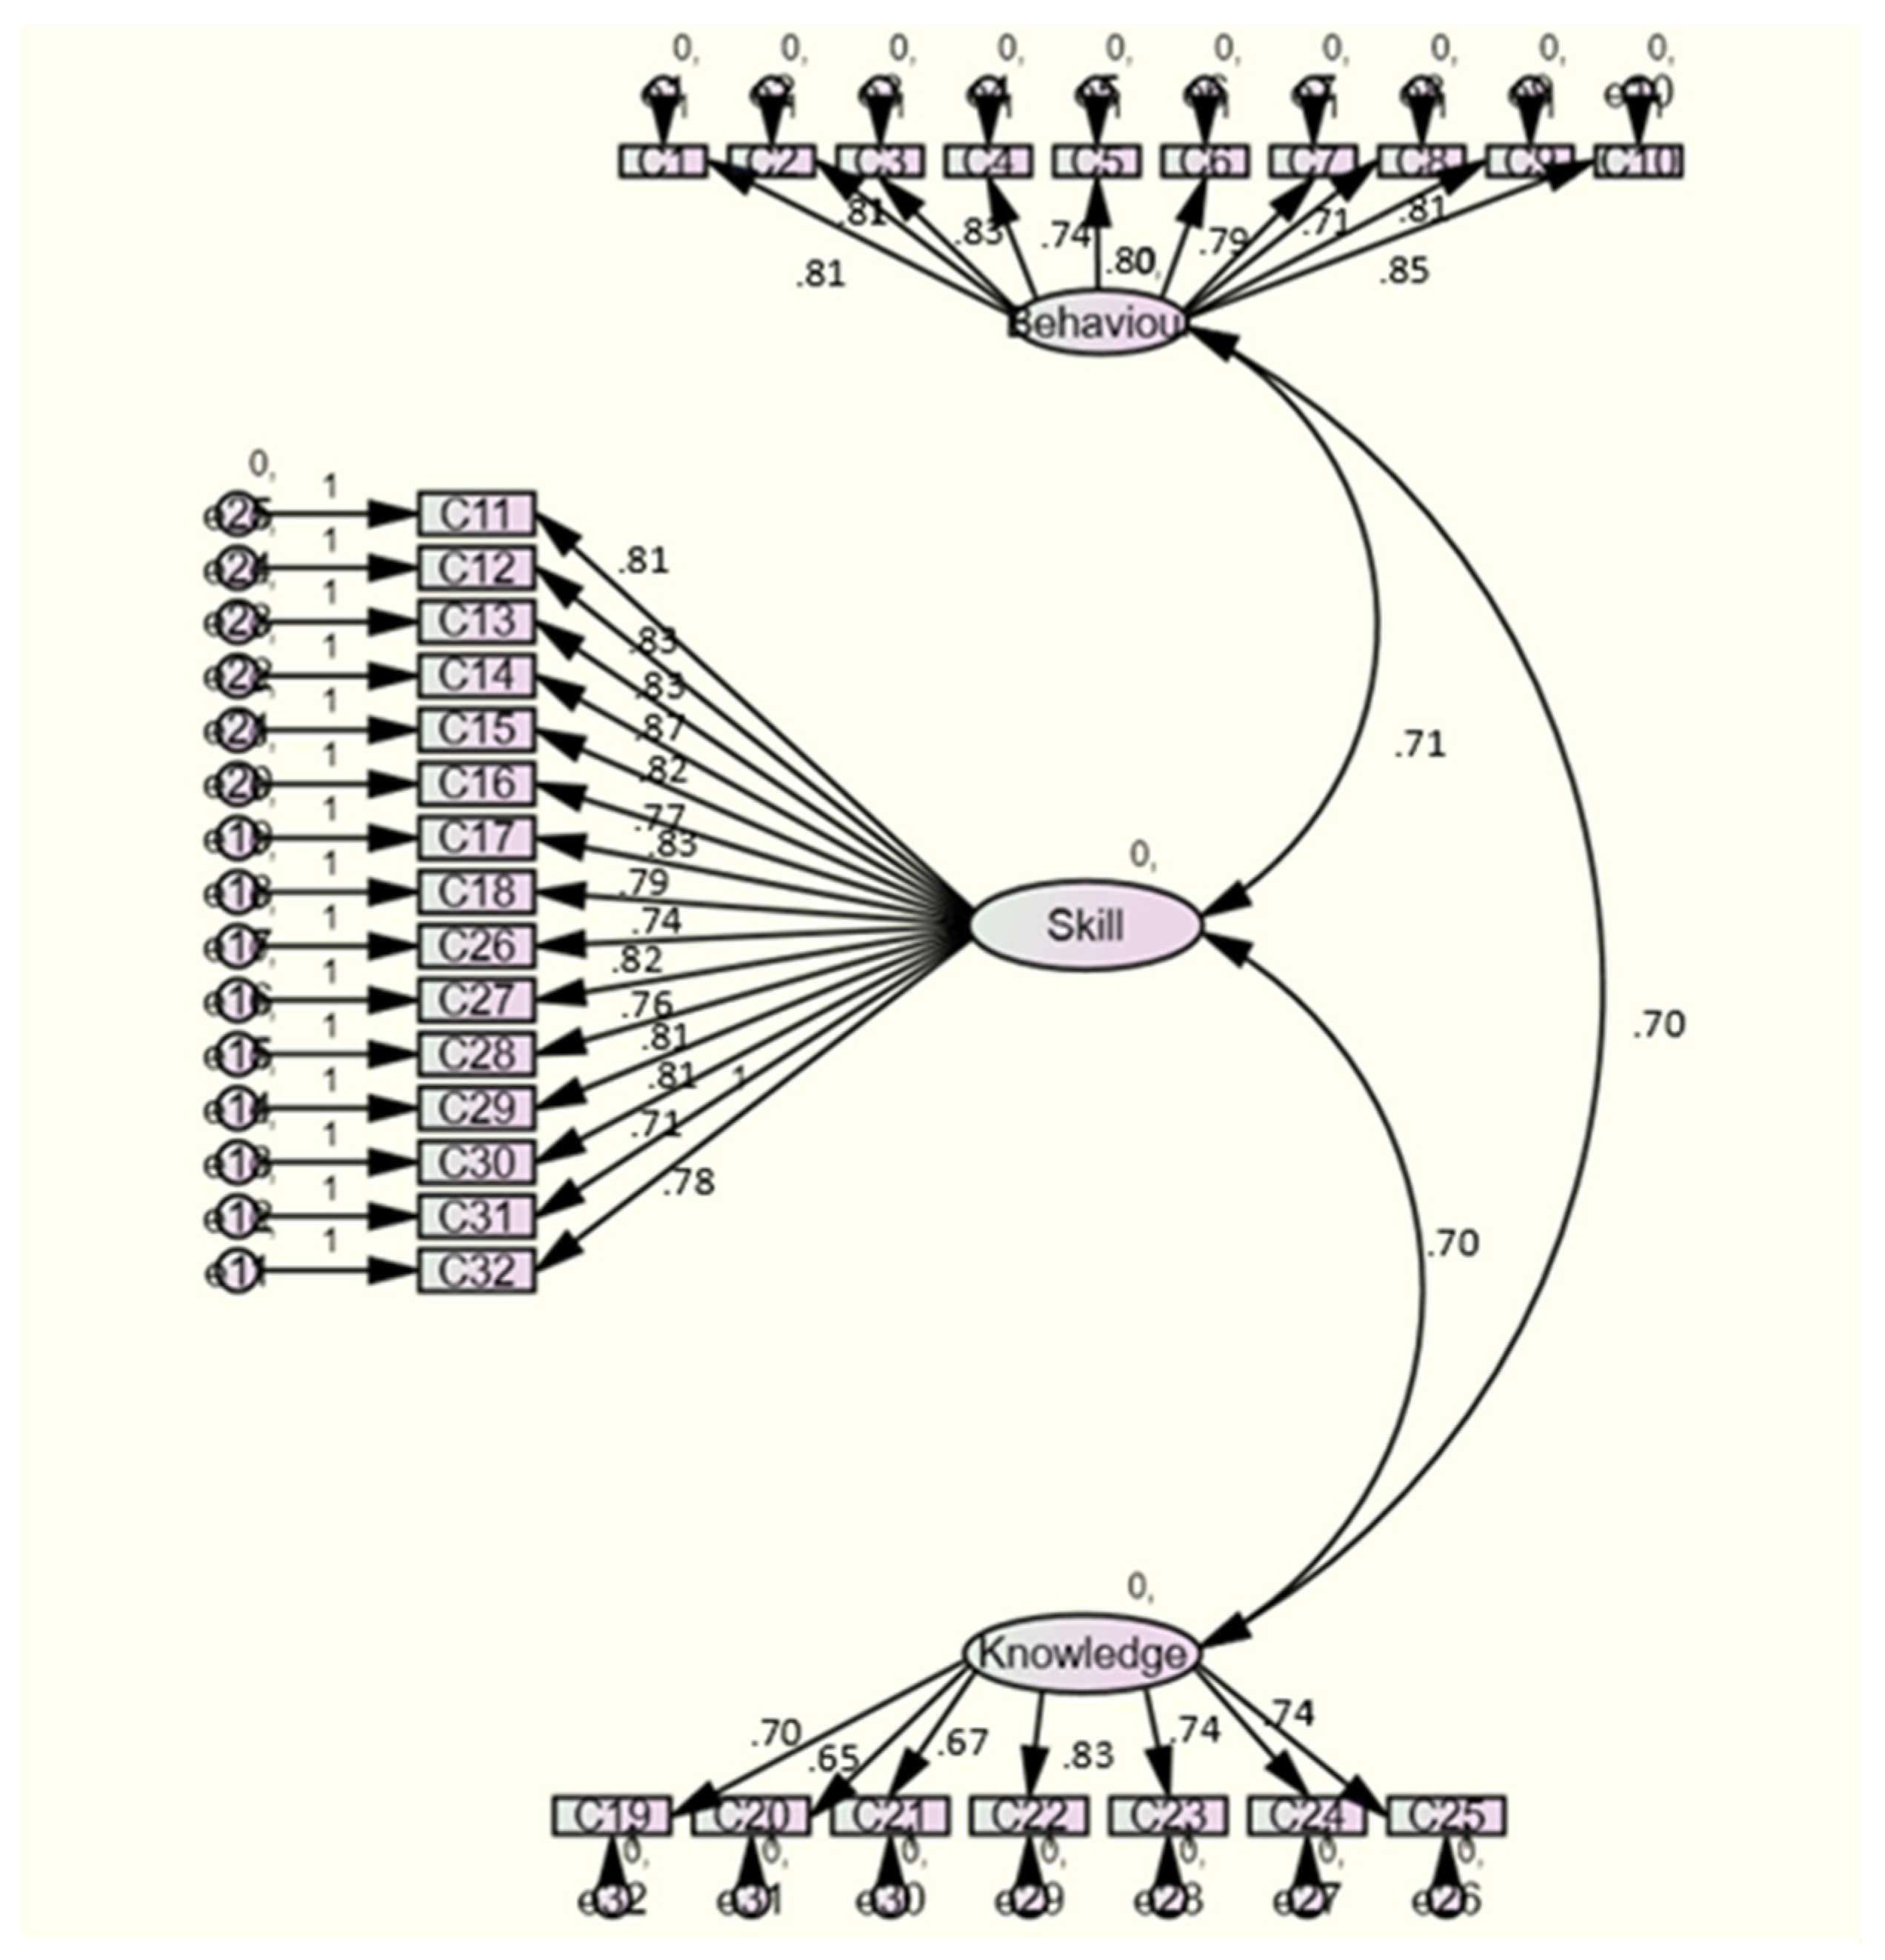
Confirmatory factor analysis for identification of competencies
Confirmatory factor analysis, often known as CFA, was the following phase in the analysis. The results of this analysis support those of EFA. While CFA confirmed the extent to which the extracted factors contained the variables loaded onto them by EFA using the values of the path coefficients, and the extent of correlation between the extracted factors using factor correlation values, EFA reduced the variables into factors that explained the majority of the variance in the dataset.
The findings of CFA applied to the three components and their underlying variables are shown in
Figure 2.
Several models were calculated and evaluated in AMOS to find the best model fit. All 32 variables were included in the final model (
Figure 1), proving their significance. For instance, the variable Skill Competency included elements 11 to 18 and 26 to 32 (
Table 3). Additionally, it validated whether the route coefficients between these variables and the relevant factor were important. The factor loading for each newly produced item should be more than 0.5. Every item’s factor loading for a proven item should be 0.6 or greater (
Zainudin 2012).
Figure 1 shows that the path coefficients were more than 0.5 for all the factors, verifying the factor structure produced by using EFA. In addition, the correlation coefficients between the three components were relatively low.
In CFA, several statistical tests known as model fit indices were used to assess the model’s plausibility and how well it fit the data (
Fox 2010). The values for the various model fit indices generated as a consequence of this research are shown in
Table 6.
The chi-square test was the initial evaluative metric. The better the model fit, the lower the discrepancy between actual and anticipated covariance, as seen in the smaller results of the chi-square test. Given the minimal difference in variances, the result of 1.77 here indicates that the model fit the data well. A score higher than 0.9 indicates a strong model fit, while a value between 0 and 1 is appropriate for the second index, the GFI (Goodness of Fit index). Given that GFI was 0.939, a strong model fit was also implied. NFI (non-normed fit index) and CFI (comparative fit index), the following set of indices, are relative indices. The figures in
Table 5 and the model for this aim confirm that these indices should be greater than 0.95 to indicate a successful model fit. Model fit is assessed using RMSEA (root mean square error of approximation), and a result of less than 0.06 indicates a satisfactory fit, which was the case for this model. The Tucker Lewis index, or TLI, should be larger than 0.9 for a satisfactory model fit, and at the same time, it should never be greater than the CFI value. The fact that this model satisfied the prerequisites for TLI and CFI > TLI suggests that it fit the data well. Since the incremental fit index (IFI) is comparable to the squared R value, a value near 1 indicates a good model fit. Overall excellent model fit was shown by the fact that all absolute and relative index values were above their respective thresholds.
To further support the study,
Table 7 also includes information on the reliability and validity of the extracted factors and the variables that underlay them. The first column lists Composite Dependability (CR), which was also a measure of reliability for internal consistency. For all three constructs shown in the below table, the allowable value of CR was 0.7 and higher.
6. Conclusions
This study reflects that three main competencies are most relevant for an individual to survive in the IT sector. They are knowledge, skills, and abilities, and they load on to the total 32 competencies noted through a review of the literature. The word “competence” initially surfaced as a notion for performance motivation in a 1959 essay by R.W. White. The phrase was defined in “Planning the Executive Development Program” by Craig C. Lundberg in 1970. The phrase gained popularity when David McClelland published a ground-breaking article in 1973 titled “Testing for Competence Rather Than for Intelligence”.
The Indian IT sector has become more significant to the Indian economy and has created many employment opportunities. The success of the Indian IT sector in terms of services and business models has been acknowledged worldwide. The client-focused approach, delivery style, protocols, and team orientation of Indian IT organisations are crucial for their success. However, the industry has its problems.
This study is framed within a positivist research framework, which is quantitative, the main purpose being to describe and explain the survey methods. Primary data were collected through different methods, including questionnaire, personal interviews, and schedule method from IT professionals. Secondary data included data from various sources, published and unpublished research work, books, magazines, government reports, brochures, journals, periodicals, research papers presented in various conferences, internet websites. An extensive literature survey was conducted to collect secondary data to identify different variables and potential contemporary issues and to clarify concepts.
According to this study, the majority of the sample were unmarried males under 25 years of age, with qualifications above postgraduate level, earning more than 60 thousand rupees per month. The majority of the sample had working experience greater than 15 years. They worked 7–8 h per day and hailed from nuclear families with 3–5 members per family. The majority of people in the sample taken were from technical backgrounds.
The first step in developing this section was to conduct a comprehensive literature review to identify the different skills people working in information technology (IT) organisations require. These competencies made up a total of 32 that were picked from the assessment procedure. It is quite difficult to analyse so many claims at once; hence, factor analysis was employed to compress the study. This approach enabled the linking of related competencies into factors, or connected entities. This goal was achieved using exploratory factor analysis using principal component analysis (PCA). Factor extraction based on an eigenvalue of 1 or higher, and Varimax rotation was used to obtain factor loadings of at least 0.5 or larger, according to
Teo (
2001) and
Hair et al. (
2006).
The results indicate that most respondents agreed that people working in IT organisations needed to have a specific set of talents, including conceptual, interpersonal, and technical capabilities as well as behavioural or knowledge-based competencies.
As per the results and analysis, we can infer that null hypothesis H0a, i.e., that there is no significant “relationship between the demographic variables and competencies of IT professionals” is accepted. Additionally, null hypothesis H0b, i.e., “There is no significant difference in factors in competency mapping of IT professionals” is also accepted.
FUTURE SCOPE
This study was limited to the Northern area only, but can be further applied to other parts of the country to study the impact of the competency mapping process. This study was applied to study the competencies of IT professionals specifically, but may also be performed for other professionals. Furthermore, the sample size was very small compared to the population, so in future it may be increased, since the greater the sample size used for data collection, the more conclusive the results that could be drawn from the analysis.


