Article

A Decision-Making Model for Selecting Product Suppliers in Crop Protection Retail Sector

Seoul Business School, aSSIST University, Seoul 03767, Republic of Korea
*
Author to whom correspondence should be addressed.
Adm. Sci. 2023, 13(4), 97; https://doi.org/10.3390/admsci13040097
Submission received: 5 March 2023 / Revised: 24 March 2023 / Accepted: 24 March 2023 / Published: 25 March 2023

Abstract

:
This study aims to determine the importance of factors affecting supplier selection in the pesticide distribution sector as a global emerging market and present a decision-making model for the corporate marketing strategy. Specifically, a comparative study between suppliers and retail distribution experts was conducted to compare differences in the perception of supplier selection factors according to organizational characteristics. Based on previous studies, a decision-making model based on the AHP methodology was constructed with a total of 20 factors in five areas: product quality, price, flexibility, promotion support, and brand. Then, 42 Korean experts were surveyed to measure the importance of these factors. The results showed that product quality is the most critical factor in supplier selection, followed by price, brand, promotional support, and flexibility, in that order. Manufacturers consider product quality as the most important factor, while retailers consider price as the most important factor. Among the 20 factors, ‘quality excellence’, ‘expected return’, and ‘technological competitiveness’ were found to be the most important factors. In addition, while manufacturers considered factors such as ‘corporate reputation’ and ‘corporate trust’ as more important, retailers considered factors related to product characteristics, such as ‘product awareness’ and ‘brand reputation’ as more important.

1. Introduction

The global pesticide market has shown consistent growth, with a year-on-year increase of 4.7% in 2021 and 5.8% in 2022, driven by changes in the regulatory environment and trends towards eco-friendly pesticide development (S&P Global 2023). Developed countries such as the United States, Europe, and Japan account for approximately 75% of the world’s pesticide production, with multinational companies such as Bayer Crop Science, Syngenta International AG, BASF SE, Corteva Agriscience, and Sumitomo Chemical dominating the market (Abhilash and Singh 2009; Sparks et al. 2019). These companies lead research and development efforts and expand their market shares through mergers, acquisitions, and partnerships (Nishimoto 2019).
In the pesticide distribution ecosystem, retailers play a crucial role in connecting manufacturers with farmers. They closely collaborate with manufacturers, monitor on-site conditions, and identify pests, weeds, and demand for pesticide materials in advance to secure necessary products for farmers (Ng 2012; Ahn et al. 2022). Retailers provide consulting services to ensure safe pesticide use, prescribe appropriate products for specific pest or weed problems, and educate farmers on proper application methods (Ayhan and Kilic 2015). They also participate in on-site field trials, evaluate new products, and provide feedback to manufacturers (Palmatier et al. 2006).
Moreover, retailers play an important role in responding to farmer inquiries, coping with farm claims, and transferring knowledge of pesticides to improve supplier performance (Wilson and Nielson 2001). According to a study conducted by Matthews (2008) that targeted 8500 farms in 26 countries, the most important source for growers’ obtainment of information or education and training roles on agricultural input was the retailers nearby on trade relationships. Retailers have a higher influence on farmers in the agricultural crop protection market compared to suppliers or government extension staff. Securing competent retail distribution clients is crucial for pesticide manufacturers to improve their sales performance, while forming business relationships with manufacturing suppliers helps retailers improve their sales competitiveness (Kannan and Tan 2002; Shukla et al. 2022).
However, factors affecting retailer selection decision-making of manufacturing suppliers are not solely determined by products and prices. Retailers must consider various resources necessary for their operation, such as information, consulting, and education, which must be supplied by manufacturers in the developing and changing market (Taherdoost and Brard 2019). Despite the importance of supplier selection in the pesticide distribution market, research from a marketing perspective on trends in the market or changes in distribution channels is insufficient. Few studies investigate supplier determinants in pesticide distribution retailers.
In the rapidly changing global business environment, companies’ innovation strategies and diversified marketing activities are needed. This need is no exception to the agricultural chemicals industry, such as the crop protection sector. Various approaches and decisions should be considered for differentiated marketing strategies and the establishment of a distribution system tailored to changes in the pesticide industry ecosystem according to the business trends. In this respect, a comprehensive search for factors affecting the marketing strategies of pesticide distributors should be conducted. It is also necessary to examine differences in the perception of decision-making between manufacturers and distributors.
Therefore, this study aims to identify the factors affecting supplier selection in the pesticide distribution market, present a decision model, and conduct a comparative study between supplier and retail distribution expert groups to compare the differences in the perception of supplier selection factors according to organizational characteristics. Finally, this research provides strategic decision-making directions for the supplier selection of retailers and suggests specific marketing implications for strengthening the competitiveness of the pesticide distribution sector as a global emerging market.

2. Literature Reviews

2.1. Agricultural Crop Protection Industry and Distribution Market

Crop protection agents are chemicals commonly known as pesticides that are used to protect crops from pests and weeds throughout the crop growth process to secure yields and maintain the production quality while preventing losses caused by pests during storage. Pesticides include synthetic and biological compounds such as pesticides, fungicides, and herbicides (Damalas 2009). The non-use of pesticides was found to result in a significant decrease of the production quantity of rice, corn, and potatoes by 37 to 40% (Oerke 2006). Pesticides play a crucial role in improving the production and quality control of agricultural products.
Pesticide distribution involves the pre-stocking of warehouses by manufacturers in distribution channels, with distribution retailers recommending and selling necessary products to farmers (Ahn et al. 2022). Retailers in distribution channels provide value-added services to the products they sell, enabling end-users to utilize them effectively to achieve their goals (Palmatier et al. 2006). In the pesticide market, retailers provide individual product recommendations or comprehensive pest control programs and work collaboratively with manufacturers through pesticide safety use education, claim handling, product demand forecasting and inventory management, new product development, and on-site evaluation (Rauyruen and Miller 2007). With the unpredictable climate environment, farmers’ claims and various inquiries are increasing, and the role of local farming counselors is also growing (Ayhan and Kilic 2015; Wilson and Nielson 2001).
Agus and Hajinoor (2012) suggested that in order to compete successfully in a challenging business environment, manufacturers must be able to connect effectively with their supply chain members. Today’s business environment is characterized by supply chain success or failure, which are ultimately determined by the end consumer in the marketplace (Agarwal et al. 2006). In the pesticide distribution market, the option of distribution retailers has become important as the price and quality of manufacturing suppliers have recently been leveled (Ayhan and Kilic 2015). The pesticide market is evaluated as a competition between retail distributors rather than a competition between manufacturers.
Pesticide manufacturers must work well with distribution retailer partners to supply more of their products to farmers. Sales increase only when cooperative synergy between suppliers and retail distribution increases (Ganesan 1994; Scheer et al. 2015). As the agricultural environment becomes more complex, with competition in the distribution market intensifying and the influence of product recommendations in retail distribution increasing, the importance of the relationship between retail distributors and manufacturing suppliers in the pesticide distribution market continues to grow. In addition, distribution retailers perform various functions and support strengthening market competitiveness, so it is necessary to maintain a mutually dependent and long-term trust relationship between manufacturers and distribution retailers (Mungra and Yadav 2019). From the perspective of retailers, choosing appropriate suppliers leads to product profitability and reduced operating costs. It also affects the increase in market competitiveness, the speed of customer response, and customer satisfaction (Aksoy and Öztürk 2011).

2.2. Critical Factors Affecting Product Retail

Taherdoost and Brard (2019) have identified significant factors that influence the maintenance of the relationship between manufacturing suppliers and distribution channels in the field of distribution marketing. Previous studies have emphasized the importance of retailers accurately recognizing the decision-making factors for selecting the main transaction manufacturer and reflecting them in their policies to strengthen manufacturers’ competitive capabilities and improve performance (Kannan and Tan 2002, 2006; Ng 2012; Prado and Martinelli 2018).
Table 1 shows that Li et al. (2006) have suggested that price, quality, delivery consistency, product innovation, and new product development are important factors when selecting a manufacturing supplier. Ting and Cho (2008) have explained that purchase cost, quality, delivery reliability, partnership, customer service, and financial position are significant considerations. Aksoy and Öztürk (2011) have summarized that product quality, timely supply and location, and price are critical factors, while Ayhan and Kilic (2015) have suggested that quality, price, delivery date, and sales performance are the most important factors. Johnston et al. (2004), and Kannan and Tan (2002) have emphasized the importance of a cooperative relationship with supplier reliability, honesty, distribution support, brand awareness, and reputation. Gulati and Sytch (2007) have suggested that joint decision-making based on trust and honesty is vital as the interdependence of organizational relations is crucial for achieving results, including supported problem-solving, quality improvement, and cost reduction.
This present study investigates the determinants of suppliers of pesticide distributors, which can be classified into five factors: product quality, supply price, flexibility, promotion support, and brand awareness. The literature suggests that product quality is a fundamental element in transactional relationships, and suppliers with high-quality product production technologies and innovative and differentiated product quality capabilities can enhance their competitiveness (Ting and Cho 2008; Krause et al. 2001; Schweidel et al. 2011; Bettencourt et al. 2005).
Moreover, manufacturing suppliers that are recognized for superior technology and quality excellence over their competitors can receive positive reviews from retailers (Gulati and Sytch 2007). Furthermore, price is a key element of sales, and providing low prices to distributors can be a differentiated characteristic of suppliers (Li et al. 2006; Ting and Cho 2008). However, Monroe and Dodds (1988) and Rao and Monroe (1989) suggested that low prices may be associated with low-quality perception. To improve business relations with retailers, suppliers can provide high discount rates for high-quality products through distribution channels instead of offering low prices (Wu 2002; Wu and Chiu 2016). Additionally, competitive factors such as delivery reliability and process flexibility have a significant impact on organizational performance. Moreover, supplier flexibility implies responsive and flexible responses to retailers’ demands for the timely supply of products, as well as price and inventory losses, lead time, delivery adjustments, urgent order processing, return processing, communication process, and responsiveness (Rosenzweig et al. 2003; Kannan and Tan 2002; Johnston et al. 2004; Palmatier et al. 2006; Celuch et al. 2006; Taherdoost and Brard 2019; Ng 2012).
Promotion support from suppliers is necessary to strengthen competition in the distribution market, and customer service, such as promotional support, can improve supplier performance by adding non-price service elements (Kannan and Tan 2006; Selnes and Sallis 2003; Rogers et al. 2002; Croxton et al. 2002; Wilson and Nielson 2001; Lu et al. 2011). Finally, brand awareness plays a crucial role in stimulating consumers’ purchasing needs and encouraging actual purchase behaviors. Brand awareness is formed by building customer relationships and gaining trust in brand products (Alphonce 1996), and positive brand experiences lead to purchasing behavior and increase the likelihood of continuous purchases (Gulati and Sytch 2007; Roch and Shanock 2006; Agarwal and Narayana 2020). Distributors prefer suppliers with higher brand awareness compared to competitors, and customer satisfaction and resale rates also tend to be high (Bianchi and Saleh 2020; Tan et al. 2021; Ilyas et al. 2020).

3. Materials and Methods

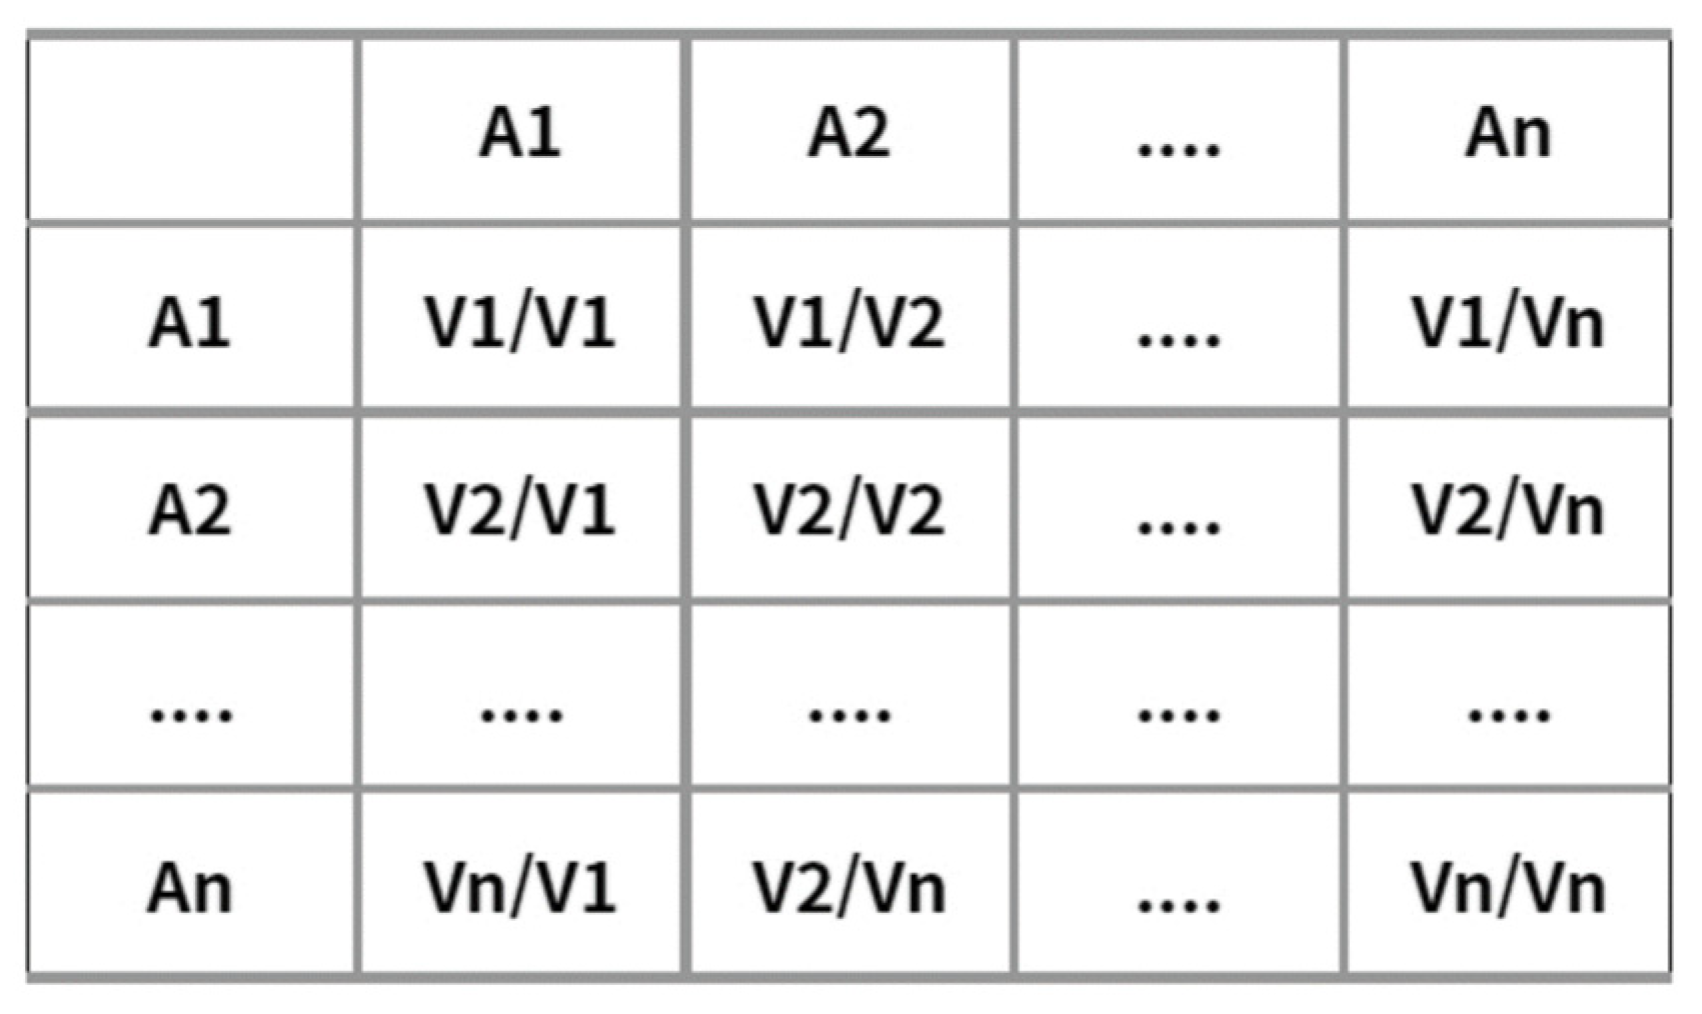
3.1. Analytic Hierarchy Process (AHP)

This study employs the Analytic Hierarchy Process (AHP) technique to establish a decision model for selecting product suppliers for crop protection distribution retailers. The AHP analysis is a hierarchical decision-making method developed by Saaty in 1977 (Saaty 2008). This methodology has proven to be a robust decision-making tool, which has been applied to analyze intricate and unstructured issues across various sectors such as defense, health, education, agriculture, and forest management (Alphonce 1996; Bellver and Mellado 2005; Dongó et al. 2018; Kim and Kim 2020).
The AHP method structures the components under consideration to compare the relative influence of importance and priority among them. It can analyze the relative strength and qualitative judgment of preferences and contradictory opinions of decision makers by reflecting both the qualitative and quantitative aspects of the decision process (Yoo and Kim 2018; Roy and Shaw 2021; Kou et al. 2021). The method is also useful in various areas where multi-attribute decision making is required, particularly in analyzing the priority influencing factors of decision-making for planning, resource allocation, and prediction (Kurttila et al. 2000; Emamat et al. 2022).
This study assesses the importance of each response by adding the results of individual evaluators with a consistency ratio value of less than 0.1 after a pairwise comparison matrix analysis and geometric averaging. Whenever the consistency ratio value of the response is greater than 0.1, it is excluded. The value of the paired comparison responded by the expert group is aggregated to calculate the importance, or weight, of each sector and based on this, it is checked whether all respondents responded reliably and consistently. In the weight calculation method, the pair comparison value for each problem is arranged in a square matrix, and the weight for each problem is calculated using it (Xiao et al. 2023).
When each sustainable sector issue is set to A1…An and the degree of sustainability is set to V1…Vn, the paired comparison values for each issue are arranged in a square matrix [A] as in Figure 1. V1/V1 is compared to A1 itself, and its value is 1. V1/V2 is a value that shows the severity of A1 compared to A2, and V1/Vn is a paired comparison value of A1 compared to An.
Next, a consistency analysis is needed to find out how consistently the severity between the factors subjectively judged by the expert group responded while satisfying the axiom of fulfillment. This study obtains the maximum principal (eigenvalue λ max) to perform consistency analysis. Furthermore, the Consistency Index (CI) is obtained using λ max. After that, the CI obtains the Consistency Ratio (CR). Consistency is determined with this consistency ratio (CR).
λ max is derived through the following process. In other words, multiplying the n × n square matrix [A] and the n × 1 weight matrix [W] yields a new n × 1 weight vector matrix [Y], which can be obtained using the component Y1…Yn and the weight W1…Wn. This is expressed as an equation as follows:
[A] × [W] = [Y]
λ   m a x = Y 1 / W 1 + Y 2 / W 2 + + Y n / W n n
The consistency verification is judged by the consistency ratio (CR), which means the proportion between the consistency index (CI) and the random index (Random Index) is determined by the size of each matrix. The consistency ratio shows how the consistency of respondents surveyed differs from that of random responses, and the consistency index is defined as follows:
C I = λ   max n n 1
λ max ≥ n (n = dimension of matrix)
Here, the consistency ratio (CR) is obtained by comparing the value that may occur when a subjective paired comparison is arbitrarily performed, that is the random index and the consistency index. Although we do not expect respondents to respond completely consistently in pairwise comparisons, it is usually considered to have responded well if the CR is less than 1.0.

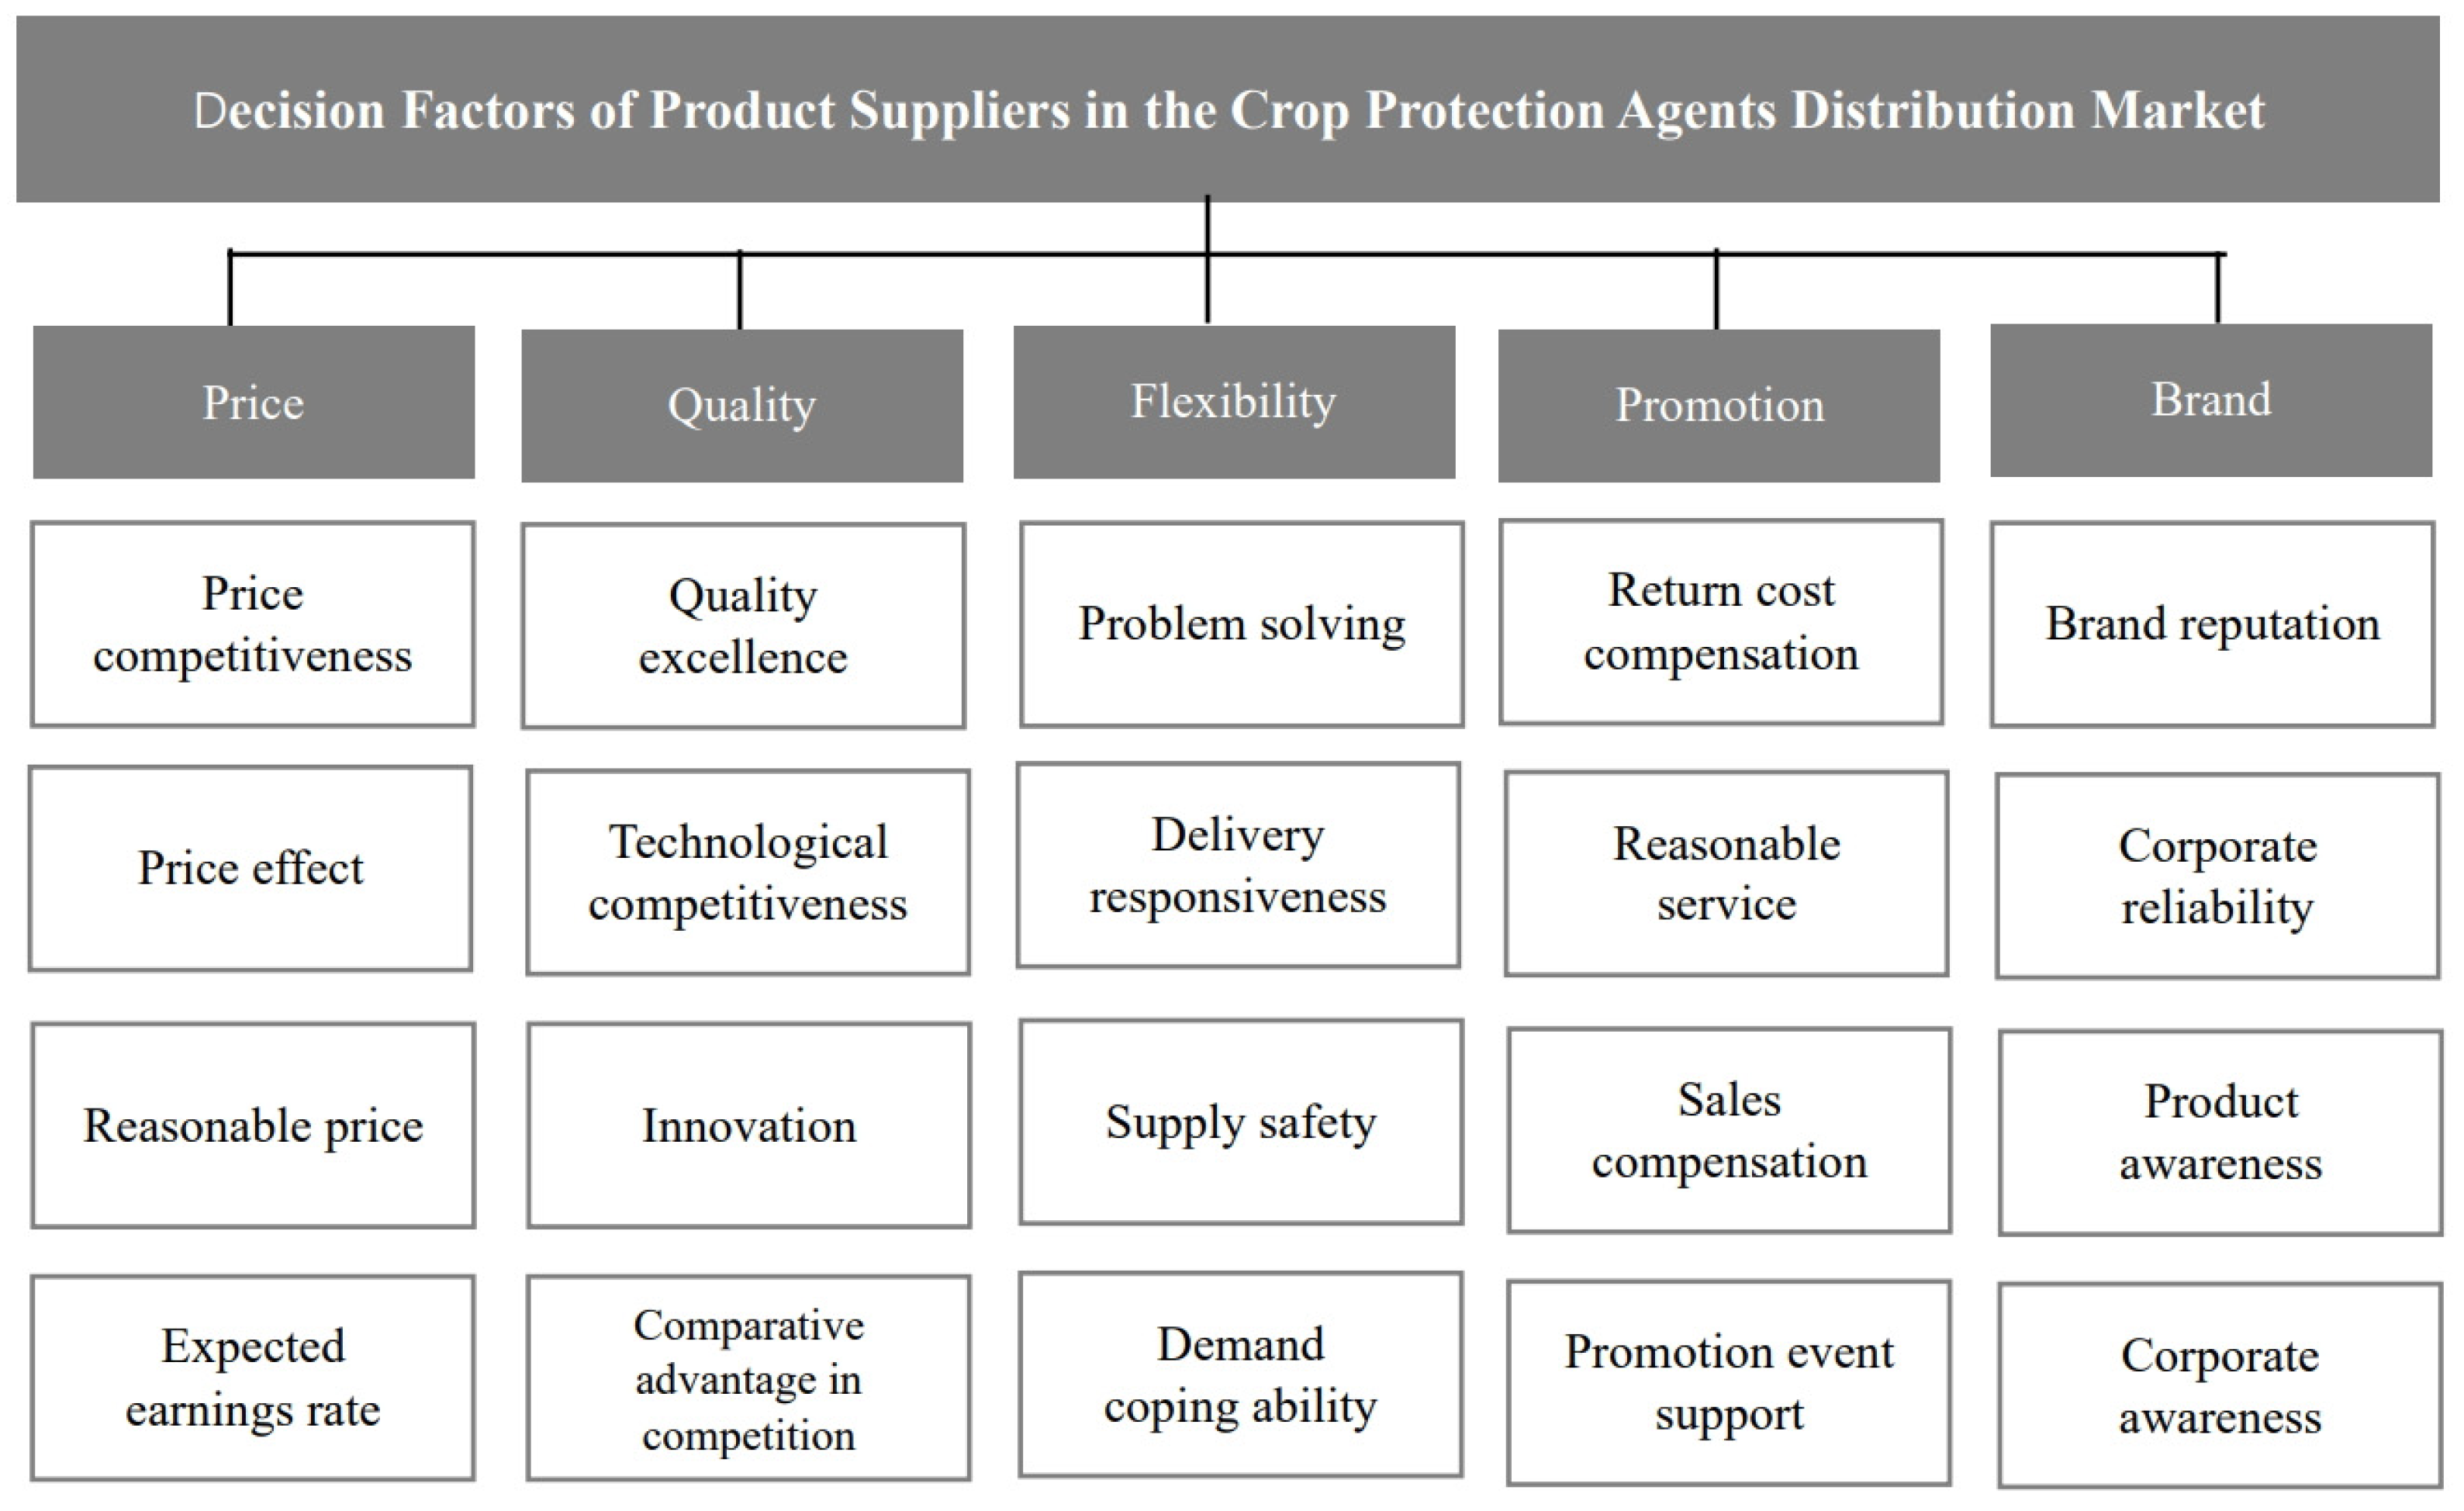
3.2. Research Framework and Variables

Following the research stage presented by Pesonen et al. (2000), the evaluation area and evaluation factor were first defined based on previous studies, and the hierarchical structure was designed accordingly. For each evaluation area, a nine-point scale pair comparison questionnaire was prepared to determine the relative importance between evaluation factors.
This present study’s research framework and variables in retail distribution are illustrated in Figure 2. To ensure that the decision model’s components in each layer were mutually exclusive and collectively exclusive, brand, promotion support, transaction flexibility, product quality, and price recognition were identified as key areas based on prior research. To enhance the AHP major factors’ objective reliability and supplement and modify detailed items, a group of 5 experts with more than 25 years of experience in the pesticide industry reviewed the factors derived from prior research through in-depth interviews. The structure of a total of 20 factors in five areas was found to be appropriate.
For this reason, ‘Quality’ in the study refers to a factor of competitive competency for the product quality of suppliers. ‘Price’ denotes the level of a customer-friendly pricing policy that affects the decision of product suppliers. ‘Flexibility’ was defined as a factor that indicates how actively a supplier responds to difficulties in retail distribution, such as emergency demand response and problem-solving support. ‘Promotion’ is support for sales activities or preservation of related costs that impact the determination of product suppliers. The “Brand” factor was defined as a brand-related factor that affects crop protection distributors to determine product suppliers, which includes recognition of and trust in companies, reputation, and recognition of products. A total of 20 detailed sub-variables were constructed around these five core areas (refer to Table 2).

3.3. Research Process and Data Collection

In the present study, an Analytic Hierarchy Process (AHP) questionnaire was constructed based on the designed model, and data was collected through this questionnaire over a period of 8 weeks from 16 November 2022 to 11 January 2023. The survey participants were selected by dividing them into two groups, namely, a group of managers in the pesticide manufacturing suppliers and retail owners and managers who have been engaged in the pesticide market for at least 10 years. The supplier group comprised managerial positions in global organizations and listed pesticide manufacturers in Korea, whereas the distribution retailer group targeted experts directly involved in crop protection retail and distribution.
The survey was conducted through online explanations or direct visits, and guidelines were provided to respondents to ensure their understanding of the survey’s purpose and key factors. A total of 54 questionnaires were collected, and 42 questionnaires were used for analysis after excluding 12 inconsistent questionnaires. A consistency ratio of 0.1 was used to ensure the reliability of the survey response results.
Table 3 displays respondent information indicating that the majority of the participants were male (95.2%), with 47.6% of respondents in their 40s, followed by 31.0% in their 50s, 11.9% in their 30s, and 9.5% in their 60s. More than half of the participants had a career period of between 10 and 20 years (52.4%), 33.3% had a career period of between 20 and 30 years, and 14.3% had a career period exceeding 30 years. The supplier group and the retail expert group were analyzed at an equivalent rate of 50%.

4. Results

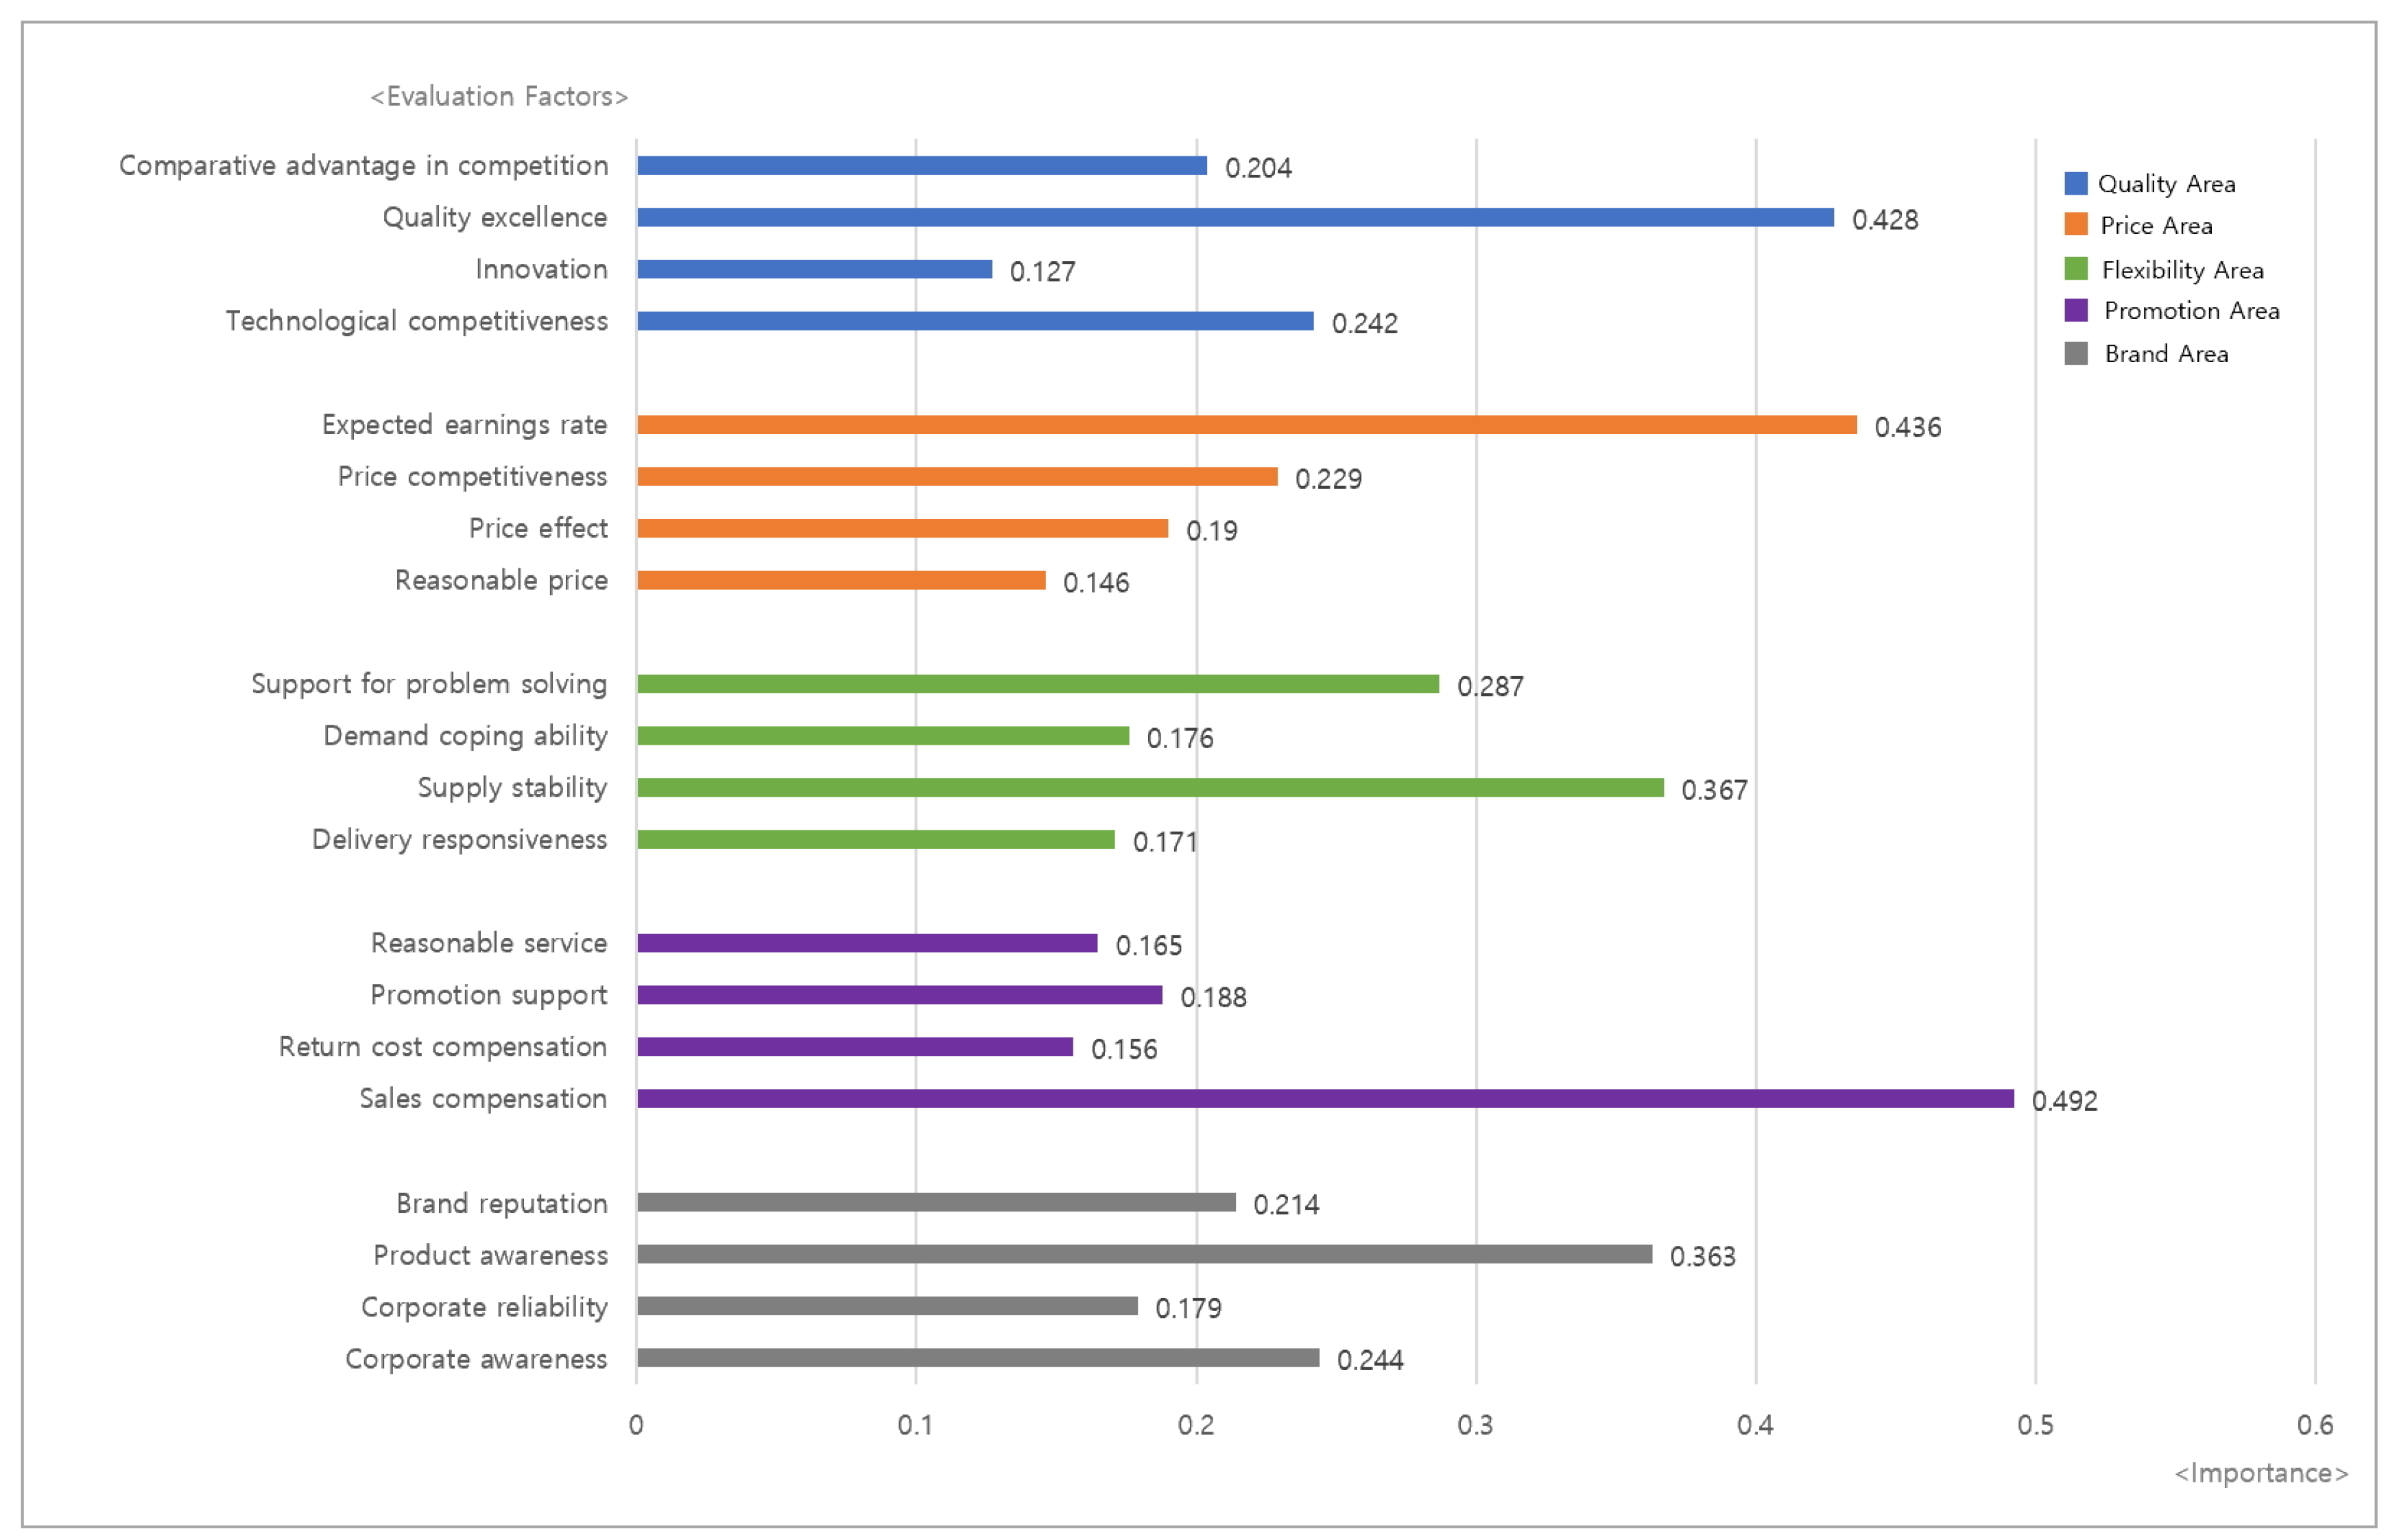
4.1. Comparison of Evaluation Variables

This research analyzed supplier determinants using a constructed AHP questionnaire. The consistency ratio (CR) value was found to be valid as all were under 1 (between 0.0105 and 0.0679). Table 4 shows the results of the analysis where product quality (0.356) was identified as the most significant factor, followed closely by price (0.333). Brand (0.127), promotion support (0.103), and flexibility (0.081) were ranked in order of importance. The most important detailed item in the quality area was quality excellence (0.428). In the price area, the expected return (0.436) was found to be the most significant factor. The most critical detailed factor in the flexibility area was supply stability (0.367), while sales compensation (0.492) was identified as the most important detailed factor in the promotion support area. In the brand area, product recognition (0.363) was the most important detailed factor. Looking at the top five factors of the 20 factors, quality excellence (0.152), expected return (0.145), technological competitiveness (0.086), price competitiveness (0.076), and comparative competitive advantage (0.072) were ranked in order (refer to Table 4 and Figure 3).

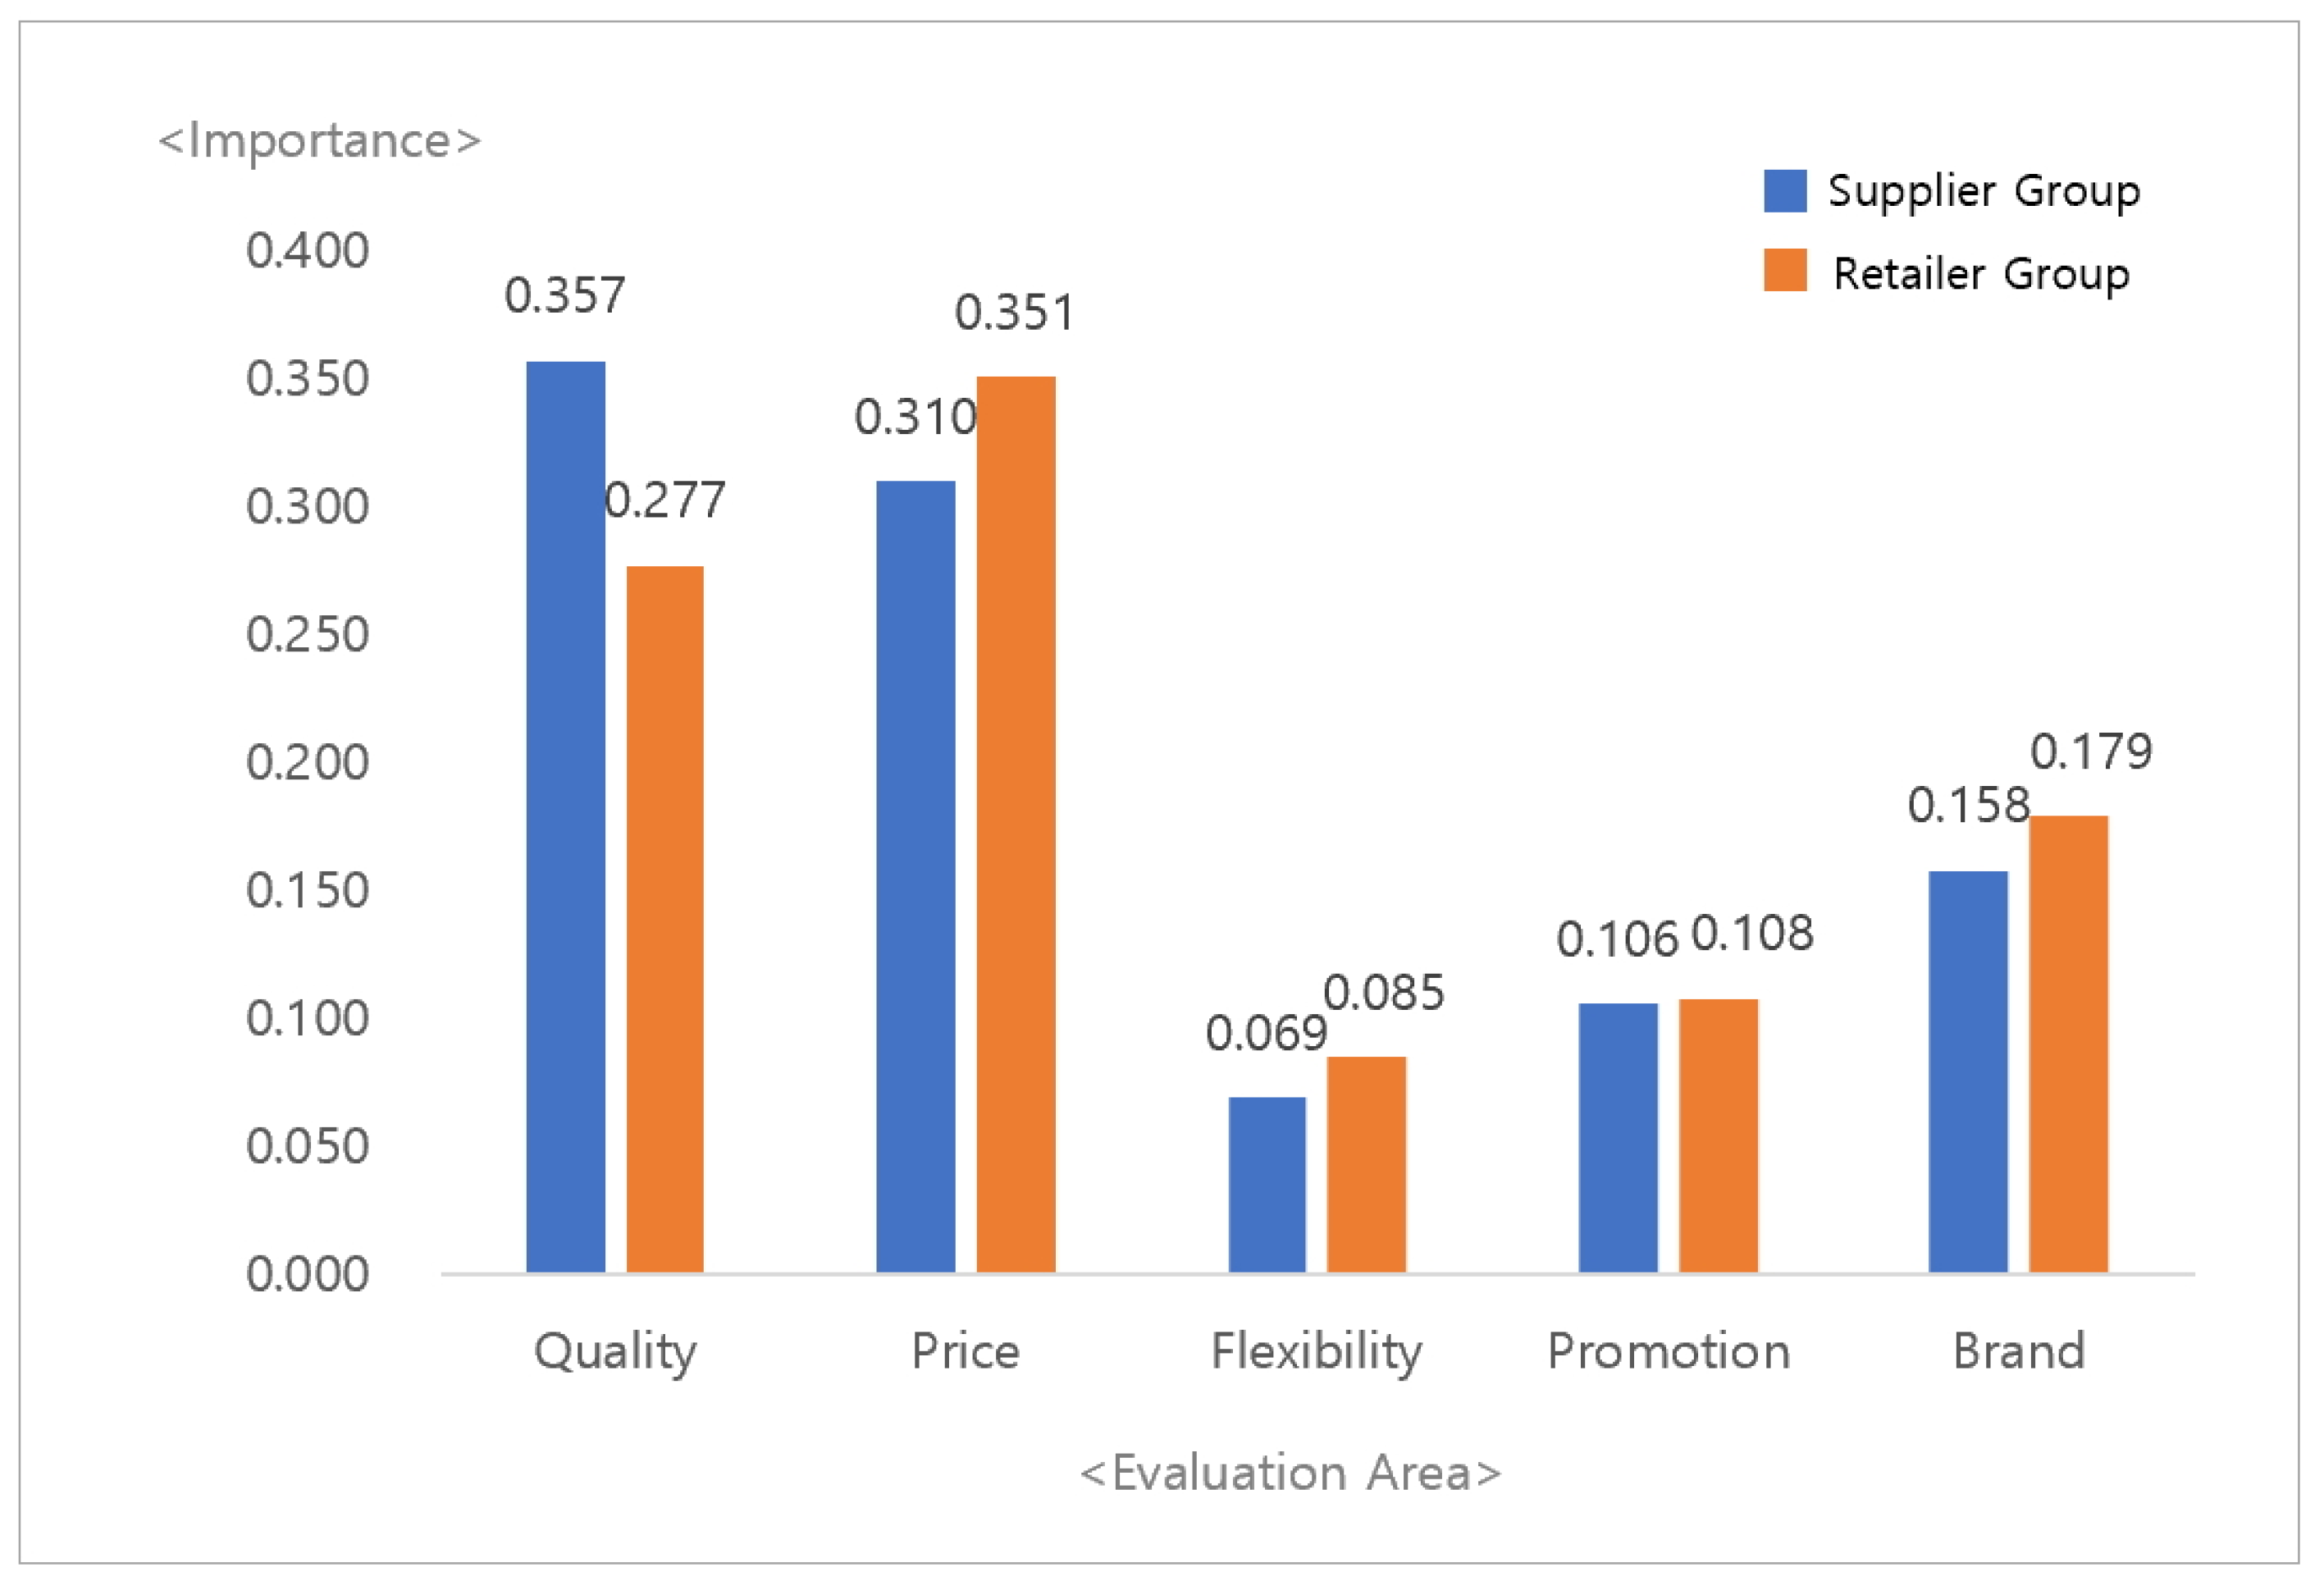
4.2. Comparison of Evaluation Areas between Retailer and Supplier Groups

Table 5 and Figure 4 show the results of the comparison and analysis of the supplier group and the retail distribution group. The manufacturing supplier group ranked quality (0.357), price (0.310), brand (0.158), promotion support (0.106), and flexibility (0.069) in order of importance. On the other hand, the retail distribution expert group ranked price (0.351), quality (0.277), brand (0.179), promotional support (0.108), and flexibility (0.085) in order of significance. The first and second priorities were divided between the two groups in quality and price, respectively, while the other three factors showed the same priority.

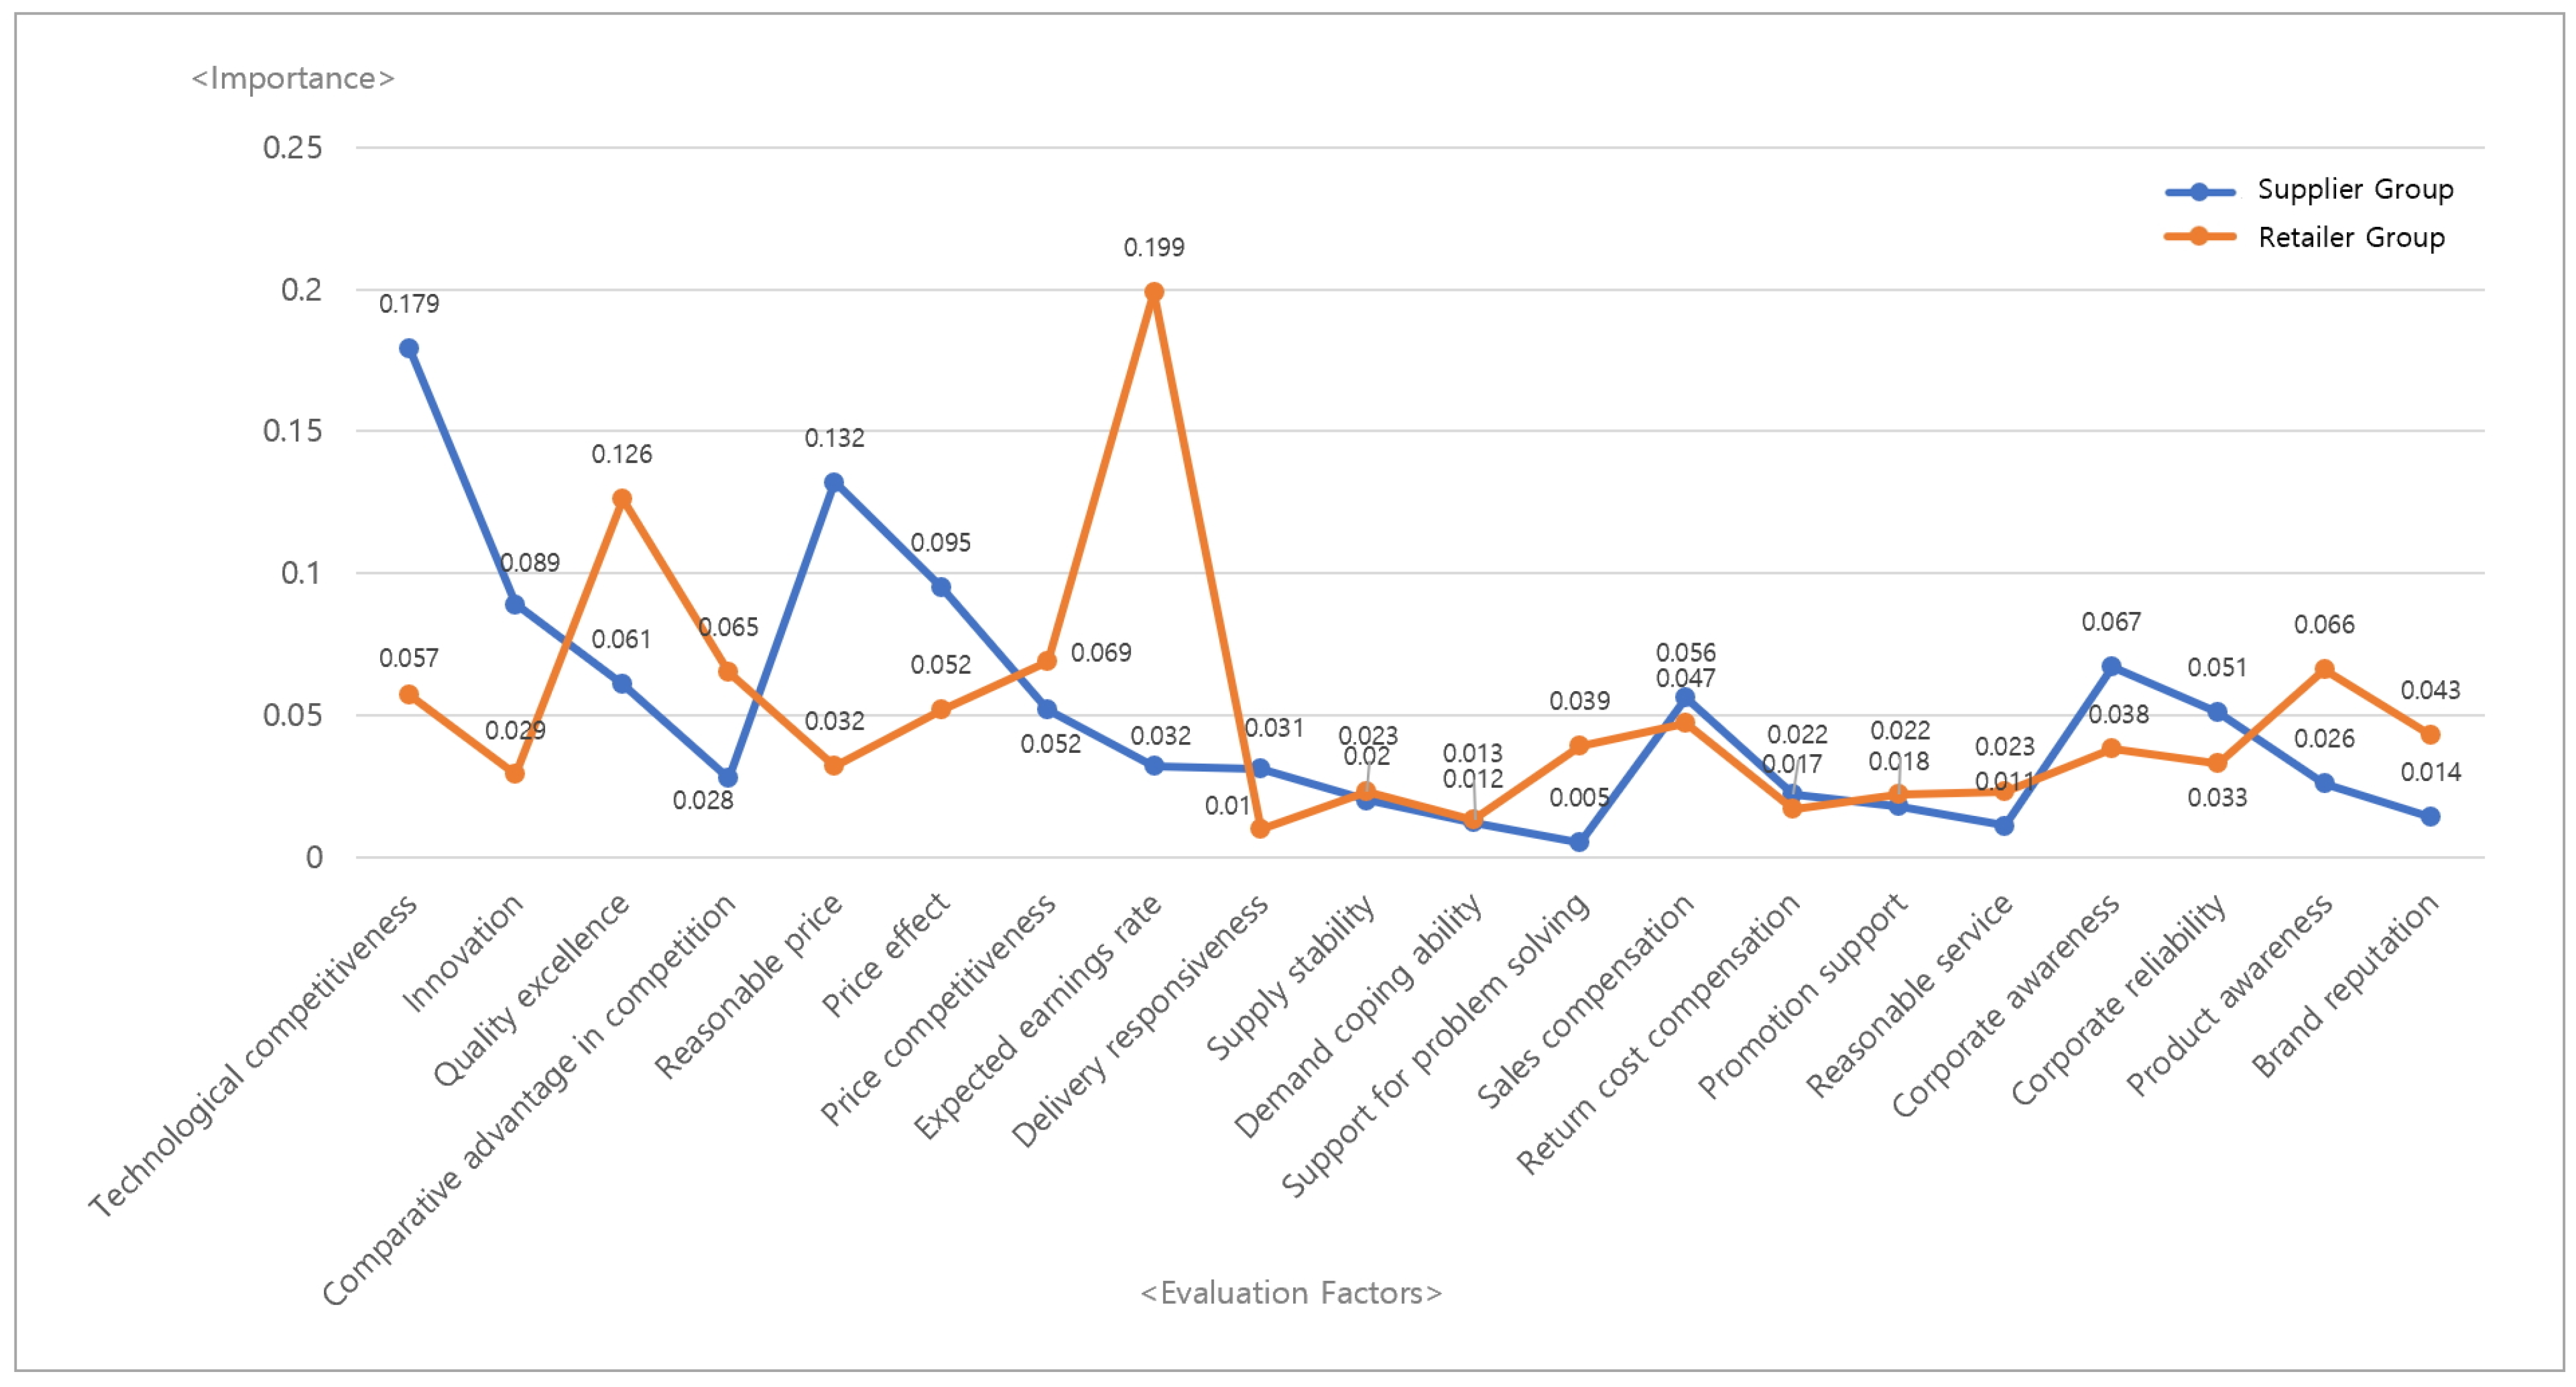
4.3. Comparison of Evaluation Factors between Retailer and Supplier Groups

Table 6 and Figure 5 show the results of the comparison and analysis of detailed factors between the two groups. The manufacturing supplier group identified technical competitiveness (0.179), appropriate price (0.132), price effect (0.095), innovation (0.089), corporate awareness (0.067), quality excellence (0.061), sales compensation (0.056), price competitiveness (0.052), and corporate reliability (0.051) as the significant factors. On the other hand, the distributor group had different selection factors, where expected return (0.199), quality excellence (0.066), price competitiveness (0.066), comparative competitive advantage (0.065), technical competitiveness (0.057), price effect (0.052), sales compensation (0.047), and brand reputation (0.043) were identified as significant factors.

5. Conclusions

5.1. Findings and Discussion

This study investigated the factors that influence the selection of product suppliers by retailers and analyzed the relative importance of each factor for decision-making. Moreover, the study compared the factors between manufacturing companies and retailers to identify any differences. The main results of the analysis are presented below.
First, the study found that product quality is the most important factor in selecting pesticide product suppliers, followed by price, brand, promotion support, and flexibility. These findings suggest that product quality and price continue to be crucial factors in the pesticide market. Specifically, the study found that the factors of “quality excellence”, “technology competitiveness”, and “comparative competitive advantage” were more important than “innovation.” This finding is consistent with previous research conducted by Aksoy and Öztürk (2011) and Ahn et al. (2022), which suggests that product quality and price are essential competitive factors for retailers in the distribution market. Thus, excellent quality and technical skills are more important than innovative products in the product distribution ecosystem in the pesticide market.
Second, the study compared the decision-making factors between product suppliers and distribution retailers and found that suppliers consider product quality to be the most important factor, whereas distribution retailer groups prioritize price. These results support the argument made by Agarwal et al. (2006), which suggests that as retailers’ influence in the distribution market increases, product sales are strengthened according to the operating profits of distributors in the case of products of similar quality. Although the quality of products is an important factor in agricultural chemicals, from the perspective of retailers, they have no choice but to select and sell products that help operating profit through more margins depending on price conditions. Eventually, the results confirm that the suppliers consider better product development as a major factor for success, while retailers reflect the market principle that focuses on improving operating profit through price competitiveness.
Third, this study shows that the supplier group considers corporate recognition and corporate reliability as important competitive factors, whereas the retailer group considers product recognition and brand reputation as more important. These results suggest that suppliers think that awareness and reliability of companies that make products in the pesticide market will be important competitive factors. However, in the actual distribution market, it was confirmed that product recognition and product brand value are more important factors. Bianchi and Saleh (2020) argued that a company’s brand and reputation are as important as products in the manufacturing industry. In the case of pesticides, the reliability and value of products play a more important role than product companies as they have distribution characteristics distributed to farmers through sales services such as education and consulting.
Finally, the study found that flexibility in product supply can act as an important factor in the pesticide market. However, the results showed that flexibility in the distribution market, especially with delivery responsiveness, demand coping ability, and supply stability, does not have a significant impact on the decision factors. This is because pesticides have a long shelf life and a low risk of supply gap to demand, thus enabling predicted pre-purchases according to agricultural activities and reflecting the characteristics of products used, when necessary, through self-storage on the farm. As argued by Ng (2012), general product purchase attributes cannot be applied as pesticides have very different characteristics of usability and customer characteristics from general consumer goods or daily necessities.

5.2. Research Implications

This study has academic significance as it identifies factors that affect supplier selection decisions and presents factor importance amidst changes in the pesticide industry from manufacturing production to distribution sales. Agricultural or pesticide-related studies tend to focus on new technology or product-related studies, but understanding the important priorities that retail distribution aims for is necessary to increase policy effectiveness for manufacturing suppliers. By developing and implementing policies based on this, more efficient retailers can be secured. This study empirically deals with the distribution market and corporate decision-making issues in the pesticide market, which are business problem-solving and decision-making areas that need to be developed in the industry and product distribution markets.
First, to strengthen market competitiveness, manufacturing suppliers should aim for comparative competitive advantage by recognizing excellent quality and technology competitiveness, and increasing expected returns and price competitiveness. However, there is a difference in the importance of factors between suppliers and retailers. In the future, pesticide manufacturers should consider that distribution and retail companies consider product attributes more important than companies in selecting suppliers and decide partners in consideration of price and sales promotion factors. An understanding of high-quality and low-priced policies and efforts to strengthen product brands should be supported.
Second, manufacturing suppliers significantly underestimate factors such as expected returns, quality excellence, product recognition, comparative competitive advantage, problem-solving support, and brand reputation compared to retailers. These factors are important attributes that can impact business operations, such as financial performance, ease of recommendation, and problem-solving, in terms of distribution retailers. Accordingly, manufacturers should further strengthen their marketing and service perspective strategies along with efforts in the development aspect of manufacturing and production. Manufacturers will eventually be able to expand distribution and seek independent supply chain expansion strategies that do not solely rely on retailers, considering the development of new services and innovative products based on pesticide usability and problem resolution of end customers.
Third, the supply chain ecosystem of the pesticide market is changing from a supplier-led market to a buyer-led market. Understanding manufacturers’ perceptions well and securing the supplier they want will be a way to increase relationship performance and satisfaction of farm customers. Therefore, in order to make better decisions in determining and securing suppliers, objective standards, or principles such as the decision-making model presented in this study should be secured. A more systematic and sustainable decision-making structure in strategic judgment will strengthen competition in the distribution market and seek new strategic directions.
Fourth, supply flexibility was found to be the least important factor among the five factors selected and analyzed. However, in recent years, volatility in external environmental factors, such as price hikes of raw materials or supply interruptions caused by the Ukrainian war or environmental regulations, has been increasing. To strengthen sustainable supply stability, manufacturing suppliers need to strengthen the efficiency of raw material supply and production supply structures for product production, and distribution retailers need to consider establishing a distribution safety net through pre-demand forecasts and pre-inventory building.

5.3. Research Limitations and Future Plans

Despite the academic and practical significance of this study, there are some research limitations. First, the survey was conducted on executives and experts from manufacturing suppliers and experts with limited experience in the pesticide market in Korea. Therefore, future studies should be conducted by expanding the size of surveys targeting continental or advanced agricultural countries. Second, the decision model was constructed based on previous studies, and new factors that have not been identified in previous studies have not been considered. Therefore, future studies need to discover and review factors that should be considered for supplier selection in the pesticide distribution market through qualitative research methods. Finally, the correlation of the factors or the causal relationship on corporate performance could not be verified in this study. An empirical study is necessary in the future to investigate whether the main factors presented in this study directly affect the actual performance of a company.

Author Contributions

Conceptualization, B.A.; methodology, B.A. and B.K.; software, B.K.; validation, B.K.; formal analysis, B.A.; investigation, B.A.; resources, B.A.; data curation, B.K.; writing— original draft preparation, B.A.; writing—review and editing, B.K.; visualization, B.A. and B.K.; supervision, B.K.; project administration, B.A. and B.K.; funding acquisition, B.A. All authors have read and agreed to the published version of the manuscript.

Funding

This research received no external funding.

Institutional Review Board Statement

Not applicable.

Informed Consent Statement

Not applicable.

Data Availability Statement

Not applicable for data availability.

Conflicts of Interest

The authors declare no conflict of interest.

References

  1. Abhilash, Purushothaman Chirakkuzhyil, and Nandita Singh. 2009. Pesticide use and application: An Indian scenario. Journal of Hazardous Materials 165: 1–12. [Google Scholar] [CrossRef]
  2. Agarwal, Ashish, Ravi Shankar, and Manoy Kumar Tiwari. 2006. Modelling the metrics of lean, agile and leagile supply chain: An ANP-based approach. European Journal of Operational Research 173: 211–25. [Google Scholar] [CrossRef]
  3. Agarwal, Upasna A., and Sushmita A. Narayana. 2020. Impact of relational communication on buyer–supplier relationship satisfaction: Role of trust and commitment. Benchmarking: An International Journal 27: 2459–96. [Google Scholar] [CrossRef]
  4. Agus, Arawati, and Mohd Shukri Hajinoor. 2012. Lean production supply chain management as driver towards enhancing product quality and business performance: Case study of manufacturing companies in Malaysia. International Journal of Quality and Reliability Management 29: 92–121. [Google Scholar] [CrossRef]
  5. Ahn, Byungok, Boyoung Kim, and Jongpil Yu. 2022. Effects of supplier ’s competitive factors on relationship performance and product recommendation in crop protection retail sector. Journal of Risk and Financial Management 15: 540. [Google Scholar] [CrossRef]
  6. Aksoy, Aslı, and Nursel Öztürk. 2011. Supplier selection and performance evaluation in just-in-time production environments. Expert Systems with Applications 38: 6351–59. [Google Scholar] [CrossRef]
  7. Alphonce, Christian B. 1996. Application of the analytic hierarchy process in agriculture in developing countries. Agricultural Systems 53: 97–112. [Google Scholar] [CrossRef]
  8. Ayhan, Mustafa Batuhan, and Huseyin Selcuk Kilic. 2015. A two stage approach for supplier selection problem in multi-item/multi-supplier environment with quantity discounts. Computers and Industrial Engineering 85: 1–12. [Google Scholar] [CrossRef]
  9. Bellver, J. Aznar, and V. Caballer Mellado. 2005. An application of the analytic hierarchy process method in farmland appraisal. Spanish Journal of Agricultural Research 3: 17–24. [Google Scholar] [CrossRef]
  10. Bettencourt, Lance A., Stephen W. Brown, and Scott B. MacKenzie. 2005. Customer-oriented boundary-spanning behaviors: Test of a social exchange. Journal of Retailing 81: 141–57. [Google Scholar] [CrossRef]
  11. Bianchi, Constanza, and Md Abu Saleh. 2020. Investigating SME importer–foreign supplier relationship trust and commitment. Journal of Business Research 119: 572–84. [Google Scholar] [CrossRef]
  12. Boyer, Kenneth K., and Marianne W. Lewis. 2002. Competitive priorities: Investigating the need for trade-offs in operations strategy. Production and Operations Management 11: 9–20. [Google Scholar] [CrossRef]
  13. Celuch, Kevin G., John H. Bantham, and Chickery J. Kasouf. 2006. An extension of the marriage metaphor in buyer– seller relationships: An exploration of individual level process dynamics. Journal of Business Research 59: 573–81. [Google Scholar] [CrossRef]
  14. Croxton, Keely L., Douglas M. Lambert, Sebastián J. García-Dastugue, and Dale S. Rogers. 2002. The demand management process. The International Journal of Logistics Management 13: 51–66. [Google Scholar] [CrossRef] [Green Version]
  15. Damalas, Christos A. 2009. Understanding benefits and risks of pesticide use. Scientific Research and Essay 4: 945–49. [Google Scholar]
  16. Dongó, Eleni, Gabriella Beliczai-Marosi, Ane Stensønes Dybvig, and Levente Kiss. 2018. The mechanism of action and role of hydrogen sulfide in the control of vascular tone. Nitric Oxide 81: 75–87. [Google Scholar] [CrossRef] [PubMed]
  17. Emamat, Mir Seyed Mohammad Mohsen, Caroline Maria de Miranda Mota, Mohammad Reza Mehregan, Mohammad Reza Sadeghi Moghadam, and Philippe Nemery. 2022. Using ELECTRE-TRI and FlowSort methods in a stock portfolio selection context. Financial Innovation 8: 11. [Google Scholar] [CrossRef]
  18. Ganesan, Shankar. 1994. Determinants of long-term orientation in buyer-seller relationships. Journal of Marketing 58: 1–19. [Google Scholar] [CrossRef]
  19. Gulati, Ranjay, and Maxim Sytch. 2007. Dependence asymmetry and joint dependence in inter-organizational relationships: Effects of embeddedness on a manufacturer’s performance in procurement relationships. Administrative Science Quarterly 52: 32–69. [Google Scholar] [CrossRef] [Green Version]
  20. Gupta, Varun, Dmitry Ivanov, and Tsan-Ming Choi. 2021. Competitive pricing of substitute products under supply disruption. Omega 101: 102279. [Google Scholar] [CrossRef]
  21. Ilyas, Gunawan Bata, Sir Rahmi, Hasmin Tamsah, Abdul Razak Munir, and Aditya Halim Perdana Kusuna Putra. 2020. Reflective model of brand awareness on repurchase intention and customer satisfaction. The Journal of Asian Finance, Economics and Business 7: 427–38. [Google Scholar] [CrossRef]
  22. Johnston, David A., David M. McCutcheon, F. Ian Stuart, and Hazel Kerwood. 2004. Effects of supplier trust on performance of cooperative supplier relationships. Journal of Operations Management 22: 23–38. [Google Scholar] [CrossRef]
  23. Kannan, Vijay R., and Keah Choon Tan. 2002. Supplier selection and assessment their impact on business performance. Journal of Supply Chain Management 38: 11–21. [Google Scholar] [CrossRef] [Green Version]
  24. Kannan, Vijay R., and Keah Choon Tan. 2006. Buyer-supplier relationships: The impact of supplier selection and buyer-supplier engagement on relationship and firm performance. International Journal of Physical Distribution & Logistics Management 36: 755–75. [Google Scholar]
  25. Kim, Woodong, and Boyoung Kim. 2020. The critical factors affecting the consumer reselling of limited edition products: A case in the Korean fashion sector. Sustainability 12: 8181. [Google Scholar] [CrossRef]
  26. Kou, Gang, Özlem Olgu Akdeniz, Hasan Dinçer, and Serhat Yüksel. 2021. Fintech investments in European banks: A hybrid IT2 fuzzy multidimensional decision-making approach. Financial Innovation 7: 39. [Google Scholar] [CrossRef] [PubMed]
  27. Krause, Daniel R., Mark Pagell, and Sime Curkovic. 2001. Toward a Measure of Competitive Priorities for Purchasing. Journal of Operations Management 19: 497–512. [Google Scholar] [CrossRef]
  28. Kurttila, Mikko, Mauno Pesonen, Jyrki Kangas, and Miika Kajanus. 2000. Utilizing the analytic hierarchy process AHP in SWOT analysis: A hybrid method and its application to a forest certification case. Forest Policy Economics 1: 41–52. [Google Scholar] [CrossRef]
  29. Li, Sali, Anoop Madhok, Gerhard Plaschka, and Rohit Verma. 2006. Supplier-switching inertia and competitive asymmetry: A demand-side perspective. Decision Sciences 37: 547–76. [Google Scholar] [CrossRef] [Green Version]
  30. Lu, Jye-Chyi, Yu-Chung Tsao, and Chayakrit Charoensiriwath. 2011. Competition under manufacturer service and retail price. Economic Modelling 28: 1256–64. [Google Scholar] [CrossRef] [Green Version]
  31. Matthews, Graham A. 2008. Attitudes and behaviors regarding use of crop protection products: A survey of more than 8500 smallholders in 26 countries. Crop Protection 27: 834–46. [Google Scholar] [CrossRef]
  32. Monroe, Kent B., and William B. Dodds. 1988. A research program for establishing the validity of the price-quality relationship. Journal of the Academy of Marketing Science 16: 151–68. [Google Scholar] [CrossRef]
  33. Mungra, Yogesh, and Prabhat Kumar Yadav. 2019. The mediating effect of satisfaction on trust-commitment and relational outcomes in manufacturer–supplier relationship. Journal of Business & Industrial Marketing 35: 219–30. [Google Scholar]
  34. Ng, Eric. 2012. An empirical study on the success factors of supplier-distributor relationships. Contemporary Management Research 8: 161–79. [Google Scholar] [CrossRef] [Green Version]
  35. Nishimoto, Ray. 2019. Global trends in the crop protection industry. Journal of Pesticide Science 22: 141–47. [Google Scholar] [CrossRef] [PubMed] [Green Version]
  36. Oerke, Erich-Christian. 2006. Crop losses to pests. The Journal of Agricultural Science 144: 31–43. [Google Scholar] [CrossRef]
  37. Palmatier, Robert W., Rajiv P. Dant, and Kenneth R. Evans. 2006. Factors influencing the effectiveness of relationship marketing: A meta-analysis. Journal of Marketing 70: 136–53. [Google Scholar] [CrossRef]
  38. Pesonen, Hanna-Leena, Tomas Ekvall, Günter Fleischer, Gjalt Huppes, Christina Jahn, Zbigniew S. Klos, Gerald Rebitzer, Guido W. Sonnemann, Alberto Tintinelli, Bo P. Weidema, and et al. 2000. Framework for scenario development in LCA. The International Journal of Life Cycle Assessment 5: 21–30. [Google Scholar] [CrossRef] [Green Version]
  39. Piercy, Nigel F. 2009. Strategic relationships between boundary-spanning functions: Aligning customer relationship management with supplier relationship management. Industrial Marketing Management 38: 857–64. [Google Scholar] [CrossRef]
  40. Prado, Lucas Sciencia do, and Dante Pinheiro Martinelli. 2018. Analysis of negotiation strategies between buyers and sellers: An applied study on crop protection products distribution. RAUSP Management Journal 53: 225–40. [Google Scholar] [CrossRef]
  41. Rao, Akshay R., and Kent B. Monroe. 1989. The effect of price, brand name, and store name on buyers’ perceptions of product quality: An integrative review. Journal of Marketing Research 26: 351–57. [Google Scholar]
  42. Rauyruen, Papassapa, and Kenneth E. Miller. 2007. Relationship quality as a predictor of B2B customer loyalty. Journal of Business Research 60: 21–31. [Google Scholar] [CrossRef]
  43. Roch, Sylvia G., and Linda R. Shanock. 2006. Organizational justice in an exchange framework: Clarifying organizational justice distinctions. Journal of Management 32: 299–322. [Google Scholar] [CrossRef]
  44. Rogers, Dale S., Douglas M. Lambert, Keely L. Croxton, and Sebastián J. García-Dastugue. 2002. The returns management process. The International Journal of Logistics Management 13: 1–18. [Google Scholar] [CrossRef]
  45. Rosenzweig, Eve D., Aleda V. Roth, and James W. Dean Jr. 2003. The influence of an integration strategy on competitive capabilities and business performance: An exploratory study of consumer products manufacturers. Journal of Operations Management 21: 437–56. [Google Scholar] [CrossRef]
  46. Roy, Pranith Kumar, and Krishnendu Shaw. 2021. A multicriteria credit scoring model for SMEs using hybrid BWM and TOPSIS. Financial Innovation 7: 77. [Google Scholar] [CrossRef]
  47. S&P Global. 2023. Preliminary Analysis by S&P Global Commodity Insights’ Crop Science. Agriculture Market. Available online: https://www.marketplace.spglobal.com/en/datasets/platts-market-data-agriculture-(76) (accessed on 15 January 2023).
  48. Saaty, Thomas L. 2008. Decision making with the analytic hierarchy process. International Journal of Services Sciences 1: 83–98. [Google Scholar] [CrossRef] [Green Version]
  49. Santos, Gilberto, Federica Murmura, and Laura Bravi. 2019. Developing a model of vendor rating to manage quality in the supply chain. International Journal of Quality and Service Sciences 11: 34–52. [Google Scholar] [CrossRef]
  50. Scheer, Lisa K., C. Fred Miao, and Robert W. Palmatier. 2015. Dependence and interdependence in marketing relationships: Meta-analytic insights. Journal of the Academy of Marketing Science 43: 694–712. [Google Scholar] [CrossRef]
  51. Schweidel, David A., Eric T. Bradlow, and Peter S. Fader. 2011. Portfolio dynamics for customers of a multiservice provider. Management Science 57: 471–86. [Google Scholar] [CrossRef]
  52. Selnes, Fred, and James Sallis. 2003. Promoting relationship learning. Journal of Marketing 67: 80–95. [Google Scholar] [CrossRef]
  53. Shukla, Suwarna, Rohit Kapoor, Narain Gupta, and Deepak Arunachalam. 2022. Knowledge transfer, buyer-supplier relationship and supplier performance in agricultural supply chain: An agency theory perspective. Journal of Knowledge Management 27: 738–81. [Google Scholar] [CrossRef]
  54. Sparks, Thomas C., Frank J. Wessels, Beth A. Lorsbach, Benjamin M. Nugent, and Gerald B. Watson. 2019. The new age of insecticide discovery-the crop protection industry and the impact of natural products. Pesticide Biochemistry and Physiology 161: 12–22. [Google Scholar] [CrossRef] [PubMed]
  55. Taherdoost, Hamed, and Aurélie Brard. 2019. Analyzing the process of supplier selection criteria and methods. Procedia Manufacturing 32: 1024–34. [Google Scholar] [CrossRef]
  56. Tan, Yomgso, Shuang Geng, Sotaro Katsumata, and Xiong Xiong. 2021. The effects of ad heuristic and systematic cues on consumer brand awareness and purchase intention: Investigating the bias effect of heuristic information processing. Journal of Retailing and Consumer Services 63: 102696. [Google Scholar] [CrossRef]
  57. Ting, Shin-Chan, and Danny I. Cho. 2008. An integrated approach for supplier selection and purchasing decisions. Supply Chain Management: An International Journal 13: 116–27. [Google Scholar] [CrossRef]
  58. Wilson, Elizabeth J., and Charles C. Nielson. 2001. Cooperation and continuity in strategic business relationships. Journal of Business-to-Business Marketing 8: 1–24. [Google Scholar] [CrossRef]
  59. Wu, Chen-Fong. 2002. Business Should be its own Therapist: Observing the Governance Ethics of Taiwanese Enterprises. Journal of Business Ethics 40: 363–71. [Google Scholar] [CrossRef]
  60. Wu, Wen-Kuei, and Singa Wang Chiu. 2016. The impact of guanxi positioning on the quality of manufacturer–retailer channel relationships: Evidence from Taiwanese SMEs. Journal of Business Research 69: 3398–405. [Google Scholar] [CrossRef]
  61. Xiao, Hui, Yao Zhang, Gang Kou, Si Zhang, and Juergen Branke. 2023. Ranking and selection for pairwise comparison. Naval Research Logistics 70: 284–302. [Google Scholar] [CrossRef]
  62. Yoo, Seok-Keun, and Bo-Young Kim. 2018. A decision-making model for adopting a cloud computing system. Sustainability 10: 2952. [Google Scholar] [CrossRef] [Green Version]
  63. Zhang, Jonathan Z., George F. Watson IV, Robert W. Palmatier, and Rajiv P. Dant. 2016. Dynamic relationship marketing. Journal of Marketing 80: 53–75. [Google Scholar] [CrossRef] [Green Version]
Figure 1. Paired comparison value arrangement table.
Admsci 13 00097 g001
Figure 2. Research framework for selecting suppliers.
Admsci 13 00097 g002
Figure 3. Weight analysis result of evaluation factors by areas.
Admsci 13 00097 g003
Figure 4. Comparison analysis result of evaluation areas.
Admsci 13 00097 g004
Figure 5. Comparison analysis result of evaluation factors.
Admsci 13 00097 g005
Table 1. Suppliers’ competitiveness factors affecting selection of suppliers.
ResearcherEvaluation Factor
Krause et al. (2001)quality, cost, delivery, flexibility, innovation
Boyer and Lewis (2002)low cost, quality, flexibility, delivery
Kannan and Tan (2002)product development, technology diffusion, problem solving, manufacturing competence, honesty, promotion support, cost, quality, delivery, productivity
Johnston et al. (2004)reliability, cooperative supplier relationship
Palmatier et al. (2006)business satisfaction, continuity of business relationship, support for problem-solving, and joint decision making
Li et al. (2006)price, quality, delivery consistency, product innovation, marketing
Ting and Cho (2008)purchasing cost, product quality, reliability, partnership, customer service, financial status
Aksoy and Öztürk (2011)quality, timely delivery, location, price
Ayhan and Kilic (2015)price, quality, delivery, sales performance
Santos et al. (2019)total quality, continuous improvement, environment, welfare, problem solving, quality, service, cost reduction, financial performance
Taherdoost and Brard (2019)performance, quality assurance, claim policy, repair, reliability, communication, reputation, industry ranking, risk factor, CSR, quality, price, supply, service
Table 2. Evaluation factors and definition.
Evaluation
Area
Evaluation
Factor
DefinitionReferences
QualityQuality excellenceCompetitiveness level depending on supplier’s new product offering capability, product diversity, and differentiation of product compositionKrause et al. (2001)
Bettencourt et al. (2005)
Ting and Cho (2008)
Schweidel et al. (2011)
Ayhan and Kilic (2015)
Technological competitivenessTechnology level that a supplier has on the product related to crop protection agent development
InnovationDifferentiated innovation level of the product held by a product supplier revealed in comparison with competitors’ products
Comparative advantage in competitionEffectiveness and quality level of the crop protection agents supplied by a product supplier in comparison with competitors’ products
PricePrice competitivenessHigher margin and market competitiveness securing possibility due to prices, compared to competitors’ pricesBoyer and Lewis (2002)
Wu (2002)
Li et al. (2006)
Zhang et al. (2016)
Agarwal et al. (2006)
Aksoy and Öztürk (2011)
Gupta et al. (2021)
Price effectPrice excellence level in the market depending on effectiveness vs. product price
Reasonable priceReasonable pricing in comparison with the same level products of competitors
Expected returnEarnings rate and profit level expected by retailers due to the product suppliers’ product prices
FlexibilityProblem solvingLevel of collaboration activities supporting retailers’ problem solving, including response service to customer claims or inventory lossesKannan and Tan (2002)
Johnston et al. (2004)
Palmatier et al. (2006)
Delivery responsivenessLevel of product supplier’s delivery deadline compliance and product delivery service
Supply stabilityRetailer’s responsible supply of order-received quantities and stable production and supply capabilities
Demand coping abilityLevel of fast and flexible ability to respond to urgent demand of customers or retailers
PromotionReturn cost compensationSupport level for retailers on returned products handling, due to customer claims or abnormal productsRogers et al. (2002)
Croxton et al. (2002)
Selnes and Sallis (2003)
Palmatier et al. (2006)
Piercy (2009)
Reasonable serviceNew and differentiated service offering level for product sales promotion occurring in the transaction process
Sales compensationSales compensation and incentive payment level for retailers
Promotion event supportSupport level for retailers’ PR, events, and free gifts for product sales
BrandBrand reputationReputation level on the reliability, satisfaction, and recommendation intention of the supplied crop protection agent brandRoch and Shanock (2006)
Gulati and Sytch (2007)
Bianchi and Saleh (2020)
Corporate reliabilityReliability, honesty, and fairness level of suppliers in the market
Product awarenessLevel of awareness and being famous of the supplied crop protection agents in the market
Corporate awarenessAwareness level of the suppliers producing and supplying crop protection agents
Table 3. Demography information.
CharactersFrequencyRatio (%)
GenderMale4095.2
Female24.8
Total42100
Age30s511.9
40s2047.6
50s1331.0
60s49.5
Total42100
Work Experience10–20 years2252.4
21–30 years1433.3
31–40 years614.3
Total42100
Professional AreaSupplier group2150.0
Retailer group2150.0
Total42100
Table 4. Weights and priority of evaluation variables.
Evaluation AreasThe Weights of AreasEvaluation FactorsThe Weights of Evaluation Factors
ImportanceImportance (Local *)PriorityImportance (Global **)Priority
Quality0.356Technological competitiveness0.24220.0863
Innovation0.12740.04510
Quality excellence0.42810.1521
Comparative advantage in competition0.20430.0725
Price0.333Reasonable price0.14640.0498
Price effect0.19030.0636
Price competitiveness0.22920.0764
Expected earnings rate0.43610.1452
Flexibility0.081Delivery responsiveness0.17130.01418
Supply stability0.36710.03012
Demand coping ability0.17630.01418
Support for problem solving0.28720.02314
Promotion0.103Sales compensation0.49210.0517
Return cost compensation0.15640.01617
Promotion support0.18820.01915
Reasonable service0.16530.01716
Brand0.127Corporate awareness0.24420.03111
Corporate reliability0.17940.02314
Product awareness0.36310.0469
Brand reputation0.21430.02713
Total1.000 5.000 1.000
* Local: mean value of evaluation factors in each group of criteria. ** Global: mean value of evaluation factors in total criteria.
Table 5. Comparison analysis result on evaluation areas.
Evaluation AreasThe Weights of Areas
Supplier GroupRetailer Group
ImportancePriorityImportancePriority
Quality0.35710.2772
Price0.31020.3511
Flexibility0.06950.0855
Promotion0.10640.1084
Brand0.15830.1793
Total1.000 1.000
Table 6. Comparison analysis result on evaluation factors.
Evaluation FactorsThe Weights of Evaluation FactorsPriority of Factors
(Global)
Importance
(Local)
Importance
(Global)
Supplier GroupRetailer GroupSupplier GroupRetailer GroupSupplier GroupRetailer Group
Technological competitiveness0.5000.2050.1790.05716
Innovation0.2490.1050.0890.029414
Quality excellence0.1720.4550.0610.12662
Comparative advantage in competition0.0790.2340.0280.065125
Reasonable price0.4250.0910.1320.032213
Price effect0.3050.1470.0950.05237
Price competitiveness0.1680.1950.0520.06983
Expected earnings rate0.1020.5660.0320.199101
Delivery responsiveness0.4500.1150.0310.0101120
Supply stability0.2970.2700.0200.0231515
Demand coping ability0.1750.1560.0120.0131819
Support for problem solving0.0780.4590.0050.0392010
Sales compensation0.5240.4360.0560.04778
Return cost compensation0.2090.1540.0220.0171418
Promotion support0.1660.2010.0180.0221617
Reasonable service0.1000.2090.0110.0231916
Corporate awareness0.4250.2100.0670.038511
Corporate reliability0.3230.1830.0510.033912
Product awareness0.1620.3660.0260.066134
Brand reputation0.0890.2400.0140.043179
5.0005.0001.0001.000
Disclaimer/Publisher’s Note: The statements, opinions and data contained in all publications are solely those of the individual author(s) and contributor(s) and not of MDPI and/or the editor(s). MDPI and/or the editor(s) disclaim responsibility for any injury to people or property resulting from any ideas, methods, instructions or products referred to in the content.

