Article

Field Test of Mini Photoionization Detector-Based Sensors—Monitoring of Volatile Organic Pollutants in Ambient Air

Institute of Environmental Technology, Energy and Environmental Technology Centre, VSB—Technical University of Ostrava, 17. Listopadu 2172/15, 708 00 Ostrava, Czech Republic
*
Author to whom correspondence should be addressed.
Environments 2022, 9(4), 49; https://doi.org/10.3390/environments9040049
Submission received: 30 December 2021 / Revised: 23 February 2022 / Accepted: 6 April 2022 / Published: 10 April 2022

Abstract

:
The determination of the concentrations of the organic compounds in ambient air using reference methods is a time-consuming process. The samples must be collected on a specific sorbent material and analyzed. In the best-case scenario, the analysis may be performed on site by portable chromatography techniques; otherwise, transport and laboratory analysis is necessary. Continuous sensory measurement is advantageous, especially concerning speed, resolution, price and ease of use. On the other hand, questions are raised, especially on the subject of the quality of data obtained by sensory measurements. The authors tested several types of volatile organic compound (VOC) sensors. The chosen type was deployed in a 25-unit sensor network for further testing by parallel measurements with the reference technique within the CLAIRO project.

1. Introduction

In recent years, a number of studies that focus on the evaluation of sensors, their features and their usability in various applications have been published [1,2,3,4,5,6]. In the case of pollutant monitoring and the correct identification of their sources, formerly conducted studies concluded that an increase in the spatial resolution of measurement networks is a very important step [7]. An increase in density of the network using reference measurement hardware would be very expensive if ever feasible. This issue may be well addressed using simple low-cost sensors [8,9] that are small and easy to install and use. Compared to other methods, sensors allow fast online, virtually real-time measurements. Despite many advantages, there are serious disadvantages to sensory measurements, in particular, the precision and accuracy of the measurement. Sensory measurements are far less sensitive and, thus, usable only for indicative applications that do not require precision of analytical methods. Sensory measurements require carefulness while planning the use of the data and their interpretation with respect to measurement validity [10]. Although the data produced by sensory measurements can be easily deemed as lower quality than the data produced by reference methods, there are undoubtedly benefits resulting from their use.
Technically separate groups among sensors are miniaturized photoionization detectors (mini-PID sensors). In air pollution monitoring, these sensors are intended for the monitoring of volatile organic compounds (VOCs), a group of often poisonous or dangerous compounds that commonly feature high vapor pressure at ambient conditions, comprising of, among others, benzene, toluene and formaldehyde [1,4]. The controversial issue about the sensors is their lack of selectivity towards the detected compounds. In principle, without upstream separation techniques such as chromatography or selective filter, it is not possible to determine a chemical individual using photoionization detector measurements only [11,12]. Despite their shortcomings, PID sensors are further investigated; for some of the factors, corrections are suggested, and they are considered viable alternatives under certain conditions or applications. We tested the responses of the PID sensors to several selected compounds and compared the results with data provided by the manufacturer (Alphasense, Ltd., Braintree, UK) [13,14]. The relative sensitivity (also called response or correction factors) provided is related to isobutylene by default, and in this work, we recalculated sensitivity to benzene as it is a typical representative of the VOC air pollutant and its concentration in ambient air is legally limited. The molecules of choice for testing contained aliphatic and aromatic hydrocarbons and 2-propanol as representative of a different structure. The final part presents real data collected during sensor network air quality monitoring on the premises of industrial plants generating VOC. For the purposes of verification and interpretation of the sensory measurement data, the results are compared to the reference method (parallel air sampling on charcoal tubes and gas chromatography).
The aim of this work is an evaluation of whether PID sensors may be used for routine air quality measurements, estimating the uncertainty and limits of their use. EU legislation mostly states concentration limits in ambient air for individual compounds such as benzene, toluene and styrene, whereas for working environments, groups such as total VOC and total organic carbon (TOC) are added. The sensors must fulfill the request for measurement not only of the compounds, but also their concentration range. The range varies between units of micrograms per cubic meter (µg/m3) in ambient air and hundreds of µg/m3 to units of milligrams per cubic meter (mg/m3) in emissions. The sensors provide output in voltage (mV), and conversion factors to real-world concentrations must be introduced by the users. That adds up to a list of questions which the authors are trying to answer.

2. Materials and Methods

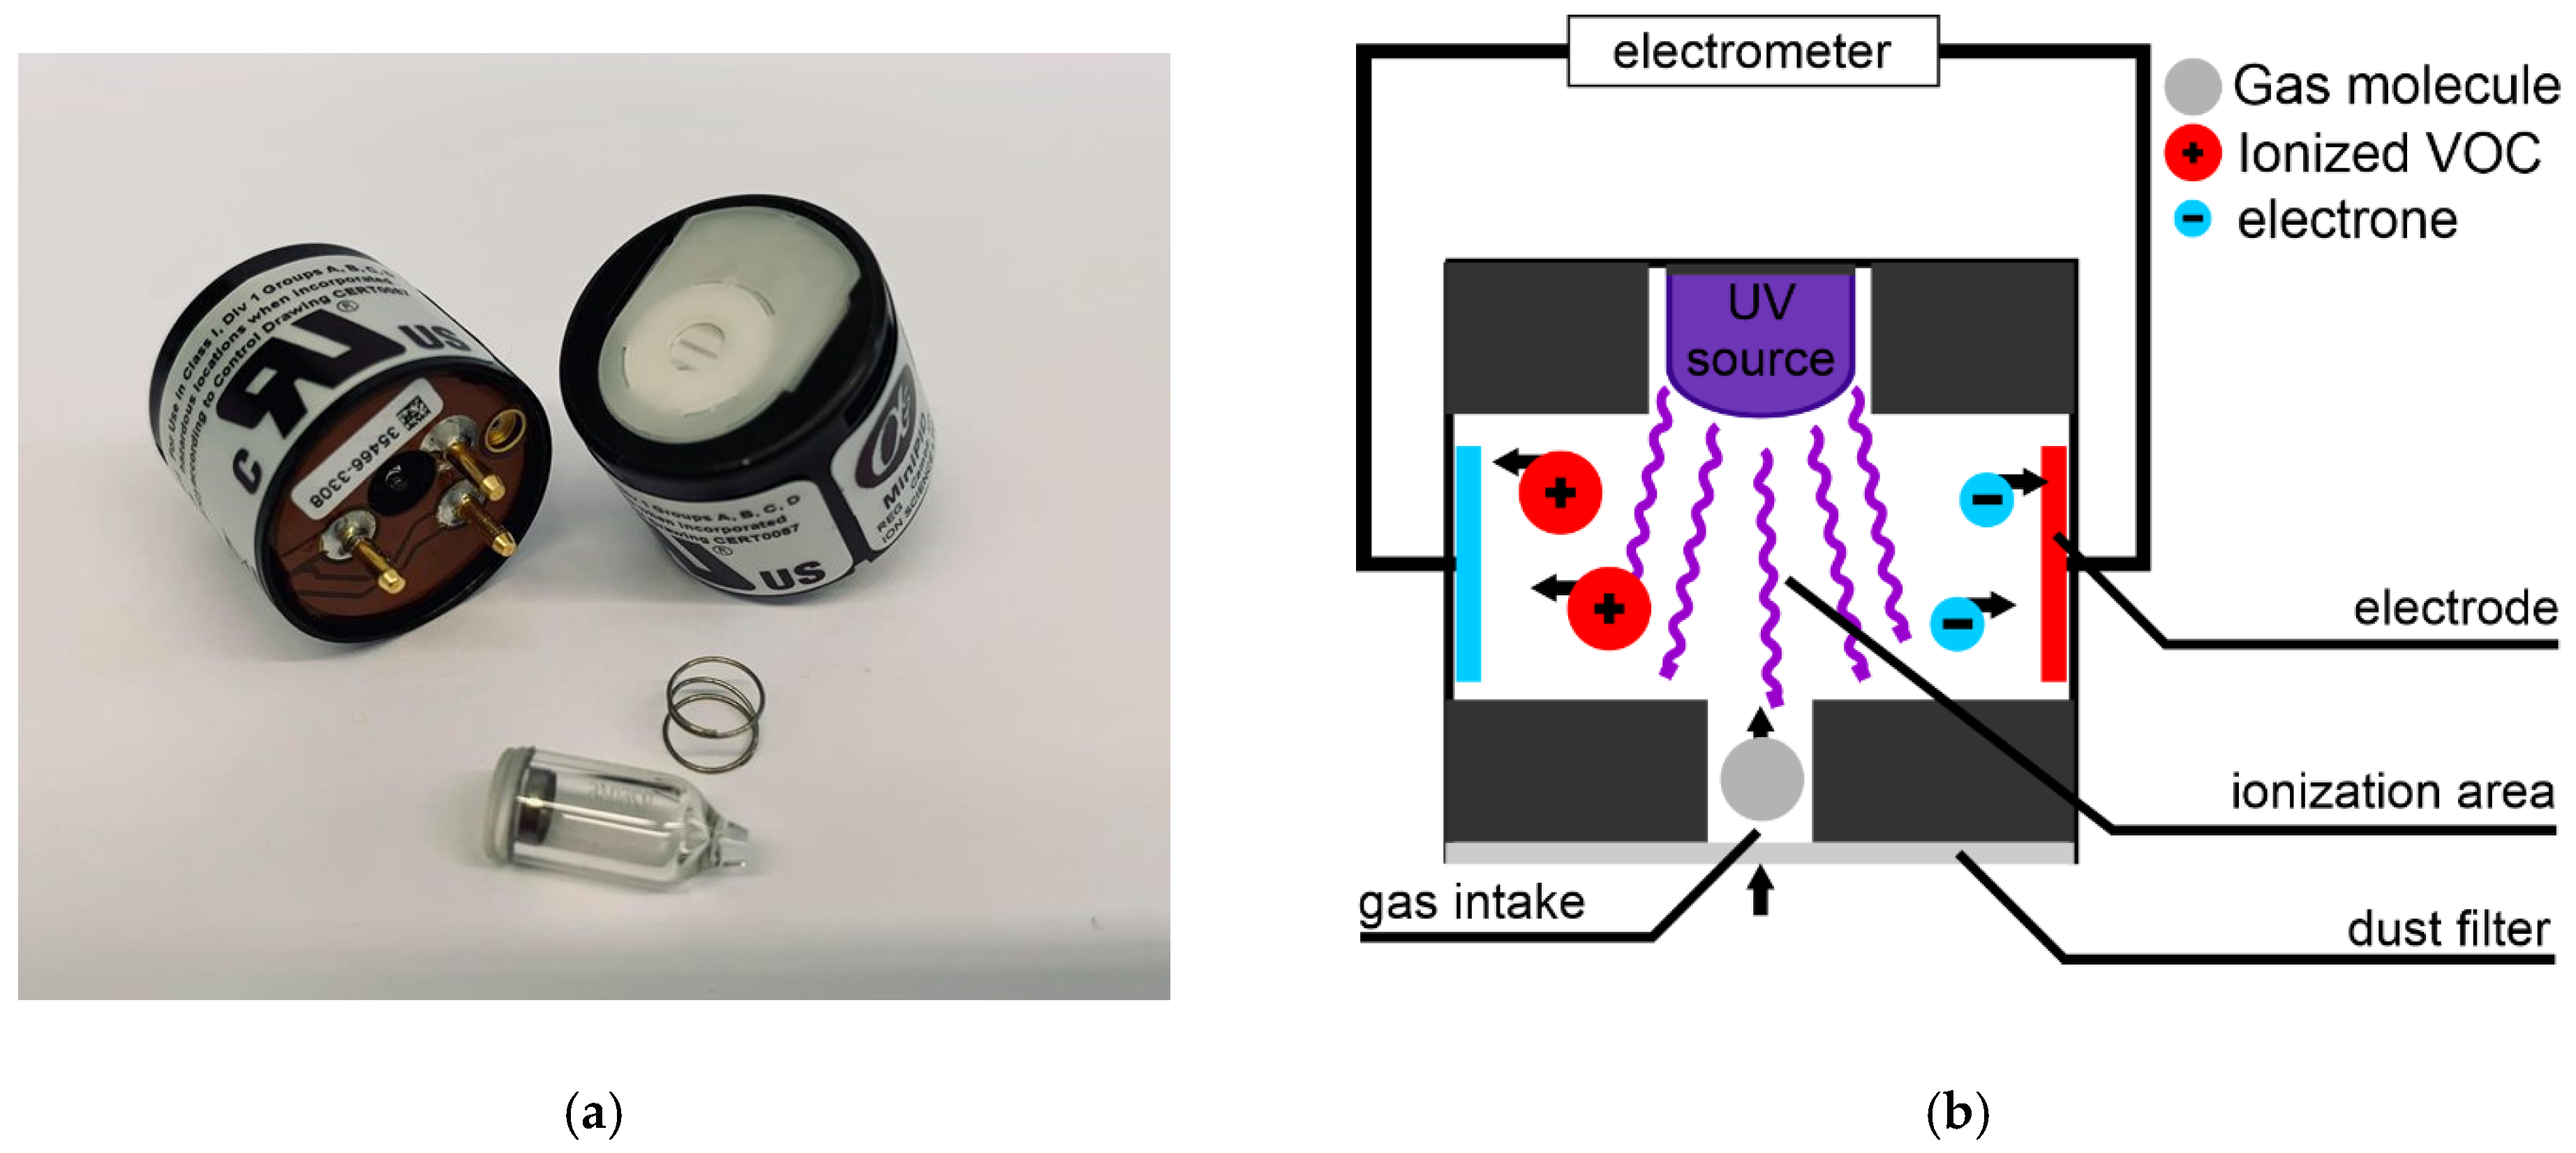
2.1. Mini-PID Overview

The general appearance of the used sensor is presented in Figure 1a. Photoionization sensors use the principle of ionizing detected molecules with high-energy UV radiation. At first, molecules enter the chamber through a membrane that prevents aerosols and dust from entering and interfering. The principle of the photoionization detection is presented in Figure 1b. Exposed to UV radiation, molecules of lower ionization energy than the energy of the UV radiation are split into ions and electrons. Charged particles migrate in the electric field towards the respective electrodes, generating current that is indicative of the number of formed ion + electron pairs, regardless of the compounds present in the chamber. The UV radiation is emitted from a gas discharge lamp (UV source in Figure 1b), where gas filling and materials of the windows influence the sensor’s ionization energy. Table 1 presents the basic features of the three types of mini-PID sensors with ionization energies of 9.6 eV, 10.0 eV and 10.6 eV used in this work. For the purpose of this work, PID-AH2-type (Alphasense, Braintree, UK) sensors were chosen because the only differences among them are the UV lamps. The electrode stacks and ionization chambers are identical. Moreover, the producer offers a low-noise circuit boards and connection kits for integration to mini-computer and processor-controlled user-made devices.
Because UV radiation of certain energy levels can ionize any compound of lower ionization energy, the PID response to compounds in mixtures is relational and additive. Furthermore, the measurements may be affected by temperature, humidity and presence of other ionizable gases [3,16].

2.2. Analyzed Compounds

When choosing sensors for testing and verification, the purpose of the measurement and the sensitivity to the analyzed compounds should be taken into account. Mini-PID sensors are widely used for monitoring VOCs in various environments—in ambient air, there are limits on benzene concentrations stated by EU regulations [17], while in working environments, more VOCs (toluene, styrene or isobutylene) should be monitored for occupational health and safety, and the limits slightly differ according to local regulations [18]. Table 2 lists the details of the compounds used for sensor verification measurements according to their ionization energies. The basic standards (BS) of the compounds were prepared by purging nitrogen (SIAD, Braňany, Czech Republic) through liquid in a glass washing bottle and collecting the unsaturated gas in a 20 L tedlar sampling bag. The basic standards were subsequently diluted with pure nitrogen gas to working standards (WS). Both working and basic standards were analyzed by gas chromatography with a flame ionization detector (Agilent 7890, Agilent, Santa Clara, CA, USA).

2.3. Sensor Parameter Check

The laboratory measuring device contained the 3 types of PID sensors (PIDHX, PIDAH a PIDAH9, Table 1) attached in a way that allowed them to be used in either open arrangement for passive sampling measurements or closed for pumped sampling. For checking the sensors’ parameters, arrangement in an open-end tube with liquid seal at the outlet was used. Measurements were performed in triplicate, constantly pumping gas (WS) from the sample bag into the measurement tube of the device with a membrane pump. Before measurement and after each repetition, the tube was flushed with nitrogen gas for several minutes after reaching a zero-voltage reading on all sensors (blank signal).

2.4. Outdoor Measurements—Field Test

For outdoor measurement, a trial sensor network of 25 standalone units containing, among others, PIDHX sensors was deployed on an area of approximately 500 × 500 m on the premises of an industrial enterprise. As the operation of the industry involves the release of VOC in short periods and defined local points, the sensor network underwent a verification of whether spatial and temporal resolution of air pollution can be achieved. The reference sampling system for laboratory analysis of sampled air was operated along one of the sensor units within the area for regular checks of sensory measurements. Comparisons were produced using a 24 h air sampling interval and a 24 h average of sensory measurements.
The layout of the sensor network and an example of visualization of the measured data can be found in Figure 2.

2.5. Statistics

All the statistical calculations were conducted with the StatPlus software (AnalystSoft, Inc., Walnut, CA, USA). The presented correlation coefficients were calculated as the Pearson coefficients of correlation between two independent groups of variables.
The measurement voltage RSD values for the testing of 3 types of sensors were calculated from 5 min sets of data recorded every 0.1 s while measuring WS samples from the bags at a constant flow rate. The results are expressed as the mean ± standard deviation.
Calibration functions were calculated as a linear regression in the linear voltage range of each sensor; between voltage values as the set of independent variables and concentrations as the set of dependent variables according to Equation (1), no intercept was applied (the blank voltage values are subtracted).
c = a × E,
where E stands for the output voltage, a for the slope of the calibration curve and c for the determined concentration.

3. Results and Discussion

3.1. Linearity, Measurement Range and Concentration Calibration

3.1.1. Blank

The sensors, when powered, provide voltage output (offset voltage) even in situations where no analyte is present and detected (blank measurement). The values are reproducible and stable so that further results are presented after offset voltage subtraction. In Table 3, blank voltage values are presented for all sensors. The results are in agreement with technical specification (offset value up to 60 mV) [13].

3.1.2. Concentration and Voltage Range

In Table 4, the voltage values recorded when testing the PID sensors are presented. The values of blank signals are subtracted. Voltage RSD during WS measurements at constant flow rates were 5.1% for PIDHX, 5.3% for PIDAH and 1.0% for PIDAH9. Due to the different sensitivities of the sensors to some of the compounds and their concentrations, not all values are presented, and the measurement of all tested compounds was not optimized.

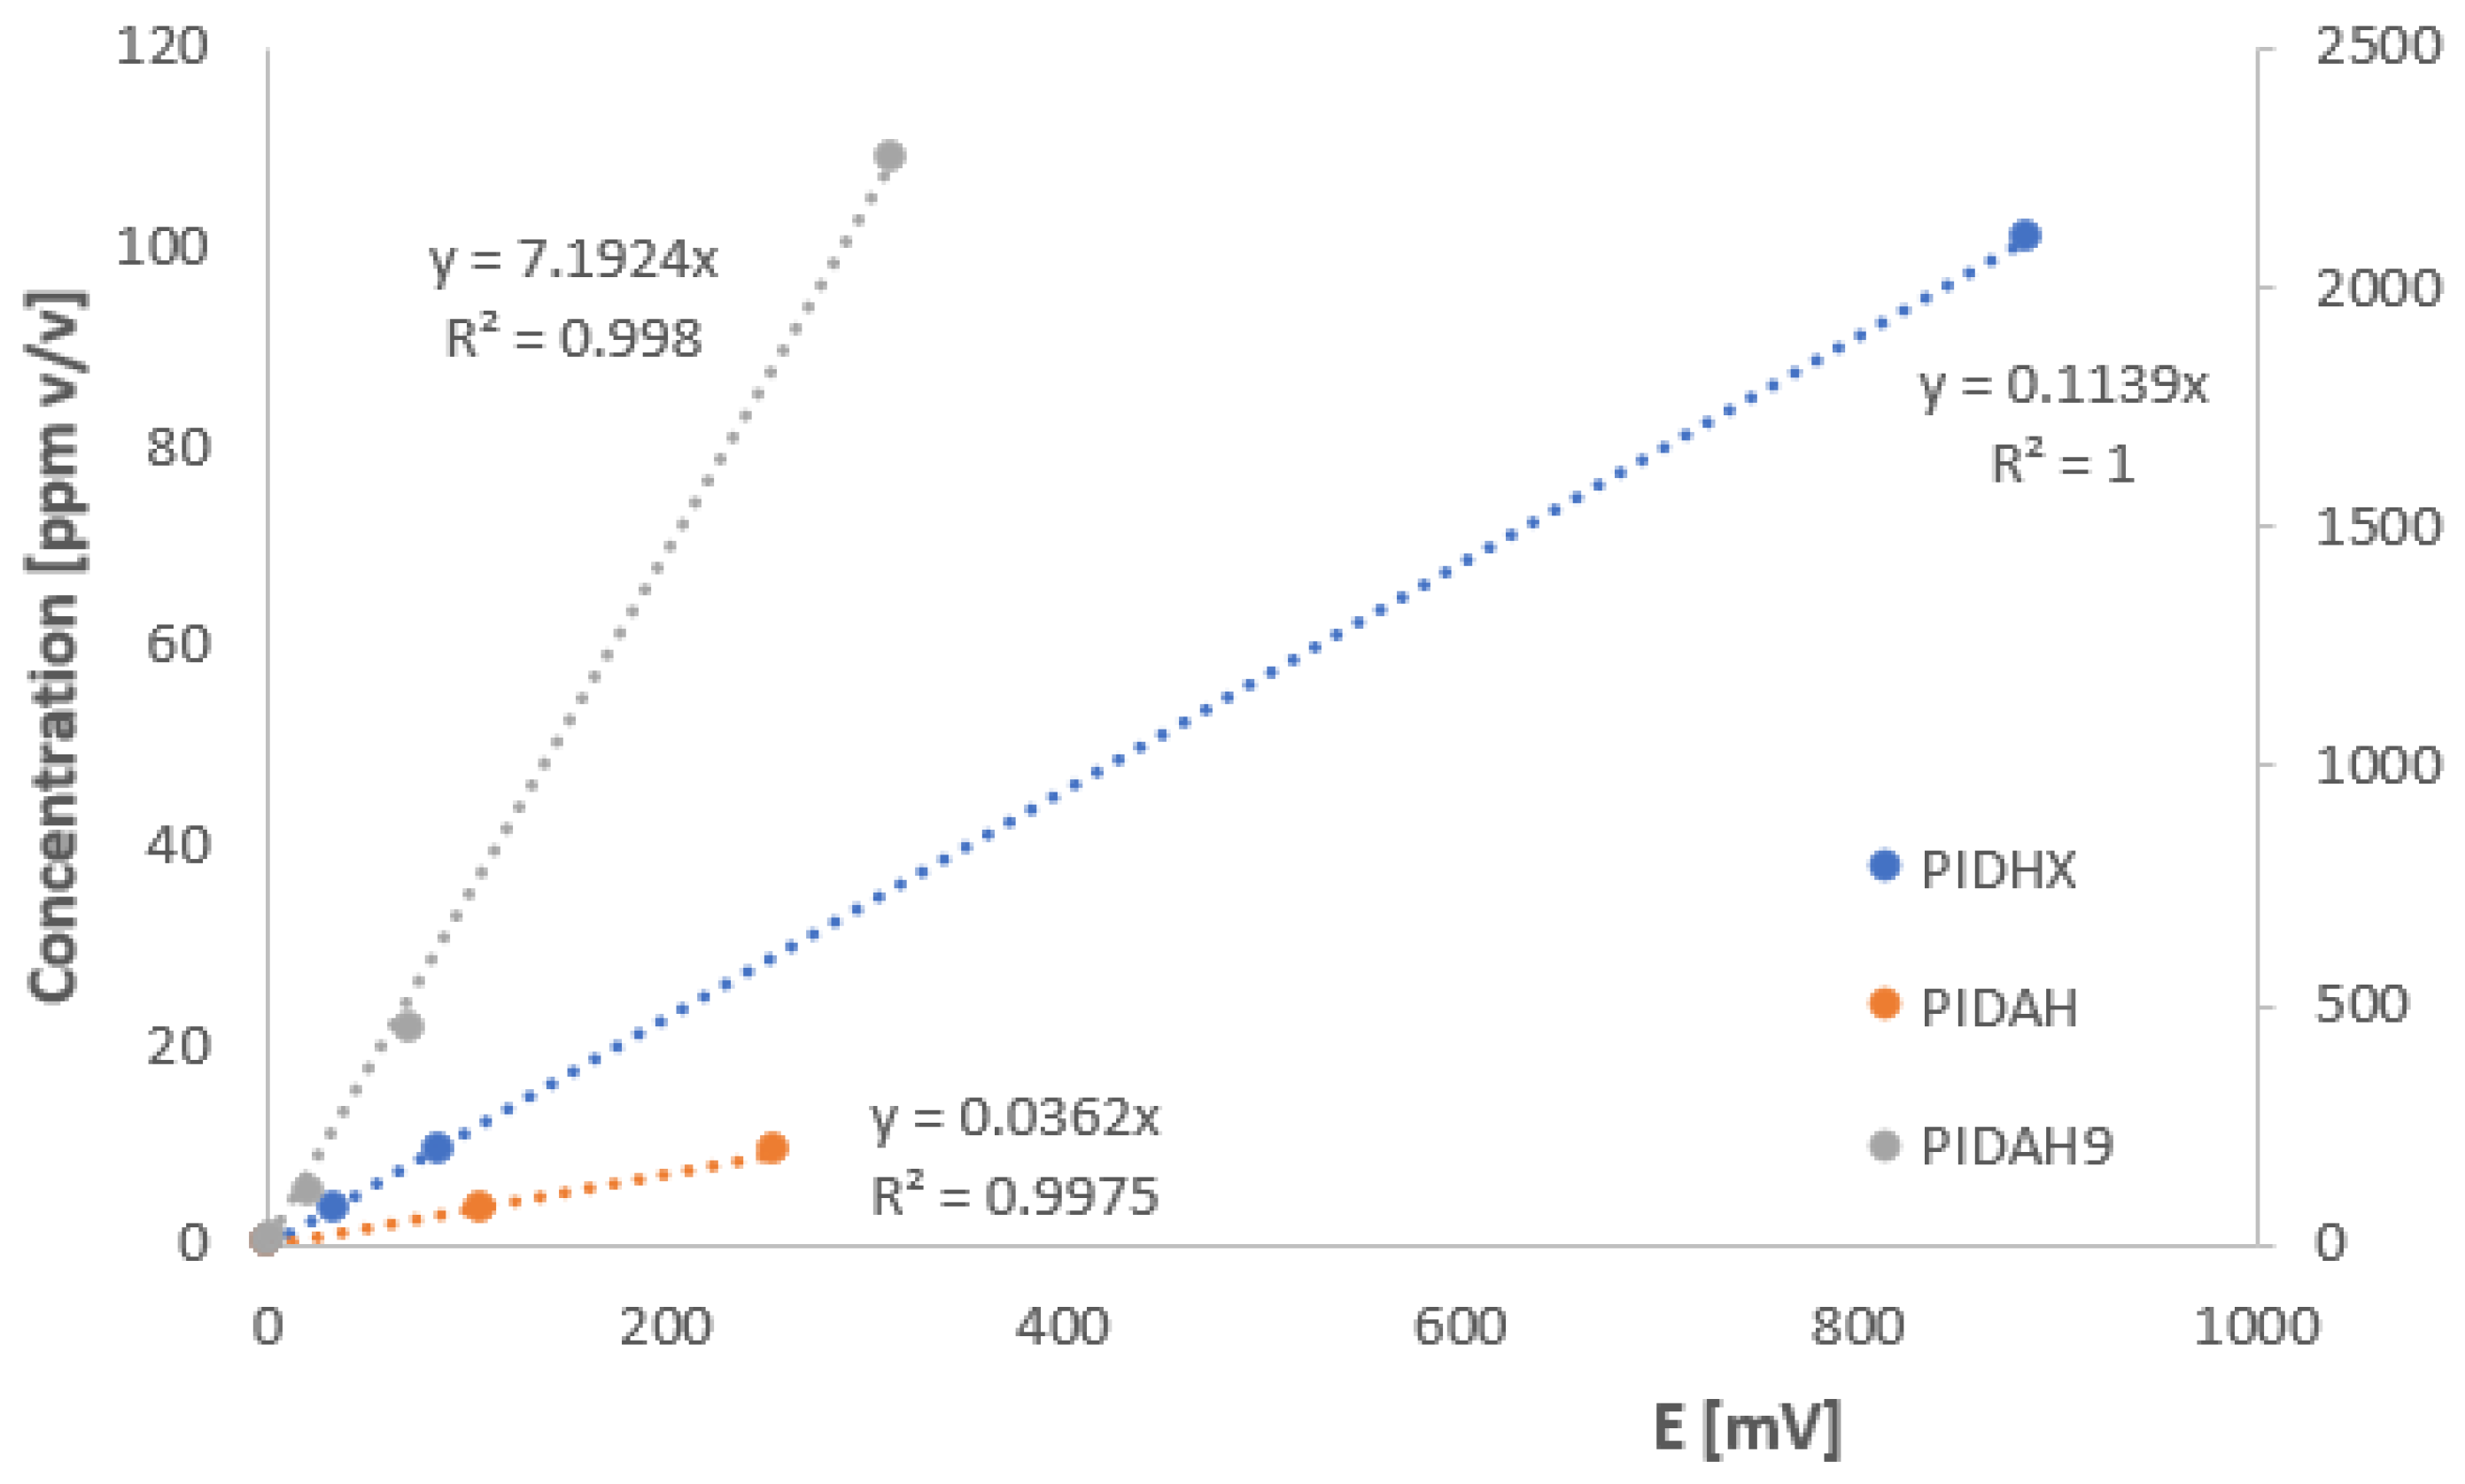
3.1.3. Linearity of the Output, Concentration Calibration

According to the manufacturer, the usable output voltage range is between an offset value and 3.1 V (supply voltage—0.1 V), although the response is not linear throughout this range and sensitivity decreases at a higher voltage [19]. Our observations during the tests and calibration were that, at voltage values over ca 1800 mV, the responses to decreasing concentrations were slower and longer nitrogen flushing was needed to reach blank values. Based on these observations and the manufacturer’s data, output voltage was stated to be linear between an offset value and 1500 mV to avoid possible sensor saturation.
Calibration equations resulting from linear regressions are presented in Figure 3 for benzene and listed for benzene and other compounds in Table 5.
Taking into account that voltage linearity is maintained in the range from blank value +10 mV to 1500 mV, we conclude that:
  • Sensor AH is usable in the range from 0.5 to 100 ppm
  • Sensor HX is usable in the range from 2 to 300 ppm
  • Sensor H9 is usable in the range from 100 to 10,000 ppm

3.2. Relative Sensitivity of the Sensors

Due to the fact that isobutylene is not a typical air pollutant in the volatile organic compound group present in emissions, and the PID sensors were intended for VOC in air quality monitoring, we introduced a recalculation of relative sensitivity to the signal of benzene (Equation (2)) instead of isobutylene, which is considered unitary for PID responses [14]:
f = E ( x ) / E ( b e n z e n e )
where E(x) stands for the response of the unitary concentration of compound x in millivolts, and E(benzene), for the response of the unitary concentration of benzene in millivolts.
Relative response values after recalculation can be compared to measured values that are related to benzene response as shown in Table 6.
Due to the low number of measurements and possible individual differences among sensors of the same type, differences in response values are considered not significant, mainly because they follow the same trends.

3.3. Response to Mixtures of Sensed Compounds

For verification of if the response to mixture of analytes is an additive feature, measurements of prepared mixtures have been conducted and their results were compared to theoretical values. The theoretical value of the response was calculated as the sum of the contributions of individual compounds in the mixture, a product of the compound’s concentration determined by gas chromatography and a sensor’s response to the compound according to Equation (3):
E ( m i x ) = c x a x + c y a y
where c stands for concentration and a for slope of the calibration curve.
Model mixtures were prepared by mixing liquids in the same manner as the other basic standards (BS) described in Section 2.2, diluted with nitrogen gas and analyzed by GC-FID before sensory measurement. Parameters and results of the measurement are presented in Table 7. Due to low differences between the measured and theoretical responses (up to 25% for the sensitive sensors AH and HX), we can conclude that they are in good agreement, showing that the response of the sensor to the combination of compounds is an additive feature.

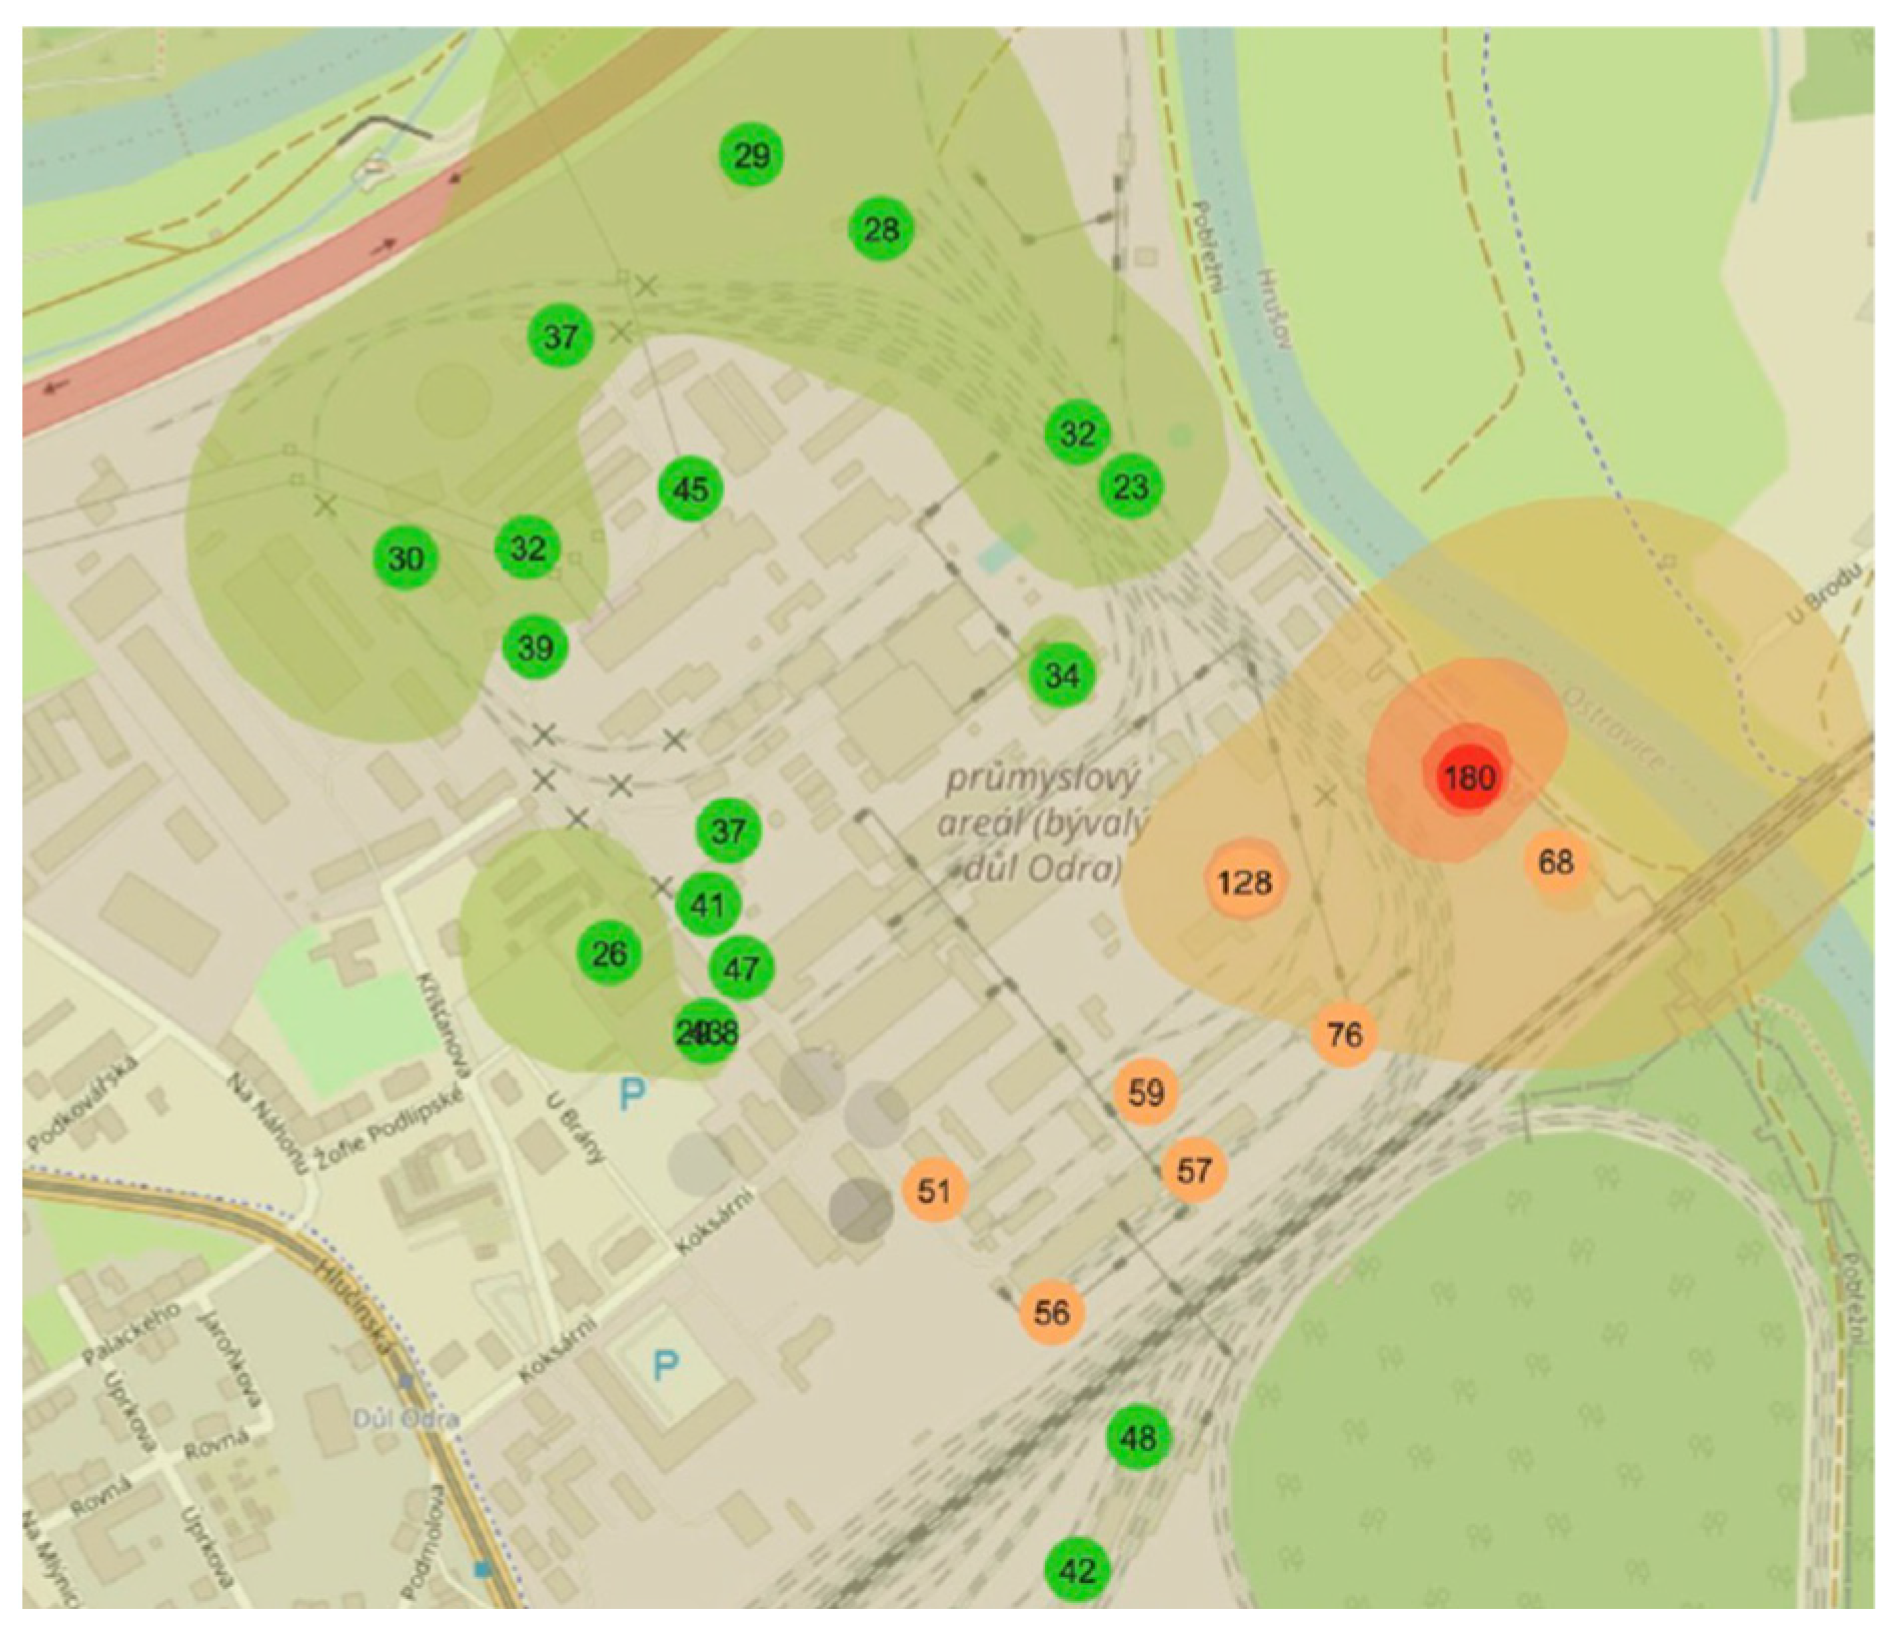
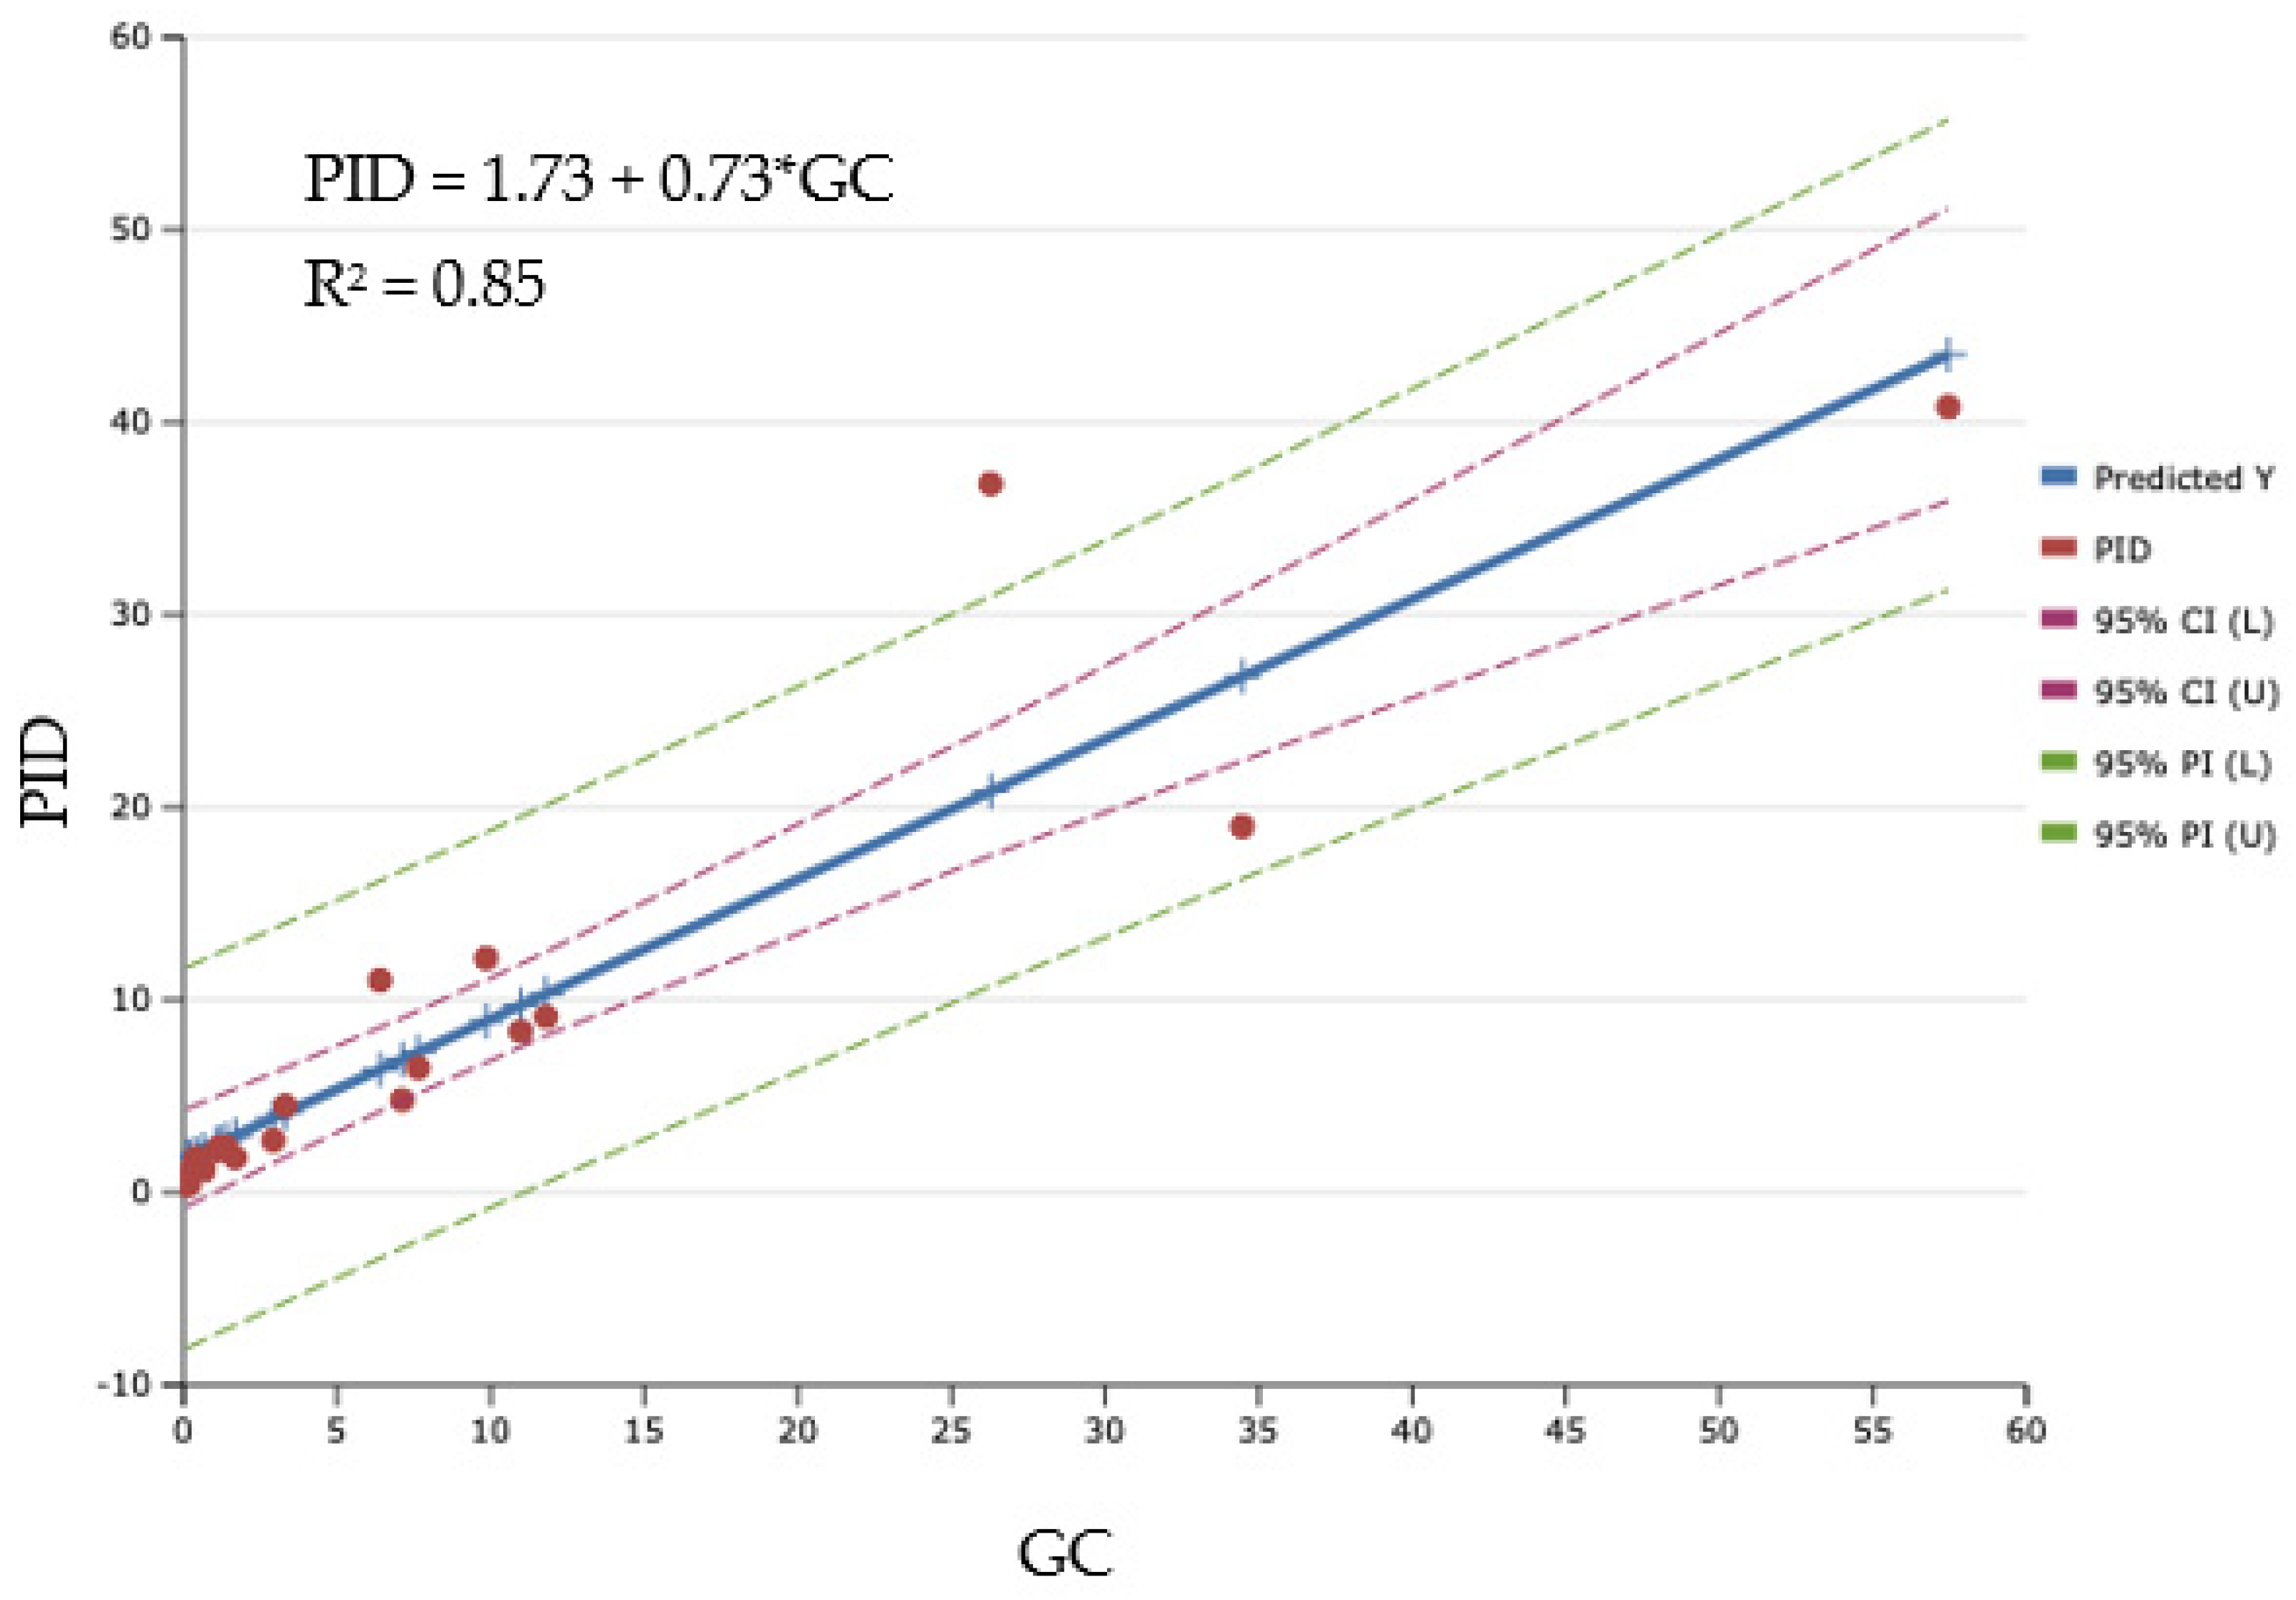
3.4. Field Measurements

According to the presented results, PIDHX sensors were chosen for use in the sensor units and performance testing in field measurements where one of the units was accompanied with an air sampling device capable of 24 h sampling of VOC on charcoal tubes. Along a three-month continuous operation of the sensor network, 20 samples were collected and analyzed in a laboratory by gas chromatography. In the GC analysis, the five most common volatile organic compounds were calibrated and determined: benzene, toluene, xylene (sum of isomers), ethylbenzene and styrene. The results of the analysis were compared to the 24 h average of the concentrations measured by the sensor in the sampling period.
The results of both measurement methods are presented in Table 8, and a correlation scatter plot is presented in Figure 4. The calculation of concentration from voltage values according to the slope of the benzene calibration curve presented in Table 5 was performed automatically in a database that stores sensory data. Hence, the concentration is translated into a “benzene equivalent” value.
Table 9 contains an overview of the correlation coefficients between the PIDHX dataset and a different combination of VOCs. Due to a linear function-based calibration, adding more parameters (compounds) into the relation results in a decrease in correlation. Table 10 presents correlation coefficients between concentration of benzene and other individual VOCs that confirm their concentrations are independent of each other. This fact also devaluates the possibility of calculating the amount of benzene from the total VOC concentration using a universal factor. The tested datasets contain only several high values of benzene concentrations, but the trend of a better correlation at lower values suggests that non-linear calibration can be a way to improve correlation along the whole range. In addition to that, the high level of correspondence between the results of the sensory and reference methods suggests that concentration values can be obtained from voltage output with a simple linear calculation.
According to Czech hydrometeorological institute yearbooks [20], the long-term benzene concentrations in ambient air are at the level of 1–3 µg/m3. Moreover, yearly average limit concentrations of 5 µg/m3 were not exceeded at any monitoring site for at least 5 years. Even in the past, the limit has been exceeded exceptionally, for example at station TOPRA 1410, reaching values of 6.7 µg/m3 in 2010 and 5.6 µg/m3 in 2012. In 2020, the highest benzene concentration recorded in the Czech Republic was 3.5 µg/m3. From these data, it is obvious that commonly measured concentration values are situated in the lower part of the tested range for ambient air. In the case of operational measurements at VOC sources, concentrations over 10 µg/m3 are expected.
Regarding the poor selectivity, research has been conducted aimed at improvements in the selectivity of PIDs to different compounds. There are published studies and reviews reporting, for example:
  • Partial selectivity after applying tunable high-intensity electric fields from additional electrodes to photoionized gas streams in the ionization chamber [2].
  • Suggested possible subtraction of major constituent(s) of simple mixtures by combining the PID detector with an appropriate metal-oxide semiconductor detector and/or processing the two partially dependent signals with means of advanced chemometrics [1] or machine learning [3].
  • Miniaturized GC apparatus upstream of PID sensor(s) for analysis of complex mixtures [21].
Regardless of the method of improving selectivity, more steps in data processing or measurement have to be performed, on the contrary to simple passive sampled measurement.

4. Conclusions

Three different mini-PID sensors were laboratory tested. It can be concluded for all of them that they are responsive to particular organic compounds or their groups. Upon testing the response to volatile organic compounds, the sensors covered a wide range of concentrations and significant differences among the detectors were revealed. For VOC measurements in ambient air, the PID HX sensor of 10.0 eV ionization energy was found to be applicable.
Parallel measurements of the sensor and reference chromatographic method show a very good agreement of the results at the usual ambient air concentrations. Regarding the elevated concentrations, the results correlated worse with the reference method, but in all cases, the sensor data provided the “capture” of elevated VOC concentration levels near point sources.
The data obtained from 25 sensors deployed in the experimental sensor network covering an area of circa 500 × 500 m provided spatial and temporal resolution of VOC concentration and allowed modelling of pollution maps. Due to the obtained spatial resolution, measurements were not considered parallel and statistical analysis of multiple parallel sensory measurements was not performed. Thus, we recommend to users of sensor technology to refrain from unconditional reliance on individual pieces without testing.
Nevertheless, the results discussed in Section 3 show the necessity to precisely check and adjust the conversion of the detector output signal to reported concentrations. Further investigation is needed on the calibration and relationship between (non-)linear ranges of voltage and concentration. These results, together with the lack of selectivity (and, thus, impossible identification of an individual pollutant), support the opinion that sensors are not currently being considered a replacement of the reference methods of air quality monitoring. Fast responses to concentration changes and density of measurements, both spatial and temporal, on the other hand, are a vast advantage over the reference methods. In those methods, sampling and analysis take days of delay, making sensory measurements a very good and useful component.

Author Contributions

Conceptualization, J.B.; methodology, J.B., P.B. and P.M.; software, O.B.; validation, J.B., P.M. and O.B.; formal analysis, P.M.; investigation, P.M. and P.B.; resources, P.B.; data curation, J.B. and O.B.; writing—original draft preparation, J.B. and O.B.; writing—review and editing, P.B., O.B. and P.M.; visualization, O.B.; supervision, J.B.; project administration, J.B.; funding acquisition, J.B. All authors have read and agreed to the published version of the manuscript.

Funding

This research was funded by the Ministry of Education, Youth and Sports of the Czech Republic in the framework of the National Sustainability by ERDF/ESF, grant number CZ.02.1.01/0.0/0.0/18_069/0010049 “Research on the identification of combustion of unsuitable fuels and systems of self-diagnostics of boilers combustion solid fuels for domestic heating”.

Institutional Review Board Statement

Not applicable.

Informed Consent Statement

Not applicable.

Data Availability Statement

Not applicable.

Acknowledgments

The authors would like to thank the UIA03-123 CLAIRO (CLear AIR and Climate Adaptation in Ostrava and other cities) project, co-financed by the European Regional Development Fund for the possibility to build and deploy the sensor network for ambient air quality monitoring and data collection.

Conflicts of Interest

The authors declare no conflict of interest. The funders had no role in the design of the study; in the collection, analyses or interpretation of data; in the writing of the manuscript; or in the decision to publish the results.

References

  1. Spinelle, L.; Gerboles, M.; Kok, G.; Persijn, S.; Sauerwald, T. Review of Portable and Low-Cost Sensors for the Ambient Air Monitoring of Benzene and Other Volatile Organic Compounds. Sensors 2017, 17, 1520. [Google Scholar] [CrossRef] [PubMed] [Green Version]
  2. Agbroko, S.O.; Covington, J. A Novel, Low-Cost, Portable PID Sensor for the Detection of Volatile Organic Compounds. Sens. Actuators B Chem. 2018, 275, 10–15. [Google Scholar] [CrossRef] [Green Version]
  3. Lewis, A.C.; Lee, J.D.; Edwards, P.M.; Shaw, M.D.; Evans, M.J.; Moller, S.J.; Smith, K.R.; Buckley, J.W.; Ellis, M.; Gillot, S.R.; et al. Evaluating the Performance of Low Cost Chemical Sensors for Air Pollution Research. Faraday Discuss. 2016, 189, 85–103. [Google Scholar] [CrossRef] [PubMed]
  4. Saito, N.; Haneda, H.; Watanabe, K.; Shimanoe, K.; Sakaguchi, I. Highly Sensitive Isoprene Gas Sensor Using Au-Loaded Pyramid-Shaped ZnO Particles. Sens. Actuators B Chem. 2021, 326, 128999. [Google Scholar] [CrossRef]
  5. Bílek, J.; Bílek, O.; Maršolek, P.; Buček, P. Ambient Air Quality Measurement with Low-Cost Optical and Electrochemical Sensors: An Evaluation of Continuous Year-Long Operation. Environments 2021, 8, 114. [Google Scholar] [CrossRef]
  6. Spinelle, L.; Gerboles, M.; Villani, M.G.; Aleixandre, M.; Bonavitacola, F. Calibration of a Cluster of Low-Cost Sensors for the Measurement of Air Pollution in Ambient Air. In Proceedings of the 2014 IEEE SENSORS, Valencia, Spain, 2–5 November 2014; pp. 21–24. [Google Scholar]
  7. Batterman, S.; Chambliss, S.; Isakov, V. Spatial Resolution Requirements for Traffic-Related Air Pollutant Exposure Evaluations. Atmos. Environ. 2014, 94, 518–528. [Google Scholar] [CrossRef] [PubMed] [Green Version]
  8. Gerboles, M.; Spinelle, L.; Borowiak, A. Measuring Air Pollution with Low-Cost Sensors. Available online: https://core.ac.uk/reader/132627234 (accessed on 28 May 2021).
  9. Lewis, A.C.; von Schneidemesser, E.; Peltier, R.E. (Eds.) Low-Cost Sensors for the Measurement of Atmospheric Composition: Overview of Topic and Future Applications; WMO-No.1215; World Meteorological Organization: Geneva, Switzerland, 2018; ISBN 978-92-63-11215-6. [Google Scholar]
  10. Bauerová, P.; Šindelářová, A.; Rychlík, Š.; Novák, Z.; Keder, J. Low-Cost Air Quality Sensors: One-Year Field Comparative Measurement of Different Gas Sensors and Particle Counters with Reference Monitors at Tušimice Observatory. Atmosphere 2020, 11, 492. [Google Scholar] [CrossRef]
  11. Driscoll, J.N. Identification of Hydrocarbons in Complex Mixtures Using a Variable Energy PID and Capillary Column Gas Chromatography. J. Chromatogr. Sci. 1982, 20, 91–94. [Google Scholar] [CrossRef]
  12. Xu, W.; Cai, Y.; Gao, S.; Hou, S.; Yang, Y.; Duan, Y.; Fu, Q.; Chen, F.; Wu, J. New Understanding of Miniaturized VOCs Monitoring Device: PID-Type Sensors Performance Evaluations in Ambient Air. Sens. Actuators B Chem. 2021, 330, 129285. [Google Scholar] [CrossRef]
  13. Alphasense Ltd. Technical Specifications: PID-AH2. Available online: https://www.alphasense.com/wp-content/uploads/2019/08/PID-AH2.pdf (accessed on 21 February 2020).
  14. Alphasense Ltd. Application Note 305-06: VOC Correction Factor. Available online: https://www.alphasense.com/wp-content/uploads/2017/05/AAN-305-06.pdf (accessed on 1 December 2020).
  15. Alphasense Ltd. Application Note 301-04: Introduction to PhotoIonisation Detection. Available online: http://www.alphasense.com/WEB1213/wp-content/uploads/2013/07/AAN_301-04.pdf (accessed on 21 February 2020).
  16. Clements, A.L.; Reece, S.; Conner, T.; Williams, R. Observed Data Quality Concerns Involving Low-Cost Air Sensors. Atmos. Environ. X 2019, 3, 100034. [Google Scholar] [CrossRef] [PubMed]
  17. The European Parliament and The Council of the European Union. Directive 2008/50/EC of the European Parliament and of the Council of 21 May 2008 on Ambient Air Quality and Cleaner Air for Europe. Off. J. Eur. Union 2008, 152, 1. Available online: https://eur-lex.europa.eu/legal-content/EN/TXT/?uri=CELEX:32008L0050 (accessed on 12 August 2021).
  18. Directive 361/2007, Sb. of the Government of the Czech Republic on the Occupational Health Protection Conditions. Available online: https://www.zakonyprolidi.cz/cs/2007-361 (accessed on 3 December 2021).
  19. Alphasense Ltd. Technical Specifications: PID-A12. Available online: http://www.alphasense.com/WEB1213/wp-content/uploads/2019/08/PID-A12-1.pdf (accessed on 16 May 2020).
  20. CHMI Air Quality Department—Annual Tabelar Overview. Available online: https://www.chmi.cz/files/portal/docs/uoco/isko/tab_roc/tab_roc_CZ.html (accessed on 24 May 2021).
  21. Pang, X.; Nan, H.; Zhong, J.; Ye, D.; Shaw, M.D.; Lewis, A.C. Low-Cost Photoionization Sensors as Detectors in GC × GC Systems Designed for Ambient VOC Measurements. Sci. Total Environ. 2019, 664, 771–779. [Google Scholar] [CrossRef] [PubMed]
Figure 1. (a) Mini-PID sensor appearance. The outer diameter of the sensor is 20 mm. The lamp (in the front) in the assembled state is hidden under the white ionization chamber; (b) simplified principle of the photoionization measurement in the chamber. Spatial layout of the electrodes and UV source may vary in practice.
Environments 09 00049 g001
Figure 2. Layout of the field-measurement sensor network deployed in the industrial area. The individual units are marked with solid-colored dots. The currently displayed concentrations are indicated by a number inside the dot and the red, orange or green color of the dot depends on the value. The visualization system enables interpolation of data between individual units. These interpolations are displayed as a semi-transparent overlay.
Environments 09 00049 g002
Figure 3. Benzene calibration functions.
Environments 09 00049 g003
Figure 4. Scatter plot of correlated sensory and GC measurements.
Environments 09 00049 g004
Table 1. Mini-PID sensor specifications (manufacturer’s technical information [13,15]).
Sensor
Marking
Filling
Gas
Ionization
Energy (eV)
Measurement Range
(ppm Isobutylene)
PID—H9Xenon9.6 0–8000
PID—HXKrypton 110.0 0–100
PID—AHKrypton10.6 0–40
1—according to manufacturer, 10.0 eV sensor contains the same Kr lamp as the 10.6 eV sensor and an extra filter restricting radiation energy to 10.0 eV.
Table 2. Overview of used chemicals, their ionization energies, purity and producers.
CompoundIE (eV) 1PurityProducer
Benzene9.24p.a.Lach-Ner, Neratovice, Czech Republic
Ethylbenzene8.76p.a.Lach-Ner, Neratovice, Czech Republic
Isooctane9.86p.a.Penta Chemicals, Praha, Czech Republic
2-propanol10.17LC-MSBiosolve, Dienze, France
Toluene8.82p.a.Mach Chemikalie, Ostrava, Czech Republic
Trichloroethylene9.45PureLach-Ner, Neratovice, Czech Republic
1 Ionization energy.
Table 3. Tested sensors blank voltage values.
PIDHX [mV]PIDAH [mV]PIDAH9 [mV]
39.1 ± 0.347.2 ± 2.335.8 ± 0.1
Table 4. Overview of voltage values recorded at testing sensors’ response to selected compounds.
Benzenec [ppm]03.69.41014562279
PIDHXE [mv] 1032868862358---
PIDAH010825623302328---
PIDAH900.61.721.572.7314.2
Toluenec [ppm]05.049202476---
PIDHXE [mv]08335310742339---
PIDAH0293116523302330---
PIDAH90173482---
Ethylbenzenec [ppm]03.613.535.3------
PIDHXE [mv]033.781.7198------
PIDAH0111268669------
PIDAH906.111.935.4------
Trichloro-
ethylene
c [ppm]09.827.852174---
PIDHXE [mv]062.8151247817---
PIDAH022956410052329---
PIDAH901.94.47.627.8---
2-propanolc [ppm]037.7154329------
PIDHXE [mv]017.336---------
PIDAH03459471739------
PIDAH9048.0148330------
Isooctanec [ppm]022.854.8249418---
PIDHXE [mv]069.2155521792---
PIDAH045999723322332---
PIDAH901.94.414.925.2---
1 Voltage RSD during measurement: 5.1% (PIDHX), 5.3% (PIDAH) and 1.0% (PIDAH9).
Table 5. Calibration parameters for the used compounds.
SensorPIDHXPIDAHPIDH9
CompoundSlopeR2SlopeR2SlopeR2
Benzene0.11410.0360.9977.190.999
Toluene0.1830.9860.0410.975.830.999
Ethylbenzene0.1740.9920.0520.9939.130.988
Trichloroethylene0.2120.9980.0510.9966.290.999
2-propanol3.870.920.1810.98344.70.993
Isooctane0.5070.990.0510.99716.50.997
Table 6. Comparison of benzene’s recalculated and measured response factors.
PIDAH-10.6 eVPIDHX-10.0 eVPIDAH9-9.6 eV
P-IB 1P-Ben 2Meas 3P-IB 1P-Ben 2Meas 3P-IB 1P-Ben 2Meas 3
Benzene0.51.0010.540.871N/D 4N/D1
Toluene0.560.850.880.60.830.62N/DN/D1.21
Trichloro
ethylene
0.60.830.710.80.630.54N/DN/D1.14
Ethyl
benzene
0.560.850.70.60.830.65N/DN/D0.79
2-propanol40.130.2250.020.03N/DN/D0.16
Isooctane1.10.450.673.20.160.24N/DN/D0.43
1 Isobutylene response factor, provided by manufacturer [14]. 2 Producer provided response factor recalculated to Benzene response. 3 Measured in the laboratory and recalculated to Benzene response. 4 Not determined.
Table 7. Comparison of calculated and measured voltage responses—model mixtures.
GC-FID [ppm v/v]PIDAH-10.6 eVPIDHX-10.0 eVPIDAH9-9.6 eV
CompoundsTCE 1EtB 2IPA 3Meas 4Calc 5Meas 4Calc 5Meas 4Calc 5
TCE + EtB76.636.8---2047.12046.8489.8479.413.515.8
TCE + IPA---15.479.1721.9857.696.0126.83.23.6
TCE + IPA---16.3143.01743.21551.734.438.27.25.2
1 Trichloroethylene. 2 Ethylbenzene. 3 2-propanol (IsoProlylAlcohol). 4 Measured sensor response in millivolts [mV]. 5 Calculated theoretical response according to Equation (3) in millivolts [mV].
Table 8. Comparison of concentrations benzene determined by GC and PID response.
Sample No.GC [µg/m3]PIDHX [µg/m3]
17.66.5
20.71.1
31.71.8
41.22.3
534.519
60.21.1
80.41.8
92.92.7
109.912.2
1111.89.1
126.411
1326.336.8
140.20.4
153.34.5
161.42.3
17118.4
181.12.2
190.10.4
2057.540.8
17.66.5
Table 9. Correlations of PID results with VOC concentrations.
PIDHX vs. R2
Benzene (B)0.85
Benzene + Toluene (T) 0.61
B + T + Ethylbenzene (E)0.39
B + T + E + Xylene (X)0.31
B + T + E + X + Styrene (S)0.29
Table 10. Correlations of benzene concentration with other measured VOC concentrations.
Benzene vs. R2
Toluene (T)0.35
Ethylbenzene (E)0.15
Xylene (X) 0.24
Styrene (S)0.16
Sum of T + E + X + S0.24
Publisher’s Note: MDPI stays neutral with regard to jurisdictional claims in published maps and institutional affiliations.

