Article

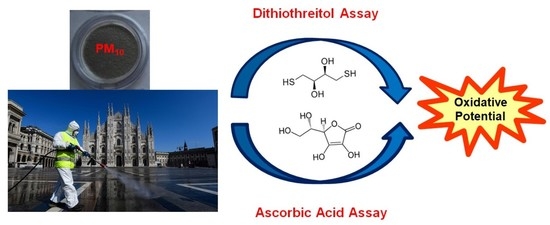
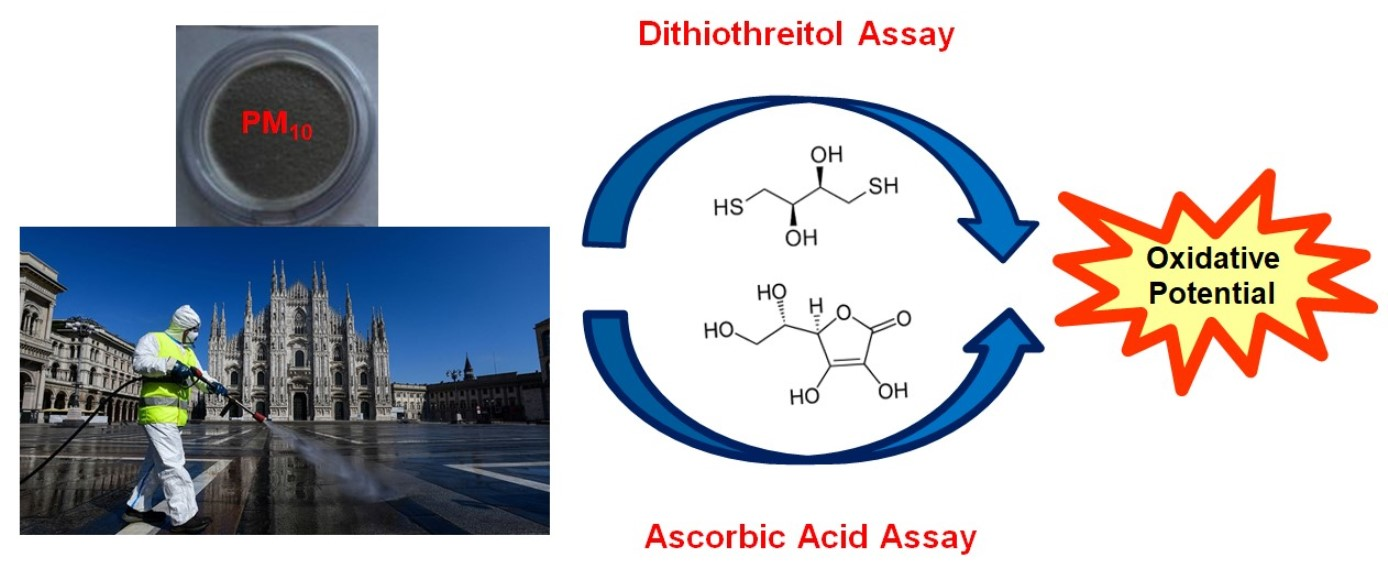
The Impact of COVID-19 Lockdown Strategies on Oxidative Properties of Ambient PM10 in the Metropolitan Area of Milan, Italy

by
Maria Chiara Pietrogrande
1,*,
Cristina Colombi
2,
Eleonora Cuccia
2,
Umberto Dal Santo
2 and
Luisa Romanato
1
1
Department of Chemical, Pharmaceutical and Agricultural Sciences, University of Ferrara, Via Fossato di Mortara 17/19, 44121 Ferrara, Italy
2
Environmental Monitoring Sector, Arpa Lombardia, Via Rosellini 17, 20124 Milano, Italy
*
Author to whom correspondence should be addressed.
Environments 2022, 9(11), 145; https://doi.org/10.3390/environments9110145
Submission received: 29 September 2022 / Revised: 11 November 2022 / Accepted: 12 November 2022 / Published: 15 November 2022
(This article belongs to the Special Issue Environmental Implications of COVID-19 Pandemic II)

Abstract

:
This research investigates the impact of controlling pandemic measures on the characteristics of atmospheric particulate matter (PM), with specific concern to its toxicity, measured by its oxidative properties. The investigated PM10 samples were collected in the metropolitan area of Milan during the epidemic lockdown, and their oxidative potential (OP) was assessed using ascorbic acid (AA) and dithiothreitol (DTT) acellular assays. During the full lockdown, we estimated reductions to 46% and 60% for nitrogen dioxide (NO2) and black carbon (BC) concentrations, respectively, based on the aggregated 2018–2019 data of NO2 and BC levels, used as baseline conditions. To quantify the impact of lockdown restrictions on PM oxidative activity, we studied the OP data measured in our laboratory on PM10 filters and directly compared the results from 15–30 April 2020 with those from the same time span in 2019. The OPAA values dropped to nearly 50%, similar to the concentration decrease in Elemental Carbon (EC) and traffic related metals, as well as to the variation in NO2 level. Otherwise, the OPDTT responses decreased to nearly 75%, as described by the corresponding reduction in Organic Carbon (OC) concentration and BC level.

Graphical Abstract

1. Introduction

After the global outbreak and rapid worldwide spread of the coronavirus disease (COVID-19), governments adopted various prevention and control strategies, such as social distancing, business shutdown, and city-wide lockdowns. Several studies have been conducted worldwide in the past two years to investigate the impact of the adopted restrictive strategies on air quality [1,2,3,4,5,6]. Since emissions from car traffic and industrial activity were greatly reduced during the lockdown, a general improvement in air quality has been observed, with significant decreases in atmospheric particulate matter PM10 and PM2.5 and gaseous pollutant levels, e.g., carbon monoxide, nitrogen oxides and benzene, in polluted cities across Europe, especially in the areas where lockdown measures were more severe. Among them, several sites in Italy have been investigated, as it was the first western country to apply severe measures, such as a general lockdown, with most of the population confined at home and a shutdown of all nonessential productive activities and services [7,8,9,10,11,12,13,14,15]. In this context, the study of the metropolitan city of Milan appears to be particularly representative, since it is a known hotspot for atmospheric pollution in Europe, due to a high concentration of inhabitants and industrial activities, and also because it has been the epicenter of the COVID-19 pandemic in Europe, with unmatched rates of confirmed infectious individuals and lethality [10,16,17,18,19,20,21]. Although papers relating the impact of the controlling pandemic measures on air quality have been prevalent in the past two years, few studies have explored the toxicity of atmospheric PM during epidemic controls [7,22,23].
Therefore, the main goal of this study was to characterize the toxicity and other chemical components of PM10 particles to understand how they have been influenced by quarantine lockdowns. PM toxicity is described by its oxidative potential (OP), as a relevant exposure metric for air PM. OP evaluates the oxidative stress responses induced by the generation of reactive oxygen species (ROS) in cells, as the main mechanism responsible for toxic effects on human health [24,25,26,27]. Among the several biological and chemical assays developed to measure the OP of airborne particles, in this work, we used acellular methods, as simple, low-cost and straightforward procedures for high throughput routine OP measurements [22,24,25,26,27,28,29,30]. They are based on the depletion rate of target antioxidants simulating the ability of the cells’ antioxidants to react with redox-active PM components and generate ROS. One of them uses dithiothreitol (DTT) as a chemical surrogate to mimic the in vivo interaction of PM with biological reducing agents, such as adenine dinucleotide (NADH) and nicotinamide adenine dinucleotide phosphate (NADPH) [31,32,33,34]. The other is based on ascorbic acid (AA) as a chemical surrogate of physiological antioxidants, which prevents the oxidation of lipids and proteins in respiratory tract lining fluids [35,36,37,38].
This study was conducted for 5 months in 2020, encompassing different phases of the lockdown restrictions. Previous papers in the metropolitan area of Milan reported the alarming PM toxicity affecting the population, as described by elevated PM oxidative potential, linked to strong emissions from vehicular traffic, as well as biomass burning and the generation of secondary photochemical products [16,19,20,25,31]. It must be underlined that the study of air quality during the prolonged abatement of traffic emissions represented an exceptional opportunity for understanding the contribution of emission sources and atmospheric processes in the region. The PM10 chemical composition was characterized in terms of the main chemical markers, and related to the measured OP responses, in order to highlight the contribution from emission sources and secondary processes to both AA and DTT activities. The impact of the lockdown restrictions on PM10 OP and chemical composition was estimated in comparison with the values observed in the same time span in 2019, representing the baseline conditions, in order to discriminate between the contributions from seasonal trends in the region. The present study is complementary to the work of Altuwayjiri, who first investigated the oxidative toxicity of PM2.5 in the metropolitan area of Milan before and during a COVID-19 lockdown [7].

2. Materials and Methods

2.1. Sampling Sites and Periods

Sampling was conducted at the Milano Pascal site of the ARPA Lombardia Air Quality Network. This is an urban background station located in the eastern side of Milan, the University area called “Città Studi” (Lat 45°28′24.59″ N, Long 9°13′21.00″ E), in a playground about 130 m from road traffic.
Daily PM10 samples were collected from 2 January to 26 May 2020, encompassing different phases of the COVID-19 national lockdown: (1) pre-lockdown (preL, 2 January–25 February) with normal conditions; (2) first partial-lockdown (PL1, 26 February–24 March) when schools and universities were closed, public and religious events were cancelled and people’s movements were limited in the Lombardy areas; (3) full-lockdown (FL, 25 March–4 May) when the imposed drastic restrictive measures limited travel, social, cultural and economic activities, with most of the population confined at home and a shutdown of all nonessential productive activities and services; (4) second partial-lockdown (PL2, 5 May–18 May) with progressive limitations relaxation, as most of the indoor and outdoor activities were re-opened and free movement between regions was allowed. For each campaign day, a Teflon (Pall) and quartz microfiber (Pall) filters (47 mm diameter) were simultaneously sampled and analyzed in parallel for chemical characterization and OP assessment of the PM10 particles. The PM10 mass concentration was determined by gravimetric method on Teflon filters, at 50% relative humidity and 20 °C.

2.2. Meteorological and Air Quality Data Collection

The time series of data from meteorological observations and air quality parameters were acquired from the official database of the Environmental Protection Agency of Lombardy (Agenzia Regionale per la Protezione Ambientale, ARPA) [39]. The investigated parameters—temperature, PM2.5 mass, nitrogen dioxide (NO2) and black carbon (BC) concentrations—were collected at a fixed air quality control station located in Milan Pascal. Except for the daily measured PM2.5 data, the average daily value of each parameter was computed from the hourly acquired values.

2.3. Chemical Characterization

For each monitored day, quartz and Teflon filters were analyzed in parallel to quantify 39 analytes, following the analytical protocols previously described [31]. Analyses were performed in the laboratories of the Environmental Monitoring Sector, ARPA Lombardia. In brief, the elemental composition was determined on Teflon filters by energy dispersive X-ray fluorescence; the EC and OC mass concentrations were measured on a 1.5 cm2 punch from quartz filters, using the Thermal-optical analysis and applying the NIOSH-Like protocol; concentrations of anions, cations and sugars (mannitol, levoglucosan, mannosan, and galactosan) were quantified on another punch of each quartz filter by ion-chromatography, after extraction with ultrapure water; 8 polycyclic aromatic hydrocarbons (PAHs) were measured using high pressure liquid chromatography or gas chromatography on a methanol extract of quartz filters.

2.4. Assessment of the PM Oxidative Potential

The DTT and AA assays were performed following the procedure described elsewhere [25,31,38,40,41] and briefly summarized here. Each assay was performed on a quarter of each quartz filter extracted with 0.1M buffer at pH 7.4 (10 mL sonicated in an ultrasonic bath for 15 min). These conditions were selected to represent the bio accessible fraction of PM10 components, which is potentially responsible for redox activity. Then, the extract was filtered on a regenerate cellulose syringe filter (13 mm, 0.22 μm, Kinesis) and aliquots of 3 mL were introduced into an amber vial at a constant temperature of 37 °C (in a dry bath) to perform the assays. A known amount of the target antioxidant AA or DTT (30 µL of a 10 mM AA or DTT solution) was added to the sample solution and its depletion rate was measured by using a UV-Vis spectrophotometer (Jasco V-730, Jasco Europe s.r.l., Lecco, Italy). In the DTT assay, the measure was performed by removing a 0.50 mL aliquot of the reaction mixture at defined times, and then stopping the reaction with trichloroacetic acid (0.50 mL of 10%). Afterwards, the remaining DTT that did not react with the PM10 components was reacted with DTNB (5,5′-Dithiobis(2-nitrobenzoic acid)) to generate DTT-disulphide and 2-nitro-5-thiobenzoic acid (TNB): 50 μL of the DTNB solution (10 mM concentration in phosphate buffer at pH 7.4) were added to each aliquot of the sample and well mixed. After two minutes, to allow the complete reaction, the pH was increased to pH 8.9 by adding 2.0 mL of Tris–HCl buffer (0.40 M at pH 8.9 with 20 mM of EDTA) to form the mercaptide ion (TNB2−), with a high absorbance at 412 nm (molar extinction coefficient ε = 14,150 M−1 cm−1). In the AA assay, the rate of AA depletion was followed directly in the spectrophotometric cuvette, by measuring the absorption of the ascorbate ion at 265 nm at defined time intervals (ε = 14,500 M−1 cm−1 at pH 7.4). The OP response is expressed as the rate of DTT or AA depletion (nmol min−1), which was computed by linearly fitting the experimental points of the reagent concentration versus time (5, 10, 15, 20 and 30 min) [40]. The response of the blank filters was determined and subtracted from the data of real PM samples. The obtained OP responses were normalized to the volume of the sampled air, to obtain an exposure metric accounting for inhaled air (OPV, nmol min−1 m−3) and to the mass of the sampled particles, to compute a parameter describing the PM intrinsic oxidative properties (OPm, nmol min−1 µg−1). Under these experimental conditions, a positive control test was performed on selected PM10 samples by repeating the OP measurements five times to ensure the measurement accuracy and precision. The measure precision, quantified as a relative Standard Deviation, was ≤5%, and the uncertainty in the range 5–11%, which expresses the % of the OPV responses of samples spiked with a known amount of redox active species. These results are in agreement with our [25,31,40] and literature data [16,32,33,34,35,36,37].

2.5. Statistical Analysis

The data were analyzed using descriptive statistics and reported as mean ± standard deviation. A two-tail t-test was applied to identify significant differences (at p ≤ 0.05 level) between the means of the data in the different investigated periods. Pearson’s correlation coefficient was used to assess the correlation between the concentrations of PM chemical components and air quality parameters as well as the OP responses. A p value ≤ 0.01 was considered as the significant level.

3. Results

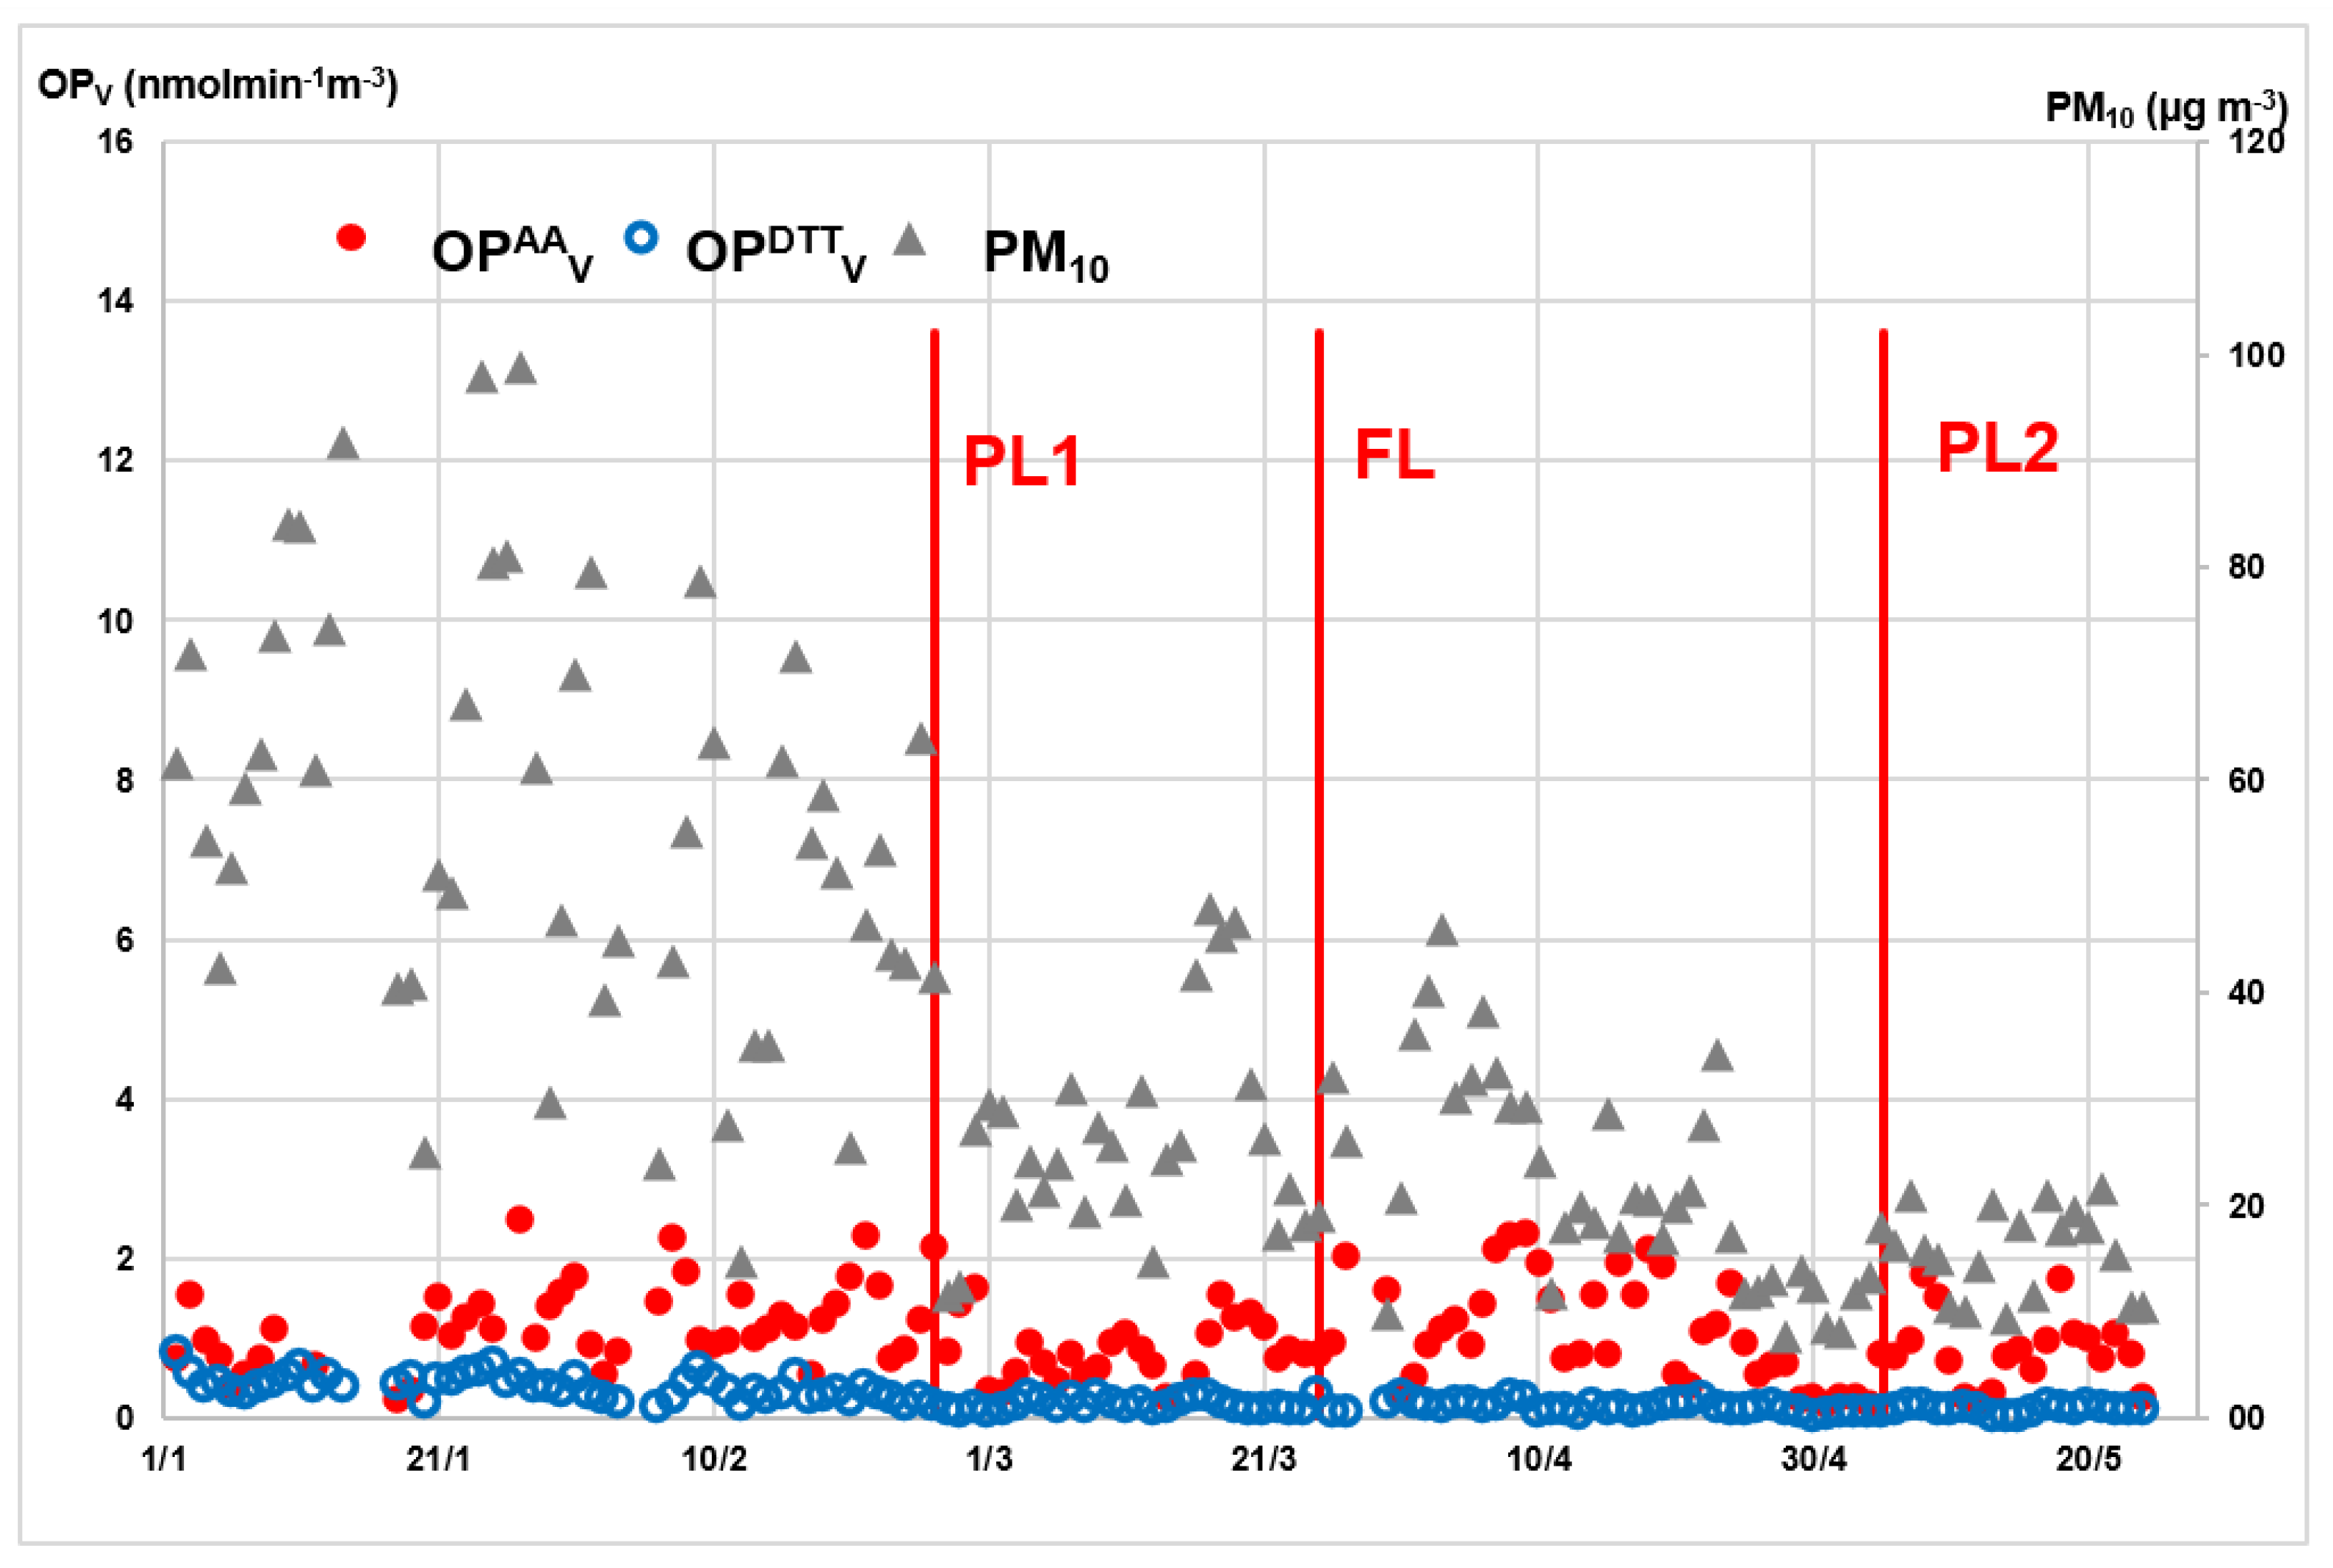
3.1. PM10 Oxidative Potential

For each daily PM10 sample, the oxidative potential was measured by using both AA and DTT assays. The results for 28 and 29 March 2020 were not considered, since they were associated with abnormally high PM10 concentrations, due to one event of desert dust intrusion into the whole Italian peninsula; this was consistent with the choice of other Authors, who investigated Italian PM10 in the same period [8,10,42]. The temporal evolution of the extrinsic volume-based responses of OPAAV (red points, left Y scale) and OPDTTV (blue circles, right Y scale) along the entire investigated time is presented in Figure 1, together with the measured PM10 concentrations (grey triangles, right Y scale). The time evolution of the data was investigated, with specific concern to the different lockdown periods, namely PL1, FL and PL2, as indicated by the vertical lines in the Figure. A visual inspection of the data clearly shows a similar trend of both AA and DTT responses, as well as for PM10 mass concentration, with a strong reduction from 26 February, when the first partial lockdown started.
First of all, it is visually evident that, of the two assays, the AA method generated higher responses for each sample compared with the DTT procedure, with a total mean value for the OPAAV nearly six times higher than that of the OPDTTV, namely 1.38 ± 2.09 nmol min−1 m−3 and 0.23 ± 0.16 nmol min−1 m−3, respectively (Table 1).
For a deeper insight into the impact of the pandemic restrictions, the mean and standard deviation values were computed for each lockdown period (Table 1) and a t-test (at p ≤ 0.05 level) was applied to identify significant changes between the periods (indicated by * in the table). In particular, the largest effect was shown from preL to PL1 on the OPAAV responses, which decreased nearly eight times, from 2.96 ± 2.98 to 0.37 ± 0.24 min−1 m−3, while the OPDTTV was nearly halved, from 0.39 ± 0.15 to 0.16 ± 0.06 nmol min−1 m−3, following the same trend as the PM10 mass, from 56.39 ± 20.02 µg m−3 to 27.36 ± 9.96 µg m−3. For the three parameters, the decreased values were kept almost constant in subsequent periods.
With the aim of assessing the exclusive impact of the adopted lockdown strategies, the effect of the seasonal changes must be taken into account, since they largely varied over the study period, ranging from winter to late spring, as described by the mean temperature increasing from 5.61 ± 2.85 °C in PreL to 19.26 ± 2.23 °C in PL2 (Table 1). In general, a consistent increase in air pollution has been observed in the investigated area during the cold months, characterized by higher PM mass concentration and oxidative toxicity in comparison with the warm season [14,18,31,41,43,44].

3.2. Contribution of PM10 Chemical Components on Oxidative Potential

A further step of the study was to characterize the PM10 chemical composition of daily samples by quantifying the concentrations of 39 chemical markers. These comprised the major inorganic ions, a total of 17 major and trace elements and carbonaceous components, i.e., organic carbon (OC), elemental carbon (EC), anhydrosugars, and a total of eight PAHs. The mean and standard deviation values were computed from individual data for the whole study period, as well as separately for each lockdown period (Table 1). Overall, the most abundant species (concentration mean ≥ 3 µg m−3) were ions—NO3, SO42− and NH4+—and OC, followed by EC, Ca, S, Si, Fe (concentration mean ≥ 1 µg m−3), other organic and inorganic components (at concentration levels around 1 µg m−3 or less)—levoglucosan, total aromatic polycyclic hydrocarbons (ΣPAHs), K, Cl and Al—and trace metals (at concentration levels around 0.1 µg m−3 or less).
Other than on the whole data set, the concentration mean values were computed for each lookdown period and compared by applying the Student’s t-test (at the significance level α ≤ 0.05) to single out significant differences between the periods. A significant decrease from the normal PreL to the lockdown periods was observed for most of the determined components, following the general decrease in PM10 mass concentration. Such a trend was observed for the NO3, NH4+, and K+ ions, and carbon components (OC, EC), levoglucosan, mannosan and ΣPAHs, as well as most of the heavy metals, i.e., Cr, Mn, Fe, Cu, Zn and Pb (values marked by * in Table 1).
Then, we investigated the association of AA and DTT activity with the quantified species. It must be underlined that only some of the PM10 components have been found to be reactive towards the OP assays—redox-active metals (e.g., Mn, Fe, Cu, Zn) and polycyclic aromatic hydrocarbons (in particular their oxo-derivatives quinones)—while others are correlated or inter-correlated with them [25,28,37,40,45,46,47,48,49,50]. Overall, based on the Pearson correlation coefficient (r), most of the investigated species showed a significant association with the OPV responses (p ≤ 0.01, values in bold in Table 2, n = 137), with only small differences between the OPAA and OPDTT values. In detail, both OPAAV and OPDTTV responses were significantly correlated with the carbonaceus components—OC, EC, anhydrosugars (levoglucosan and mannosan)—, the inorganic ions Ca2+ and K+, and some transition metals (Cr, Mn, Fe, Ni, Cu, Zn and Pb). In addition, the OPDTTV data results correlated with the total PAHs and secondary ions NO3, NH4+.

3.3. Impact of Lockdown Restrictions on Air Quality

Given the strong seasonality of the PM properties, a correct estimation of the exclusive impact of the adopted lockdown strategies requires the identification of the changes associated with the meteorological variations, to be disregarded from the general trend. Thus, we used the time series of selected pollutant concentrations during January–May in the years 2018 and 2019 to represent the baseline conditions commonly present in the investigated area. A similar approach has been recently used in other studies in the Lombardia area [7,8,10,15,18]. The chosen descriptors were the ambient temperature, as the most easily available parameter accounting for the main meteorological variations, the mass concentrations of PM10 and PM2.5, as well agreed indexes of air pollution. In addition, we studied NO2, accounting for automobile emissions (particularly diesel engines) [4,9,15,18,42] and black carbon (BC), as a primary tracer for the combustion emissions related to industrial and livestock activities [19,43,47]. The suitability of the NO2 and BC concentrations to represent the impact on PM oxidative properties, was confirmed by their significant (at p ≤ 0.01) correlation with most of the investigated markers, as well as the OPAAV and OPDTTV values (the Pearson correlation coefficients are given in Table 2).
For each lockdown period, the mean concentrations of each parameter were computed for 2020 and for the aggregated 2018–2019 data, representing the reference scenario. Then, the impact of the imposed restrictions in each lockdown period was quantified by computing the bias (expressed in %) of the data in 2020 compared with those aggregated for 2018–2019 (Table 3). It can be seen that the meteorological conditions, at least by considering the temperature, were nearly constant during the 3 years. The PM10 and PM2.5 mass concentrations showed only a limited effect of the lockdown restrictions, with a mean reduction to ~86% during PL1 and FL and then a recovery to the initial values with the partial restoration of activities during PL2. In contrast, the concentrations of air pollutants drastically decreased, as NO2 dropped to 46% during the total lockdown and then weakly recovered to 55% (Figure 2a), while BC reduced to 60% during FL and remained nearly unchanged (Figure 2a,b).

3.4. Impact of Lockdown Restrictions on PM Oxidative Properties

The quantitative assessment of the impact of the lockdown restrictions on PM10 oxidative properties requires a straight comparison among the OP experimental data. However, this is a challenging approach since the OP literature data are widely variable, as they are assay- and location-dependent, other than scarcely available, in particular for PM10 samples. Thus, this study was performed on the OP data measured in our laboratory, that assured the maximum data comparability [31]. The 15–30 April time span was chosen for comparing the FL period in 2020 with the baseline scenario in 2019, in order to minimize the impact of wintertime emissions from domestic biomass burning [16,19]. The compared filters were collected in 2019 at two other sites, other than at site MI_Pascal: a traffic site MI_Senato, in the metropolitan area strongly impacted by vehicle traffic, and an urban background site, Brescia, 80 Km from Milan [31]. The comparison was performed on the measured OPAAV and OPDTTV responses, on the concentrations of the PM10 mass and the main markers associated with the OP (Table 2), namely, OC (describing the biomass burning emissions), EC and the heavy metals—Mn, Fe, Cu and Zn—tracers of vehicle traffic [19,25,28,29,32,38,48,51,52] (Table 4). Then, the impact of the lockdown restrictions was computed as the percentage variations of the observations during April 2020 at MI_Pascal in comparison with the values measured at the same and other sites in April 2019 (% variation values reported in the table). For comparison, the variation in NO2 and BC concentrations in the corresponding time span are also reported in Table 4.
The obtained results indicate that the AA responses were strongly impacted by the lockdown restrictions, since their values at MI_Pascal dropped to ~50% in comparison with those in 2019 at the urban sites, and to 64% in comparison with data at the Brescia site. Such reductions are very similar to the decrease observed in PM10 concentrations of vehicle emissions tracers, such as EC (41–46%) and traffic-related metals, i.e., Mn (46–62%), Fe (58–71%), Cu (40–43%), and Zn (72–83%). The association with the limitation in road traffic was also confirmed by the surprising correspondence with a reduction to 50% in air NO2 concentration. The OP data measured with the DTT method were weakly reduced for the lockdown samples, as the OPDTTV values at MI_Pascal decreased to nearly 69% with respect to the same period in 2019 at the same and other traffic sites in Milan, and even less, to 82%, with respect to the background site of Brescia. This decrease can be associated with the similar reduction in OC concentration (72–79%), suggesting that the variation in OPDTTV values may be mainly associated with the reduction of the carbonaceous fraction, mostly emitted from biomass burning. This is also confirmed by the good agreement with BC concentration, showing a decrease to 69%.

4. Discussion

For each PM10 sample, by comparing the OP responses measured with the two assays we can observe a general difference, with OPAAV values higher than the OPDTTV. Such a behavior has been associated with the chemical composition of PM10 typically present at sites strongly impacted by vehicle traffic emissions, as observed in several works investigating the PM10 of urban areas [23,32,37,50,52,53]. These particles are characterized by the high concentrations of traffic-related metals (e.g., Cu, Fe, Mn), towards which the AA assay is more responsive than the DTT. In fact, among the large number of PM constituents that have been identified to influence OP concentrations, the AA assay is known to be more sensitive towards certain metals (Cu, Fe, and Mn, among others), while DTT is known to be more sensitive to certain organic species (especially photochemically produced species such as quinones) [32,36,40,45,50,51,52,53,54].
The strong seasonality observed for air pollution thorough the year has been commonly found in several studies in the investigated area [39,43,44,55,56]. It has been explained by the combination of meteorological factors with the impact of emission sources. Winter is characterized by stable weather conditions and weak atmospheric mixing that facilitate pollutants’ accumulation in the lower layers of the atmosphere. In contrast, in summer, higher wind speeds generate a broader mixing layer, which favors pollutant dispersion in the atmosphere. In addition, larger emissions are present in winter, mainly from extensive domestic biomass burning for residential heating purposes, generating high levels of carbonaceous PM species (mainly polycyclic aromatic hydrocarbons and their oxygenated derivatives). As these organic species have been found to play a predominant role in driving PM oxidative properties, their increased level has been found to be the main reason for the higher OP values measured in winter by the Authors and others in Northern Italy [16,19,20,25,31,42,47] and in Europe [46,48,50,53,56,57].
To give a general insight into the changes of the PM oxidative properties associated with the adopted lockdown strategies, the measured values were compared with the data retrieved from the literature across urban and traffic impacted areas, by distinguishing winter from spring values, although only a few studies are available on coarse PM. The OPAA and OPDTT responses obtained in the preL period are very close to those previously measured in Milan traffic sites in the same period (i.e., 2.22 ± 1.38 nmol min−1 m−3 and 0.72 ± 0.28 nmol min−1 m−3 for OPAAV and OPDTTV, respectively) [31], and previously in 2016 (0.36 ± 0.08 nmol min−1 m−3 for OPDTTV) [20]. These are within the typical range observed for coarse particles collected at other urban and industrial areas in central and Northern Italy [25,38,47,58], as well as in Europe, i.e., France [48,50,53], Greece [46,56,57] and the Netherlands [59]. Conversely, the responses obtained during the PL1, FL and PL2 periods showed reductions in PM10 and OP, when compared with those measured during the warm season in Lombardia in 2019 (i.e., 1.05 to 1.73 nmol min−1 m−3 and 0.18 to 0.26 nmol min−1 m−3 for OPAAV and OPDTTV, respectively) [31], and in several cities in Italy [16,25,38,47,56] and across Europe [28,48,50,52,53,56,57,59]. However, it is noteworthy that such comparisons may suffer from uncertainty, as they are strongly affected by the large variability among the characteristics of the investigated sites and the small comparability among the measurement protocols, due to a lack of well-defined standardized methods [25,37,50,54].
Concerning the chemical composition of the studied PM10 samples, the concentrations measured across the whole study period showed values consistent with literature data, reflecting the unique composition and emission sources of PM10 in urban and industrial areas in Italy [16,31,38,47,55,58] and in heavy traffic sites all over Europe [28,32,46,48,50,53,54,56]. High levels of OC and EC are emitted from traffic and biomass burning sources, which also directly emit levoglucosan, total PAHs and sulfur [19,31,43,44]. The predominant presence of the secondary ions, NO3, SO42− and NH4+, indicates the large contribution of photochemical atmospheric processes at the study site, because of the prevalent stagnant conditions in the area [7,16,19,20,44]. The concentration levels around 0.1 µg m−3 found for the heavy metals, Cr, Mn, Fe, Cu, Zn and Pb, may be related to emissions from tire and brake wear, mineral and fugitive re-suspended road dust, and also crustal material, such as K and Ca [7,9,32,38,46,48,51,52,53].
The results of the correlation analysis on the whole dataset (Table 2) may give a comprehensive insight into the emission sources determining the PM oxidative properties. Of the species found to be significantly correlated with OPV, OC and anhydrosugars are well-recognized markers of biomass burning emissions, while other components are markers of vehicular sources, namely EC, the redox-active metals (i.e., Cr, Mn, Fe, Cu, Zn and Pb) in both exhaust and non-exhaust particles and also crustal material. These observations are in good agreement with earlier studies across the Po Valley, that identified that the PM oxidative properties are mainly driven by biomass burning and vehicular emissions, followed by secondary aerosols [19,20,31,42].
The data reported in Table 3, using the 2018–2019 data as the reference scenario, are the basis upon which to assess the impact on air quality exclusively associated with the lockdown restrictions, by disregarding the effect of changing meteorological conditions. The obtained results are in good accordance with the findings reported by other Authors in Milan and in other cities in Southern Europe, although small discrepancies exist, mainly due to the choice of the time span [8,10,12,16,18,42]. Most of the air pollution decrease has been attributed to the reduction in vehicular traffic, as road and non-road transport was limited to 48–60% on average in Italy by the government imposed shutdowns [8,9,10,11,12,13,18,42]. Consistently with our results, literature data reported a decrease in NO2 concentration ranging from −40% to −50% on average at urban sites in Northern Italy [8,9,10,11,12,15,18,21,42]. A percentage reduction in the 60–70% range was found for BC, that is lower compared with that of NO2 [8,21,42]. This has been motivated by the concomitant emission of carbonaceous compounds from combustion for domestic residential heating and garden activities (e.g., biomass burning). Such activities were maintained at a constant and even enhanced level during the lockdown restrictions, as most of the population was confined at home according to Government imposition [8,21,42]. In line with other studies in the Lombardia area, the PM10 concentrations were only slightly affected by the lockdown measures, in comparison with NO2 and BC, showing a decrease of less than 10% on average. As a likely explanation, various Authors suggested that any decreases in emissions of PM10 and PM10 precursors from traffic could be compensated by increases in emissions from domestic heating and/or in formation of secondary aerosols. In particular, secondary processes play an important role in the region, given its specific climate and peculiar geomorphology [7,8,14,18,21,42].
The direct comparison between the OPAAV and OPDTTV measurements in our laboratory was the basis to quantitatively estimate the changes in PM10 OP during the FL period compared to 2019. In this context, the combined use of two assays has been found to be particularly helpful, since each assay captures different information, based on its specific sensitivity towards different PM redox-active components [25,37,38,50,53,54,58]. In particular, the AA assay, which is specifically sensitive to the redox-active heavy metals, mainly measured the variation associated with reduced levels of traffic-related metals in coarse particles, as a consequence of the drastic restrictions in road traffic. Otherwise, the DTT assay, which shows the highest sensitivity towards organic compounds, produced results mostly related to the variation in carbonaceous emissions from combustion processes. To the best of the Authors’ knowledge, only three papers have been published on this topic, concerning OPDTT of fine PM2.5. A good agreement is observed between our results for PM10 filters and those for PM2.5 samples collected at the same Milan site (11 April to 4 May 2020), showing an ~25% reduction in OPDTTV response [7]. Otherwise, different results were obtained in various locations in China, where the OPDTTV responses were slightly reduced by ~10% [22] and even slightly increased [23] during the lockdown restrictions. The Authors attributed such effects to higher concentrations in O3 and the increasing formation of secondary aerosols during the city’s lockdown.
The correlation analysis conducted on the whole data set showed that the concentrations of ambient NO2 and BC were significantly correlated with the OPDTTV and OPAAV responses, as well as with most of the investigated markers (Table 2). Based on such associations, we suggest that the % variation in these air contaminants may be used to predict the decrease in PM oxidative properties. In particular, NO2 may be used to predict OPAAV values, as these are more closely impacted by vehicle traffic contributions, while BC may be used as an estimation of OPDTTV variations, which are strongly effected by emissions from biomass combustion. The results obtained showed that the changes in air concentrations of NO2 and BC provide an accurate enough estimation of the variations in PM oxidative activity (Table 4).

5. Conclusions

The observed results clearly demonstrated that the restrictions during the pandemic lockdown significantly improved air quality and the toxicity of ambient PM10 in the metropolitan area of Milan. Although the total PM10 mass concentration exhibited only a small reduction, most of the chemical components showed a significant decrease; in particular, those associated with vehicular traffic emissions. As a consequence, the PM10 oxidative toxicity was reduced, as measured with the AA and DTT assays. On the basis of the correlation analysis between the PM10 oxidative activity and concentrations of its chemical components, we could identify the contribution of the different lockdown restrictions on the measured OP values. Of the two assays, the AA responses have been found to be strongly impacted by the drastic reduction of traffic-related metals in coarse particles, as a consequence of the severe lockdown restrictions on mobility and road traffic. Otherwise, the OPDTT values appeared mostly impacted by the reduction in the carbonaceous fraction, mainly emitted from combustion due to biomass burning and industrial activity.
On this basis, a simple approach has been proposed to predict the variation in PM10 oxidative properties using the concentrations of NO2 and BC air pollutants to describe the contributions from vehicle traffic and biomass combustion emissions, respectively. These concentration values can be retrieved online from the large amount of data collected and stored in the databases of National or European Environmental Protection Agencies. Although only estimated values can be obtained, the results obtained from measurements in our laboratory gave experimental proof that the PM oxidative activity may be predicted with enough accuracy.
As a final remark, the aforementioned results emphasize the relevance of each acellular assay in providing a quick and non-invasive procedure with which to measure oxidative properties, such as a parameter that integrates in a unique value particle size, surface properties, and the chemical composition of the PM. The strength of this approach can be magnified by combining different OP assays, since they retrieve different complementary information on the specific contributions of individual redox-active species to PM oxidative potential.

Author Contributions

Conceptualization, M.C.P. and C.C.; Data curation, C.C., E.C., U.D.S. and L.R.; Investigation, E.C., U.D.S. and L.R.; Methodology, L.R.; Supervision, M.C.P.; Writing—original draft, M.C.P.; Writing—review and editing, C.C. and L.R. All authors have read and agreed to the published version of the manuscript.

Funding

This research was funded by the Fund for the Scientific Research of the University of Ferrara [FAR 2021].

Data Availability Statement

The data presented in this study are available on request from the corresponding author.

Acknowledgments

The authors gratefully thank the personnel of the Environmental Monitoring Sector of ARPA Lombardia in Milan for the collection and chemical analyses of the PM10 filters.

Conflicts of Interest

The authors declare no conflict of interest.

References

  1. Balasubramaniam, D.; Kanmanipappa, C.; Shankarlal, B.; Saravanan, M. Assessing the impact of lockdown in US, Italy and France. What are the changes in air quality? Energy Sources, Part A Recover. Util. Environ. Eff. 2020, 1–11. [Google Scholar] [CrossRef]
  2. Keshtkar, M.; Heidari, H.; Moazzeni, N.; Azadi, H. Analysis of changes in air pollution quality and impact of COVID-19 on environmental health in Iran: Application of interpolation models and spatial autocorrelation. Environ. Sci. Pollut. Res. 2022, 29, 38505–38526. [Google Scholar] [CrossRef] [PubMed]
  3. Rodríguez-Urrego, D.; Rodríguez-Urrego, L. Air quality during the COVID-19: PM2.5 analysis in the 50 most polluted capital cities in the world. Environ. Pollut. 2020, 266, 115042. [Google Scholar] [CrossRef] [PubMed]
  4. Sicard, P.; De Marco, A.; Agathokleous, E.; Feng, Z.; Xud, X.; Paoletti, E.; DiéguezRodriguez, J.J.; Calatayud, V. Amplified ozone pollution in cities during the COVID-19 lockdown. Sci. Total Environ. 2020, 735, 139542. [Google Scholar] [CrossRef]
  5. Zambrano-Monserrate, M.A.; Ruano, M.A.; Sanchez-Alcalde, L. Indirect effects of COVID-19 on the environment. Sci. Total Environ. 2020, 728, 138813. [Google Scholar] [CrossRef]
  6. Gope, S.; Dawn, S.; Shree Das, S. Effect of COVID-19 pandemic on air quality: A study based on Air Quality Index. Environ. Sci. Pollut. Res. 2021, 28, 35564–35583. [Google Scholar] [CrossRef]
  7. Altuwayjiri, A.; Soleimanian, E.; Moroni, S.; Palomba, P.; Borgini, A.; De Marco, C.; Ruprecht, A.A.; Sioutas, C. The impact of stay-home policies during Coronavirus-19 pandemic on the chemical and toxicological characteristics of ambient PM2.5 in the metropolitan area of Milan, Italy. Sci. Total Environ. 2021, 758, 143582. [Google Scholar] [CrossRef]
  8. Collivignarelli, M.C.; Abbà, A.; Bertanza, G.; Pedrazzani, R.; Ricciardi, P.; Carnevale Miino, M. Lockdown for COVID-2019 in Milan: What are the effects on air quality? Sci. Total Environ. 2020, 732, 139280. [Google Scholar] [CrossRef]
  9. Gualtieri, G.; Brilli, L.; Carotenuto, F.; Vagnoli, C.; Zaldei, A.; Gioli, B. Quantifying road traffic impact on air quality in urban areas: A COVID-19-induced lockdown analysis in Italy. Environ. Pollut. 2020, 267, 115682. [Google Scholar] [CrossRef]
  10. Pala, D.; Casella, V.; Larizza, C.; Malovini, A.; Bellazzi, R. Impact of COVID-19 lockdown on PM concentrations in an Italian Northern City: A year-by-year assessment. PLoS ONE 2022, 17, e0263265. [Google Scholar] [CrossRef]
  11. Romano, S.; Catanzaro, V.; Paladini, F. Impacts of the COVID-19 lockdown measures on the 2020 columnar and surface air pollution parameters over south-eastern Italy. Atmosphere 2021, 12, 1366. [Google Scholar] [CrossRef]
  12. Vultaggio, M.; Varrica, D.; Alaimo, M.G. Impact on air quality of the COVID-19 lockdown in the urban area of palermo (Italy). Int. J. Environ. Res. Public Health 2020, 17, 7375. [Google Scholar] [CrossRef]
  13. Winkler, A.; Amoroso, A.; Di Giosa, A.; Marchegiani, G. The effect of COVID-19 lockdown on airborne particulate matter in Rome, Italy: A magnetic point of view. Environ. Pollut. 2021, 291, 118191. [Google Scholar] [CrossRef] [PubMed]
  14. Zoran, M.A.; Savastru, R.S.; Savastru, D.M.; Tautan, M.N. Assessing the relationship between surface levels of PM2.5 and PM10 particulate matter impact on COVID-19 in Milan, Italy. Sci. Total Environ. 2020, 738, 139825. [Google Scholar] [CrossRef] [PubMed]
  15. Zoran, M.A.; Savastru, R.S.; Savastru, D.M.; Tautan, M.N. Assessing the relationship between ground levels of ozone (O3) and nitrogen dioxide (NO2) with coronavirus (COVID-19) in Milan, Italy. Sci. Total Environ. 2020, 740, 140005. [Google Scholar] [CrossRef]
  16. Daher, N.; Ruprecht, A.; Invernizzi, G.; De Marco, J.C.; Miller-Schulze, J.; Bae Heo, J.; Shafer, M.M.; Shelton, B.R.; Schauer, J.J.; Sioutas, C. Characterization, sources and redox activity of fine and coarse particulate matter in Milan, Italy. Atmos. Environ. 2012, 49, 130–141. [Google Scholar] [CrossRef]
  17. Conticini, E.; Frediani, B.; Caro, D. Can atmospheric pollution be considered a co-factor in extremely high level of SARS-CoV-2 lethality in Northern Italy? Environ. Pollut. 2020, 261, 114465. [Google Scholar] [CrossRef] [PubMed]
  18. Lotrecchiano, N.; Trucillo, P.; Barletta, D.; Poletto, M.; Sofia, D. Air pollution analysis during the lockdown on the city of Milan. Processes 2021, 9, 1692. [Google Scholar] [CrossRef]
  19. Hakimzadeh, M.; Soleimanian, E.; Mousavi, A.; Borgini, A.; De Marco, C.; Ruprecht, A.A.; Sioutas, C. The impact of biomass burning on the oxidative potential of PM 2.5 in the metropolitan area of Milan. Atmos. Environ. 2020, 224, 117328. [Google Scholar] [CrossRef]
  20. Perrone, M.G.; Zhou, J.; Malandrino, M.; Sangiorgi, G.; Rizzi, C.; Ferrero, L.; Dommen, J.; Bolzacchini, E. PM chemical composition and oxidative potential of the soluble fraction of particles at two sites in the urban area of Milan, Northern Italy. Atmos. Environ. 2016, 128, 104–113. [Google Scholar] [CrossRef]
  21. Putaud, J.P.; Pozzoli, L.; Pisoni, E.; Martins Dos Santos, S.; Lagler, F.; Lanzani, G.; Dal Santo, U.; Colette, A. Impacts of the COVID-19 lockdown on air pollution at regional and urban background sites in northern Italy. Atmos. Chem. Phys. 2021, 21, 7597–7609. [Google Scholar] [CrossRef]
  22. Ainur, D.; Chen, Q.; Wang, Y.; Li, H.; Lin, H.; Ma, X.; Xu, X. Pollution characteristics and sources of environmentally persistent free radicals and oxidation potential in fine particulate matter related to city lockdown (CLD) in Xi’an, China. Environ. Res. 2022, 210, 112899. [Google Scholar] [CrossRef] [PubMed]
  23. Wang, W.; Yanhao Zhang, Y.; Cao, G.; Song, Y.; Zhang, J.; Li, R.; Zhao, L.; Dong, C.; Cai, Z. Influence of COVID-19 lockdown on the variation of organic aerosols: Insight into its molecular composition and oxidative potential. Environ. Res. 2022, 206, 112597. [Google Scholar] [CrossRef] [PubMed]
  24. Øvrevik, J. Oxidative potential versus biological effects: A review on the relevance of cell-free/abiotic assays as predictors of toxicity from airborne particulate matter. Int. J. Mol. Sci. 2019, 20, 4772. [Google Scholar] [CrossRef] [Green Version]
  25. Pietrogrande, M.C.; Russo, M.; Zagatti, E. Review of PM Oxidative Potential Measured with Acellular Assays in Urban and Rural Sites across Italy. Atmosphere 2019, 10, 626. [Google Scholar] [CrossRef] [Green Version]
  26. Crobeddu, B.; Baudrimont, I.; Deweird, J.; Sciare, J.; Badel, A.; Camproux, A.C.; Bui, L.C.; Baeza Squiban, A. Lung Antioxidant Depletion: A Predictive Indicator of Cellular Stress Induced by Ambient Fine Particles. Environ. Sci. Technol. 2020, 54, 2360–2369. [Google Scholar] [CrossRef]
  27. Leni, Z.; Künzi, L.; Geiser, M. Air pollution causing oxidative stress. Curr. Opin. Toxicol. 2020, 20–21, 1–8. [Google Scholar] [CrossRef]
  28. Daellenbach, K.R.; Uzu, G.; Jiang, J.; Cassagnes, L.E.; Leni, Z.; Vlachou, A.; Stefenelli, G.; Canonaco, F.; Weber, S.; Segers, A.; et al. Sources of particulate-matter air pollution and its oxidative potential in Europe. Nature 2020, 587, 414–419. [Google Scholar] [CrossRef]
  29. Molina, C.; Toro, A.R.; Manzano, C.A.; Canepari, S.; Massimi, L.; Leiva-Guzm, M.A. Airborne Aerosols and Human Healt: Leapfrogging from Mass Concentration to Oxidative Potential. Atmosphere 2020, 11, 917. [Google Scholar] [CrossRef]
  30. Cervellati, F.; Benedusi, M.; Manarini, F.; Woodby, B.; Russo, M.; Valacchi, G.; Pietrogrande, M.C. Proinflammatory properties and oxidative effects of atmospheric particle components in human keratinocytes. Chemosphere 2020, 240, 124746. [Google Scholar] [CrossRef]
  31. Pietrogrande, M.C.; Demaria, G.; Colombi, C.; Cuccia, E.; Dal Santo, U. Seasonal and Spatial Variations of PM10 and PM2.5 Oxidative Potential in Five Urban and Rural Sites across Lombardia Region, Italy. Int. J. Environ. Res. Public Health 2022, 19, 7778. [Google Scholar] [CrossRef] [PubMed]
  32. Gao, D.; Fang, T.; Verma, V.; Zeng, L.; Weber, R.J. A method for measuring total aerosol oxidative potential (OP) with the dithiothreitol (DTT) assay and comparisons between an urban and roadside site of water-soluble and total OP. Atmos. Meas. Tech. 2017, 10, 2821–2835. [Google Scholar] [CrossRef] [Green Version]
  33. Jiang, H.; Sabbir Ahmed, C.M.; Canchola, A.; Chen, J.Y.; Lin, Y.H. Use of dithiothreitol assay to evaluate the oxidative potential of atmospheric aerosols. Atmosphere 2019, 10, 571. [Google Scholar] [CrossRef] [Green Version]
  34. Molina, C.; Andrade, C.; Manzano, C.A.; Toro, A.R.; Verma, V.; Leiva-Guzmán, M.A. Dithiothreitol-based oxidative potential for airborne particulate matter: An estimation of the associated uncertainty Environ. Sci. Pollut. Res. 2020, 27, 29672–29680. [Google Scholar] [CrossRef] [PubMed]
  35. Lin, M.; Yu, J.Z. Assessment of interactions between transition metals and atmospheric organics: Ascorbic acid depletion and hydroxyl radical formation in organic-metal mixtures. Environ. Sci. Technol. 2020, 54, 1431–1442. [Google Scholar] [CrossRef]
  36. Shen, J.; Griffiths, P.T.; Campbell, S.J.; Utinger, B.; Kalberer, M.; Paulson, S.E. Ascorbate oxidation by iron, copper and reactive oxygen species: Review, model development, and derivation of key rate constants. Sci. Rep. 2021, 11, 7417. [Google Scholar] [CrossRef]
  37. Rao, L.; Zhang, L.; Wang, X.; Xie, T.; Zhou, S.; Lu, S.; Liu, X.; Lu, H.; Xiao, K.; Wang, W.; et al. Oxidative potential induced by ambient particulate matters with acellular assays: A review. Processes 2020, 8, 1410. [Google Scholar] [CrossRef]
  38. Perrone, M.R.; Bertoli, I.; Romano, S.; Russo, M.; Rispoli, G.; Pietrogrande, M.C. PM2.5 and PM10 oxidative potential at a Central Mediterranean Site: Contrasts between dithiothreitol- and ascorbic acid-measured values in relation with particle size and chemical composition. Atmos. Environ. 2019, 210, 143–155. [Google Scholar] [CrossRef]
  39. ARPA Lombardia: Database of Air Pollutants. Available online: https://www.arpalombardia.it/Pages/Aria/Inquinanti.aspx (accessed on 19 September 2022).
  40. Visentin, M.; Pagnoni, A.; Sarti, E.; Pietrogrande, M.C. Urban PM2.5 oxidative potential: Importance of chemical species and comparison of two spectrophotometric cell-free assays. Environ. Pollut. 2016, 219, 72–79. [Google Scholar] [CrossRef]
  41. Pietrogrande, M.C.; Bacco, D.; Demaria, G.; Russo, M.; Scotto, F.; Trentini, A. Polycyclic aromatic hydrocarbons and their oxygenated derivatives in urban aerosol: Levels, chemical profiles, and contribution to PM2.5 oxidative potential. Environ. Sci. Pollut. Res. 2022, 29, 54391–54406. [Google Scholar] [CrossRef]
  42. Donzelli, G.; Cioni, L.; Cancellieri, M.; Morales, A.L.; Suárez-Varela, M.M.M. The effect of the COVID-19 lockdown on air quality in three italian medium-sized cities. Atmosphere 2020, 11, 1118. [Google Scholar] [CrossRef]
  43. Pietrogrande, M.C.; Bacco, D.; Ferrari, S.; Ricciardelli, I.; Scotto, F.; Trentini, A.; Visentin, M. Characteristics and major sources of carbonaceous aerosols in PM2.5 in Emilia Romagna Region (Northern Italy) from four-year observations. Sci. Total Environ. 2016, 553, 172–183. [Google Scholar] [CrossRef] [PubMed]
  44. Marcazzan, G.M.; Vaccaro, S.; Valli, G.; Vecchi, R. Characterisation of PM10 and PM2.5 particulate matter in the ambient air of Milan (Italy). Atmos. Environ. 2001, 35, 4639–4650. [Google Scholar] [CrossRef]
  45. Fang, T.; Lakey, P.S.J.; Weber, R.J.; Shiraiwa, M. Oxidative Potential of Particulate Matter and Generation of Reactive Oxygen Species in Epithelial Lining Fluid. Environ. Sci. Technol. 2019, 53, 12784–12792. [Google Scholar] [CrossRef] [PubMed]
  46. Velali, E.; Papachristou, E.; Pantazaki, A.; Choli-Papadopoulou, T.; Planou, S.; Kouras, A.; Manoli, E.; Besis, A.; Voutsa, D.; Samara, C. Redox activity and in vitro bioactivity of the water-soluble fraction of urban particulate matter in relation to particle size and chemical composition. Environ. Pollut. 2016, 208, 774–786. [Google Scholar] [CrossRef]
  47. Pietrogrande, M.C.; Bertoli, I.; Clauser, G.; Dalpiaz, C.; Dell’Anna, R.; Lazzeri, P.; Walter Lenzi, W.; Mara Russo, M. Chemical composition and oxidative potential of atmospheric particles heavily impacted by residential wood burning in the alpine region of northern Italy. Atmos. Environ. 2021, 253, 118360. [Google Scholar] [CrossRef]
  48. Calas, A.; Uzu, G.; Besombes, J.L.; Martins, J.M.F.; Redaelli, M.; Weber, S.; Charron, A.; Albinet, A.; Chevrier, F.; Brulfert, G.; et al. Seasonal variations and chemical predictors of oxidative potential (OP) of particulate matter (PM) for seven urban French sites. Atmosphere 2019, 10, 698. [Google Scholar] [CrossRef] [Green Version]
  49. Crobeddu, B.; Baudrimont, I.; Deweirdt, J.; Sciare, J.; Badel, A.; Camproux, A.C.; Bui, L.C.; Baeza-Squiban, A. Oxidative potential of particulate matter 2.5 as predictive indicator of cellular stress. Environ. Pollut. 2017, 230, 125–133. [Google Scholar] [CrossRef]
  50. Calas, A.; Uzu, G.; Kelly, F.; Houdier, S.; Martins, J.M.F.; Thomas, F.; Molton, F.; Charron, A.; Dunster, C.; Oliete, A.; et al. Comparison between five acellular oxidative potential measurement assays performed with detailed chemistry on PM10 samples from the city of Chamonix (France). Atmos. Chem. Phys. 2018, 18, 7863–7875. [Google Scholar] [CrossRef] [Green Version]
  51. Kajino, M.; Hagino, H.; Fujitani, Y.; Morikawa, T.; Fukui, T.; Onishi, K.; Okuda, T.; Igarash, Y. Simulation of the transition metal-based cumulative oxidative potential in East Asia and its emission sources in Japan. Sci. Rep. 2021, 11, 1–12. [Google Scholar] [CrossRef]
  52. Godri, K.J.; Harriso, R.M.; Evans, T.; Baker, T.; Dunster, C.; Mudway, I.S.; Kelly, F.J. Increased oxidative burden associated with traffic component of ambient particulate matter at roadside and Urban background schools sites in London. PLoS ONE 2011, 6, e21961. [Google Scholar] [CrossRef] [PubMed] [Green Version]
  53. Weber, S.; Uzu, G.; Favez, O.; Borlaza, L.J.S.; Calas, A.; Salameh, D.; Chevrier, F.; Allard, J.; Besombes, J.L.; Albinet, A.; et al. Source apportionment of atmospheric PM10 oxidative potential: Synthesis of 15 year-round urban datasets in France. Atmos. Chem. Phys. 2021, 21, 11353–11378. [Google Scholar] [CrossRef]
  54. Bates, J.T.; Fang, T.; Verma, V.; Zeng, L.; Weber, R.J.; Tolbert, P.E.; Abrams, J.Y.; Sarnat, S.E.; Klein, M.; Mulholland, J.A.; et al. Review of Acellular Assays of Ambient Particulate Matter Oxidative Potential: Methods and Relationships with Composition, Sources, and Health Effects. Environ. Sci. Technol. 2019, 53, 4003–4019. [Google Scholar] [CrossRef] [PubMed]
  55. Meroni, A.; Pirovano, G.; Gilardoni, S.; Lonati, G.; Colombi, C.; Gianelle, V.; Paglione, M.; Poluzzi, V.; Riva, G.M.; Toppetti, A. Investigating the role of chemical and physical processes on organic aerosol modelling with CAMx in the Po Valley during a winter episode. Atmos. Environ. 2017, 171, 126–142. [Google Scholar] [CrossRef]
  56. Diapouli, E.; Manousakas, M.I.; Vratolis, S.; Vasilatou, V.; Pateraki, S.; Bairachtari, K.A.; Querol, X.; Amato, F.; Alastuey, A.; Karanasiou, A.A.; et al. AIRUSE-LIFE +: Estimation of natural source contributions to urban ambient air PM10 and PM2.5 concentrations in southern Europe—Implications to compliance with limit values. Atmos. Chem. Phys. 2017, 7, 3673–3685. [Google Scholar] [CrossRef] [Green Version]
  57. Paraskevopoulou, D.; Bougiatioti, A.; Stavroulas, I.; Fang, T.; Lianou, M.; Liakakou, E.; Gerasopoulos, E.; Weber, R.; Nenes, A.; Mihalopoulos, N. Yearlong variability of oxidative potential of particulate matter in an urban Mediterranean environment. Atmos. Environ. 2019, 206, 183–196. [Google Scholar] [CrossRef]
  58. Massimi, L.; Ristorini, M.; Simonetti, G.; Frezzini, M.A.; Astolfi, M.L.; Canepari, S. Spatial mapping and size distribution of oxidative potential of particulate matter released by spatially disaggregated sources. Environ. Pollut. 2020, 266. [Google Scholar] [CrossRef]
  59. Borlaza, L.J.; Weber, S.; Marsal, A.; Uzu, G.; Jacob, V.; Besombe, J.L.; Chatain, M.; Conil, S.; Jaffrezo, J.L. Nine-year trends of PM10 sources and oxidative potential in a rural background site in France. Atmos. Chem. Phys. 2022, 22, 8701–8723. [Google Scholar] [CrossRef]
Figure 1. Temporal evolution along the whole investigated time of the extrinsic volume-based OPAAV (red points, left Y scale) and OPDTTV (blue circles, right Y scale) responses and the PM10 concentrations (grey triangles, right Y scale). The vertical lines indicate the first day of each lockdown period, namely 26 February for PL1, 25 March for FL, and 5 May for PL2.
Environments 09 00145 g001
Figure 2. Temporal evolution of the concentration of air pollutants along the whole investigated time: comparison between the different lockdown periods in 2020 (red points) and 2018–2019 aggregated data representing a reference scenario (black empty circles). The vertical lines indicate the first day of each lockdown period, namely 26 February for PL1, 25 March for FL, and 5 May for PL2. (a): NO2 concentration; (b): BC concentration.
Environments 09 00145 g002aEnvironments 09 00145 g002b
Table 1. OP responses measured with AA and DTT assays, concentrations of atmospheric pollutants (nitrogen dioxide, NO2, and black carbon, BC) and of PM10 chemical components, ambient temperature: means and standard deviation values computed for the whole study and each lockdown period. * indicates significant differences (Student t-test. p ≤ 0.05) between the periods. BLQ = below quantification limit.
Total
2 January–18 May
PreL 2
2 January–25 February
PL1
26 February–24 March
FL
25 March–4 May
PL2
5–18 May
OPVAA (nmol min−1m−3)1.38 ± 2.092.96 * ± 2.980.37 ± 0.060.49 ± 0.350.58 ± 0.34
OPVDTT (nmol min−1m−3)0.23 ± 0.160.39 * ± 0.150.16 ± 0.060.14 ± 0.070.10 ± 0.04
OPmAA (nmol min−1µg−1)0.040 ± 0.0480.061 ± 0.0660.01 ± 0.010.03 ± 0.030.04 ± 0.02
OPmDTT (nmol min−1µg−1)0.007 ± 0.0020.007 ± 0.0020.01 ± 0.000.01 ± 0.0040.01 ± 0.00
PM10 (µg m−3)35.7 ± 21.9256.39 * ± 20.0227.36 ± 9.9621.93 ± 9.7515.87 ± 3.94
PM2.5 (µg m−3)26.26 ± 17.4342.63 * ± 16.4719.96 ± 8.2314.92 ± 7.3112.00 ± 3.03
NO2 (µg m−3)35.23 ± 19.3053.57 ± 11.9532.95 ± 10.9616.52 ± 8.9913.27 ± 4.84
BC (µg m−3)2.76 ± 2.405.17 ± 2.241.68 ± 0.720.91 ± 0.500.70 ± 0.26
Temperature (°C)10.23 ± 5.425.61 ± 2.859.08 ± 2.6014.00 ± 4.0119.26 ± 2.23
Cl (µg m−3)0.065 ± 0.460.66 ± 0.45BLQBLQBLQ
NO2 (µg m−3)BLQ0.04 ± 0.01BLQBLQBLQ
NO3 (µg m−3)9.20 ± 8.3815.84 * ± 8.438.49 ± 4.924.02 ± 4.311.75 ± 1.25
SO42− (µg m−3)2.29 ± 1.202.60 ± 1.361.67 ± 0.992.54 ± 1.151.68 ± 0.43
Na+ (µg m−3)0.43 ± 0.270.50 ± 0.300.35 ± 0.300.31 ± 0.221.68 ± 0.43
NH4+ (µg m−3)2.86 ± 2.314.74 * ± 2.372.51 ± 1.431.55 ± 1.330.74 ± 0.36
K+ (µg m−3)0.30 ± 0.230.48 * ± 0.240.17 ± 0.060.16 ± 0.070.13 ± 0.07
Mg2+ (µg m−3)0.09 ± 0.040.09 ± 0.030.10 ± 0.040.11 ± 0.050.08 ± 0.02
Ca2+ (µg m−3)0.62 ± 0.350.81 ± 0.380.58 ± 0.360.49 ± 0.260.42 ± 0.14
OC (µg m−3)6.87 ± 4.5011.10 * ± 4.565.18 ± 1.624.23 ± 1.592.99 ± 0.65
EC (µg m−3)0.79 ± 0.741.47 * ± 0.830.52 ± 0.200.32 ± 0.130.28 ± 0.11
Manni (µg m−3)BLQ0.03 ± 0.01BLQBLQBLQ
Levo (µg m−3)0.62 ± 0.671.07 * ± 0.720.27 ± 0.130.13 ± 0.080.04 ± 0.01
Manno (µg m−3)0.10 ± 0.080.11 * ± 0.080.04 ± 0.01BLQBLQ
Gala (µg m−3)0.06 ± 0.040.07 ± 0.050.06 ± 0.050.03 ± 0.02BLQ
ƩPAHs (ng m−3)1.75 ± 1.452.82 * ± 2.22BLQBLQBLQ
S (µg m−3)0.93 ± 0.421.04 ± 0.470.74 ± 0.400.95 ± 0.390.35 ± 0.22
Cl (µg m−3)0.61 ± 0.621.14 * ± 0.510.30 ± 0.470.22 ± 0.330.22 ± 0.37
Al (µg m−3)0.35 ± 0.210.33 ± 0.150.29 ± 0.150.41 ± 0.210.34 ± 0.21
Si (µg m−3)1.04 ± 0.551.16 ± 0.510.90 ± 0.441.08 ± 0.660.86 ± 0.45
K (µg m−3)0.46 ± 0.290.74 * ± 0.310.34 ± 0.120.29 ± 0.120.23 ± 0.08
Ca (µg m−3)0.85 ± 0.501.13 ± 0.530.81 ± 0.440.62 ± 0.370.60 ± 0.29
Ti (µg m−3)0.04 ± 0.020.04 ± 0.020.030 ± 0.0130.034 ± 0.0200.031 ± 0.015
V (µg m−3)0.001 ± 0.001BLQBLQ0.001 ± 0.0000.001 ± 0.000
Cr (µg m−3)0.010 ± 0.0080.02 * ± 0.010.01 ± 0.0040.001 ± 0.0000.005 ± 0.001
Mn (µg m−3)0.019 ± 0.0080.03 * ± 0.010.01 ± 0.0070.011 ± 0.0060.011 ± 0.005
Fe (µg m−3)1.42 ± 0.992.47 * ± 0.831.13 ± 0.500.72 ± 0.420.69 ± 0.24
Ni (µg m−3)0.005 ± 0.0030.01 ± 0.000.001 ± 0.0010.002 ± 0.0010.002 ± 0.001
Cu (µg m−3)0.053 ± 0.0570.11 * ± 0.050.040 ± 0.0270.010 ± 0.0060.014 ± 0.005
Zn (µg m−3)0.074 ± 0.050.13 * ± 0.050.060 ± 0.0390.031 ± 0.0220.038 ± 0.038
Br (µg m−3)0.012 ± 0.0180.020 ± 0.030.010 ± 0.0040.008 ± 0.0040.006 ± 0.002
Pb (µg m−3)0.030 ± 0.0210.05 * ± 0.020.02 ± 0.010.015 ± 0.0090.014 ± 0.005
Manni: mannitol; Levo: levoglucosan; Manno: mannosan; Gala: galactosan.
Table 2. Association of the OPAAV and OPDTTV responses and air concentrations of NO2 and BC with the concentrations of PM10 chemical components. Pearson’s correlation coefficients (r) computed for the whole study period. Bold values indicate significant correlation at p ≤ 0.01 level.
OPVAAOPVDTTNO2BC
OPvAA(nmol min−1m−3)10.500.470.58
OPvDTT(nmol min−1m−3)0.5010.820.88
PM10 (µg m−3)0.490.830.770.89
Cl (µg m−3)0.500.440.340.39
NO3 (µg m−3)0.250.660.700.69
SO42−(µg m−3) 0.050.160.020.09
Na+ (µg m−3)0.060.080.240.13
NH4+ (µg m−3)0.270.670.680.73
K+ (µg m−3)0.560.870.700.91
Mg2+ (µg m−3) 0.010.04−0.25−0.12
Ca2+ (µg m−3) 0.390.440.210.17
OC (µg m−3) 0.590.860.810.97
EC (µg m−3) 0.670.790.790.91
Levo (µg m−3)0.550.850.710.90
Manno (µg m−3)0.370.780.550.81
ƩPAHs0.290.590.270.76
S (µg m−3)0.070.230.070.11
Cl (µg m−3) 0.500.650.560.55
Al (µg m−3)−0.05−0.02−0.020.05
Si (µg m−3)0.110.170.200.21
K (µg m−3)0.490.850.600.67
Ca (µg m−3)0.250.370.480.42
Ti (µg m−3)0.220.340.310.34
V (µg m−3)−0.11−0.11−0.12−0.06
Cr (µg m−3)0.580.720.700.74
Mn (µg m−3)0.500.690.800.74
Fe (µg m−3)0.550.730.860.80
Ni (µg m−3)0.510.580.560.62
Cu (µg m−3)0.600.740.800.83
Zn (µg m−3)0.410.670.790.77
Pb (µg m−3)0.550.700.840.77
PM2.5 (µg m−3)0.470.840.800.93
NO2 (µg m−3)0.470.821.000.84
BC (µg m−3)0.580.880.841.00
Table 3. Reference scenario of air quality in the investigated area: means and standard deviation values of 2018–2019 aggregated data computed in each time span corresponding to different lockdown periods. Impact of lockdown restrictions measured: % bias of air quality data in 2020 compared with 2018–2019 values in each equivalent period.
Mean Concentrations
PreLPL1FLPL2
PM10 (µg m−3)47.08 ± 20.3632.37 ± 16.824.74 ± 11.8615.73 ± 4.33
PM2.5 (µg m−3)36.07 ± 16.9024.50 ± 7.4816.62 ± 8.5010.76 ± 2.69
NO2 (µg m−3)54.12 ± 14.9146.15 ± 7.0035.68 ± 12.8024.16 ± 5.14
BC (µg m−3)4.37 ± 2.132.26 ± 4.531.51 ± 0.791.09 ± 0.33
Temperature (°C)4.61 ± 2.438.46 ± 5.9214.12 ± 3.0216.64 ± 2.30
% Variation
PreLPL1FL1PL2
PM10 (µg m−3)120 ± 2085 ± 1389 ± 11101 ± 44
PM2.5 (µg m−3)116 ± 1781 ± 890 ± 8112 ± 3
NO2 (µg m−3)99 ± 1371 ± 946 ± 1155 ± 5
BC (µg m−3)118 ± 274 ± 360 ± 164 ± 0
Temperature (°C)122 ± 3107 ± 499 ± 4116 ± 2
Table 4. Impact of the full lockdown restrictions on OP responses measured with AA and DTT assays and concentrations of PM10 mass and its chemical components: mean values (±standard deviation) of the data obtained during the equivalent time span in 2019; % variation of each value at the MI_Pascal site in 2020 computed in comparison with data at MI_Pascal, MI_Senato and Brescia in 2019. Units: OPV (nmol min−1 m−3).
Mean Concentrations
15–30 April 202015–30 April 2019
MI_PascalMI_PascalMI_SenatoBrescia
OPAAV(nmo min−1 m−3)0.75 ± 0.331.41 ± 0.971.54 ± 0.871.18 ± 0.58
OPDTTV(nmol min−1 m−3)0.15 ± 0.050.21 ± 0.210.19 ± 0.180.18 ± 0.08
PM10 (µg m−3)17.79 ± 7.718.69 ± 7.423.45 ± 8.620.1 ± 7.8
OC (µg m−3)3.86 ± 1.784.99 ± 1.315.38 ± 1.354.86 ± 1.13
EC (µg m−3)0.24 ± 0.100.55 ± 0.250.60 ± 0.160.54 ± 0.12
Mn (µg m−3)0.008 ± 0.004 0.02 ± 0.0020.013 ± 0.006
Fe (µg m−3)0.52 ± 0.26 0.90 ± 0.210.73 ± 0.19
Cu (µg m−3)0.008 ± 0.004 0.021 ± 0.0080.019 ± 0.006
Zn (µg m−3)0.038 ± 0.026 0.040 ± 0.0140.052 ± 0.045
NO2 (µg m−3)16.52 ± 8.99 33.04 ± 8.03
BC (µg m−3)0.91 ± 0.50 1.29 ± 0.48
Temp (°C)14.93 ± 3.95 14.07 ± 3.00
% 2020 vs. 2019 Variations
OPAAV(nmol min−1 m−3) 534964
OPDTTV(nmol min−1 m−3) 707882
PM10(µg m−3) 957688
OC (µg m−3) 777279
EC (µg m−3) 444146
Mn (µg m−3) 4662
Fe (µg m−3) 5871
Cu (µg m−3) 4043
Zn (µg m−3) 7283
NO2 (µg m−3) 50
BC (µg m−3) 71
Temp (°C) 106
Publisher’s Note: MDPI stays neutral with regard to jurisdictional claims in published maps and institutional affiliations.

