Article

Impacts of Freshwater Sources on Salinity Structure in a Large, Shallow Estuary

by
Mohamed Z. Moustafa
1,2,*,
Zhen-Gang Ji
3 and
John Hamrick
4,†
1
South Florida Water Management District, West Palm Beach, FL 33406, USA
2
South Florida Engineering and Consulting, Lake Worth, FL 33460, USA
3
Department of Civil and Environmental Engineering, George Washington University, Washington, DC 20052, USA
4
Tetra Tech, Inc., Fairfax, VA 22030, USA
*
Author to whom correspondence should be addressed.
Deceased.
Environments 2024, 11(4), 72; https://doi.org/10.3390/environments11040072
Submission received: 5 February 2024 / Revised: 28 March 2024 / Accepted: 31 March 2024 / Published: 3 April 2024

Abstract

:
Florida Bay, a large and shallow estuary, serves as a vital habitat for a diverse range of marine species and holds significant environmental, commercial, and recreational value. The salinity structure of the bay plays a key role in the bay’s ecosystem. Florida Bay receives 45% of its freshwater directly from rainfall, the largest source of freshwater, while the Taylor River is the second largest source. A hydrodynamic model was applied to determine if doubling the Taylor River flow, as currently planned, is adequate to meet salinity performance measures and protect the bay’s ecosystem health. Model-predicted salinity indicated that rainfall caused the largest reduction (10–15 ppt) followed by Taylor River discharges, and none of the predicted salinity scenario means exceeded 38 ppt. The salinity restoration target was achieved more than 70% of the time, by doubling the Taylor River freshwater discharges, only for the existing bay conditions. To protect Florida Bay’s ecosystem health and counterbalance saltwater intrusion in the Everglades wetlands, caused by future sea-level rise, additional freshwater sources needs to be identified. Yet, the question becomes, do we have enough available freshwater sources to achieve the restoration target and protect the bay’s ecosystem health now and for future sea-level rise?

1. Introduction

Florida Bay is a semi-enclosed coastal water body bounded on the north and east by the southern mainland of the Florida peninsula, on the south by the Florida Keys, and opening into the Gulf of Mexico on the west (
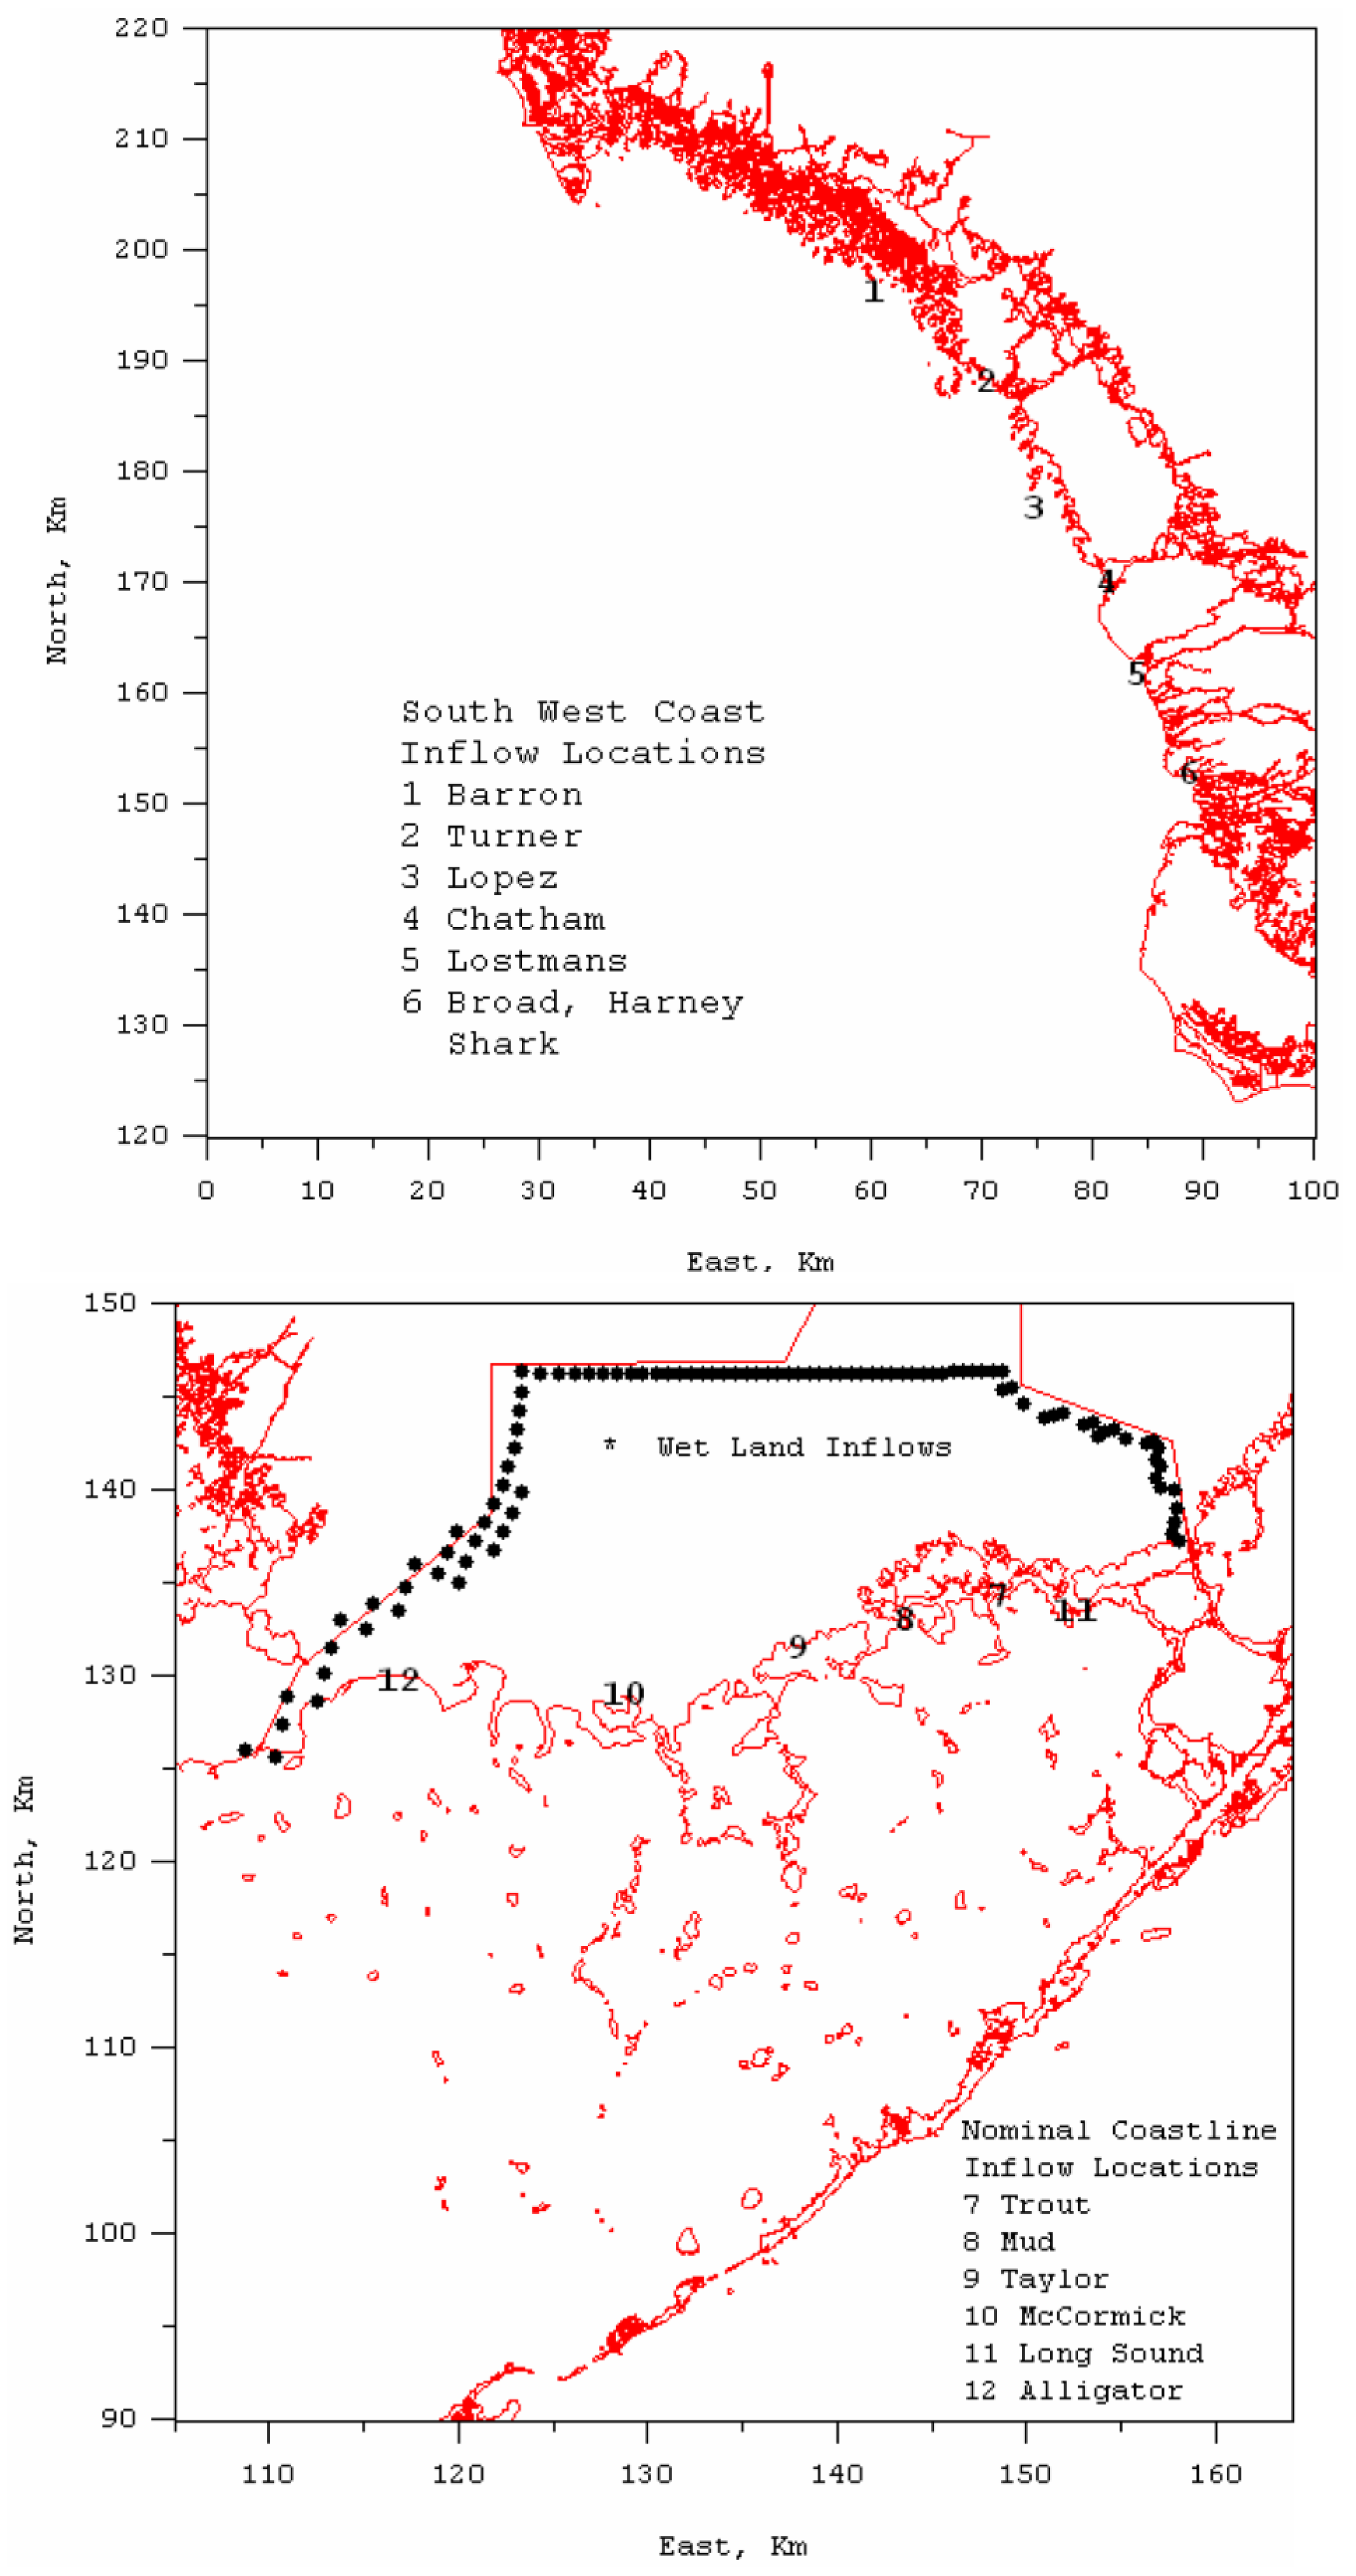
Figure 1). Along the eastern portion of the keys, limited exchange between Florida Bay and Florida Straits occurs through passages between the keys. Along the northern boundary, the open waters of the bay are separated from the Everglades by mangrove swamps with open water regions. The primary controlled discharge-sources of freshwater entering the bay include distinct creeks and rivers through the mangrove region and the uncontrolled and unpredictable direct rainfall. Inflow from the creeks and rivers can range seasonally from fresh to brackish depending upon the net freshwater flow southward from the Everglades, the extent of saltwater intrusion into the mangrove regions, and the low frequency sea-level change in the bay, driven primarily by the sea level to the west and south in the Gulf of Mexico and the Florida Straits. Other less quantified fresh and brackish water sources to the bay include distributed surface and groundwater flow along the northern boundary and to a lesser extent runoff from the keys. Low salinity water, derived from rivers discharging along the southwest Florida coast, may also enter the bay during periods of southeastward flow around Cape Sable. The interior region of Florida Bay is characterized by shallow open-water sub-basins separated by narrow shoals or ridges and extremely shallow regions, which may become exposed during periods of low sea level. During periods of low sea level, exchange between the subbasins is primarily through natural and artificial passes.
The shallow mudbanks in the northeast section of the bay limit water exchange with the Gulf of Mexico, which creates excessive salty conditions and leads to harmful algal blooms, with hypersalinity > 40 ppt. Those seagrass-covered shallow mudbanks divide the shallow bay into smaller basins where massive seagrass die-offs were observed, particularly during the major drought years in 1987 and 2015 [1]. The extreme high salinity observed in 2015 was the result of a 16-month period of localized rainfall deficit raising the Florida Bay salinity to be more than twice the ocean water [2]. Another study reported that the reduction of water deliveries to Florida Bay over the last 50 years has caused frequent periods of high salinity and, less frequently, hypersalinity. Hypersaline conditions [3] develop mostly during dry seasons in the north-central regions of Florida Bay [3]. These authors reported that hypersaline groundwater conditions in Florida Bay are caused by reduced freshwater inputs during the dry season combined with low water renewal rates.
The Florida Bay ecosystem is currently under extensive stress due to decades of increased nutrient loads along its northern boundary. Historically, combined rainfall and southern flow, from Lake Okeechobee, hydrate the entire Everglades ecosystem, including Florida Bay [4]. Current management of the system in South Florida changed how the Florida Bay is hydrated, in which direct rainfall over the entire bay, is the largest single source of freshwater into Florida Bay and accounts for more than 45% of the total freshwater input. Taylor River (TR), along the southeastern part of Everglades National Park (ENP), is the second most contributor of freshwater to the bay [5]. The controlled discharges of freshwater duration and timing delivered to TR are essential to prevent salinity levels from becoming too high and for the Everglades wetlands ecosystem.
As part of addressing periodic droughts in Florida Bay due to the lack of rainfall, treated water from Lake Okeechobee, from the district’s stormwater treatment areas (STAs), is directed southward into the Everglades. The additional clean water from the STA outflows is planned to reach the bay during both the dry and the wet seasons. Clean water supply of those additional discharges will be added through both the Shark River (SR) and Taylor River (TR). The new and added fresh/clean water to Florida Bay is particularly essential to meet the Comprehensive Everglades Restoration Plan (CERP) salinity performance for the bay (Figure 1).

2. Goals and Objectives

The goal of this study was to determine how freshwater inflow to Florida Bay impacts material distributions (e.g., salinity, nutrients, etc.). Most importantly, how much freshwater input (existing conditions and in response to future sea-level rise) is needed, if the desired salinity range within the bay can be controlled by the amount of freshwater available. To achieve this goal, first one must delineate what are the main contributors of freshwater to the bay, and second if those contributors can be controlled. For example, rainfall is a major freshwater contributor to Florida Bay. Yet, this freshwater source is not under our control. On the other hand, the amount of freshwater discharges reaching the bay from point sources such as TR and SR, is currently managed and controlled. Therefore, the amount of freshwater sources can be classified into two types, “human-controlled” freshwater contributors (i.e., Taylor River and Shark River), and human-uncontrolled freshwater input (i.e., rainfall, wetlands runoff, and groundwater).

3. Methods

3.1. Overview

Sea-level rise (SLR) is another major contributor to material distributions within Florida Bay. Seawater from the SR will penetrate deeper into coastal wetlands of the southern Everglades and all southern creeks. Increasing freshwater managed discharges through those creeks may counterbalance the impact of saltwater intrusion in the southern Everglades. With or without a limitless supply of available freshwater, a calibrated Florida Bay hydrodynamic model, can not only be used to mimic future conditions and determine how much freshwater is needed to counterbalance saltwater intrusion, but also determine if available future freshwater supply can indeed counterbalance SR.
SFWMD sponsored several modeling studies starting far back as early as the 1990s. The final selected and calibrated hydrodynamic and water quality modeling tools of Florida Bay were finally delivered and documented [6,7]. The calibrated environmental fluid dynamic code (EFDC) model already depicted accurate exchange between basins and also simulated the impact of freshwater contributors on salinity distributions under existing conditions (i.e., “current conditions base”) within Florida Bay [6,7,8]. Combining all available and observed freshwater, salinity, and future sea-level rise, will help in predicting future salinity conditions in Florida Bay. Model-predicted salinity from the calibrated EFDC model [7], is used as the base (i.e., “current conditions base”) for all the freshwater scenario analyses presented here. To achieve the intended goal of this study, we compared the original model results against model-predicted salinity, after doubling the Taylor River base run freshwater discharges, while holding all other input and boundary conditions the same as in the original model setup. Doubling freshwater input into TR was selected based on the SFWMD goals for Florida Bay. Second, we compared model-predicted salinity by doubling the Shark River base run freshwater discharges, while holding all other input and boundary conditions the same as in the original model setup. Third, we compared model-predicted salinity by doubling the rainfall (RF) amount of the base run, while holding all other input and boundary conditions the same as in the original model setup.

3.2. Florida Bay EFDC Model

The EFDC modeling system has been extensively applied to simulate numerous projects not only worldwide, but also in numerous South Florida studies, including St. Lucie Estuary [9], Lake Okeechobee [10], wetlands [11], and Florida Bay [12]. The Florida Bay EFDC model was calibrated and documented [6,7]. The primary conclusion of those studies was that the EFDC based Florida Bay hydrodynamic model using the medium resolution multi-level grid system (i.e., original grid) was calibrated over a seven-year period (1996–2002; [6,7]). The model grid with the northeast wetland consists of 4300 grid cells in the horizontal direction, with cell size varying from approximately 500 m in the eastern interior of the bay to approximately 8 km at the western open boundary in the Gulf of Mexico. Favorable results were presented in project report [6], and more recently in [7] indicating that the EFDC based Florida Bay model is at a level of calibration, based on statistical test results [7], appropriate for investigating freshwater impacts alternatives and for the calibration of the water quality model component.

3.3. Florida Bay Model Calibration Set Up

The EFDC Florida Bay hydrodynamic model has been well documented where the details of the calibration processes and results were recently described in great detail [6,7]. The authors illustrated how model predictions matched field observation and focused on the ability of the model to predict tidal and sub-tidal frequency, currents, salinity, and temperature. Various quantitative approaches including harmonic and time series analysis were also used to evaluate the calibration as well as commonly used methods of visual comparisons of model predictions with observational data. Two model grid configurations were also evaluated. The first configuration truncates the grid along the nominal coastline in northeast Florida Bay, while the second configuration includes a large wetland region along the northeast boundary of the bay which dynamically interacts with the open water regions [7].
Both configurations of the model are judged to perform well in simulating observed tidal frequency sea level and currents [7]. The configuration which includes the wetland region is better in predicting low-frequency sea-level variability in northeast Florida Bay, particularly during times of high variability associated with tropical storms. Temperature simulation, including evaporation prediction, using both model configurations is exceptionally good. Both model configurations perform well for salinity prediction, capturing season variability, and extreme inflow events associated with tropical storms. The nominal coastline configuration is superior in predicting salinity [7].

3.3.1. Fresh and Brackish Water Inflow

Fresh and brackish water inflow along the boundaries of the Florida Bay EFDC model domain is provided by the USGS TIME model [13] for all simulations reported in this manuscript. The TIME model provides an estimate of net freshwater inflow at 12-point locations (human-controlled sources) along the nominal coastline of Florida Bay and the southwest coast and actual flows and salinities at the TIME model cell faces and centers. Figure 2 shows the location of six net freshwater inflow locations along the southwest coast, the location of the six net freshwater inflows along the northeast boundary of Florida Bay, and 148 brackish inflow locations in the wetlands. Table 1 lists a summary of descriptive statistics of all freshwater inflow (human controlled) to Florida Bay for the calibration base run. For model simulations using the nominal coastline version of the grids, the 12-net freshwater inflows were used and assigned zero inflowing salinity. For the model simulations, which include the northeast wetland region, brackish inflow was assigned to the model cell containing the 148 inflow locations shown in Figure 2. These flows were assigned upwind salinities from the time simulation and brackish water inflow along the boundaries of Florida Bay EFDC model domain, was provided by the USGS TIME model [13] for all simulations presented in this manuscript. The TIME model provides an estimate of net freshwater inflow at 12-point locations along the nominal coastline of Florida Bay and the southwest coast (Figure 2) and the actual flows and salinities at the TIME model cell faces and centers. Figure 2 shows the location of six net freshwater inflow locations along the southwest coast, the location of the six net freshwater inflows along the northeast boundary of Florida Bay, and 148 brackish inflow locations in the wetlands. For model simulations using the nominal coastline version of the grids, the 12-net freshwater inflows were used and assigned zero inflowing salinity. For the model simulations, which include the northeast wetland region, brackish inflow was assigned to the model cell containing the 148 inflow locations shown in Figure 2. These flows were assigned upwind salinities from the time simulation. Flow quantities for all 12 inflow points used for model base calibration are depicted in Figure 3.

3.3.2. Wind and Atmospheric

Wind forcing was provided by wind records at five C-Man or National Data Buoy Center overwater stations [7]. Wind speed and direction in each model cell were deter-mined as an inverse squares distance-weighted average of the five stations. Atmospheric data included air temperature, relative humidity, rainfall, solar radiation, and cloud cover. Air temperature, relative humidity, and cloud cover were based on the National Weather Service (NWS) data at Key West, Naples, Marathon, and Miami. Solar radiation was estimated from theoretical clean sky values and cloud cover, adjusted by comparison with the actual solar radiation data from a South Florida Water Management District (SFWMD) station. Rainfall data at the NWS stations were supplemented by ENP rainfall data. The final atmospheric datasets were spatially located at the four NWS stations, and values in each model cell were determined as an inverse squares distance-weighted average of the four stations [7].

3.3.3. EFDC Model Calibration Results (Current Conditions Base)

Hydrodynamic model calibration involved the adjustment of open boundary forcing, bottom roughness, and bottom elevations to obtain the general best agreement between model predictions and observations of water surface elevations and horizontal currents [8]. All hydrodynamic model calibration set ups and results, at 15 stations (Figure 4), are presented in detail [7] and are not repeated here, while the impact of freshwater on the model-predicted salinity, for all scenarios presented here, are from the original model grid.

4. Model Scenarios Results

The EFDC model scenario analysis started with the freshwater discharges (a total of 12-point source discharges) used in the original calibrated EFDC Florida Bay model [7,8]. Salinity descriptive statistical results are used to compare model-predicted salinity from all runs, including, the EFDC model calibration period (1 January 1996 through 1 January 2002), as the current conditions base run, the increased (2Q) freshwater inflow, and the increased rainfall (2R) amount to Florida Bay during the same period. All model scenario results are presented at the same 15 stations in Figure 5.

4.1. Northeast Corner Model Results

Results of all EFDC model scenarios are presented in this section in various formats to illustrate and delineate the cause and effect in terms of salinity mean values, and most importantly in terms of time; how long a specific salinity value persists over time. Figure 5 illustrates how salinity results are impacted by increasing the human-controlled freshwater inflow from TR and the human-uncontrolled (RF) into Florida Bay. All calculated salinity statistics are based on hourly values over the calibration period from 1996 through 2002 at each location.
It is clear that the uncontrolled contributor (i.e., rainfall) over the bay is the dominant factor in the northeastern corner of the bay for all stations located in this section and the decreased salinity values within the bay (Figure 5). It is also clear that increasing the freshwater of controlled discharges through TR, not only reduces salinity values in Florida Bay, but also moves the salt wedge away from the inflow locations, a typical estuarine circulation pattern. The most pronounced salinity decrease is observed at Trout Cove, Taylor Creek, and Mud Creek. The Trout Cove station receives the largest freshwater inflow at this location (Figure 5).
Box and Whisker data summary also demonstrated consistently that model predictions captured the general trend in the bay, over the seven-year calibration period, compared to observed salinity data (Figure 6). The purpose here is not to compare model-predicted salinity to field observations, which is presented accurately in detail in [7]. The goal of this analysis is to illustrate, in relative terms, “what if” scenarios, and how salinity structure in Florida Bay would respond to an increase in freshwater inflow. All scenario results indicated that salinity structure in the bay in the northeastern corner would benefit greatly from the increase in TR freshwater inflow. Model-predicted scenario results also showed that salinity values at all 14 stations are more likely to remain within the 5–35 ppt range; a CERP goal for the salinity performance measure to protect and maintain a healthy Florida Bay ecosystem.

4.2. Northwest Corner Model Results

Although the focus of this analysis is the northeastern corner of Florida Bay, the model scenarios-predicted-salinity in SR are also included (Figure 7). In all model scenarios, regardless of the northeastern vs. southwestern corner, rainfall remains the dominant freshwater input into Florida Bay and the deciding factor of salinity structure in this region as well. Yet, rainfall is unpredictable and not under human control.

5. Discussion

The major objectives of the Comprehensive Everglades Restoration Plan (CERP) for Florida Bay are to reverse ecosystem decline and re-establish a healthy stable ecosystem. The Florida Bay ecosystem has been deteriorating due to upland human activities intensified by the lack of both quantity and quality of the freshwater reaching the bay. Freshwater reaching Florida Bay over the past few decades was delivered totally through a highly managed complex system and increased nutrient loading. Unlike the currently existing conditions, Florida Bay historically received most of its water from Lake Okeechobee through the Everglades National Park and through rainfall [4].
Two essential parts were planned to help restore and protect the Florida Bay ecosystem. Part one was to plan and construct projects to increase the amount of managed and controlled freshwater inflow reaching the bay. Part two would be to develop a management tool to simulate and assist decision makers to evaluate options and alternatives to protect the bay’s ecosystem (i.e., water quality model) and plan appropriately for the foreseeable SLR (i.e., hydrodynamic model).
For Part one, SFWMD approved several major projects to clean water runoff from farms and residential areas (stormwater treatment areas, STAs) and store that clean water (flow equalization basins, FEBs) for use during the dry season and drought conditions as well as send more clean water to Florida Bay, both through TR and SR (human controlled and managed discharges). The major project to provide more to TR (planned twice the original inflow quantity) was completed in 2023. The CERP original intent of increasing freshwater inflow, particularly for the northeast corner, was to protect and maintain the health of the Florida Bay ecosystem. CERP also identified salinity performance levels (i.e., salinity between 5 and 35 ppt) to protect and maintain the health of the Florida Bay ecosystem. All the aforementioned CERP plans of increasing quantity and quality of water reaching the bay and meeting the proposed performance measure for the Florida Bay, not only require a tool to investigate, evaluate, assess, and optimize the management of the system, but also to explore how to prevent frequent hypersalinity conditions and counterbalance saltwater intrusion into the Bay.
Part two of the SFWMD Florida Bay long term plans was to develop a management tool to assess alternatives and options of the bay restoration plan. Since the early 1990s the SFWMD and the Army Corps of Engineers focused on developing a hydrodynamic and water quality model for this purpose [14]. The need for such a model is critical, as models are commonly used to delineate and identify cause and effect. In particular a coupled hydrodynamic and water quality modeling system is needed to meet the goal of restoring, protecting, and maintaining Florida Bay ecosystem heath. Model needed data collection was also initiated to ensure those models not only represent the Florida Bay ecosystem, but are also calibrated, verified, and scientifically defendable. However, early Florida Bay model development failed to demonstrate the long-term predictive ability, due to lack of data and resources [14], while the water quality model development was also limited in predicting conditions within the bay, due to the lack of a calibrated hydrodynamic model to provide transport [15].
The Water Resources Development Act of 2000 approved CERP as the roadway and guide to restore, protect, and preserve the water resources of central and southern Florida, as well as for flood protection. CERP has been described as the world’s largest ecosystem restoration effort focusing on restoring the south Florida ecosystem Everglades, including Florida Bay. The CERP main goal is to capture and redirect freshwater, which currently flows to the ocean and the gulf to areas that need it most. Most of the redirected water will be dedicated to environmental restoration projects. Yet, the CERP approved plan in 2000 failed to include impacts of future SLR on critical restoration areas, including salinity distribution within Florida Bay. Currently, SFWMD is working on addressing future SLR impacts on other critical areas [5].
As part of the Florida Bay long term plans, SFWMD sponsored and funded the development and the calibration of the Florida Bay EFDC hydrodynamic model, over a ten-year period [12]. For the analysis presented here, we used the calibrated EFDC model to run several scenarios to assess the impacts of increasing freshwater inflows (human-controlled contributor) and rainfall (human-uncontrolled contributor) into the bay. The goal of this study was to determine the major freshwater contributors to the bay, how freshwater inflow to Florida Bay impacts material distributions (particularly salinity), and assess the impacts of freshwater inflow through managed and controlled point sources (e.g., TR and SR) as well as uncontrolled and unmanaged sources (e.g., rainfall, evaporation, and groundwater) on salinity distributions within the bay.
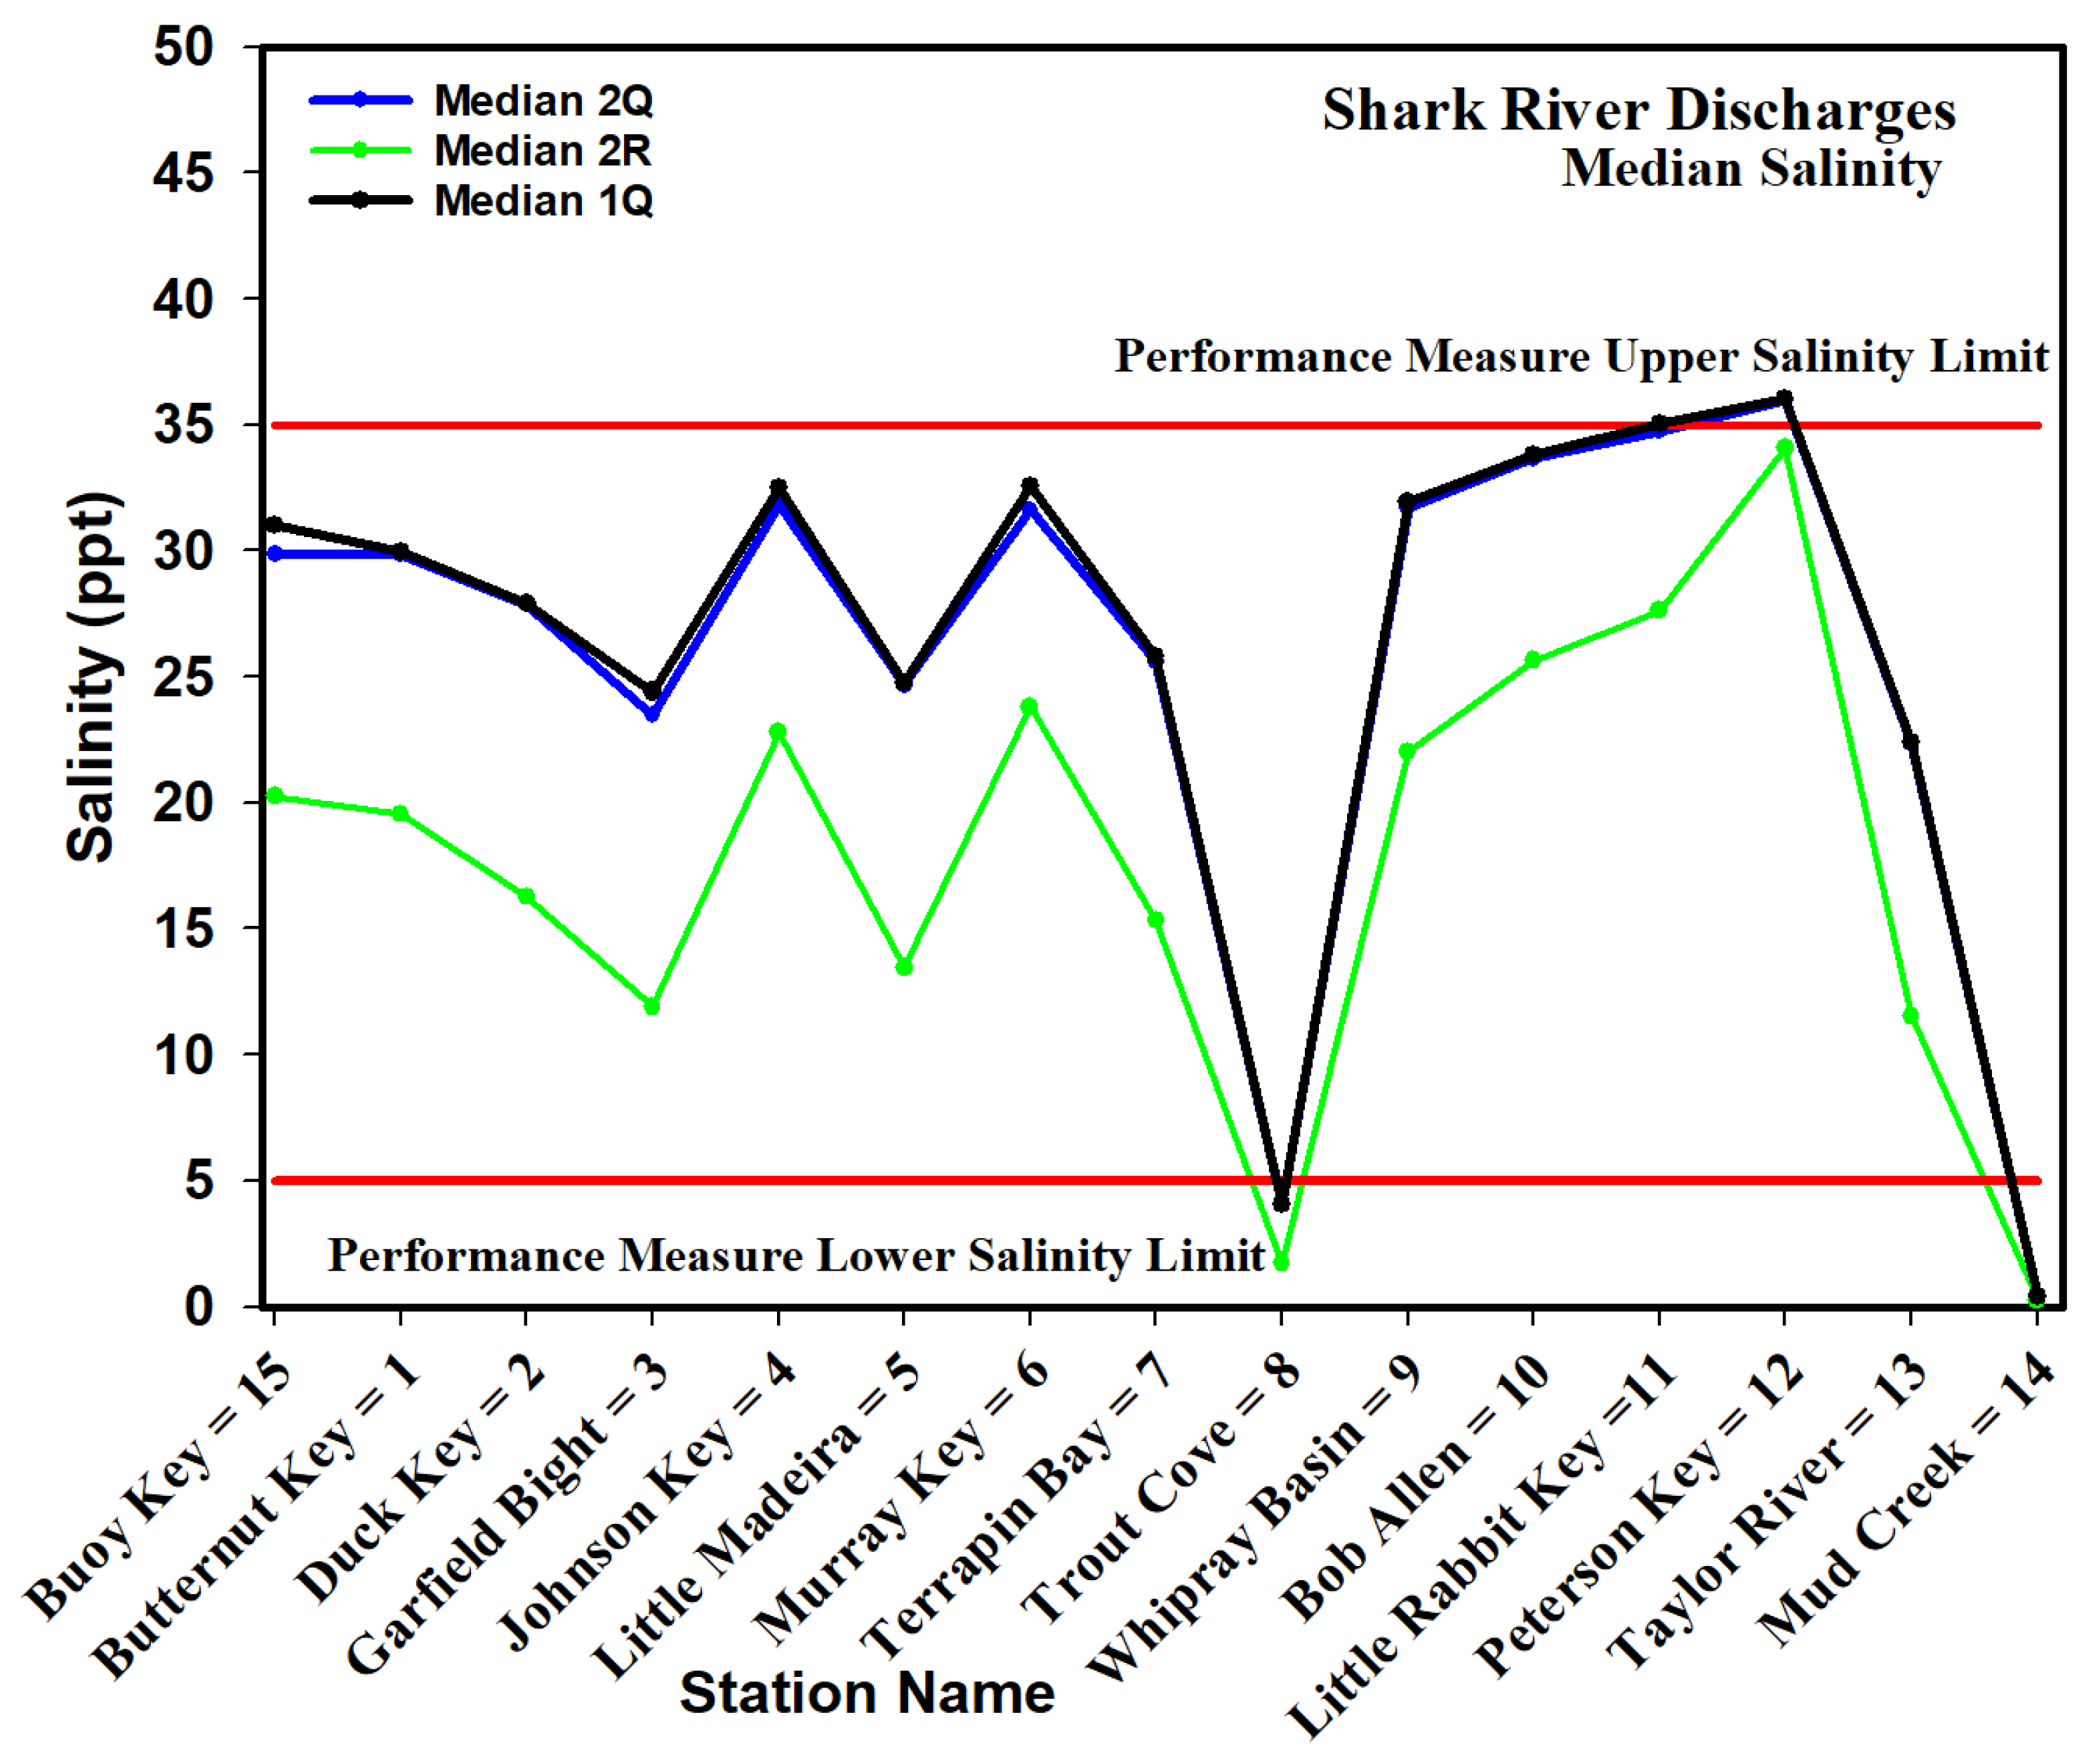
Salinity has been identified as a restoration performance-measures target for Florida Bay, with guidelines established to (1) reduce the number of hypersaline events each year, (2) increase the frequency and spatial extent of lower salinity conditions in the bay, and (3) provide more stable conditions by avoiding rapid salinity decreases in the northeastern region of the bay [5]. Our results showed that increasing freshwater inflow through TR, as originally planned, will benefit the bay ecosystem (Figure 6). The increased observed benefits to the bay, in terms of salinity structure in the northeastern region, increased as the quantity of the flow discharges through TR increased (Figure 6). Salinity performance measures, as proposed by CERP (redlines in Figure 6), within the northeastern corner of the bay, were also met with increased discharge quantities. Yet, as far as the major contributors to salinity structure go in Florida Bay, and clearly meeting the intended salinity performance, it was the rainfall quantity not TR. However, the impact of doubling the inflow to TR still met the salinity performance measure as proposed (5–35 ppt). Rainfall quantity (human-uncontrolled) was the major contributor followed by TR (human-controlled).
Previous study [16] used monthly data from 1965 through 1995 to conduct a water budget study from field observation of Florida Bay. Similar to our results, doubling the rainfall quantity produced lower salinity in the eastern bay, increased salinity variability in the south bay areas, and had a trivial effect on the western bay salinity. Our results are more concise regarding salinity distribution over a seven-year model application using field observation and delineating the major contributors, specifying individually the impacts from both TR, SR, and rainfall in the northeastern region of the bay.
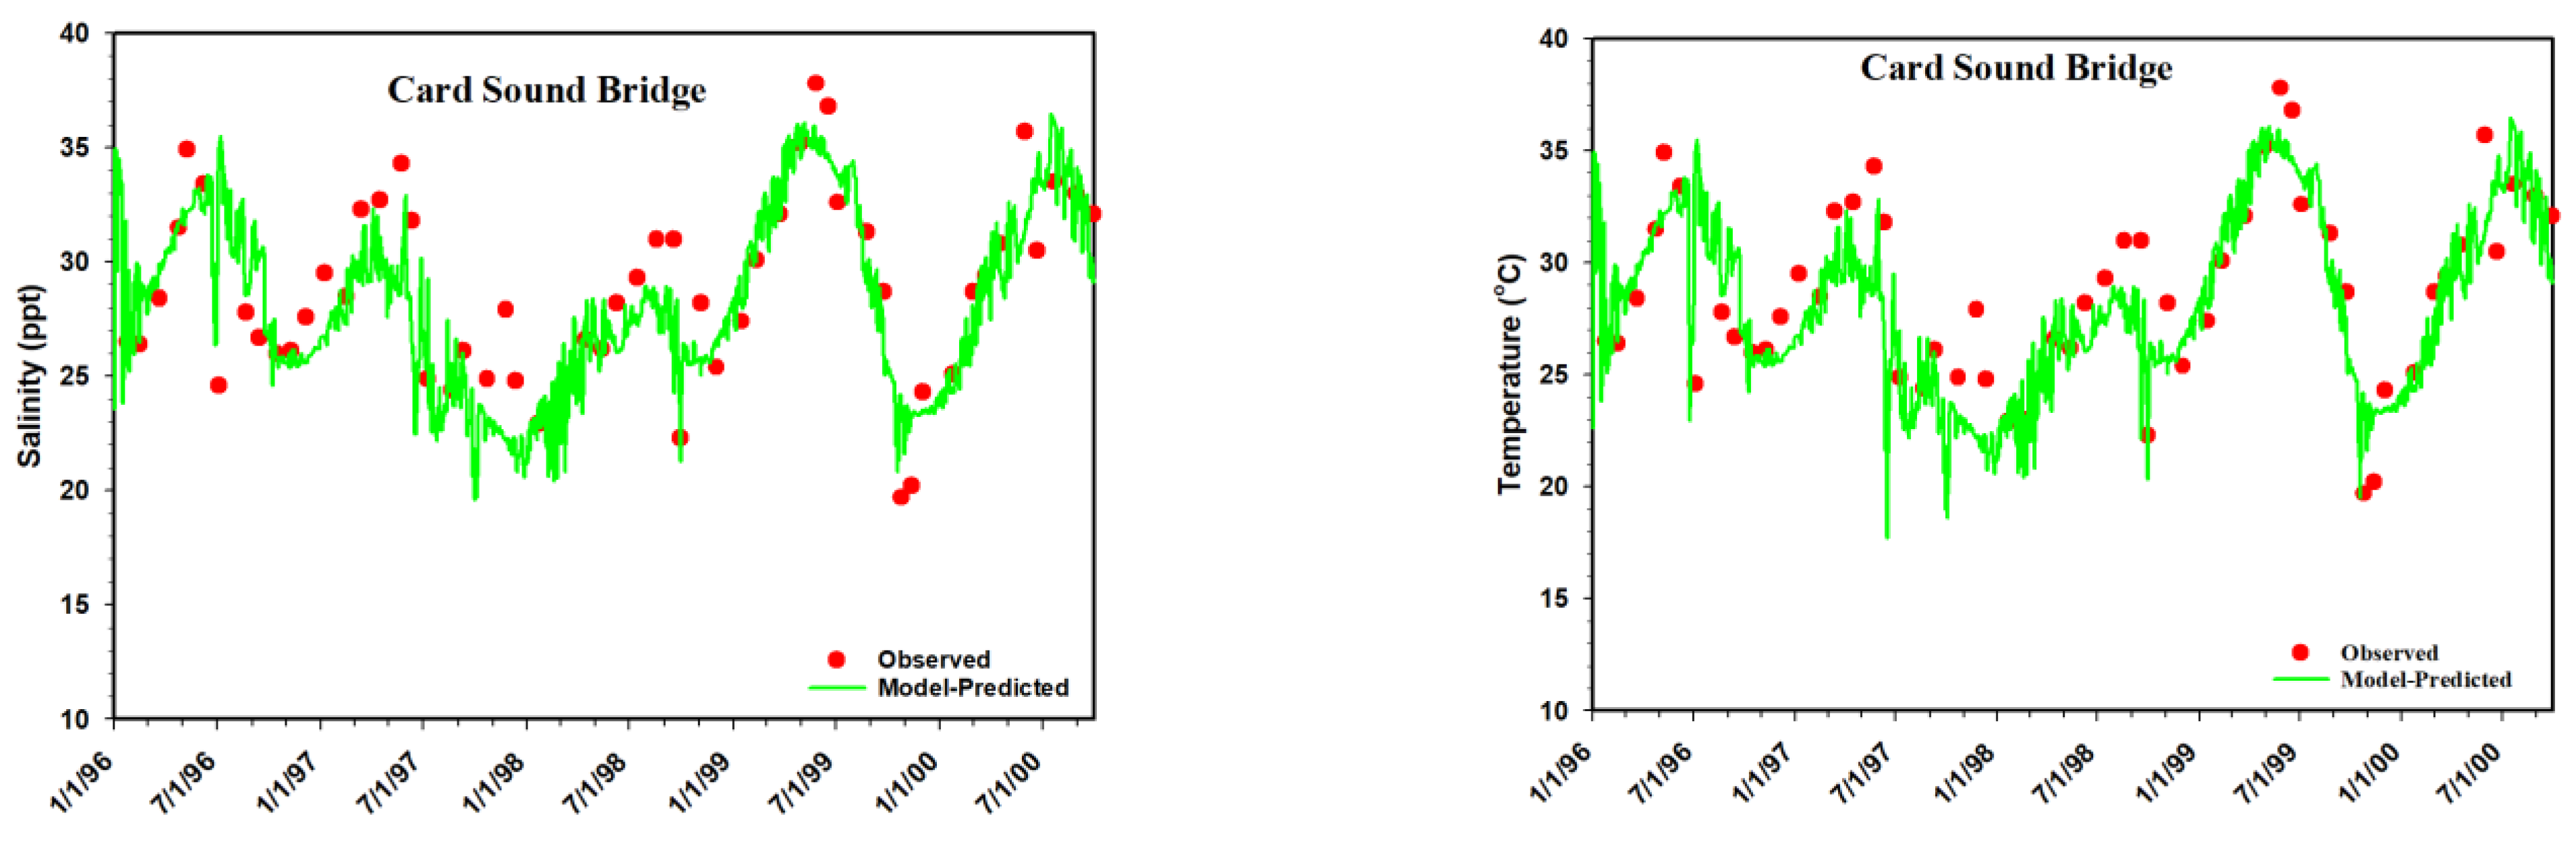
Further improvements and additional data collections, particularly around mud banks (e.g., water depth), would increase the EFDC hydrodynamic model accuracy with regard to water exchange between open water and subbasins/mud banks. The calibrated EFDC Florida Bay hydrodynamic model is capable of simulating water temperature and all other water budget components such as, exchange fluxes with the coastal ocean, fluxes of freshwater, rainfall, evaporation, all of which vary in time and space (Figure 8). USGS runoff and freshwater discharges from the main rivers and creeks were combined with field observations of rainfall, windspeed and direction, air and water temperature (to calculate evaporation), to predict water temperature and salinity in the bay (Figure 8). For the EFDC model to simulate future water-budget scearios, it is essential to include future plans on how to deliver freshwater discharges from managed upstream structures to the Taylor and Shark rivers. Future freshwater supply delivery plans, to those two sources, may be sent either seasonally or as a constant year-around flow as prescribed by the water volume stored and managed in upstream reservoirs. By including a complete water budget, based on planned discharges, supply, and historical or newly acquired salinity observations, and combined with forthcoming SLR, a management tool would be provided for decision makers to predict future salinity conditions of the bay.
It is important to note that to restore and protect the Florida Bay ecosystem health, it is essential to maintain the CERP targeted salinity performance measure for an extended period of time; not just to meet the salinity value at a single location, but to make it persist for a longer time over the entire bay. The current/existing freshwater inflow simulated (i.e., 1Q) by the EFDC Florida Bay calibrated model provides acceptable results that targeted salinity performance in the bay yet is only maintained for 45% of the time (Figure 9). Future plans of increasing freshwater inflow to twice the discharge (i.e., 2Q) used in the calibration run, increased the targeted salinity performance-measure envelope from 45% to 70% of the time. A greater increase of other inflow scenarios (twice 2Q or twice the rain) increased the duration and maintained the targeted salinity values by 70% and 85%, respectively (Figure 9). The current SFWMD plan is to double TR (i.e., 2Q), which provided satisfactory results to maintain the salinity performance envelope for more than 70% of the time (Figure 9).
An additional supply of clean water will be added to both SR and TR. The new and added fresh/clean water to Florida Bay, if available, is particularly essential in the coming decades to offset saline invasions with increasing SLR. Freshwater groundwater discharges may not contribute, or have a greater impact, compared to surface freshwater inflow, on Florida Bay salinity [17,18,19]. Yet, one may conclude that there must exist a surface-ground water exchange that may have an impact on salinity structure in the bay. A recent groundwater SUTRA, (model for saturated–unsaturated, variable-density groundwater flow with solute) modeling study in TS, with a 2-D profile and variable mesh size, with a grid-size length 37 km, depth 60 m, and varying width from 2 km to 13 km for a 17-year simulation period [20,21,22], provided more detail regarding surface-groundwater interactions. The purpose of those studies was to simulate shallow groundwater flow patterns and assess the dynamics of recent seawater intrusion. The authors concluded that slight changes in topography (in the order of centimeters) such as the Park Road, can cause differences in groundwater discharge and recharge along TS. Also, seawater intruded 250 m inland at 20 m depth in the aquifer from 2000–2013. The groundwater horizontal speed was estimated to be 250 m/14 year (or an average of 17.8 m/year) and the vertical speed was (20 m/14 year (or an average of 1.4 m/year). The major conclusion from this study is that surface freshwater impacts on groundwater salinity are felt in the top 15 m, and there is a two-month lag of salinity changes in Florida Bay observed, from the surface freshwater inflow from both TR and SR.
Results from their study suggest that freshwater inflow quantity and timing are critical for controlling and determining the Florida Bay salinity structure. Yet, most importantly is the fact that the freshwater inflow from TR pushed saltwater back towards the bay and away from the wetland inland areas, not only in the surface water, but also in the top 15 m in ground waters. The EFDC calibrated model results, along with the scenario simulated here, clearly show that increasing inflow surface-water discharges in TR, results in lower salinity in the northeastern section of the bay. Consequently, the freshwater inflow through TR will also pushback saltwater intrusion in the top 15 m in ground water towards the bay and decreases salinity near the mouth.
Future SLR is another major concern worldwide particularly for low lying coastal areas [23]. In the study referenced, they included varying tidal amplitudes and freshwater discharge from the Guadiana River, while bathymetries of the estuary were incorporated in the model to fully evaluate the impacts of sea-level rise on salinity distribution and flooding areas of the estuary. Unlike their approach, we focused primarily on freshwater inflow as planned and executed through several CERP projects [5], mainly due to the complexity and highly managed systems of canals, wetlands, pumps, and reservoirs, upstream of the Everglades National Park. Furthermore, hydrodynamic and other model-types have demonstrated the need for applying such tools to predict future impacts from SLR on wetlands along the west coast of the USA [24]. In the study referenced, they used a different modeling approach using Bayesian network (BN) to predict changes in resilience of tidal saline wetlands as probabilities, which can be useful in risk analysis [24].
The Florida Bay estuary is unique and different from other studies dealing with SLR. Due to the large horizontal spatial expanse, combined with the shallow water depth, both lead to two influencing mechanisms (rainfall and evaporation) for the salinity structure in the bay, as demonstrated with the 2R model scenario application (Figure 5 and Figure 6). Runoff from the Everglades is mainly represented by the major creeks depicted in 
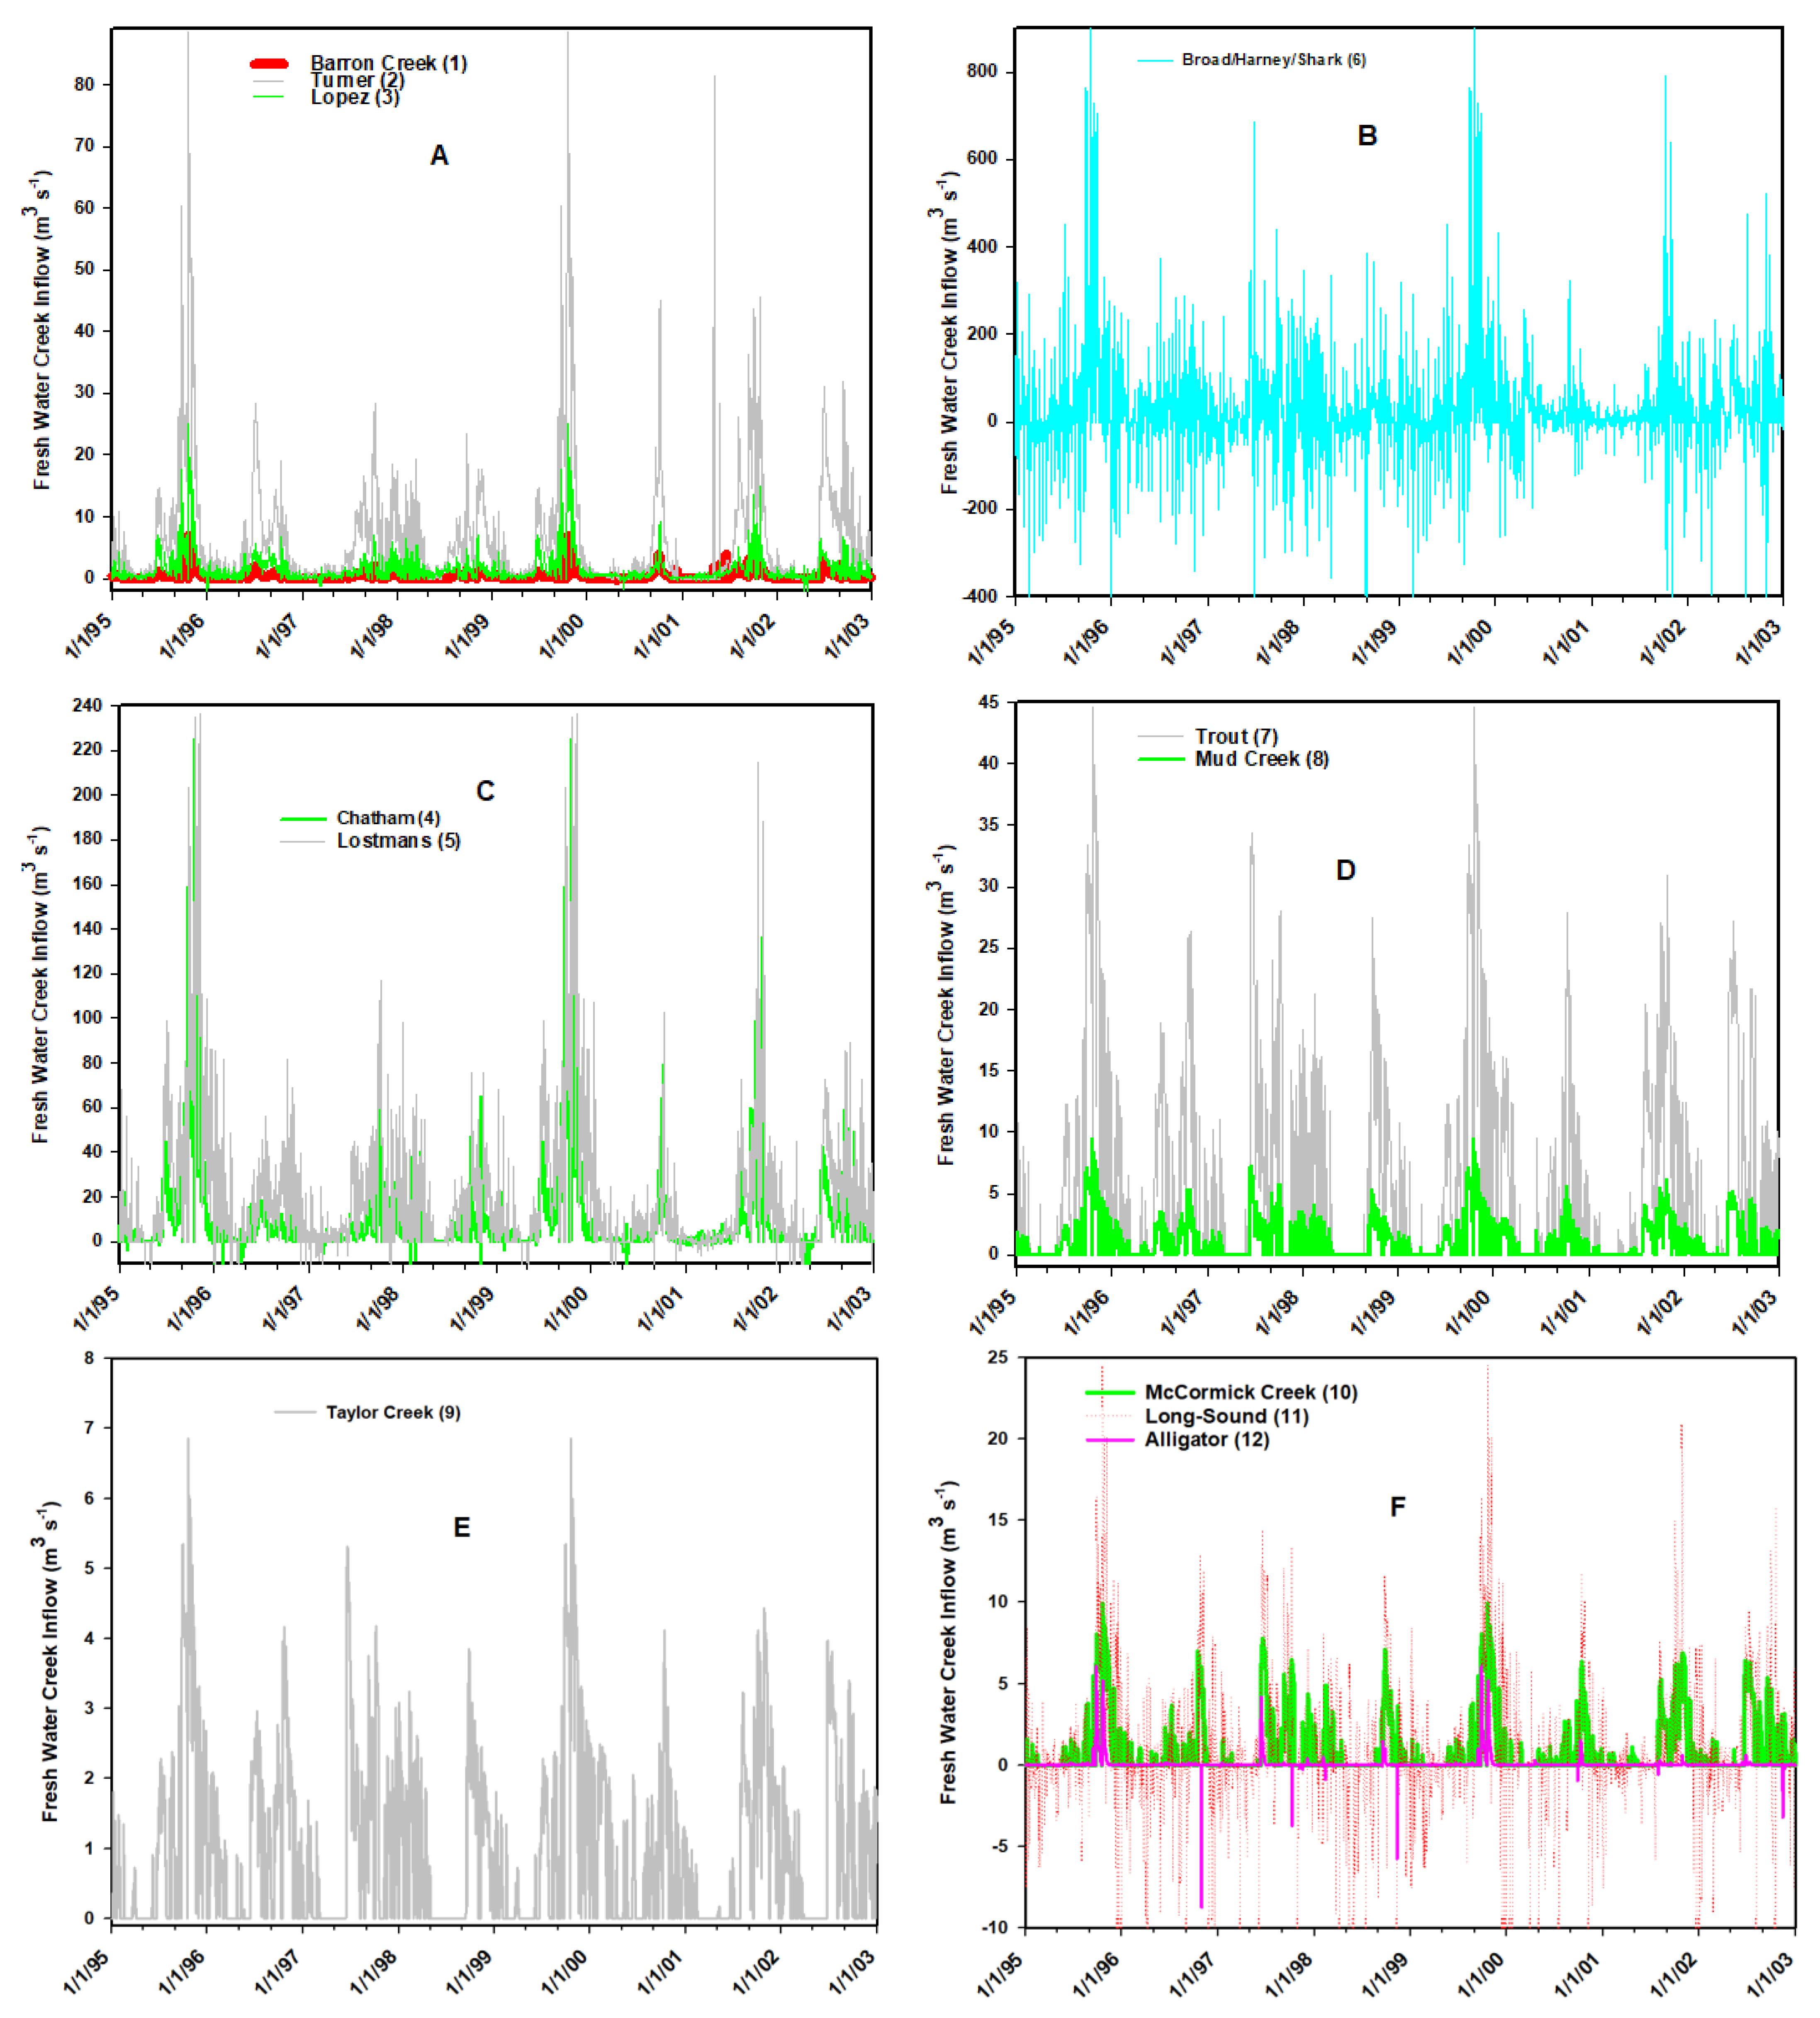
Figure 2. The TIME, USGS ground water model, linked to the EFDC hydrodynamic model made it possible to capture surface and ground water runoff from the Everglades National Park. Unlike other estuaries, the Florida Bay point sources from these creeks and rivers are managed and heavily controlled, along with the complex set of canals and reservoirs, upstream; they pose a major test. All of those unique facts represent a challenge in predicting the full impacts of SLR on the Florida Bay ecosystem and an opportunity for possible future research.
Accelerating sea-level rise (SLR), shifting precipitation patterns, and frequency and intensity of storms will affect coastal ecosystems, including salt marshes. Similar to these studies referenced [23,24], SLR is a major future contributor to material distributions (i.e., salinity and nutrients) within Florida Bay. For example, “shallow mud-banks” near the coastline, where bathymetry is not well defined, will be covered at a minimum with 90 cm of rising saltwater by the end of this century [1]. The newly created water depth at the mud banks is likely to allow more water exchange and lead to lower values of high salinity, assuming the same weather conditions prevail, which will be beneficial to the Florida Bay ecosystem [1]. Yet, saltwater intrusion will penetrate deeper into coastal wetlands and all southern creeks. The planned current increase of freshwater discharges through TR and SR may counterbalance or minimize the impact of saltwater intrusion in the southern Everglades wetlands for the current/existing conditions. However, how much water is needed to counterbalance future SLR and how much water is physically available to meet the CERP performance measure, is another matter, and requires further modeling scenarios, not only in Florida Bay, but also upstream of the Everglades National Park.

6. Summary and Conclusions

The goal of this study was to determine how much current freshwater inflow to Florida Bay impacts salinity distributions, to identify and rank the major freshwater contributors to their distributions within the bay, and how the CERP planned increase in freshwater, through TR and SR, would control hyper salinity in the northeastern part of the bay. Our results clearly indicated that rainfall has the most impact on salinity structure in the bay regardless of location (northeast vs. northwest), followed by the Taylor River. The rainfall impacts on salinity distribution were in excess of 10–15 ppt. None of the salinity means in all those runs exceeded 38 ppt. Most salinity changes ranged between 43 to 5 ppt and most salinity impacts were due to rainfall, followed by the Taylor River. However, no measurable impacts were observed due to an increase in freshwater inflow through Shark River Slough; rainfall remains the dominant contributor to salinity structure in the bay.
Currently, our results indicate that salinity performance measures in the bay can be controlled and achieved by doubling the flow in the Taylor Slough, as targeted by CERP. The increase of freshwater inflow will also ensure that salinity performance measure can be met for more than 70% of the time and minimize the impacts on ecosystem health. Yet, future sea-level rise will require additional action to protect and maintain the Florida Bay ecosystem health and counterbalance saltwater intrusion in the Everglades wetlands. In addition, hypersalinity events in Florida Bay (defined as >40 ppt) are considered detrimental for the bay’s ecosystem. Frequent re-occurrence of hyper salinity conditions, whether drought or lack of freshwater inflow, in the bay would lead to a drastic change in the ecosystem and a possible shift from species of estuarine conditions to more hypersaline tolerant species. Additional freshwater input, particularly through the Taylor River, is required to offset future SLR impacts on salinity and protect Florida Bay ecosystem health. However, the additional water needed to counterbalance SLR and how much water is physically available are yet to be determined and it may not be practically possible to combat hypersalinity/saltwater intrusion with increasing freshwater flow from CERP projects alone. The hydrodynamic model, presented here, can be used for determining future SLR impacts on salt intrusion and how to manage “controlled” freshwater discharges (quantity and timing) to counterbalance changes in the Florida Bay ecosystem.

Author Contributions

Conceptualization, M.Z.M., Z.-G.J. and J.H.; formal analysis, writing and review, M.Z.M., Z.-G.J. and J.H. J.H. was deceased before the manuscript was finished. All authors have read and agreed to the published version of the manuscript.

Funding

This research received funding from the South Florida Water Management District, West Palm Beach, Florida, USA.

Data Availability Statement

The original contributions presented in the study are included in the article, further inquiries can be directed to the corresponding author.

Acknowledgments

The authors would like to thank anonymous reviewers for providing helpful comments, which led to manuscript improvement. This manuscript is dedicated to John Hamrick, the original developer of the Environmental Fluid Dynamic Model. Both of us (M.Z.M. and Z.-G.J.) collaborated very closely with John Hamrick for an extended period of time, till he passed away. Hamrick was a great and dedicated professional throughout his professional career.

Conflicts of Interest

John Hamrick (Deceased) was employed by the company Tetra Tech, Inc., Fairfax, VA, 22030, USA. The remaining authors declare that the research was conducted in the absence of any commercial or financial relationships that could be construed as a potential conflict of interest.

References

  1. NASEM, National Academies of Sciences, Engineering, and Medicine. Progress toward Restoring the Everglades: The Eighth Biennial Review—2020; The National Academies Press: Washington, DC, USA, 2021. [Google Scholar] [CrossRef]
  2. SFWMD. 2016. Available online: https://www.sfwmd.gov/sites/default/files/documents/jtf_florida_bay_plan.pdf (accessed on 15 November 2023).
  3. Lee, T.N.; Johns, E.; Melo, N.; Smith, R.; Ortner, P.; Smith, D. On Florida Bay hypersalinity and water exchange. Bull. Mar. Sci. 2006, 79, 301–327. [Google Scholar]
  4. Rudnick, D.T.; Chen, Z.; Childers, D.L.; Boyer, J.N.; Fontaine, T.D., III. Phosphorus and nitrogen inputs to Florida Bay: The importance of the Everglades watershed. Estuaries 1999, 22, 398–416. [Google Scholar] [CrossRef]
  5. Salinity and Hydrology of Florida Bay STATUS AND TRENDS REPORT SFNRC Technical Series 2012:1 Status and Trends 1990–2009. SFNRC Technical Series 2012:1. National Park Service U.S. Department of the Interior South Florida Natural Resources Center Everglades National Park Homestead, Florida USA. Available online: https://www.evergladesrestoration.gov/comprehensive-everglades-restoration-plan (accessed on 10 December 2023).
  6. Tetra Tech, Inc. Development of a Florida Bay and Florida Keys Hydrodynamic and Water Quality Model: Hydrodynamic Model Calibration; A Report Submitted to South Florida Water Management District; Tetra Tech, Inc.: Fairfax, VA, USA, 2005; 128p. [Google Scholar]
  7. Ji, Z.-G.; Moustafa, M.; Hamrick, J. Hydrodynamic Modeling of a Large, Shallow Estuary. J. Mari. Sci. Eng. 2024, 12, 381. [Google Scholar] [CrossRef]
  8. Tetra Tech, Inc. Development of a Florida Bay and Florida Keys Hydrodynamic and Water quality Model: Grid Resolution Analysis. In A Report to South Florida Water Management District; Tetra Tech, Inc.: Fairfax, VA, USA, 2004; 137p. [Google Scholar]
  9. Ji, Z.G.; Hu, G.; Shen, J.; Wan, Y. Three-dimensional modeling of hydrodynamic processes in the St. Lucie Estuary. 652 Estuar. Coast. Shelf Sci. 2007, 73, 188–200. [Google Scholar] [CrossRef]
  10. Ji, Z.-G. Hydrodynamics and Water Quality: Modeling Rivers, Lakes, and Estuaries, 2nd ed.; John Wiley & Sons, Inc.: Hoboken, NJ, USA, 2017. [Google Scholar]
  11. Moustafa, M.Z. Calibration of the Wetland Hydrodynamic Model to the Everglades Nutrient Removal Project. Water Qual. Ecosyst. Model. 2000, 1, 141–167. [Google Scholar] [CrossRef]
  12. Hamrick, J.; Ji, J. Coupled Hydrodynamic and Water Quality Modeling of Florida Bay. Presentation made at the Florida Bay Science Conference. 2008. Available online: https://www.yumpu.com/en/document/read/10261171/coupled-hydrodynamic-and-water-quality-modeling-of-florida-bay (accessed on 4 February 2024).
  13. Langevin, C.D.; Swain, E.D.; Wang, J.D.; Wolfert, M.A.; Schaffranek, R.W.; Riscassi, A.L.; Bay, F. Development of 665 coastal flow and transport models in support of Everglades restoration. US Geol. Surv. Fact Sheet 2004, 3130, 3–6. [Google Scholar]
  14. McAdory, R.T.; Kim, K.W. Field and Model Studies in Support of the Evaluation of Impacts of the C-111 Canal on Regional Water Resources, South Florida, Part IV: Florida Bay Hydrodynamic Modeling; US Army Corps of Engineers, Waterways Experiment Station: Vicksburg, MS, USA, 1998.
  15. Cerco, C.F.; Bunch, B.W.; Teeter, A.M.; Dortch, M.S. Water Quality Model of Florida Bay (Tech. Rep. ERDC/EL TR-00-10); U.S. Army Corps of Engineers: Vicksburg, MI, USA, 2000.
  16. Nuttle, W.K.; Fourqurean, J.W.; Cosby, B.J.; Zieman, J.C.; Robblee, M.B. Influence of net freshwater supply on the salinity in Florida Bay. Water Resour. Res. 2000, 36, 1805–1822. [Google Scholar] [CrossRef]
  17. Corbett, D.R.; Chanton, J.; Burnett, W.; Dillon, K.; Rutkowski, C.; Fourqurean, J.W. Patterns of groundwater discharge into Florida Bay. Limnol. Oceanogr. 1999, 44, 1045–1055. [Google Scholar] [CrossRef]
  18. Fitterman, D.V.; Deszcz-Pan, M.; Stoddard, C.E. Results of Time-Domain Electromagnetic Soundings in Everglades National Park, Florida, Everglades City, Florida, USA; Open-File Report 99–426; U.S. Geological Survey: Reston, VA, USA, 1999; 152p.
  19. Swart, P.K.; Price, R. Origin of salinity variations in Florida Bay. Limnol. Oceanogr. 2002, 44, 1234–1241. [Google Scholar] [CrossRef]
  20. Dessu, S.B.; Price, R.M. Taylor Slough Ground Discharge Simulation Using SUTRA. In Proceedings of the Greater Everglades Restoration (GEER) Annual Meeting, Coral Spring, FL, USA, 17–22 April 2017. [Google Scholar]
  21. Dessu, S.B.; Price, R.M.; Troxler, T.G. Effects of sea-level rise and freshwater management on long-term water levels and water quality in the Florida Coastal Everglades. J. Environ. Manag. 2018, 211, 164–176. [Google Scholar] [CrossRef] [PubMed]
  22. Dessu, S.B.; Price, R.M. Effects of topography and peat/marl layers on groundwater discharge and saltwater intrusion in Taylor Slough, The Florida Coastal Everglades Indianapolis. In Proceedings of the Geological Society of America, Annual Meeting, Indianapolis, IN, USA, 4–7 November 2018. [Google Scholar]
  23. Mills, L.; Janeiro, J.; Neves, A.A.S.; Martins, F. The impact of Sea level rise in the guadiana estuary. J. Comput. Sci. 2020, 44, 101169. [Google Scholar] [CrossRef]
  24. Marcot, B.G.; Thorne, K.M.; Carr, J.A.; Guntenspergen, G.R. Foundations of modeling resilience of tidal saline to sea-level rise along the U.S. Pacific Coast, 2023. Landsc. Ecol. 2023, 38, 3061–3080. [Google Scholar] [CrossRef]
Figure 1. Map of Florida Bay depicting major sub-divisions, bathymetry (NAVD88 vertical datum), and mud banks (Panel (A)). Panel (B) depicts the locations of two major freshwater contributors (Taylor and Shark River) to salinity distribution in eastern and western part of the bay, respectively.
Environments 11 00072 g001
Figure 2. All discharge inflows used in EFDC model calibration, and all scenario runs. (Top Panel): Location of TIME Model estimates of net fresh water inflow along the southwest coast (points 1 through 6). (Bottom Panel): Locations of TIME Model estimates of net freshwater inflow along the northeast shoreline of Florida Bay (points 7 through 12), and locations of brackish inflows to the northeast wetland region.
Environments 11 00072 g002
Figure 3. Time series of freshwater inflows (AF) at location of TIME Model estimates of net freshwater inflow along the southwest coast (points 1 through 6) and along the northeast shoreline of Florida Bay (points 7 through 12). All freshwater inflow (1 through 12) were used for both the EFDC model calibration and all model scenario simulations.
Environments 11 00072 g003
Figure 4. Locations of 15 Everglades National Park (ENP) stations utilized for salinity and temperature calibration and all scenario analysis presented in this manuscript. Refer to Figure 5 for station name.
Environments 11 00072 g004
Figure 5. EFDC hourly model-predicted mean and median salinity values at a total of 15 stations depicted in Figure 4 in the northeastern corner of Florida Bay in response to increase in freshwater inflow. Black-solid line represents freshwater inflow for the calibration run (current conditions base run: 1Q); Blue-solid line represents double the Taylor River current conditions base run of freshwater inflow (2Q), Green-solid line represents twice the current conditions base run (2R) of rainfall amount over the bay compared to the calibration run.
Environments 11 00072 g005
Figure 6. Monthly representation comparisons of daily average observed and model-predicted salinity at Bouy Key station (location = 15) over a seven-year period (1996–2002). Circles represent 5th and 95th percentile, The boundary of the box closest to zero indicates the 25th percentile. Black- and red-solid lines within the box mark the median and the mean, respectively. The boundary of the box farthest from zero indicates the 75th percentile. Whiskers (error bars) above and below the box indicate the 90th and 10th percentiles.
Environments 11 00072 g006
Figure 7. EFDC hourly model-predicted salinity values at a total of 15 stations in the northwestern corner of Florida Bay in response to increase in freshwater inflow through Shark River. Black-solid line represents freshwater inflow for the calibration run (1Q); blue-solid line represents double the amount of freshwater inflow for the calibration run (2Q); green-solid line represents double the amount of rainfall over the entire bay during the calibration run (Rain = 2R). All other remaining model set-ups remain unchanged. Red-solid lines represent lower (5 ppt) and upper (35 ppt) limits of salinity performance measures proposed to improve and protect the health of the Florida Bay ecosystem.
Environments 11 00072 g007aEnvironments 11 00072 g007b
Figure 8. Temperature (Left Panel) and salinity (Right Panel) comparisons between model-predicted values and field observations at Card Sound Bridge station during the EFDC model calibration period for Florida Bay (1996 through 2002).
Environments 11 00072 g008
Figure 9. Hourly model-predicted salinity duration probability curves. Black-solid line represents current conditions base run (1Q), blue-solid line represents twice the calibration (2Q) amount of freshwater inflow in Taylor River, and green-solid line represents twice the amount of rain (2R) in current conditions base run. Solid red lines represent the CERP salinity restoration target (i.e., highest and lowest values).
Environments 11 00072 g009
Table 1. Summary descriptive statistics of all freshwater inflow (m3 s−1) to Florida Bay. Highlighted rows are the dominant and the highest discharge into Florida Bay. All discharge values are the original ones from the calibrated EFDC model of Florida Bay.
Fresh Water Point SourceSizeMeanMedianMinMaxRange0.250.75Std. Dev.Std. Error
Barron Creek (1)29240.430.14−0.327.077.3900.570.740.01
Turner (2)29246.492.83−0.0588.5688.610.748.739.830.18
Lopez (3)29241.530.77−3.1624.9728.130.321.832.380.04
Chathan (4)29249.982.44−36.05224.87260.920.1110.5221.760.4
Lostmans (5)292420.249.27−105.29235.96341.250.0228.2830.870.57
Broad/Harney/Shark (6)292430.4310.58−540.9923.051463.96054.81108.822.01
Trout (7)29245.830.13044.644.6010.148.490.16
Mud Creek (8)29241.17009.519.5102.011.710.03
Taylor Creek (9)29240.980.306.856.8501.741.260.02
McCormick Creek (10)29241.02009.919.9100.991.940.04
Long-Sound (11)29240.880−43.3324.5567.8801.083.570.07
Alligator (12)29240.070−8.756.0614.8100.010.50.01
USGS: (S197 (13))29241.430083.3283.32007.110.13
Disclaimer/Publisher’s Note: The statements, opinions and data contained in all publications are solely those of the individual author(s) and contributor(s) and not of MDPI and/or the editor(s). MDPI and/or the editor(s) disclaim responsibility for any injury to people or property resulting from any ideas, methods, instructions or products referred to in the content.

