Article

Maceration of Waste Cork in Binary Hydrophilic Solvents for the Production of Functional Extracts

by
Umut Şen
1,*,
Catarina Viegas
2,
Maria Paula Duarte
2,
Elisabete Muchagato Maurício
3,
Catarina Nobre
4,
Ricardo Correia
2,
Helena Pereira
1 and
Margarida Gonçalves
2,4
1
Forest Research Centre, School of Agriculture, University of Lisbon, Tapada da Ajuda, 1349-017 Lisbon, Portugal
2
Mechanical Engineering and Resource Sustainability Center, Department of Chemistry, Faculty of Sciences and Technology, NOVA University of Lisbon, Campus de Caparica, 2829-516 Caparica, Portugal
3
Faculty of Engineering-BioRG/CBIOS, Universidade Lusófona, 1749-024 Lisbon, Portugal
4
VALORIZA-Research Center for Endogenous Resource Valorization, Polytechnic Institute of Portalegre, 7300-555 Portalegre, Portugal
*
Author to whom correspondence should be addressed.
Environments 2023, 10(8), 142; https://doi.org/10.3390/environments10080142
Submission received: 4 July 2023 / Revised: 1 August 2023 / Accepted: 7 August 2023 / Published: 9 August 2023
(This article belongs to the Special Issue Deployment of Green Technologies for Sustainable Environment II)

Abstract

:
Waste-grade cork samples of Quercus cerris were subjected to maceration extraction using 7 different solvents, including pure water (I), pure acetone (II), 75% aqueous ethanol (III), 75% aqueous methanol (IV), 75% aqueous acetone (V), 50% aqueous acetone (VI), and 25% aqueous acetone (VII). The extract yields, extract compositions, as well as antioxidant and antimicrobial activities of the extracts were analyzed. The results showed that maceration extraction was highly efficient, particularly with binary solvents resulting in up to 6% extract yield and up to 488 mg GAE/g extract total phenolic content. The extracts exhibited a variable antioxidant activity determined by DPPH and FRAP methods as well as antimicrobial activity against gram-positive bacteria and fungus determined by agar diffusion test. The CIELAB color parameters of extracts were correlated with maceration time, and the correlation was highest with pure water extracts. The FT-IR spectra of acetone-extracted cork revealed six key markers of phenolic compounds with the presence of peaks at approximately 2920 cm−1, 2850 cm−1, 1609 cm−1, 1517 cm−1, 1277 cm−1, and 1114 cm−1. The overall results suggest that the maceration of waste cork in binary solvents and pure acetone are green alternatives to conventional Soxhlet extraction for the production of polar extracts.

1. Introduction

Cork is found in the outer bark of trees. In plant anatomy, it is the phellem tissue in periderms that, in some species, may constitute a substantial bark proportion [1]. This is the case of the cork oak (Quercus suber), from which the cork raw material is extracted as feedstock for an economically thriving industrial sector [1,2]. Cork is a valued material with an interesting set of properties that are used in a number of products, some of them known worldwide, namely the wine cork stoppers [3]. The economic potential of cork has attracted considerable interest in recent years, and biorefinery and circular economy-based processes [4] have been applied to simultaneously reduce waste streams and produce value-added products from the cork industry [5,6,7,8]. Such approaches are particularly challenging when the bark contains considerable amounts of lignocellulosic materials in addition to cork. This is the case of the cork-rich Quercus cerris bark, where the cork layers are interspersed by lignocellulosic phloem layers, therefore, requiring bark to be fractionated to separate the valued pure cork fractions that will be considered for the production of cork stoppers, while simultaneously yielding waste cork and phloem fractions [9]. These waste-grade cork and phloem fractions must also be valorized and were already studied for biorefinery routes [5]. One of the possible routes is the extraction of this waste biomass to produce bioactive extracts, namely of phenolic nature since the phenolic content of waste-grade Q. cerris cork and phloem is high and showed a significant antioxidant effect [5].
A number of factors affect the efficiency of extraction of phenolic compounds from plant materials, including solvent type and polarity, solvent-to-biomass ratio, temperature, and time, as well as the extraction method itself [10]. Commonly used solvents are polar solvents such as water, acetone, ethanol, methanol, ethyl acetate, and their aqueous solutions [11]. The polarity of the solvent affects the extract yield by selectively removing the target compounds, which may also affect the antioxidant activity of the extracted compounds [11]. Polar aprotic solvents are solvents that cannot take part in intermolecular hydrogen bonding. Important aprotic solvents include acetone, ethyl acetate, and dimethyl sulfoxide. Polar aprotic solvents are frequently used in the extraction of phenolic compounds [12,13] because of their high ability to dissolve these compounds [12] and possibly for their inertness with solutes. Since the phenolic compounds have varying degrees of polarity, their extraction efficiency may be enhanced by using a binary protic/aprotic solvent system to target a wider range of extracts with variable polarity [14]. A synergistic effect may also be achieved by using a binary solvent extraction leading to a higher extract yield [15].
The high solvent-to-biomass ratio increases the phenolic yield by increasing the concentration gradient and reducing the solvent viscosity [16]. Temperature affects the extract yield and extract composition, and with temperature increase, the extract solubility and the diffusion coefficient increase, thereby increasing extract yield, although thermo-sensitive compounds are likely to be degraded [10]. Longer extraction times may also increase the extraction yield and composition [10,17] through diffusion, which is particularly relevant for maceration extraction. Extraction of phenolic compounds may also be enhanced by using ultrasound, supercritical fluid extraction [17], or accelerated-solvent extraction [18] to obtain a higher extract yield. However, these methods are costly, and the low-cost methods for biomass extraction are usually a requirement for the overall economic feasibility of waste conversion.
Maceration extraction is a commonly applied method to obtain bioactive polar compounds from vegetable matrices [19,20]. It involves soaking the plant material in a liquid solvent for extended periods of time at room temperature, where the solvent dissolves the target compounds from the plant tissue. Agitation may be applied to increase extraction efficiency, but it is not obligatory because the desired extract yields may be achieved through diffusion, depending on the plant type. This means that maceration extraction is an energy-efficient method with a lower carbon footprint compared to other extraction methods. Maceration extraction at room temperature with protic/aprotic binary solvents may be a choice of extraction for waste biomass to recover phenolic compounds with high antioxidant and antimicrobial activity.
This article is set to investigate the phenolic profile, antioxidant, and antimicrobial activities of waste Q. cerris cork and phloem fraction obtained from the bark fractionation using an environmentally friendly maceration extraction method with mono and binary solvent systems. The results will contribute to the ongoing studies on the valorization of waste lignocellulosic materials and to the development of green technologies for the production of sustainable and energy-efficient extracts to be used for chemical or pharmaceutical applications.

2. Materials and Methods

2.1. Materials

Waste-grade cork with 20–40 mesh (420–840 μm) granules originating from the pilot scale fractionation of Q. cerris bark was used. The samples contain cork and lignocellulosic phloem tissues and have the following chemical composition: 6.9% ash, 8.7% extractives, 11.1% suberin, 34.1% lignin, and 39.1% polysaccharides [5]. The proportion of cork in this waste cork is estimated as 38.9% by using the proportion of suberin in pure cork (28.5%) [21].

2.2. Scanning Electron Microscopy

The structure of the waste cork samples was observed with a Hitachi S-2400 scanning electron microscope (SEM) (Tokyo, Japan). The instrument was operated in high vacuum mode, and secondary electrons were detected using an accelerating voltage of 20 kV.

2.3. Maceration Extraction

Approximately 10 ± 0.1 g of cork granules were inserted into a beaker with 100 mL solvent at ambient temperature (20 ± 2 °C) in four treatments with varying extraction times (Table 1). A continuous agitation was not applied except for a preliminary agitation to ensure solvent contact. A total of six different extractions were performed. The first extraction was carried out as a single extraction during 24 h (Experimental Design 1) and coded as E; the second, third, and fourth extractions were subsequent serial extractions and coded as EI, EII, and EIII (Experimental Design 2) (Figure 1). The fifth and the sixth extractions (EIV and EV) were performed as parallel extractions with selected solvents (Acetone-100% and Acetone 75%) after evaluating the results of the first four extractions (Experimental Design 3). In the latter two extractions, the effect of solvent washing was also tested regarding the extraction of the compounds trapped on the cork surface. Thus, after the first filtration, solid cork residues were washed with approximately 40 mL of solvent.
The numbers were added to the codes to indicate the order of the mono or binary extraction (1–7). After the extraction time was over, 100 mL (EIV and EV), 70 mL (E), or 20 mL (EI, EII, and EIII) aliquots were removed from the beakers using a Pasteur pipette and filtered to remove cork particles using a paper filter (Prat Dumas Ref A009609, Couze-St-Front, France-90 mm) and kept at 4 °C for the subsequent analyses of phenolic compounds (Table 1). The extract yields were determined by drying approximately 5 mL aliquots in Petri dishes at 25 °C.

2.4. Total Phenolic Content, Condensed Tannin Content, and Antioxidant Properties

The total phenolic content (TPC) of the extracts was measured by the Folin–Ciocalteu method [22]. Approximately 0.5 mL of extract, 2 mL of distilled water, and 0.5 mL of Folin–Ciocalteu reagent were added to a test tube and allowed to stand for 5 min. Afterward, 2 mL of aqueous sodium carbonate (10% m/v) was added, and the mixture was incubated for 1 h in the dark. Absorbance was measured at 760 nm, and total phenolic content was determined using a calibration curve constructed with gallic acid standards. The results were expressed as gallic acid equivalents (mg GAE/g of dry extract).
The condensed tannin content was determined by applying the method of Broadhurst et al. (1978) [23] with slight modification and using catechin as a standard compound. A 400 μL of extract is added to 3 mL solution of vanillin (4% in methanol) and 1.5 mL of concentrated HCl. After 15 min of incubation, the absorbance was read at 500 nm. The condensed tannin content was expressed in catechin equivalents (mg CE/g of dry extract).
The antioxidant activity was evaluated by the DPPH free radical scavenging assay and by the ferric reducing antioxidant power assay (FRAP). For the DPPH assay [24], 0.5 mL of cork extracts were mixed with 4 mL of DPPH solution (2,2-diphenyl-1-picrylhydrazyl at 45 mg/L in methanol) and incubated at room temperature for 30 min. After incubation, absorbance was measured at 517 nm, and the results were expressed in Trolox equivalents by using a calibration curve obtained with Trolox as a standard (mg TE/g of dry extract). For the FRAP assay, the procedure of Benzie and Strain was carried out with slight modifications [25]. The FRAP reagent was prepared from 0.3 M acetate buffer (pH 3.6), 10 mM TPTZ (2,4,6-Tris(2-pyridyl)-s-triazine) solution in 40 mM HCl, and 20 mM iron (III) chloride solution in proportions of 10:1:1 (v/v), respectively. This reagent was freshly prepared before analysis and warmed to 37 °C in a water bath prior to use. A 100 μL of sample was added to 3 mL of the FRAP reagent and the mixture was kept at 37 °C for 30 min. After this period, absorbance was recorded at 593 nm. A standard curve was made using iron (II) sulfate solution, and the results were expressed as mmol Fe(II)/g of dry extract. In all assays, two replicates of each sample were analyzed in triplicate.

2.5. Antimicrobial Activity

The cork extracts (E) were evaporated to dryness and dissolved in 50% ethanol/water solution before the antimicrobial tests. The antimicrobial activities were assayed by the agar diffusion method according to Correia et al. [26] and Pereira et al. [27]. Antibacterial activity of the cork extracts was assayed against both Gram-negative bacteria (Escherichia coli ATCC® 8739TM and Pseudomonas aeruginosa ATCC® 9027TM), and Gram-positive bacteria (Staphylococcus aureus ATCC® 6538TM, methicillin-resistant Staphylococcus aureus (MRSA) ATCC® 33591TM, Enterococcus faecalis ATCC® 29212TM, Bacillus cereus ATCC®11778TM, Streptococcus mutans ATCC®25175TM, and Streptococcus mitis NCIMB®13770). The antifungal activity of cork extracts was tested against Candida albicans.
Microorganisms were kept frozen at −70 °C in broth containing glycerol (15% v/v). Isolated colonies from fresh cultures of the microorganism were suspended in a saline medium (NaCl, 0.85% w/v), and the turbidity was adjusted to 0.5 on the McFarland scale (approx. 1–2 × 10⁸ CFU/mL for bacteria and 1–5 × 10⁶ CFU/mL for yeasts) (DEN-1B McFarland Densitometer, Grant-bio). Microbial suspensions were then spread on Petri dishes with Brain Heart Infusion Agar (BHIA, Merck, Darmstadt, Germany) (S. mutans and S. mitis) or Mueller–Hinton Agar (MHA Biokar diagnostics, Allonne, France) (remaining microorganisms). Subsequently, wells (6 mm in diameter) were aseptically punched, and 50 µL of extracts (10 mg/mL) were poured into the wells. The plates were incubated, in the dark, for 24 h at 30 ± 2 °C (B. cereus and C. albicans) or 35 ± 2 °C (remaining microorganisms). The antimicrobial activity was evaluated in triplicate by measuring the diameter of the growth inhibition zone (mm) around the wells. Paper disks impregnated with vancomycin (Gram-positive bacteria), ofloxacin (Gram-negative bacteria), and ketoconazole (C. albicans) were used as positive controls. Ethanol (50% v/v) and water were used as negative controls for extracts in ethanol (50% v/v) and for aqueous extracts, respectively. Data are presented as the mean ± standard deviation.

2.6. CIELAB Color Analysis

Absorption spectra of the cork extracts were recorded using a UNICAM UV-Vis spectrophotometer in 1 mm path-length quartz cells. The color analysis was made in the visible spectra (380–770 nm), and the CIELAB color parameters (L*, a*, and b*) were calculated using the Vision software. The total color differences were calculated using the equation ΔE = [(ΔL*)2 + (Δa*)2 + (Δb*)2]1/2 where ΔL*, Δa*, and Δb* are the differences between the CIELAB parameters.

2.7. FT-IR Analysis

Liquid samples of five cork extracts (Water100, EtOH75, MetOH75, Ace75, and Ace100) were analyzed on the diamond (ATR-FTIR), and the transmittance spectra were acquired with a Perkin Elmer Spectrum in the range of 4000–400 cm−1 with a spectral resolution of 8 cm−1. Three blank tests were performed with pure water, acetone, and ethanol solvents.

2.8. UV-Vis Analysis

The flavonoid content of the cork extracts was evaluated by determination of the UV-visible absorbance values at 350 nm using a Libra S4 spectrophotometer. For the determination of absorbance values, the sequential serial extracts were diluted using an extract-to-water ratio of 1:15.

2.9. Statistical Analysis

The CIELAB color parameters of the different extracts obtained from subsequent serial extractions were analyzed by two-way ANOVA analysis at 0.05 significance (alpha) level. One-way analysis of variance (ANOVA) followed by Tukey’s test at 0.05 level of probability was used to identify significant differences between the antimicrobial activity of the extracts (STATISTICA™ 7.0, StatSoft, Tulsa, OK, USA).

3. Results

3.1. Morphological Analysis

The structure of the cork cells used in this work is shown in Figure 2. Q. cerris waste cork mostly contains phloem inclusions (visually observed as darker-colored tissues) distributed in between the lighter-colored cork tissues. This observation agrees with the previous observations on the anatomy of Q. cerris bark [28,29]. The cork granules had an irregular shape and showed the typical structure of cork with a compact arrangement of closed, thin-walled cells, appearing in sections with various orientations and with frequent distortions and compression, in agreement with the description of cork in Q. cerris bark [29]. The phloem granules (photo not shown) were characterized by different cell types but dominated by the thick-walled sclereids, as described previously [28].
The high proportion of phloem in Q. cerris cork granules is against a valorization based on the cellular characteristics of cork and suggests the application of alternative conversion paths to valorize the cork material, including composites, solid fuels, and extracts [5,30]. The extract-based valorization is targeted in the present article.

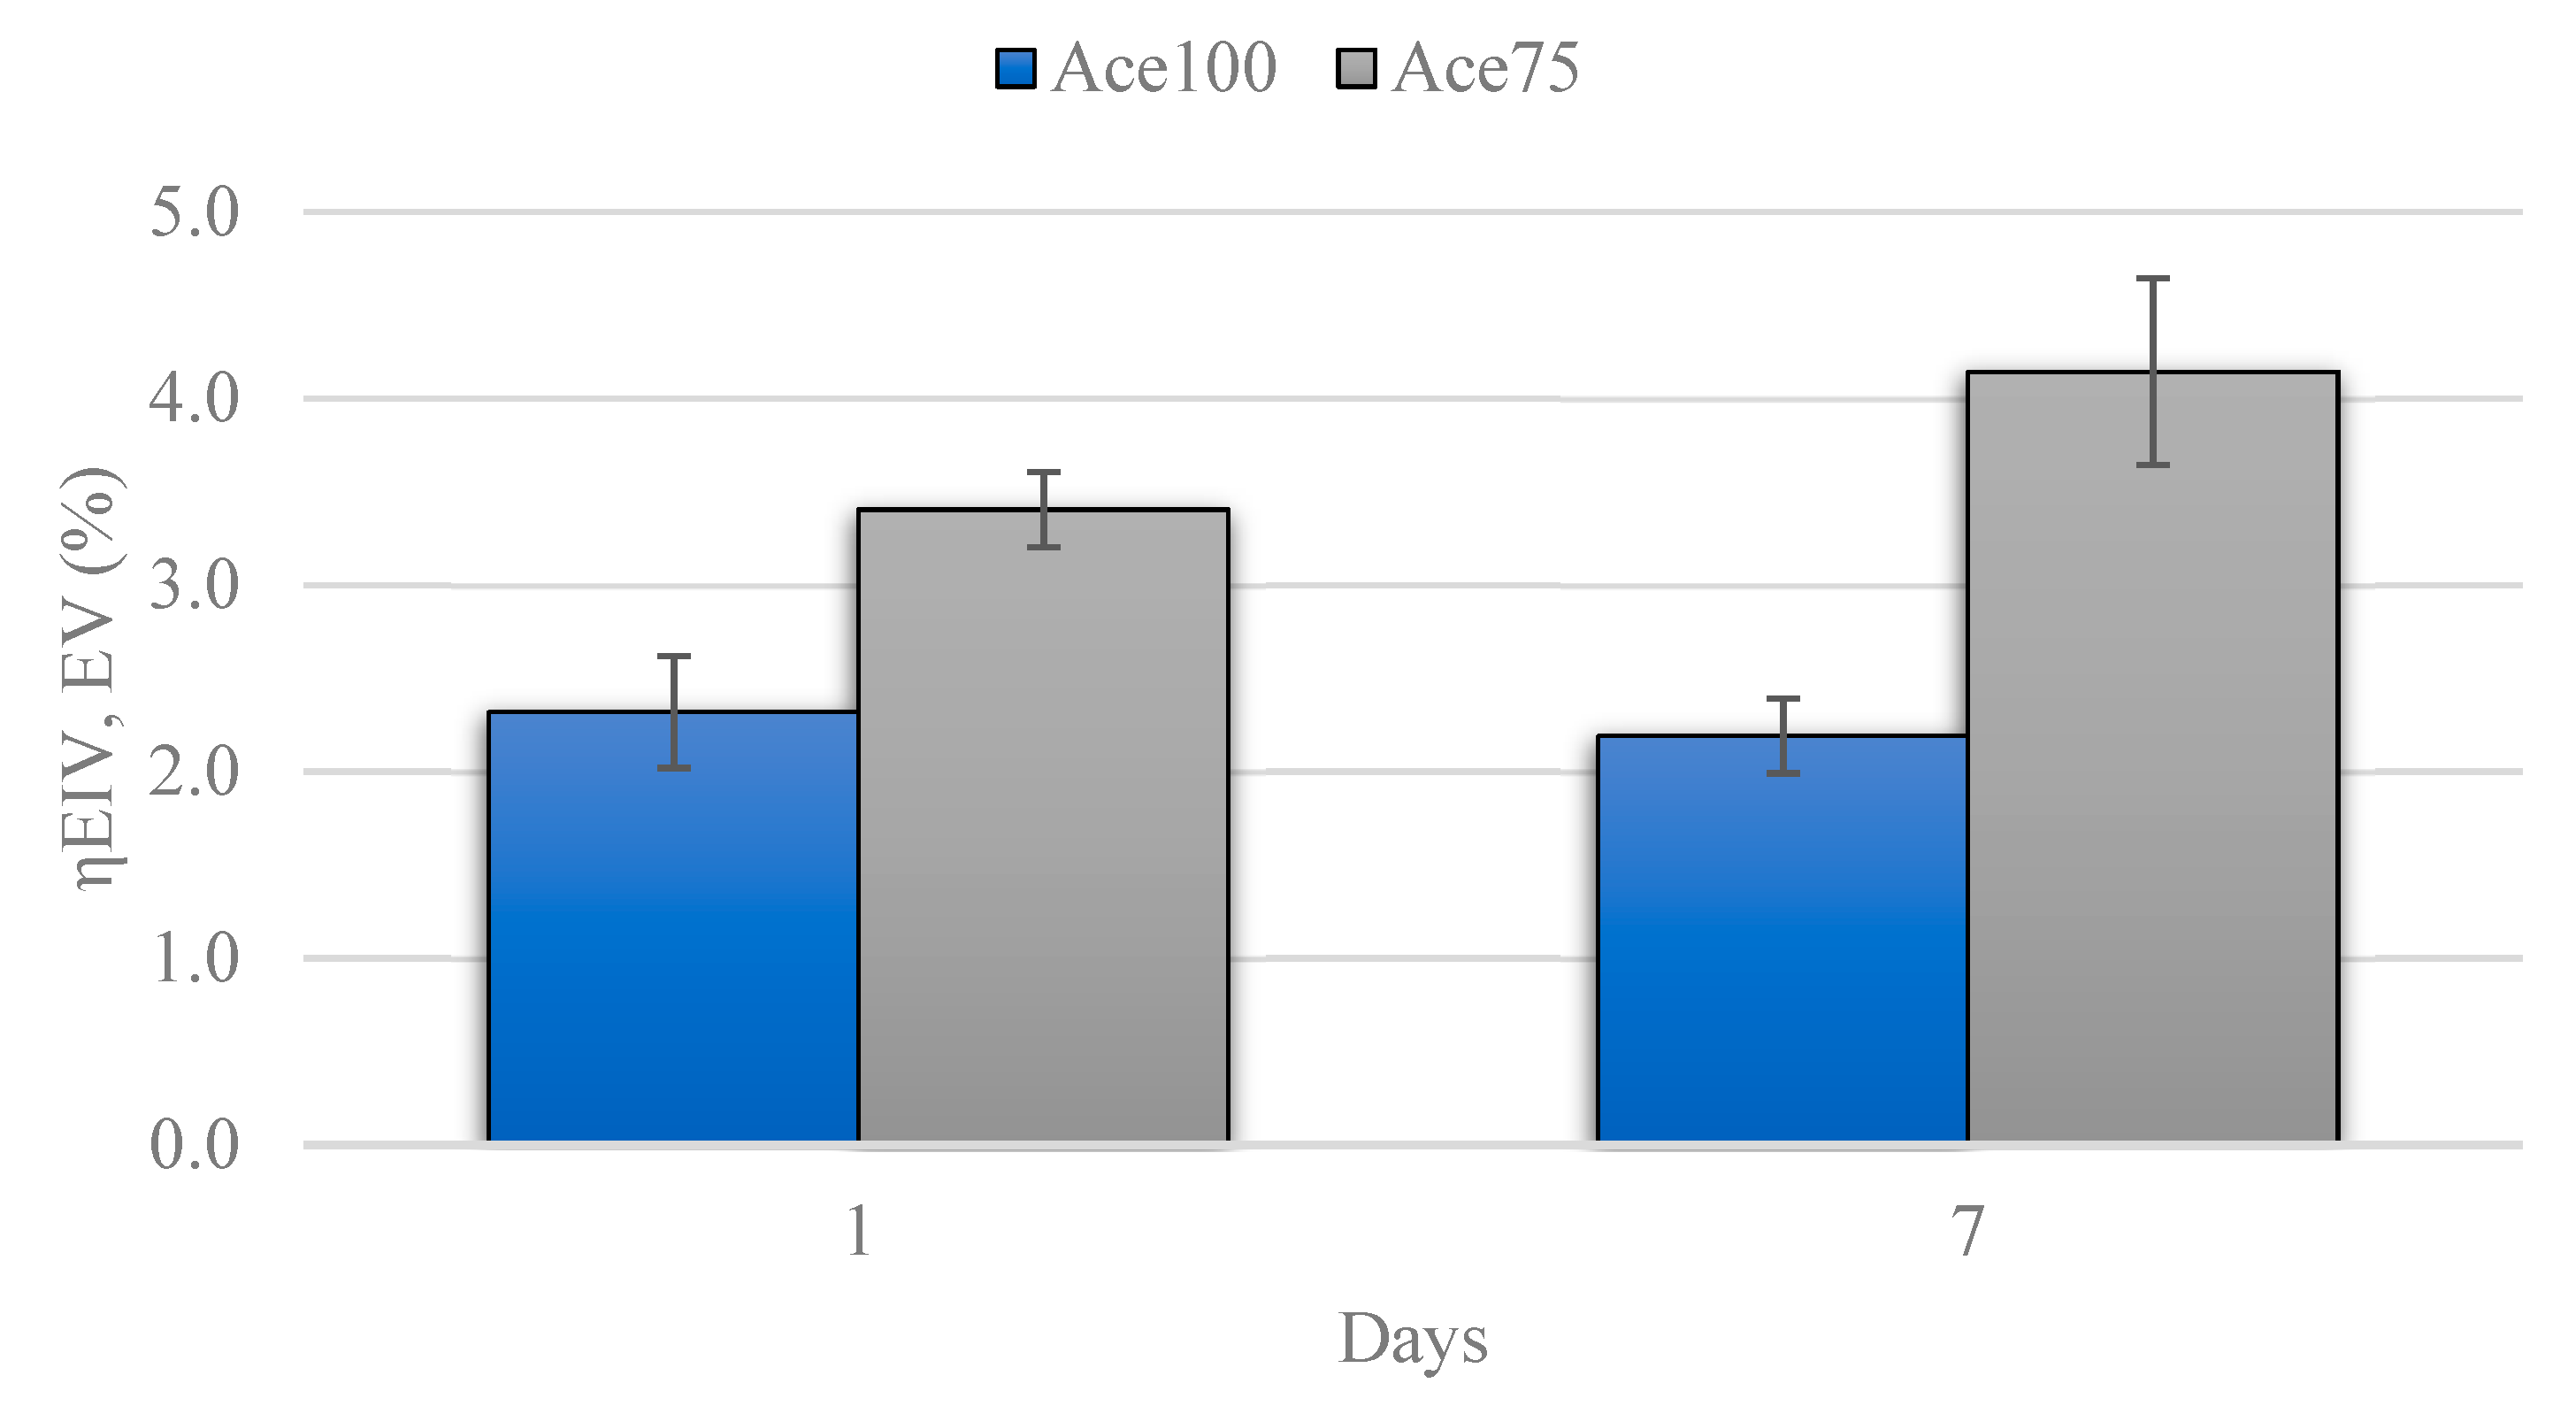
3.2. Extract Yields and Phenolic Composition

The extract yields of Q. cerris cork using the different extraction designs are shown in Figure 3. The results of these figures indicate the following: the polar extract yield (between 1.5 and 2.3% in E, between 1.5 and 4.3% in EI, EII, EIII, and between 2.2 and 4.1% in EVI and EV) is lower compared to the 6.6% obtained in Soxhlet extraction [5] (i), extract yields are higher in binary solvents than in pure solvents (ii), water-based maceration results in the lowest extract yield (iii), 75% acetone extracts the highest amount of compounds from cork (iv), the solvent becomes saturated between 7 and 30 days of extraction, and some of the extracts precipitates, resulting in a greater variation in extract yields (v), solvent washing increases extract yields between 20–32% in parallel design compared to serial subsequent extractions (vi).
The phenolic content of cork extracts was abundant. The highest total phenolic content was obtained by 75% methanol extraction (488 mg GAE/g extract), followed by 25% acetone extraction (486 mg GAE/g extract) through single extraction (E) (Figure 4). Condensed tannin contents (Figure 4) were, in general, higher in acetone extracts. The condensed tannin contents were increased in binary solvents after prolonged maceration, which was slightly different than pure solvents. Possibly, under extended extraction time, higher-molecular weight compounds become extracted by using binary solvents due to the alteration of solvent polarity compared to pure solvents. The highest condensed tannin content after 25% acetone extraction is possibly related to the interference of other extracts in the solution.

3.3. Antioxidant Properties

The antioxidant properties of cork extracts are shown in Figure 5. The results indicate that all extracts exhibit antioxidant activity. The results of the FRAP antioxidant test indicate that binary solvents, in particular acetone solvents, contained the highest antioxidant activity. 50% acetone extraction resulted in the highest antioxidant activity with a FRAP value of 0.180 mmol Fe(II)/g extract. Pure solvents showed the lowest antioxidant activities after the single extraction (Figure 5).
The antioxidant activities of the binary solvent extracts were further tested with the DPPH method (Figure 5). Interestingly, the pure acetone extracts showed notable antioxidant activity by the DPPH method after prolonged extraction.

3.4. Antimicrobial Properties

The antimicrobial properties of cork extracts are shown in Table 2. In the conditions assayed, cork extracts demonstrated antimicrobial activity against Gram-positive bacteria and fungus but did not exhibit antimicrobial activity against Gram-negative bacteria (P. aeruginosa and E. coli). All extracts except the 100% aqueous extract showed antimicrobial properties, but acetone extracts were, in general, the most efficient.

3.5. Color Analysis

All the waste cork extracts exhibited yellow color tones, which are possibly linked with the phenolic content. The change in color suggests that the concentration and stability of the phenolic compounds vary between different extracts. Therefore, CIELAB color analysis was performed to quantify these changes. The color change in the cork extracts was evaluated on the changes of lightness (L), red-green (a), and yellow-blue levels (b). In this system, lightness varies between 0 (black) and 100 (white); red-green levels vary between +60 (red-) and −60 (green), and yellow-blue levels vary between +60 (yellow) and −60 (blue). The color of a material is represented as a mixture of these three parameters [31]. The results of the color analysis of cork extracts are shown in Figure 6 and Figure 7. The color of cork extracts considerably changed through using binary solvents. The color of the pure acetone extracts was comparatively more stable than water and binary extracts (Figure 6). The total color change (ΔE) was higher in water-containing extracts than in pure acetone extract. The color change was faster until the 7-day extraction, and later, the change rate decreased (Figure 7).

3.6. FT-IR Analysis

The FT-IR study was carried out on the cork extracts to identify and evaluate the phenolic compounds extracted by different solvents. The results of the FT-IR analysis are shown in Figure 8. The FT-IR spectra of the cork extracts may be analyzed in four regions [32]. The first region includes peaks between 3000 cm−1 and 3600 cm−1, which are assigned to O-H stretching vibrations of water and carboxylic acids. These peaks were particularly strong in aqueous extracts (Water100, EtOH75, MetOH75, and Ace100), while in Ace100 extract, it was weak. The second region comprises the peaks of C-H single bonds between 2700 cm−1 and 3000 cm−1. The peaks in this region are assigned to symmetric and asymmetric CH2 stretching vibrations of fatty acids and phenolic acids. The third region includes the peaks of mainly double bond vibrations between 1500 cm−1 and 1750 cm−1. This region comprises C=O, C=C, as well as C-O vibrations of esters, phenolic compounds, and oxygenated extractives. The fourth region comprises the fingerprint peaks between 1000 cm−1 and 1500 cm−1 and consists of single-bond bending vibrations of a large group of compounds, including phenolic compounds [33,34].
The solvents had a strong influence on the FT-IR spectra with strong peaks at 3300 cm−1, 1630 cm−1, and 1016 cm−1, which are assigned to O-H stretching of water, O-H bending of water and C-O stretching of ethanol. Among the used solvents, pure acetone resulted in the highest number of peaks which are possibly linked with the extracted phenolic compounds (Figure 8). After solvent-related peaks are detected, a total of six extract-related peaks could be identified, namely, 2921 cm−1, 2851 cm−1, 1609 cm−1, 1517 cm−1, 1277 cm−1, and 1114 cm−1. The first two peaks can also be linked with the C-H stretching of fatty acids and esters [32], but the other peaks are probably linked with the C=O and C-O vibrations of the extracted phenolic compounds.

3.7. UV-Vis Analysis

The flavonoids absorb electromagnetic radiation near 350 nm. Therefore, the ultraviolet absorption at 350 nm allows comparing the relative abundance of flavonoids in different extracts [35]. As Figure 9 shows, the flavonoid contents gradually increased with time, and the acetone extracts contained the highest amount of flavonoids.

3.8. Two-Way ANOVA

The previous results showed that the CIELAB color parameters changed with different solvents and at different times. Therefore, a two-way ANOVA test was carried out to determine whether these changes were statistically significant. The results of the statistical test are shown in Table 3.
The statistical analysis results showed that the changes in color parameters are statistically significant between the different solvents and between the different days with F values greater than the Fcritical values in all cases.

4. Discussion

The high extractive content is a distinctive property of tree bark [36]. The hydrophilic fraction is possibly the most important fraction of the bark extracts, which shows a large variation among different barks [37]. The Q. cerris waste cork contains up to 6.6% hydrophilic extractives, while in Q. cerris phloem, this value is about 4.1% [5]. The results of the present study demonstrated that maceration extraction, particularly with binary solvents, was highly efficient considering the very mild conditions, resulting in up to 6% of extract yield. It is likely that the amount of phloem content decreases the total hydrophilic extract yield because pure cork contains a higher amount of hydrophilic extractives than phloem (5.8% vs. 4.9%, respectively) [21]. The extract yields of Q. cerris cork may be enhanced by using supercritical CO2 extraction if its cost disadvantage is compromised compared to low-cost maceration extraction. Supercritical CO2 extraction is a highly efficient and tunable extraction method where the extracts retain their natural characteristics [38,39], which is also expected in low-temperature maceration extraction.
Aprotic acetone was previously shown to be the most efficient solvent for the extraction of phenolic compounds from Quercus suber cork in terms of extract yields [40]. The results of this study are in agreement with this result. It seems that acetone is a selective solvent with phenolic components of cork. Methanol was also shown to be an efficient solvent for Q. cerris cork which resulted in up to 14% extract yield by Soxhlet extraction [39]. In the present study, we observed an enhanced extraction efficiency by application of binary solvents which further increased yields compared to pure solvents.
The composition of the phenolic fraction of cork was studied on Q. suber cork which showed to contain at least 15 compounds [40,41], with ellagic acid, gallic acid, and protocatechuic acids making up the most abundant compounds [41]. The total phenolic content of the Q. suber cork was reported to range between 200 and 350 mgGAE/g extract [41]. The phenolic content of waste Q. cerris cork through maceration extraction is similar to these values. This result suggests that the yield of the phenolic content of Q. cerris cork is similar to or possibly higher than Q. suber cork because waste fractions with lower extractive content were used in this study in addition to the applied milder extraction conditions (stirring and reflux were not applied).
The total phenolic content of Q. cerris bark was comparatively higher in aqueous methanol than in acetone solvents, ethanol, and pure water. This result agrees with the result of Pinus pinaster bark extracts suggesting the selectivity of alcoholic solvents towards phenolic compounds [42]. On the other hand, condensed tannin contents were comparatively higher in acetone solvents, indicating the selectivity of acetone.
Tree barks are increasingly considered for the production of antioxidant and antimicrobial agents, and different barks were analyzed [37]. The analyzed barks are usually locally available barks, and they show promising antioxidant and antimicrobial properties [41,43,44].
Our results showed that Q. cerris cork extracts exhibit a high antioxidant activity (DPPH values up to 2700 mgTE/g extract and FRAP values up to 0.18 mmol Fe(II)/g extract) and antimicrobial activity against Gram-positive bacteria and fungus. These results are promising since these waste materials could be valorized using environmentally friendly and energetically favorable maceration extraction. The lower susceptibility of Gram-negative bacteria is in line with results reported for other plant extracts [26,27], including bark extracts from other species [44,45]. This difference in sensitivity may be associated with the protection of the lipopolysaccharide layer in the outer membrane of Gram-negative bacteria [26].
The color parameters generally showed a strong correlation with maceration time (Table 4). This result suggests that color analysis may be applied to estimate the maceration time of different cork extracts, particularly when pure water solvent is used (Figure 10).
The relation between the total phenolic content and the in vitro antioxidant activity (FRAP) of cork extracts can be visualized by using a bubble graph where the bubble size shows the extraction yield (Figure 11). The figure shows that the application of binary solvents considerably increased antioxidant activity.
The antimicrobial activity was, in general, higher when binary solvents were used compared to pure solvents (Figure 12). 75% Acetone, 75% methanol, and 50% acetone showed the highest antimicrobial activity against B. cereus and C. albicans.
The color parameters of waste cork extracts significantly changed with the solvent used and extraction time. The UV-vis analysis revealed the flavonoid content increases during extraction time. Therefore, flavonoids are likely to contribute to the color change.
The overall results indicate that extract yield, total phenolic content, and solvent type affect the antioxidant and antimicrobial activities of cork, and these factors are not strongly correlated.
The FT-IR spectra of acetone-extracted cork revealed a total of six key markers of phenolic compounds with the presence of peaks at approximately 2920 cm−1, 2850 cm−1, 1609 cm−1, 1517 cm−1, 1277 cm−1, and 1114 cm−1. The first two peaks are characteristic single-bond hydrogen stretching peaks of fatty acids and are found in different products such as milk [46] or suberin [32,47]. However, these peaks also appear in catechin extracts [34]. Therefore, a potential polyphenolic origin cannot be ruled out. The peak at 1609 cm−1 possibly rises from C=C stretching vibrations of phenolic compounds such as those detected in wines [48]. The peak at 1517 cm−1 is the key marker of phenolic compounds of cork and was present both in acetone and ethanolic extracts. This peak possibly arises from C-C stretching vibrations of catechin [33]. The peaks at 1277 cm−1 and 1114 cm−1 may be assigned to C-OH [49] and C-H vibrations of flavonols, respectively [33], but it is difficult to assign a certain functional group to these peaks in the fingerprint zone.
The FT-IR results agree with the phenolic composition results and confirm the presence of phenolic compounds in cork extracts, and suggest that pure acetone is the best solvent in terms of the variability of phenolic compounds.

5. Conclusions

Maceration extraction of cork is a promising method to obtain bioactive waste cork extracts with high antioxidant and antimicrobial properties. Binary solvents are more efficient in terms of extract yield (up to 6%) and total phenolic content (up to 488 mg GAE/g extract) than mono solvents. Aqueous acetone solvents extract the highest amounts of compounds from waste cork, while pure acetone extracts exhibit the highest antioxidant activity. Aqueous methanol is selective to extract waste cork phenolics. Maceration time and color parameters showed a significant correlation for pure water extracts.
Further research on the maceration extraction of waste cork will focus on the detailed characterization of the aqueous acetone, pure acetone, and aqueous ethanol extracts aiming at the production of phenolic platform chemicals and bioactive extracts for pharmaceutical uses.

Author Contributions

Conceptualization, U.Ş. and H.P.; investigation, U.Ş., C.V., M.P.D., E.M.M., C.N. and R.C.; methodology, U.Ş., M.P.D., E.M.M., H.P. and M.G.; supervision, H.P. and M.G., visualization, U.Ş.; writing—original draft, U.Ş.; writing—review and editing, U.Ş., C.V., M.P.D., E.M.M., R.C. and H.P. All authors have read and agreed to the published version of the manuscript.

Funding

This work has been supported by FCT—Fundação para a Ciência e a Tecnologia within the R&D Units Mechanical Engineering and Resource Sustainability, MEtRICs (UIDB/04077/2020 and UIDP/04077/2020) and Forest Research Centre, CEF (UIDB/00239/2020). Umut Şen acknowledges support from FCT through a research contract (DL 57/2016). Ricardo Correia acknowledges his Ph.D. grant from FCT (SFRH/BD/133300/2017).

Data Availability Statement

Not applicable.

Acknowledgments

The authors thank Suzana Fereira Dias and Rita Simões from Instituto Superior de Agronomia for color analysis, Isabel Nogueira from Instituto Superior Técnico for SEM analysis, and Teresa Nogueira for FT-IR analysis.

Conflicts of Interest

The authors declare no conflict of interest.

References

  1. Leite, C.; Pereira, H. Cork-containing barks—A review. Front. Mater. 2017, 3, 63. [Google Scholar] [CrossRef] [Green Version]
  2. Silva, S.P.; Sabino, M.A.; Fernandes, E.M.; Correlo, V.M.; Boesel, L.F.; Reis, R.L. Cork: Properties, capabilities and applications. Int. Mater. Rev. 2005, 50, 345–365. [Google Scholar] [CrossRef] [Green Version]
  3. Pereira, H. Cork: Biology, Production and Uses; Elsevier: Amsterdam, The Netherlands, 2007. [Google Scholar]
  4. Pan, S.-Y.; Du, M.A.; Huang, I.-T.; Liu, I.H.; Chang, E.E.; Chiang, P.C. Strategies on implementation of waste-to-energy (WTE) supply chain for circular economy system: A review. J. Clean. Prod. 2015, 108, 409–421. [Google Scholar] [CrossRef]
  5. Sen, A.; Miranda, I.; Esteves, B.; Pereira, H. Chemical characterization, bioactive and fuel properties of waste cork and phloem fractions from Quercus cerris L. bark. Ind. Crop. Prod. 2020, 157, 112909. [Google Scholar] [CrossRef]
  6. Ferreira, J.P.A.; Quilhó, T.; Pereira, H. Characterization of Betula pendula Outer Bark Regarding Cork and Phloem Components at Chemical and Structural Levels in View of Biorefinery Integration. J. Wood Chem. Technol. 2017, 37, 10–25. [Google Scholar] [CrossRef]
  7. Soares, B.; Gama, N.; Freire, C.; Barros-Timmons, A.; Brandao, I.; Silva, R.; Pascoal Neto, C.; Ferreira, A. Ecopolyol production from industrial cork powder via acid liquefaction using polyhydric alcohols. ACS Sustain. Chem. Eng. 2014, 2, 846–854. [Google Scholar] [CrossRef]
  8. Pintor, A.M.A.; Ferreira, C.I.A.; Pereira, J.C.; Correia, P.; Silva, S.P.; Vilar, V.J.; Botelho, C.M.; Boaventura, R.A. Use of cork powder and granules for the adsorption of pollutants: A review. Water Res. 2012, 46, 3152–3166. [Google Scholar] [CrossRef]
  9. Şen, A.; Leite, C.; Lima, L.; Lopes, P.; Pereira, H. Industrial valorization of Quercus cerris bark: Pilot scale fractionation. Ind. Crop. Prod. 2016, 92, 42–49. [Google Scholar] [CrossRef]
  10. Spigno, G.; Tramelli, L.; De Faveri, D.M. Effects of extraction time, temperature and solvent on concentration and antioxidant activity of grape marc phenolics. J. Food Eng. 2007, 81, 200–208. [Google Scholar] [CrossRef]
  11. González-Montelongo, R.; Lobo, M.G.; González, M. Antioxidant activity in banana peel extracts: Testing extraction conditions and related bioactive compounds. Food Chem. 2010, 119, 1030–1039. [Google Scholar] [CrossRef]
  12. Kallithraka, S.; Garcia-Viguera, C.; Bridle, P.; Bakker, J. Survey of solvents for the extraction of grape seed phenolics. Phytochem. Anal. 1995, 6, 265–267. [Google Scholar] [CrossRef]
  13. Taghizadeh, S.F.; Rezaee, R.; Davarynejad, G.; Karimi, G.; Nemati, S.H.; Asili, J. Phenolic profile and antioxidant activity of Pistacia vera var. Sarakhs hull and kernel extracts: The influence of different solvents. J. Food Meas. Charact. 2018, 12, 2138–2144. [Google Scholar]
  14. Thoo, Y.Y.; Ho, S.K.; Liang, J.Y.; Ho, C.W.; Tan, C.P. Effects of binary solvent extraction system, extraction time and extraction temperature on phenolic antioxidants and antioxidant capacity from mengkudu (Morinda citrifolia). Food Chem. 2010, 120, 290–295. [Google Scholar] [CrossRef]
  15. Lim, K.J.A.; Cabajar, A.A.; Lobarbio, C.F.Y.; Taboada, E.B.; Lacks, D.J. Extraction of bioactive compounds from mango (Mangifera indica L. var. Carabao) seed kernel with ethanol–water binary solvent systems. J. Food Sci. Technol. 2019, 56, 2536–2544. [Google Scholar]
  16. Alves, T.P.; Triques, C.C.; Palsikowski, P.A.; da Silva, C.; Fiorese, M.L.; da Silva, E.A.; Fagundes-Klen, M.R. Improved extraction of bioactive compounds from Monteverdia aquifolia leaves by pressurized-liquid and ultrasound-assisted extraction: Yield and chemical composition. J. Supercrit. Fluids 2022, 181, 105468. [Google Scholar] [CrossRef]
  17. Izquierdo-Hernández, A.; Peña-Neira, Á.; López-Solís, R.; Obreque-Slier, E. Comparative determination of anthocyanins, low molecular weight phenols, and flavanol fractions in Vitis vinifera L. cv Carménère skins and seeds by differential solvent extraction and high-performance liquid chromatography. Anal. Lett. 2016, 49, 1127–1142. [Google Scholar] [CrossRef]
  18. Gomes, S.V.F.; Portugal, L.A.; dos Anjos, J.P.; de Jesus, O.N.; de Oliveira, E.J.; David, J.P.; David, J.M. Accelerated solvent extraction of phenolic compounds exploiting a Box-Behnken design and quantification of five flavonoids by HPLC-DAD in Passiflora species. Microchem. J. 2017, 132, 28–35. [Google Scholar] [CrossRef]
  19. Garcia-Salas, P.; Morales-Soto, A.; Segura-Carretero, A.; Fernández-Gutiérrez, A. Phenolic-Compound-Extraction Systems for Fruit and Vegetable Samples. Molecules 2010, 15, 8813–8826. [Google Scholar] [CrossRef]
  20. Muchagato Maurício, E.; Rosado, C.; Duarte, M.P.; Fernando, A.L.; Díaz-Lanza, A.M. Evaluation of industrial sour cherry liquor wastes as an ecofriendly source of added value chemical compounds and energy. Waste Biomass Valorization 2020, 11, 201–210. [Google Scholar] [CrossRef]
  21. Şen, A.; Miranda, I.; Santos, S.; Graça, J.; Pereira, H. The chemical composition of cork and phloem in the rhytidome of Quercus cerris bark. Ind. Crop. Prod. 2010, 31, 417–422. [Google Scholar] [CrossRef]
  22. Singleton, V.L.; Rossi, J.A. Colorimetry of Total Phenolics with Phosphomolybdic-Phosphotungstic Acid Reagents. Am. J. Enol. Vitic. 1965, 16, 144–158. [Google Scholar] [CrossRef]
  23. Broadhurst, R.B.; Jones, W.T. Analysis of condensed tannins using acidified vanillin. J. Sci. Food Agric. 1978, 29, 788–794. [Google Scholar] [CrossRef]
  24. Blois, M.S. Antioxidant Determinations by the Use of a Stable Free Radical. Nature 1958, 181, 1199–1200. [Google Scholar] [CrossRef]
  25. Benzie, I.F.F.; Strain, J.J. The ferric reducing ability of plasma (FRAP) as a measure of “antioxidant power”: The FRAP assay. Anal. Biochem. 1996, 239, 70–76. [Google Scholar] [CrossRef] [Green Version]
  26. Correia, R.; Duarte, M.P.; Maurício, E.M.; Brinco, J.; Quintela, J.C.; da Silva, M.G.; Gonçalves, M. Chemical and Functional Characterization of Extracts from Leaves and Twigs of Acacia dealbata. Processes 2022, 10, 2429. [Google Scholar] [CrossRef]
  27. Pereira, P.; Mauricio, E.M.; Duarte, M.P.; Lima, K.; Fernandes, A.S.; Bernardo-Gil, G.; Cebola, M.J. Potential of supercritical fluid myrtle extracts as an active ingredient and co-preservative for cosmetic and topical pharmaceutical applications. Sustain. Chem. Pharm. 2022, 28, 100739. [Google Scholar] [CrossRef]
  28. Şen, A.U.; Quilhó, T.; Pereira, H. Bark anatomy of Quercus cerris L. var. cerris from Turkey. Turk. J. Bot. 2011, 35, 45–55. [Google Scholar] [CrossRef]
  29. Şen, A.; Quilhó, T.; Pereira, H. The cellular structure of cork from Quercus cerris var. cerris bark in a materials’ perspective. Ind. Crop. Prod. 2011, 34, 929–936. [Google Scholar] [CrossRef]
  30. Lakreb, N.; As, N.; Gorgun, V.; Sen, U.; Gomes, M.G.; Pereira, H. Production and characterization of particleboards from cork-rich Quercus cerris bark. Eur. J. Wood Wood Prod. 2018, 76, 989–997. [Google Scholar] [CrossRef]
  31. Şen, A.; Marques, A.V.; Gominho, J.; Pereira, H. Study of thermochemical treatments of cork in the 150–400 °C range using colour analysis and FTIR spectroscopy. Ind. Crop. Prod. 2012, 38, 132–138. [Google Scholar] [CrossRef]
  32. Sen, U.; Longo, A.; Gonçalves, M.; Miranda, I.; Pereira, H. The potential of waste phloem fraction of Quercus cerris bark in biochar production. Environments 2023, 10, 17. [Google Scholar] [CrossRef]
  33. Krysa, M.; Szymańska-Chargot, M.; Zdunek, A. FT-IR and FT-Raman fingerprints of flavonoids—A review. Food Chem. 2022, 393, 133430. [Google Scholar] [CrossRef]
  34. Roxana, B.; Loghin, F.; Miere, D.; Fetea, F.; Socaciu, C. Romanian wines quality and authenticity using FT-MIR spectroscopy coupled with multivariate data analysis. Not. Bot. Horti Agrobot. 2014, 42, 556–564. [Google Scholar]
  35. Markham, K.R.; Mabry, T.J. Ultraviolet-Visible and Proton Magnetic Resonance Spectroscopy of Flavonoids. In The Flavonoids; Springer: New York, NY, USA, 1975; pp. 45–77. [Google Scholar] [CrossRef]
  36. Fengel, D.; Wegener, G. Wood: Chemistry, Ultrastructure Reactions; Walter de Gruyter: Berlin, Germany; New York, NY, USA, 1984. [Google Scholar]
  37. Şen, U.; Esteves, B.; Pereira, H. Pyrolysis and Extraction of Bark in a Biorefineries Context: A Critical Review. Energies 2023, 16, 4848. [Google Scholar] [CrossRef]
  38. Rodrigues, V.H.; de Melo, M.M.R.; Portugal, I.; Silva, C.M. Extraction of Eucalyptus leaves using solvents of distinct polarity. Cluster analysis and extracts characterization. J. Supercrit. Fluids 2018, 135, 263–274. [Google Scholar] [CrossRef]
  39. Vieira, P.G.; de Melo, M.M.; Şen, A.; Simões, M.M.; Portugal, I.; Pereira, H.; Silva, C.M. Quercus cerris extracts obtained by distinct separation methods and solvents: Total and friedelin extraction yields, and chemical similarity analysis by multidimensional scaling. Sep. Purif. Technol. 2020, 232, 115924. [Google Scholar] [CrossRef]
  40. Reis, S.F.; Lopes, P.; Roseira, I.; Cabral, M.; Mateus, N.; Freitas, V. Recovery of added value compounds from cork industry by-products. Ind. Crops Prod. 2019, 140, 111599. [Google Scholar] [CrossRef]
  41. Santos, S.A.O.; Pinto, P.C.R.O.; Silvestre, A.J.D.; Neto, C.P. Chemical composition and antioxidant activity of phenolic extracts of cork from Quercus suber L. Ind. Crops Prod. 2010, 31, 521–526. [Google Scholar] [CrossRef]
  42. Ferreira-Santos, P.; Genisheva, Z.; Botelho, C.; Santos, J.; Ramos, C.; Teixeira, J.A.; Rocha, C. M Unravelling the biological potential of Pinus pinaster bark extracts. Antioxidants 2020, 9, 334. [Google Scholar] [CrossRef] [Green Version]
  43. Santos, S.A.O.; Villaverde, J.J.; Sousa, A.F.; Coelho, J.F.; Neto, C.P.; Silvestre, A.J. Phenolic composition and antioxidant activity of industrial cork by-products. Ind. Crops. Prod. 2013, 47, 262–269. [Google Scholar] [CrossRef]
  44. Tanase, C.; Mocan, A.; Coșarcă, S.; Gavan, A.; Nicolescu, A.; Gheldiu, A.-M.; Vodnar, D.C.; Muntean, D.-L.; Crișan, O. Biological and chemical insights of beech (Fagus sylvatica L.) bark: A source of bioactive compounds with functional properties. Antioxidants 2019, 8, 417. [Google Scholar] [CrossRef] [PubMed] [Green Version]
  45. Deng, Y.; Zhao, Y.; Padilla-Zakour, O.; Yang, G. Polyphenols, antioxidant and antimicrobial activities of leaf and bark extracts of Solidago canadensis L. Ind. Crop. Prod. 2015, 75, 803–809. [Google Scholar] [CrossRef]
  46. Molina-Ramírez, C.; Castro, C.; Zuluaga, R.; Gañán, P. Physical Characterization of Bacterial Cellulose Produced by Komagataeibacter medellinensis Using Food Supply Chain Waste and Agricultural By-Products as Alternative Low-Cost Feedstocks. J. Polym. Environ. 2018, 26, 830–837. [Google Scholar] [CrossRef]
  47. González-Gaitano, G.; Ferrer, M.A.C. Definition of QC Parameters for the Practical Use of FTIR-ATR Spectroscopy in the Analysis of Surface Treatment of Cork Stoppers. J. Wood Chem. Technol. 2013, 33, 217–233. [Google Scholar] [CrossRef]
  48. Tarantilis, P.A.; Troianou, V.E.; Pappas, C.S.; Kotseridis, Y.S.; Polissiou, M.G. Differentiation of Greek red wines on the basis of grape variety using attenuated total reflectance Fourier transform infrared spectroscopy. Food Chem. 2008, 111, 192–196. [Google Scholar] [CrossRef]
  49. Scano, P. Characterization of the medium infrared spectra of polyphenols of red and white wines by integrating FT IR and UV–Vis spectral data. LWT 2021, 147, 111604. [Google Scholar] [CrossRef]
Figure 1. Maceration scheme of waste Quercus cerris cork.
Environments 10 00142 g001
Figure 2. Morphology of waste Q. cerris cork granule (on the left) and cork cells (on the right).
Environments 10 00142 g002
Figure 3. Extraction yields of waste cork extracts after a single-step extraction (E) (above) and after serial subsequent extractions (EI, EII, EIII) (middle), and extraction yields of waste cork extracts with 100% (Ace100) and 75% acetone (Ace75) after parallel extractions (EIV, EV) (below).
Environments 10 00142 g003aEnvironments 10 00142 g003b
Figure 4. The total phenolic content (TPC) of waste cork extracts after a single-step extraction (E) (above) and condensed tannin content of waste cork extracts after subsequent extractions (EI, EII, EIII) (below).
Environments 10 00142 g004
Figure 5. FRAP antioxidant activity of waste cork extracts after a single-step extraction (E) (above), DPPH antioxidant activity of waste cork extracts after subsequent serial extraction (EI, EII, EIII) (below).
Environments 10 00142 g005
Figure 6. Change in the CIELAB color parameters: L (above), a (middle), and b (below) of waste cork extracts after maceration of 1, 7, and 30 days.
Environments 10 00142 g006
Figure 7. Radar map of total color change (ΔE) in waste cork extracts with reference to 1 day extracts of pure solvents (100% water and 100% acetone).
Environments 10 00142 g007
Figure 8. Transmittance FT-IR spectra of different waste cork extracts (above), Transmittance FT-IR spectra of acetone (100%) waste cork extracts (below).
Environments 10 00142 g008
Figure 9. Relative flavonoid content of waste cork extracts after subsequent extractions (EI, EII, EIII) determined by UV-vis analysis.
Environments 10 00142 g009
Figure 10. Correlation of color parameters of pure water waste cork extracts (Water100) with time (days).
Environments 10 00142 g010
Figure 11. Relation of antioxidant activity (FRAP) and total phenolic content (TPC) of waste cork extracts. The bubble sizes show the relative extract content.
Environments 10 00142 g011
Figure 12. Bubble graphs showing the relation of growth inhibition diameter of B. cereus (above) and C. albicans (below) and total phenolic content (TPC) content of waste cork extracts after single extraction (E). The bubble sizes show the relative extract content.
Environments 10 00142 g012
Table 1. Maceration–extraction schemes for Quercus cerris waste cork. E: Single extraction, EI, EII, EIII: Subsequent extractions. EIV and EV: Parallel extractions. Numbers 1–7 indicate the order of solvents used in the serial or parallel extractions.
EEIEIIE IIIEIVEV
Time24 h24 h168 h720 h24 h168 h
Extract70 mL20 mL20 mL20 mL100 mL100 mL
Solvent-(%)
H2O-(100)E1EI1EII1EIII1
EtOH-H2O-(75/25)E2EI2EII2EIII2
MetOH-H2O-(75/25)E3EI3EII3EIII3
Acetone-H2O-(75/25)E4EI4EII4EIII4EIV2EV2
Acetone-H2O-(50/50)E5EI5EII5EIII5
Acetone-H2O-(25/75)E6EI6EII6EIII6
Acetone-(100)E7EI7EII7EIII7EIV1EV1
Table 2. Inhibition zones (mm) of waste cork extracts (0.5 mg/well) against tested microorganisms.
Water100EtOH75MetOH75Ace75Ace50Ace25Ace100PC
Gram-positive bacteriaS. aureusnd9.3 ± 0.6 ab10.0 ± 0.0 a9.0 ± 0.0 b10.0 ± 0.0 a9.8 ± 0.5 ab10.0 ± 0.0 a14.9 0.6 1
MRSAnd9.0 ± 0.8 b10.0 ± 0.8 ab10.5 ± 0.6 ab10.0 ± 0.0 ab9.5 ± 0.6 ab9.0 ± 0.0 b13.9± 0.7 1
E. faecalisnd7.5 ± 0.7 ab8.3 ± 0.6 ab7.8 ± 0.5 ab8.5 ± 0.6 a8.3 ± 0.5 ab7.3 ± 0.5 b12.5± 0.5 1
B. cereusnd10.8 ± 0.5 b12.0 ± 0.0 a12.1 ± 0.3 a11.5 ± 0.6 ab10.8 ± 0.5 b11.0 ± 0.0 b16.4± 1.1 1
S. mutansnd7.0 ± 0.0 b8.3 ± 0.6 ab8.7 ± 1.2 ab9.0 ± 0.0 a7.0 ± 1.0 b10.0 ± 0.0 a19.3± 0.6 2
S. mitisnd7.0 ± 1.0 c8.3 ± 0.6 bc8.0 ± 0.0 bc11.0 ± 1.0 a7.0 ± 1.0 c11.0 ± 1.7 ab25.7 ±0.6 2
Gram-negative bacteriaP. aeruginosandndndndndndnd25.3 ± 0.5 3
E. colindndndndndndnd19.5± 0.6 3
FungusC. albicansnd9.3 ± 1.2 b11.5 ± 0.6 ab13.3 ± 1.0 a10.8 ± 0.5 bnd10.0 ± 0.8 b36.8± 0.5 4
In each row, different letters denote significant differences (p < 0.05); PC—Positive control; 1 Vancomycin (5.0 µg); 2 Vancomycin (50.0 µg); 3 Ofloxacin (5.0 µg); 4 Ketoconazole (5.0 µg); nd: not detected.
Table 3. Two-way ANOVA results of CIELAB color parameters.
Source of Variation SSdfMSFp-ValueFcritical
L-valuesDays846.52423.36.955920.009873.88529
Solvents3356.86559.59.194070.000652.99612
Error730.21260.9
Total4933.520
a-valuesDays881.52440.87.584880.007423.88529
Solvents4448.66741.412.759130.000142.99612
Error697.31258.1
Total6027.420
b-valuesDays1703.72851.94.210360.041183.88529
Solvents7995.561332.66.586300.002872.99612
Error2427.912202.3
Total12,127.220
Table 4. Coefficient of determination (R2) values of color parameters of cork extracts with the duration of maceration extraction (day).
SolventsL-Value a-Value b-Value
Water1001.0000.9980.998
EtOH750.9930.8540.219
MetOH750.6320.6010.520
Ace750.7490.9850.154
Ace500.7590.6040.029
Ace250.6490.6060.390
Ace1000.5020.7370.903
Disclaimer/Publisher’s Note: The statements, opinions and data contained in all publications are solely those of the individual author(s) and contributor(s) and not of MDPI and/or the editor(s). MDPI and/or the editor(s) disclaim responsibility for any injury to people or property resulting from any ideas, methods, instructions or products referred to in the content.

