1. Introduction
Coastal lagoons and estuaries act as transition zones from land to ocean, where productivity is influenced by the connectivity of marine and freshwater sources [
1]. The salinity gradient (created by inputs of freshwater from river mouths), shallowness, and isolated nature of these bodies of water contribute to the success of its marine ecosystem [
2]. These areas are known for their high biological productivity that provides ecological services and economic value, supplying the world with half of the global fish catch per year [
1,
3,
4]. They also grant marine connectivity and function as nursery areas, which are essential for understanding population dynamics and gene flow [
3]. Coastal lagoons and estuaries are facing perilous conditions from anthropogenic impacts that lead to overall degradation, habitat loss, and eutrophic conditions [
1,
5,
6]. Climate change also threatens their biological systems due to increasing temperature, sea level rise, and irregular rainfall [
1,
6]. Many countries worldwide have implemented research programs to protect, manage, and monitor these essential ecosystems [
1,
4,
5,
7,
8]. The Indian River Lagoon (IRL), located on the Atlantic Coast of Florida in the United States, is just one of these highly productive areas currently exhibiting extreme anthropogenic stressors and is in dire need of protection.
The IRL is a narrow body of water composed of the Mosquito Lagoon, Banana River, and Indian River, stretching across 260 km of Florida’s eastern coast [
9]. The lagoon acts as a transition zone from a northern temperate biome to a southern subtropical biome and is well known for its biodiversity [
10]. Many benthic invertebrates, such as oysters, sponges, bryozoans, and tunicates, are filter feeders and transport suspended particles to the seafloor, effectively removing nutrients from the water column [
11]. The invertebrates within the benthic community in the IRL act as indicator species of the health of the lagoon, which has drastically declined in the last ten years due to human impacts [
12]. The environmental stressors include rising water temperatures, fluctuating salinity due to droughts and floods, water acidification, and hurricanes [
13]. In addition, climate change can trigger environmental stressors that alter the abiotic conditions of the lagoon [
10]. Although benthic organisms such as the Eastern Oyster (
Crassostrea virginica) oppose climate change through the sequestering of gases and removal of nutrients from the water column, the environmental conditions associated with climate change can alter oyster recruitment and filter feeding [
14]. Anthropogenic effects act as a catalyst for these climate-related conditions, having the potential to negatively impact the entire IRL ecosystem.
The environmental conditions within the IRL have high spatial variability that impacts its biological communities [
9]. Benthic filter feeders have thresholds and preferences for abiotic factors, such as temperature, salinity, acidity, etc., that influence settlement and recruitment [
15,
16,
17]. Settlement is driven by the environmental conditions that directly impact larvae’s ability to attach to a surface [
18]. There are often high mortality rates during the settlement stage due to predation, hostile environmental conditions, and other physical/ biological disturbances [
19]. Although it can be an ambiguous term, recruitment reflects the survival of the growth [
18]. It is important to analyze recruitment and settlement together to uncover the population dynamics of sessile organisms on hard substrates [
19]. For example, many benthic organisms have seasonal recruitment and reproduction rates that are driven by water temperature and salinity [
12]. Barnacle species in the IRL peak in the hotter summer months, while colonial encrusting bryozoans (
Hippoporina verrilli) peak in the cooler months, demonstrating seasonal patterns [
12,
17].
The Living Docks is a citizen-based program focused on Indian River Lagoon restoration. The goal of the program is to promote the growth of healthy and diverse benthic organism populations by the wrapping of oyster mats around dock pilings [
20]. The oyster mats are constructed of 0.61 m × 0.61 m (2 feet by 2 feet) plastic mesh with approximately sixty to eighty dried oyster shells attached to them. Local restaurants donate the dried oyster shells, contributing to the sustainability of the mats [
20]. As open space is considered prime real estate amongst benthic organisms, the oyster mats provide an additional and preferable calcium carbonate substratum for their settlement on the normally barren dock pilings. This not only encourages the success of the sessile benthic filter feeders but also provides a basis to support multiple trophic levels within the ecological community [
20]. There are currently sixteen docks in the program, with mats per dock varying by location [
21].
Three in-depth assessments of the Living Docks were conducted in October 2020, February 2021, and June 2021 to fully comprehend the amount of sessile and mobile benthic growth on the oyster mats [
21]. However, the immersion date of the oyster mats assessed in the study varied by dock, ranging from less than a year to several years. This caused ambiguity when identifying possible water quality factors that may have driven growth on the oyster mats. In addition, these assessments reported on the recruitment or established benthic communities growing on the Living Docks. To date, there have been no assessments that have looked at both settlement (initial growth) and recruitment (established growth) over a time period in relation to continuous water quality conditions directly associated with the Living Docks. Previous water quality measurements were collected from a one-time point or from sensors a fair distance away from the docks.
The objective of this project was to monitor the sessile benthic settlement and recruitment of the Living Dock communities at several locations in the IRL in comparison to specific environmental conditions. To achieve this, a six-month study was designed to assess and model how water temperature, salinity, pH, and turbidity affect organism settlement and recruitment to oyster mats. Water quality data were collected directly from each of the Living Docks to enhance the accuracy of the model. The results will lead to a better understanding of how the abiotic conditions within the IRL will influence settlement on Living Docks, which will be important for future deployments and long-term considerations for this restoration effort in a stressed ecosystem.
2. Materials and Methods
Four Living Dock oyster restoration mats were submerged for six months at four research sites (
Figure 1). Three of these locations—Cape Canaveral, Beachwoods, and the Manatee Observation and Education Center (herein referred to as the Manatee Center)—were community docks that had been established previously as part of the Living Docks program. The fourth site was a research barge located at Florida Tech’s Marine Center (herein referred to as the Anchorage) at the confluence of Crane Creek and the IRL (
Figure 1). While there are over a dozen established Living Docks [
21], not all provide easy access for researchers and volunteers to collect data on a routine monthly basis. Thus, the three Living Docks were chosen with this in mind, as well as their spatial distribution throughout the IRL. The Anchorage site was chosen because of its close proximity to campus and its use in previous oyster restoration studies. All locations also had the added benefit of being secure enough where theft of water quality sensors was not a concern.
Before the initial deployment, volunteers helped construct the oyster mats by attaching 60–80 drilled oyster shells of similar size to each mat with zip ties. Mat material was composed of a 0.61 m × 0.61 m (2 ft by 2ft) aquatic-grade plastic mesh [
8,
20]. On each oyster mat, four random shells were marked with a colored zip tie to denote a shell that would be replaced during the first monthly assessment (
Figure 2). These shells acted as monthly markers of benthic settlement. In November 2021, four “blank” oyster mats were wrapped around dock pilings at the three Living Dock locations, while another four “blank” oyster mats were suspended from frames at the Anchorage barge. While other options for non-plastic materials are becoming available, an ideal candidate has not been selected for the Living Dock restoration effort. Thus, this project was designed to specifically meet the objective stated above and not include any alternative materials. Monthly visual assessments were conducted at each site from November 2021 to April 2022. Due to COVID-19-related delays with sensors (see below), the study started later than anticipated and data collection was restricted to volunteer availability during the academic year. Thus, data were only collected for a six month period.
During the monthly assessments, the four oyster mats were removed from their respective pilings and briefly transferred onto the top of the dock for analysis. Eight oyster shells were analyzed for benthic growth by identifying organisms and denoting their percent cover on the shell; four represented settlement, while the other four signified recruitment. The four settlement shells—initially marked with colored zip ties—were replaced monthly with four more “blank” shells of similar size (about 8–9 cm long and 5–6 cm wide) that were also marked with new colored zip ties. The other four shells, representing recruitment, remained on the oyster mat for the duration of the study. Mobile organisms on the oyster mat at each research site were also denoted. Pictures were taken of each oyster mat and shells analyzed using a waterproof camera. For the assessments, the settlement refers to the initial growth observed on the oyster shells during a month of immersion; recruitment refers to the growth that had occurred after the first month of immersion. The methodology for the observation of settlement and recruitment was based on a study conducted by Wassick (2022), in which they used clear panels to track barnacle and encrusting bryozoan settlement and growth [
22].
HOBO conductivity and pH sensors were suspended from the docks at Cape Canaveral, Beachwoods, and the Anchorage (
Table 1). The HOBO conductivity sensor was already actively collecting data at the Anchorage (in a protective bag to prevent biofouling on the sensor). The other sensors were enclosed in a protective PVC housing, coated with antifouling paint. Holes were drilled into the bottom of the housing to allow water flow; fiberglass wool was used to block the holes to lower the chances of organisms settling on the sensors. When initially immersed, the sensors were aligned with the oyster mats to ensure data were collected from the same depth. During the monthly assessments, data were extracted from the HOBO sensors at each site. After each extraction, the sensors were removed from their protective housings and thoroughly cleaned with vinegar and a sponge to remove any unwanted settlement. The old waterlogged fiberglass wool was replaced with fresh wool each month. The monthly data extracted were added to a spreadsheet with all assessment data needed for the model. Ocean Research and Conservation Association (ORCA) data were used to represent the dock at the Manatee Center, since one of their Kilroy water stations was within proximity (<50 m) of the oyster mats (
Table 1). ORCA team members actively maintained the Kilroy stations to ensure accurate data.
Due to COVID-19 shipping delays, the pH logger for the Anchorage, IAP, and Beachwoods docks and the conductivity logger for the IAP and Beachwoods docks did not arrive before the initial deployment of the oyster mats in November 2021. Instead, in situ measurements taken during the deployments were used to represent the water temperature, salinity, and pH values for the first month of immersion. The continuous data collection for water temperature, salinity, and pH at the Cape Canaveral and Beachwoods docks and pH at the Anchorage began after the first visual assessment in December 2021 (
Figure A1c,
Figure A2a–c and
Figure A3a–c). Once the six months of data had been collected, the benthic settlement and water quality data were input into beta regression models using the betareg, car, and StepBeta packages in R [
23]. Five separate beta regression models were created to represent the benthic settlement of five of the most abundant organisms found on the oyster mats for both the recruitment and settlement data. In these models, the water quality data (temperature, salinity, pH, and turbidity) were used to attempt to predict the benthic settlement and recruitment of oysters, barnacles, encrusting bryozoans, sponges, and tubeworms. The beta regression method was chosen because the dependent benthic growth data were denoted as percent cover on the oyster mat shells, falling within the interval (0, 1) [
23].
Before the data were input into the model, all water quality and visual assessment data were compiled into one spreadsheet and cleaned. For the entire data collection period, daily means, minimums, and maximums were calculated for each water quality variable (water temperature, salinity, pH, and turbidity). The daily minimums, maximums, and means for each water quality variable were then averaged between the dates of each assessment, since only one value could be used to represent each water quality variable in the model. The differences between (delta) each daily minimum, maximum, and mean of the water quality values were also calculated and averaged between the assessment dates. The calculated averages of the daily means, maximums, minimums, and deltas of the water quality values between each assessment acted as the predictor variables for each model. The average percent cover of oyster, barnacle, encrusting bryozoan, sponge, and tubeworm was calculated for both the benthic recruitment and the settlement communities at each site, acting as the response variables in the models. Using a stepwise function called StepBeta, a total of three models were created per organism using the minimum, maximum, and mean water quality values. The “best” model was chosen by comparing the three models’ AIC and pseudo-r2 values; the model with the lowest AIC value and highest pseudo-r2 value was considered the best. The best recruitment and settlement models for each organism were then compared.
A permutation multivariate analysis of variance (PERMANOVA) was performed on the benthic community data using the vegan package in R. This analysis determined whether the location of the research sites, the immersion time, and the recruitment and settlement shell types had an impact on the Living Dock oyster mats’ benthic community. The Bray–Curtis index of similarity method was chosen to perform the PERMANOVA on the benthic community data. The data were formatted into a similarity matrix in the same fashion as a repeated measures ANOVA test. The results of the PERMANOVA were graphed as a non-metric multidimensional scaling (MDS) plot with the ggplot2 and BiodiversityR packages in R. Distinguishable data clusters were circled on the MDS plot to highlight significant differences among the three variables. The stress of the MDS plot was then determined to assess the quality of the data represented.
3. Results
During the study, which spanned from November to April, spatiotemporal changes in the benthic community were noted. The benthic organisms observed on the oyster mats at all four research sites for the duration of this study included the following functional groups: barnacles, oysters, mussels, bryozoans (encrusting, arborescent, and spaghetti), sponges, anemones, hydroids, tunicates, crown conch egg sacs, calcareous tubeworms, feather duster worms, and slipper snails. Biofilm—a slimy film of bacteria and other microbial organisms—and algae also settled on the oyster shells. Of the organisms present, those that were dominant were encrusting bryozoans, barnacles, calcareous tubeworms, hydroids, and sponges. The mobile organisms observed on the mats at all four research sites included crabs (mud, stone, porcelain, decorator, blue, mangrove, and hermit), shrimp (snapping and glass), goby fish, worms (flat and segmented), a nudibranch, crown conchs, gastropods, amphipods, and isopods.
Collected community data suggested that the recruitment and settlement had a similar community structure at the beginning of the study but diverged over time (
Figure 3). The recruitment shells were almost fully covered by the second month, while the settlement shells never became fully covered in their month of immersion. The following sections describe notable observations for the recruitment and settlement of the benthic community at each research site.
Anchorage (
Figure 3a): At this site, which is located on the confluence of a tributary to the IRL (Crane Creek), the benthic community was typified by barnacle (about 18–35% covered the recruitment shells and about 0–27% the settlement shells), encrusting bryozoan (about 5–31% covered the recruitment shells and about 4–18% the settlement shells), and calcareous tubeworm (about 1–29% covered the recruitment shells and about 1–37% the settlement shells). Biofilm dominated the settlement shell (about 19–68% of the shell covered), while algal growth was consistent on both shell types (about <7% of the shell covered). A population of calcareous tube worms formed during the fourth month on both the settlement (about 40% of the shell covered) and the recruitment (about 20% of the shell covered) shells and was retained on the recruitment shells through the remaining time of the study. Similar amounts of hydroid growth (about 1–16% of the shell covered) were found on both shell types for the entire duration of the study. There was an increase in tunicate growth (about 5% covered the recruitment shells and 11% covered the settlement shells) in month four that perished by month five. This site also had a presence of mussels.
Cape Canaveral (
Figure 3b): This is the northernmost site located in Banana River of the IRL. The benthic community was typified by encrusting bryozoan (about 31–70% covered the recruitment shells and about 25–65% the settlement shells), algae (about 5–22% covered the recruitment shells and about 8–30% the settlement shells), hydroid (about 0.1–24% covered the recruitment shells and about 0.6–20% the settlement shells), and anemones (about 0.1–5% covered both the recruitment and about 0–5% settlement shells). Encrusting bryozoan dominated both the recruitment and the settlement shells throughout the study. Anemone populations appeared in month two on both shell types and the population was retained and grew (about 5% of the shell covered) for the rest of the study period. Slightly more sponge was found on the settlement shells during months four (about 8% of the shell covered) and five (about 3% of the shell covered). A decline in barnacle growth was seen between months two to four in both the settlement and recruitment communities. This site also had a presence of slipper snails; however, no oysters were observed at this site during the study period.
Beachwoods (
Figure 3c): At this site, which is located in the central IRL, the benthic community was typified by encrusting bryozoan (about 37–65% covered the recruitment shells and about 13–65% the settlement shells), barnacle (about 0.1–12% covered the recruitment shells and about 0–59% the settlement shells), and hydroid (about 0.9–6% covered the recruitment shells and about 3–10% the settlement shells). A significant increase in the barnacle population developed on the settlement shells during the third month of the study and continued to grow on both shell types for the remainder of the time. Encrusting bryozoan dominated both shell types for the entire length of the study. Tunicate was steadily observed throughout the study on both shell types (about 1% of the shell covered) except for month three (0% covered). An increase in oyster growth occurred on the recruitment shells during the fourth month of this study (about 2% of the shell covered) and was retained the following month (about 3% covered). The benthic communities on the recruitment and settlement shells began to diverge during the third month of this study.
Manatee Center (
Figure 3d): This is the southernmost site located on a tributary to the IRL (Moore’s Creek) and near the Fort Pierce Inlet. The benthic community was typified by sponge (about 4–37% covered the recruitment shells and about 0–33% the settlement shells), oyster (about 0–17% covered the recruitment shells and about 0–1% the settlement shells), and encrusting bryozoan (about 1–16% covered the recruitment shells and about 0.2–14% the settlement shells). This site was dominated by a mucky biofilm for the entire duration of the study (about 16–61% covered the recruitment shells and about 28–52% the settlement shells). An increase in the oyster population on the recruitment shells occurred during month three (about 3% of the shell covered). The oyster population on the recruitment shells was maintained and grew throughout the remainder of the study period (about 17% of shells covered by month five). A small tunicate population was retained on the recruitment shells (about 2–9% covered). Except for oyster growth, the recruitment and settlement of the benthic communities shared similar organisms but on different scales throughout the study. This site had the largest population of arborescent bryozoan (about 0–2% of the shell covered), which were prevalent (about 2% of the shell covered) for the first three months of the study. The results of the MDS and PERMANOVA analysis for this project identified significant benthic community differences amongst the location of the research sites, immersion time (months one through five), and shell type (recruitment vs. settlement). From the analysis, the immersion time and dock variables were statistically significant, while shell type and the combined effects or interactions between the variables were not (
Table 2). The R
2 for immersion time (0.130), shell type (0.006), the interaction between immersion time and dock (0.116), and the interaction between dock and shell type (0.035) were less than the residual R
2 value (0.240) (
Table 2). Thus, the results of significance were not meaningful for the immersion time variable. The R
2 for dock location (0.472) was greater than the residual R
2 value (0.240), suggesting that the significance of the dock location was meaningful for this benthic community dataset (
Table 2). Therefore, the data could be separated into distinguishable clusters based on the dock location in the MDS plot.
Figure 4 illustrates the relationship and interactions between the three variables in a single MDS plot. The MDS model for these data had a stress of 0.164, indicating that there was minimal data distortion (
Figure 4). The circles represented the distinguishable clusters of the benthic community data, separating the data by dock location in the Indian River Lagoon to a certain degree. The Beachwoods and Cape Canaveral benthic community data blended homogeneously together, forming one large group. The benthic community data at the Manatee Center were isolated from the other three docks. The Anchorage community data were also distinguishable, except for a couple of points that intermixed with the Beachwoods and Cape Canaveral group. There was no clear distinction between the recruitment and settlement of the benthic community at each research site. However, immersion time was discernable at each location, compared with the mixing of longer immersion times.
Figure A1a–c,
Figure A2a–c,
Figure A3a–c and
Figure A4a–c illustrate how the daily minimums, means, and maximums of water temperature, salinity, and pH changed over the study period at each dock location.
Figure A1d,
Figure A2d,
Figure A3d and
Figure A4d represent the in situ turbidity measurements taken at each site before each assessment with the YSI turbidity sensor. The raw water quality data were utilized to model the recruitment and settlement of benthic organisms on the Living Dock oyster mats.
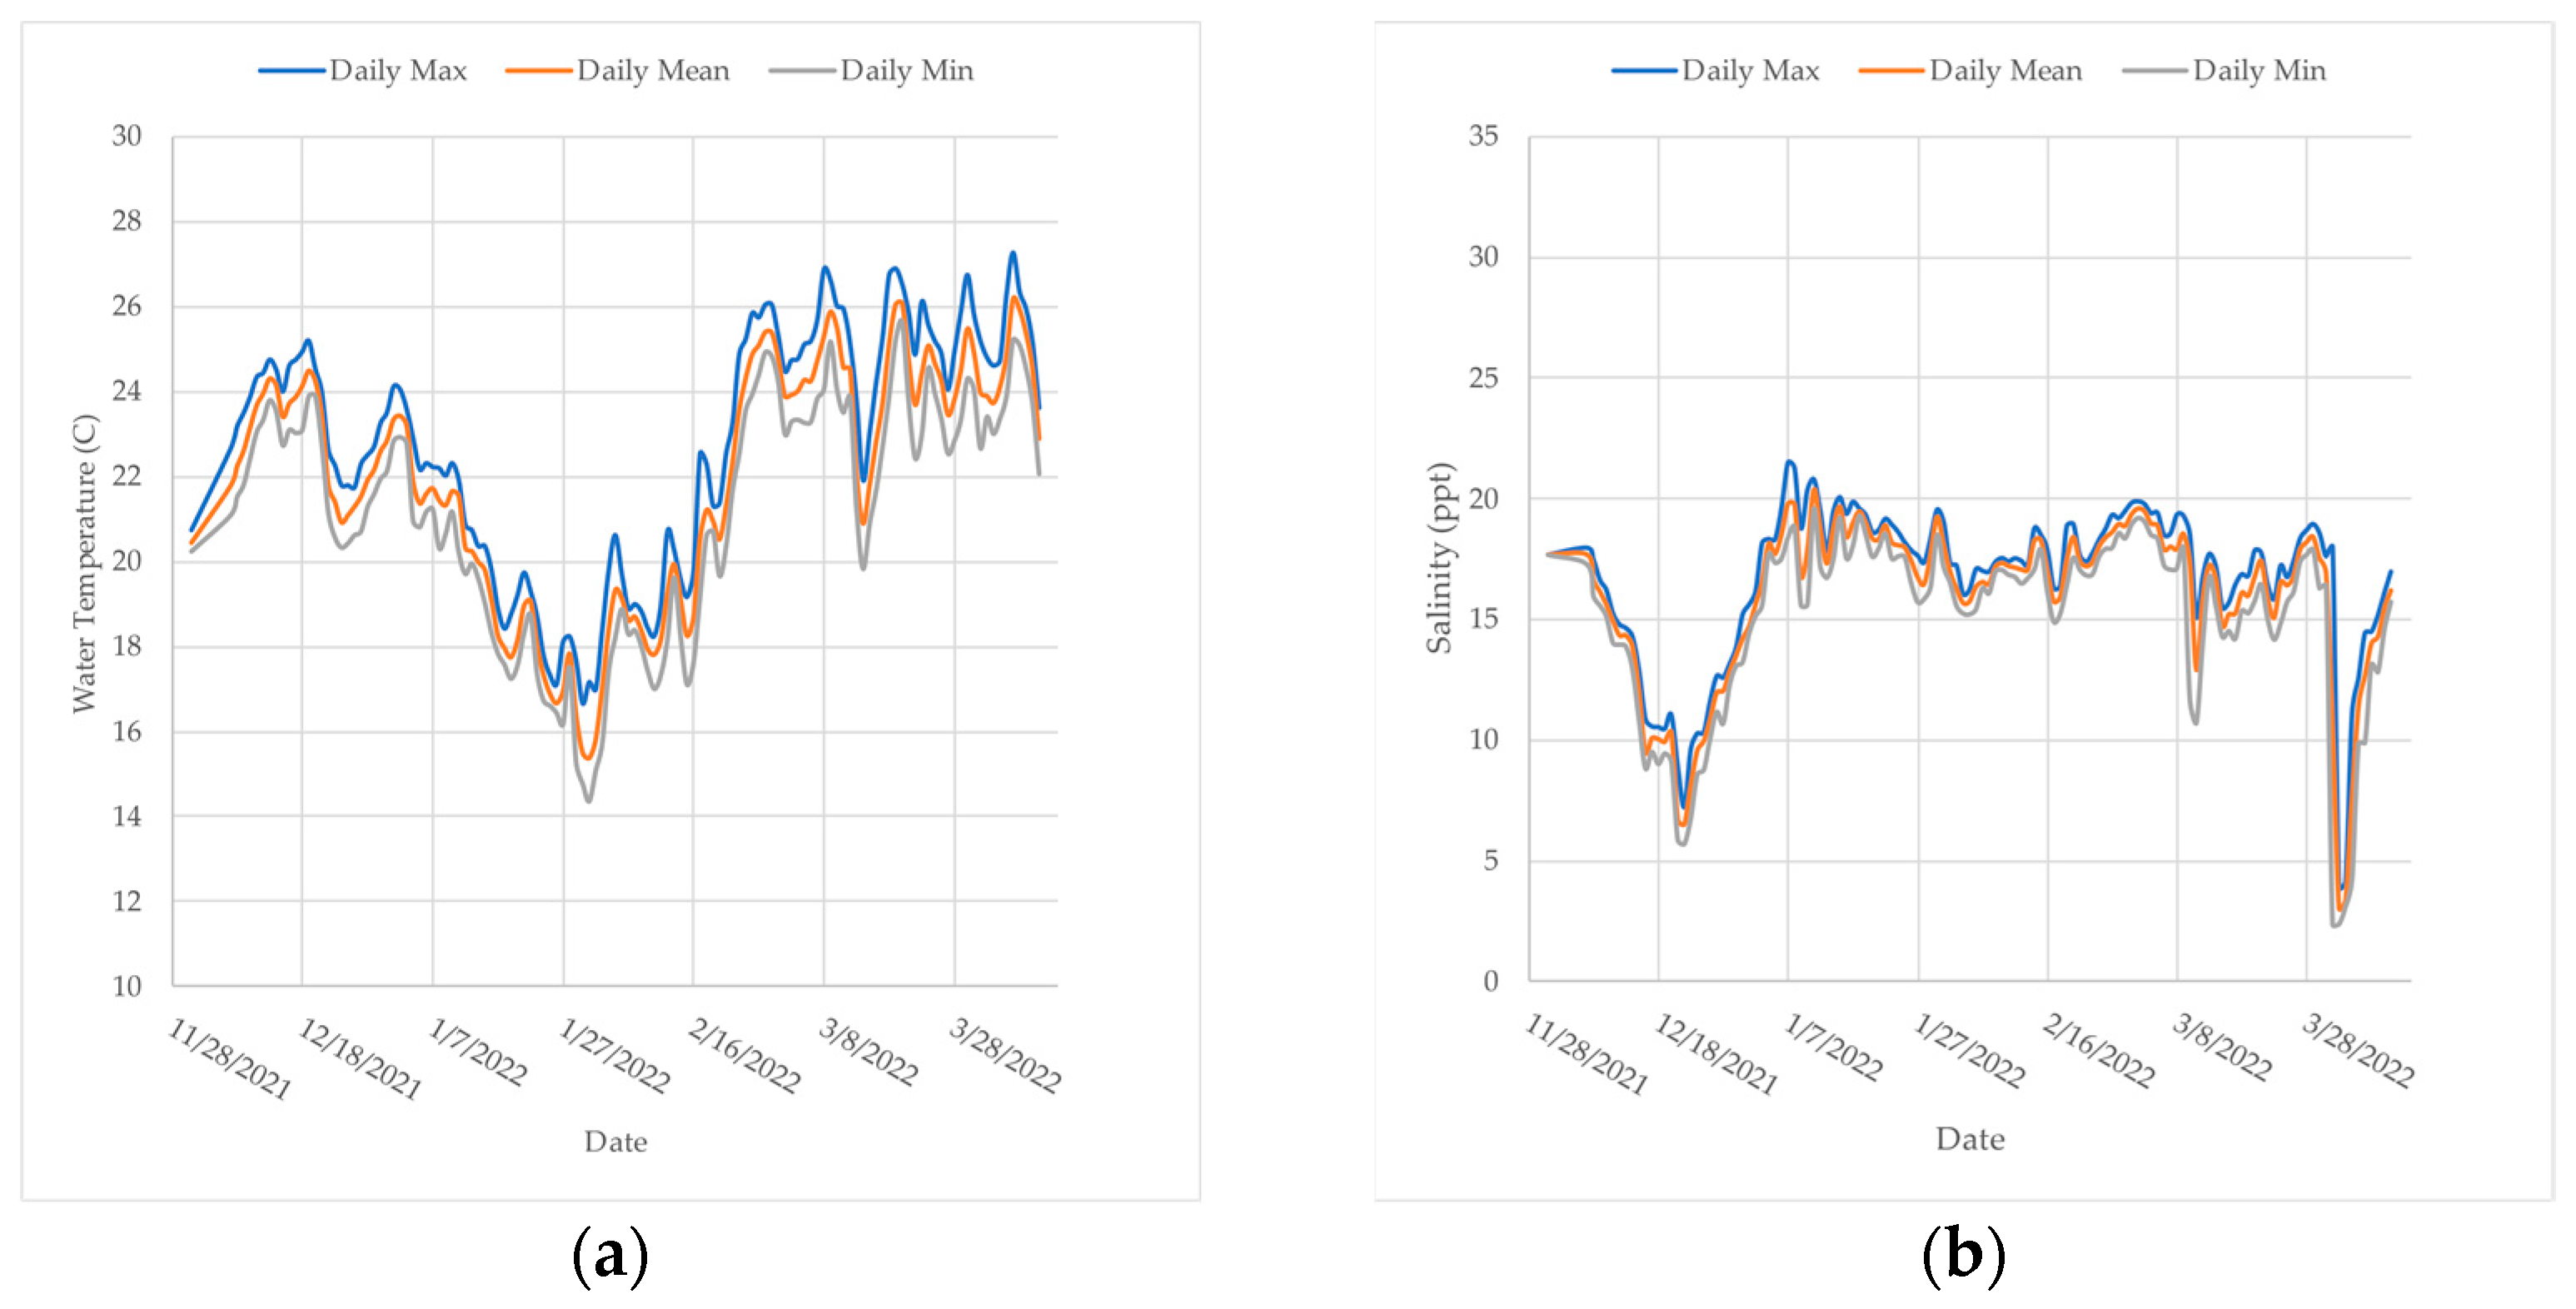
Anchorage (
Figure A1): Water temperature ranged between 14 and 28 °C at this site. The water temperature was lowest between January and February 2022 (
Figure A1a). This site had the lowest salinity levels, fluctuating between about 2 and 22 ppt (
Figure A1b). The pH remained at a neutral to slightly basic level throughout this study (
Figure A1c). There was a significant decrease in minimum pH in January 2022 (about 7). Turbidity was highest in December 2021 (7 FNU) and lowest in February 2022 (2 FNU) (
Figure A1d). The turbidity lowered between January and February 2022 (2 FNU) but increased between March and April 2022 (6 FNU) (
Figure A1d).
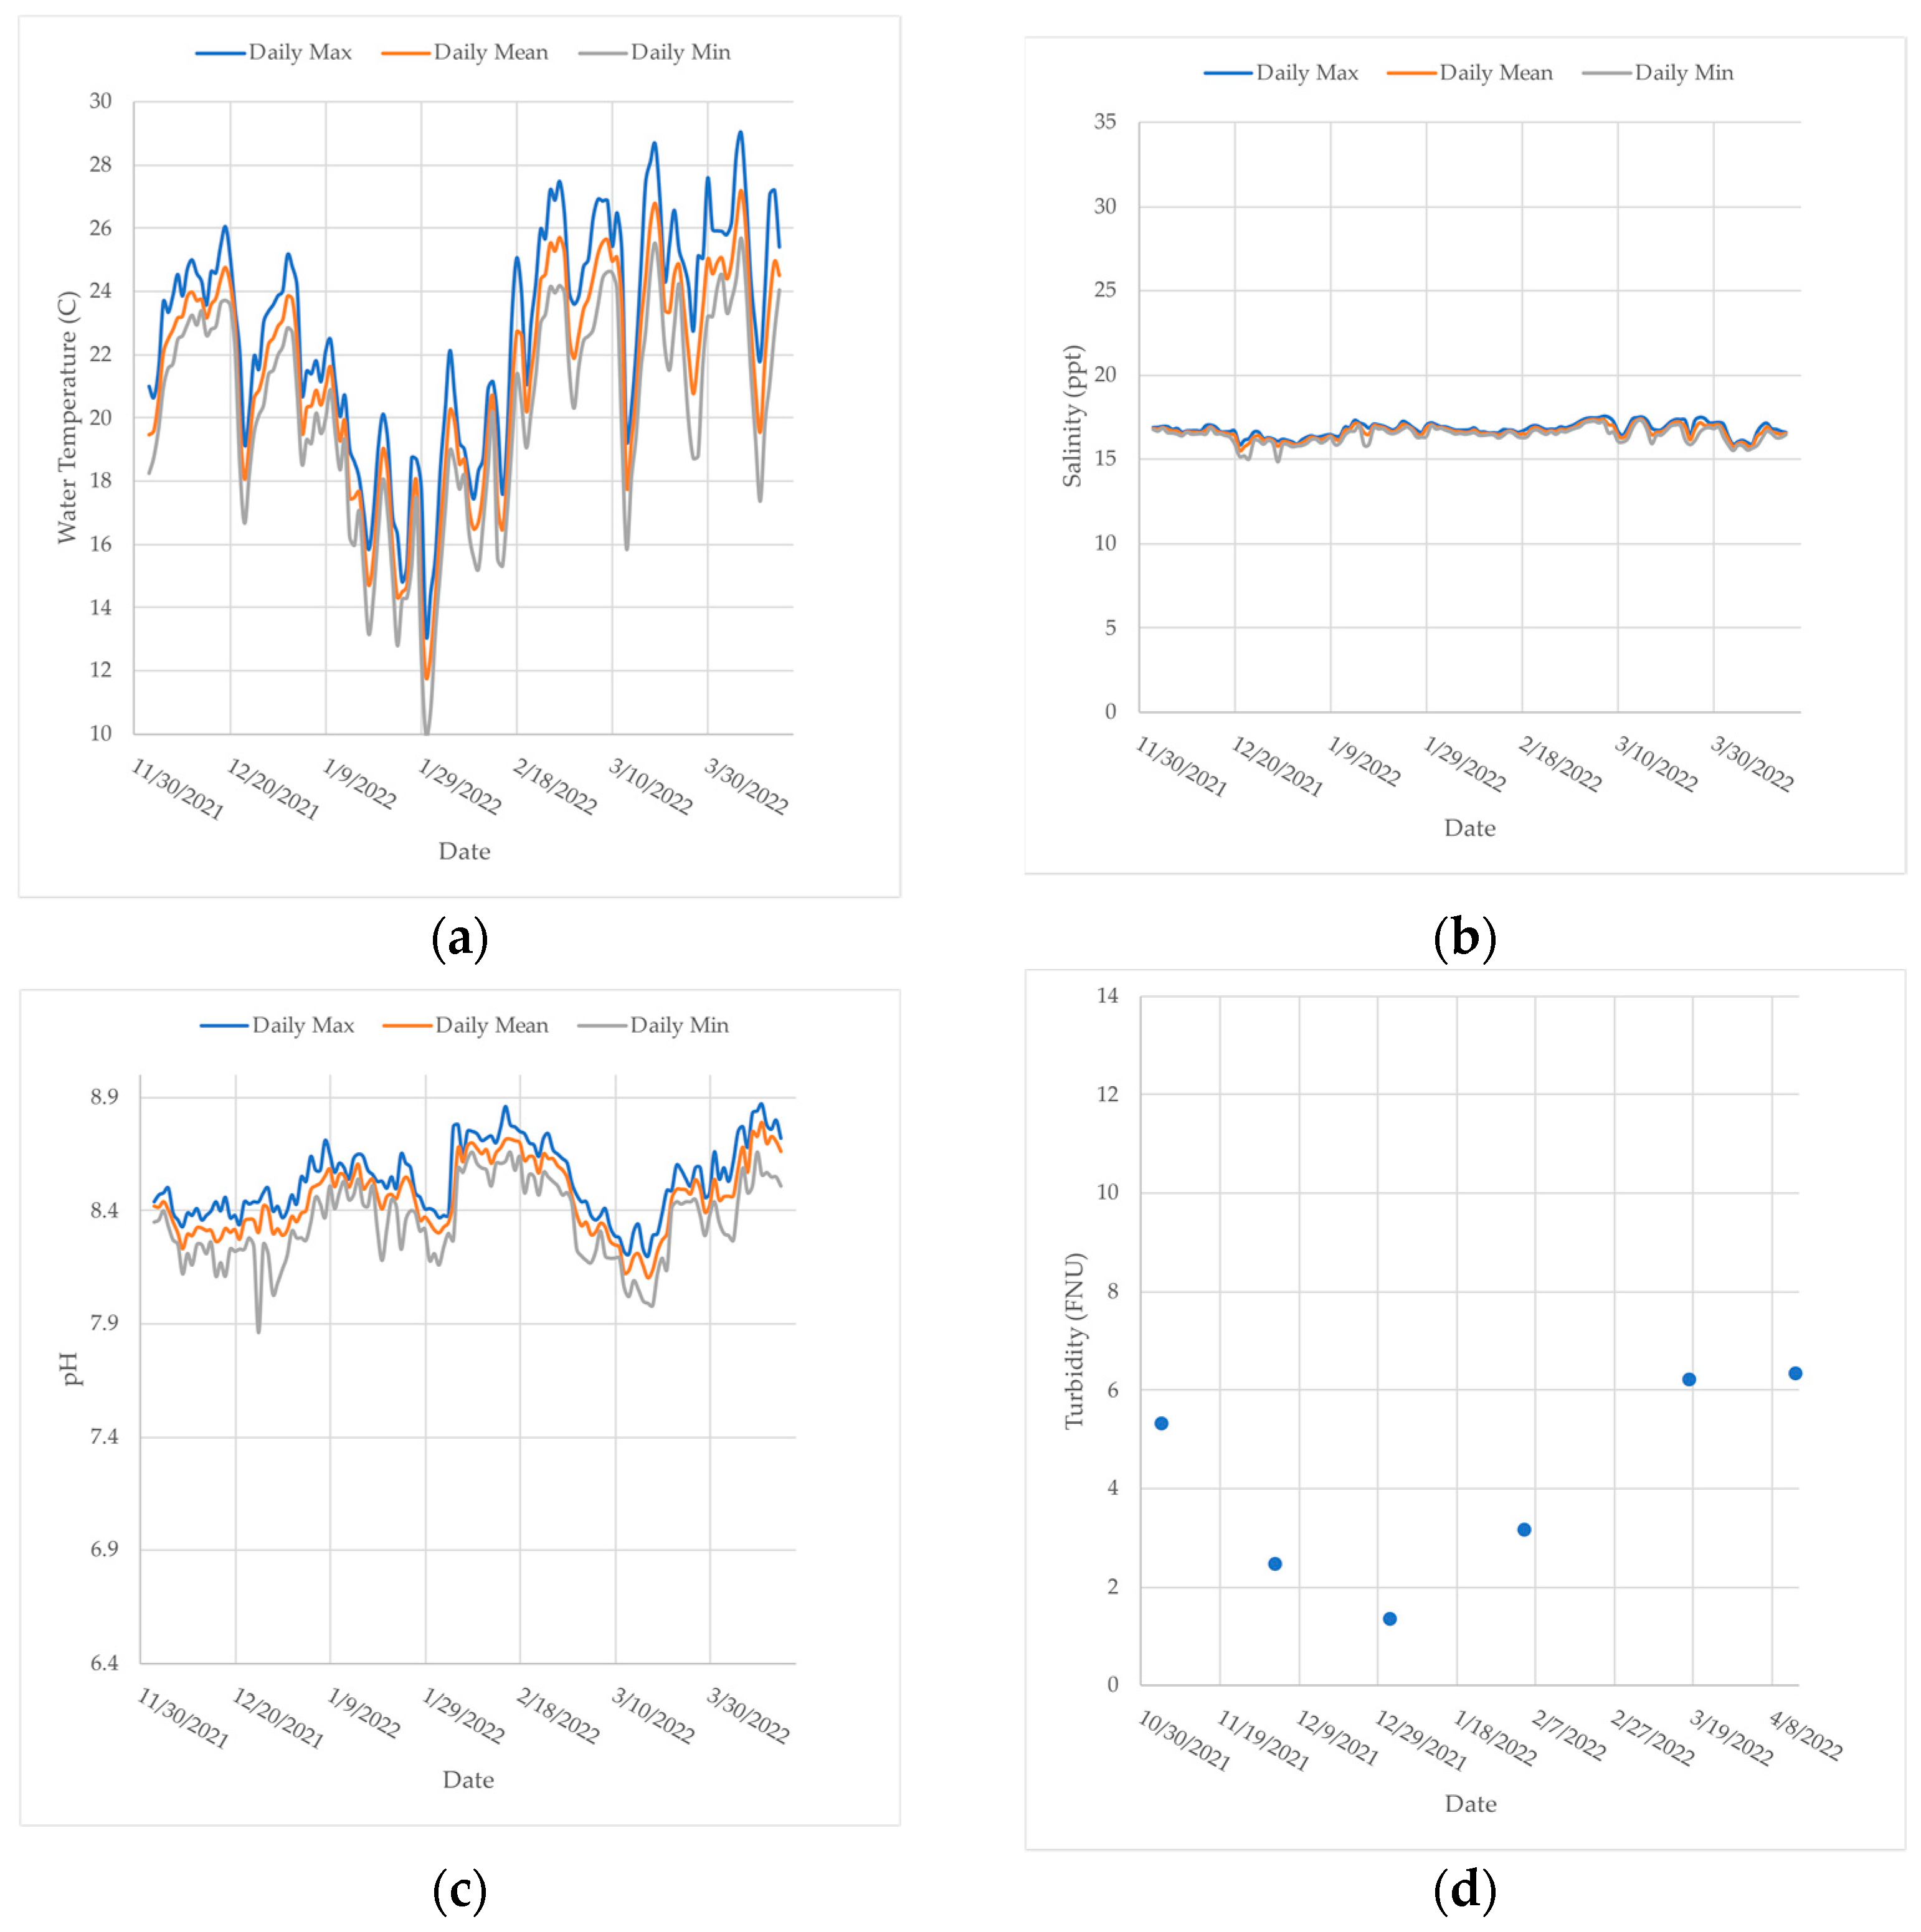
Cape Canaveral (
Figure A2): Water temperature ranged between 9 and 29 °C and was the lowest between January and February 2022 (
Figure A2a). This site had the lowest measured water temperature values of all the sites (
Figure A1a,
Figure A2a,
Figure A3a and
Figure A4a). The salinity fluctuated between 15 and 17.5 ppt, similar to the Beachwoods dock (
Figure A2b and
Figure A3b). There was a significant drop in minimum salinity in December 2021 (
Figure A2b). The pH remained slightly basic at about 7.9–8.9 throughout the study (
Figure A2c). Turbidity was highest in April 2022 (about 6 FNU) and lowest in December 2021 (about 1 FNU) (
Figure A2d). A similar trend in turbidity to the Anchorage site was observed, where turbidity decreased during the winter months and then increased in the spring (
Figure A1 and
Figure A2d).
Beachwoods (
Figure A3): Water temperature ranged between 10 and 28 °C and was coldest between January and February 2022 (
Figure A3a). The salinity levels ranged from about 14–21 ppt but were consistently fluctuating between 16 and 18 ppt (
Figure A3b). The pH was slightly basic, between 7.5 and 8.5 throughout most of the study (
Figure A3c). There was a significant decline in the daily minimum pH in early January at the Beachwoods dock, which did not fall below 6.5 (
Figure A3c). Turbidity was highest in April 2022 at about 10 FNU and lowest in January 2022 at about 2 FNU (
Figure A3d). A similar turbidity pattern to the Anchorage and IAP sites was observed, where turbidity decreased during the winter and increased at the beginning of spring (
Figure A1d,
Figure A2d and
Figure A3d).
Manatee Center (
Figure A4): Water temperature ranged between 15 and 28 °C and was coldest between January and February 2022 (
Figure A4a). The salinity levels were higher at this site than the others throughout most of the study and had the widest range of about 5–35 ppt (
Figure A4b). There was a significant drop in the salinity levels at this site from the end of February through mid-April (
Figure A4b). The pH remained moderately basic throughout this study (7.7–8.8) (
Figure A4c). There was also a significant increase in pH levels between December 2021 and January 2022 (
Figure A4c). This site also had the highest turbidity measurements of all the docks and was constant at about 10 FNU throughout the study (
Figure A4d). Turbidity was highest in January 2022 at about 12 FNU and lowest in December 2021 at about 4 FNU (
Figure A4d).
Table 3 represents how water quality variables drove the recruitment and settlement of the benthic community on the Living Dock oyster mats. A “best” recruitment and settlement model was selected from the three (minimum, maximum, and mean) models for each benthic organism. The following results indicate the major drivers of each benthic organism on the Living Dock oyster mats based on the data collected over the immersion period.
Oysters: The recruitment and settlement models indicate that oyster growth on the mats was driven by minimum values of the water temperature, salinity, and pH. Salinity had a negative relationship with both oyster recruitment and settlement. Oyster recruitment was positively influenced by immersion time and turbidity. Recruitment was also negatively influenced by pH. The Manatee Center dock location was found significant for oyster settlement, while all four dock locations were found significant for oyster recruitment. Although the oyster recruitment model was driven by more factors, the settlement model was considered the better model since the AIC value was lower (−890.330) and it had a higher pseudo-r
2 value (about 77.8% of variation explained) (
Table 3).
Barnacle: The recruitment and settlement models indicate that barnacle growth on the mats was driven by maximum values of the water temperature, salinity, and pH water quality parameters. Both barnacle recruitment and settlement were negatively influenced by pH. Barnacle recruitment had a positive relationship with water temperature and salinity. Barnacle settlement had a positive relationship with turbidity. Barnacle settlement was also almost significantly and positively influenced by the average daily change in salinity. The Manatee Center dock location was found significant for barnacle settlement, while all four dock locations were found significant for barnacle recruitment. The barnacle recruitment model was the better model of the two models since the pseudo-r
2 was higher, explaining 72.35% of the variation, and the AIC value was lower (−300.214) (
Table 3).
Sponge: The recruitment and settlement models indicate that sponge growth on the mats was driven by minimum values of the water temperature, salinity, and pH water quality parameters. Sponge recruitment was positively influenced by the immersion time and negatively influenced by pH. Both sponge recruitment and settlement were negatively driven by salinity. Turbidity almost had a significant positive relationship with sponge settlement. All four dock locations were found significant for sponge settlement, while the IAP and Manatee Center dock locations were found significant for sponge recruitment. Although the settlement model had the lower AIC value of the two models (−414.465), the recruitment model was the best of the two models since it had a higher pseudo-r
2 value (about 64.5% of variation explained) (
Table 3).
Tubeworm: The recruitment model indicates that calcareous tubeworm growth on the mats was driven by maximum values of the water temperature, salinity, and pH water quality parameters. The settlement model denotes that the tubeworm growth was driven by the mean of the same water quality parameters. Both models suggest that tubeworm growth was positively driven by pH and the average daily change in pH (ΔpH). Tubeworm recruitment was also positively driven by the immersion time, water temperature, and the average daily change in salinity (Δsalinity). Tubeworm settlement was negatively influenced by turbidity and salinity. All four dock locations were found significant for both tubeworm recruitment and settlement. The recruitment model was considered the better model between the two since the AIC value was more negative (−536.812) and it had a higher pseudo-r
2 value (about 86.57% of variation explained) (
Table 3).
Encrusting Bryozoan: The recruitment model indicates that encrusting bryozoan growth on the mats was driven by mean values of the water temperature, salinity, and pH water quality parameters. The settlement model denotes that encrusting bryozoan growth was driven by the maximum of the same water quality parameters. Encrusting bryozoan recruitment was negatively influenced by salinity and the average daily change in pH (ΔpH). The Beachwoods and Cape Canaveral dock locations were found significant for both encrusting bryozoan recruitment and settlement. The encrusting bryozoan recruitment model was considered better than the settlement since the AIC value was lower (−158.79) and it had a higher pseudo-r
2 value (about 78.95% of variation explained) (
Table 3).
4. Discussion
The location of the Living Docks greatly influenced what grew on the oyster mats due to the high spatial variability of benthic communities within the IRL. This is not surprising, as the IRL has variability with many freshwater creek inputs and oceanic inlets that influence the biological systems [
9]. The northern part of the IRL has a negligible tidal impact and is influenced by freshwater inputs of creeks and canals that connect the lagoon [
24]. The benthic community at the Anchorage is greatly influenced by a freshwater source and lower salinity, distinguishing itself from the other three research sites. Mussel and tubeworm populations were more abundant and prevalent there than at the other three research sites. The Manatee Center, the southernmost location, also stood out as having a distinct benthic population. The Manatee center is located within Moore’s Creek and is about 4 km (less than 2.5 miles) southwest of the Fort Pierce Inlet. Since the dock is within the vicinity of an inlet, the tides affected water level changes and biological movement [
11,
24]. The inlet provides constant flushing of the lagoon and stable environmental conditions, resulting in flourishing populations of oysters, sponges, and tunicates that are not as abundant or diverse in the northern research sites [
11]. However, the entirety of the growth on the oyster mats at this site was covered in silt due to the mucky nature of this site and the influence of Moore’s Creek. The two other docks—Cape Canaveral and Beachwoods—are located in the Banana River and central Indian River, respectively. These sites have similar benthic growth on the oyster mats because they are located in the northern part of the lagoon, where residence times are longer due to the increasing distance from the southern inlets [
24]. These sites are dominated by barnacle and encrusting bryozoan populations, lacking in diversity due to their vast distance from the Sebastian Inlet [
11]. Both Gilligan et al. (2022) and Hunsucker et al. (2021) also observed a high spatial variation within the benthic community at different Living Dock sites within the IRL [
8,
25]. Therefore, it is not surprising, based on the nature of the IRL and previous studies, that dock location had a significant influence on benthic recruitment and settlement.
In addition to observing the recruitment of benthic organisms to the oyster shell substrates, growth was also observed on the mats themselves, adding to complete encrusting and cementing the mats to the pilings. This has previously been reported by Gilligan et al., 2022 [
8]. These two processes, encrusting and cementing, prevent the plastic from degrading and becoming free-floating in the environment and help to alleviate some concerns of plastic pollution into the IRL. While the aquaculture grade mats were used during the current study, there is ongoing work occurring in estuaries around the world to refine the design and reduce or eliminate the use of plastics for restoration efforts [
26]. Specifically, with regards to Living Docks, it has been found that natural fibers (e.g., jute, coconut choir) are not strong enough to withstand the immersion long enough for the organisms to cement to the piling [
27]. Cathodically protected steel was tested as an alternative, with promising results, but still needs continued research to fine tune the electrochemistry [
25]. And recently, for oyster reef restoration, research with field testing of a potato-based starch polymer has shown success [
28]. The challenges in materials selection for the dock-affixed oyster mats include the need to withstand the constant fatigue from wave energy impacting the pilings and the resistance to degradation from corrosion, biofouling, or chemical processes. While non-plastic materials are available, the ideal candidate is not yet known. Thus, future work would benefit from incorporating some of these materials into the experimental designs.
Analyzing the relationship between settlement and recruitment is vital to understand the temporal variability of the benthic community on the Living Dock oyster mats [
18]. The recruitment and monthly settlement of the benthic community varied by dock location, as well as over the study period. The settlement was directly impacted by the environmental and biological cues that lure larvae to the oyster mats. The recruitment represented the survival and growth of the established sessile organisms [
18]. Since new oyster mats with “blank” oyster shells were initially deployed, the recruitment and settlement of the benthic community paralleled one another for the first two months of the study. The two communities began to diverge as the immersion time increased and similar organisms were observed at different scales on the settlement and recruitment shells. An example of this was seen at the Anchorage dock through the retention of the tubeworm population in month four on the recruitment shells and the loss of this population on the settlement shells. Populations of sessile organisms such as oysters, tunicates, tubeworms, and mussels were prevalent on the recruitment shells, succeeding the settlement community each month. However, a higher percentage of barnacle cover was recorded on the settlement shells than on the recruitment shells. This may have been due to other benthic organisms such as sponges and algae covering the barnacles, so they were not visible during an assessment (personal observations).
The recruitment and settlement of the benthic community observations from this study were used to determine the water quality parameters that drive benthic growth. Previous studies in both coastal and freshwater environments have used a similar approach [
29,
30]. According to the recruitment models for the five benthic organisms, immersion time, dock location, salinity, and pH were the most prominent drivers of benthic recruitment. The immersion time was significant for oysters, tubeworms, and sponges but not barnacles and encrusting bryozoans. This was because barnacle and encrusting bryozoan growth were common on the oyster shells at all the Living Dock locations throughout this study. These two organisms have dominated the Living Dock mats during previous visual assessments [
8]. The settlement models of the five organisms also implied that salinity, pH, and dock location were significant drivers, along with the addition of turbidity. The model results demonstrated that higher turbidity caused an increase in sponge and barnacle settlement and a decline in tubeworms. Benthic organisms such as sponges and barnacles acquire nutrients from suspended particles in the water column [
31]. Higher turbidity can “clog” and smother benthic organisms, which may be why turbidity had less of an effect on the recruitment of the benthic community since the populations on the shells were more established [
31,
32]. For oyster restoration efforts where mats are placed along estuarine bottoms, total sediment loads as well as the percent silt/clay have shown to increase along reefs with higher human impacts, resulting in a significant reduction in the survival of juvenile oysters [
33].
Many of the model results indicated that a lower pH caused an increase in benthic growth. A lower more acidic pH can cause the dissolution of shells and is harmful to sessile calcareous organisms and larvae [
13]. The model results may be due to the small range of relatively neutral pH values of about 6.5 to 8.5 that occurred throughout the study. The acidity of the lagoon was preferred by the calcareous oysters, barnacles, sponges, tubeworms, and encrusting bryozoan modeled in this study [
13]. The models also suggested that lower salinity yielded more benthic growth. Encrusting bryozoans commonly occurred in less than 30 ppt, explaining the thriving encrusting bryozoan populations on the oyster mats at the Anchorage, Cape Canaveral, and Beachwoods locations [
19]. The salinity at the Manatee Center was higher than the other sites (20–30 ppt), which could support healthy adult oyster populations [
27]. There were abrupt drops in salinity at the Anchorage, Cape Canaveral, and Manatee Center sites during the last two months of the study (March–April 2022) that may have been due to an increase in rainfall [
12]. Overall, the models proved that benthic recruitment and settlement on the Living Dock oyster mats were driven by slightly different water quality factors.
Barnacle and tubeworm recruitment were the only benthic organisms driven by water temperature, where higher temperatures generated more growth. There was a decrease in barnacle cover on both the recruitment and settlement shells that coincided with the colder winter months. Barnacles are known for their seasonal distributions and higher reproduction rates during warmer months, explaining the decline in the barnacle population during months 2–4 (January–February) [
12]. Encrusting bryozoans, however, preferred cooler water temperatures, thriving and dominating the oyster shells throughout this mostly winter study [
17]. Similar results were observed in the Gilligan (2021) study, where seasonal distributions of the benthic organisms were found to be significant [
21], as well as others working in the IRL, who have shown that water quality drives benthic growth and recruitment [
11,
14,
17,
34]. The connection between benthic survival and water quality is not a new one and has been studied in coastal estuaries throughout North America, as well as the world [
35,
36]. However, for Living Dock restoration—which is increasing in abundance throughout the IRL—understanding the connection is important and will be useful when selecting sites for future Living Docks, especially considering the changes being imparted on the system by anthropogenic stressors [
37,
38,
39]. For example, there has been interest in implementing the efforts in areas that have lower saline conditions, as well as sites which have a softer sediment (easily suspended) bottom. Using the data provided in the current study will provide a baseline knowledge between the relationship of the benthic community development and the environmental parameters. Thus, aiding in determining the potential success of a Living Dock in a specific location is a critical component of restoration efforts [
40].
The above-discussed study occurred over a short period of time, from November 2021 to April 2022, for reasons discussed above. Ideally, the study would have occurred over the course of a year or longer to allow for true seasonality in the benthic settlement and recruitment. A longer immersion time may have also resulted in prominent environmental changes that would have allowed for observations as to how Living Dock communities are impacted by sudden changes to water quality. For example, Wassick et al. (2021) reported how cold snaps, algal blooms, and tropical cyclones significantly impacted benthic invertebrate communities in the IRL from 2008 to 2019 [
12]. Regardless of the time period of the study, the field data, combined with the modeling approach, highlighted how water quality conditions at the restoration sites throughout the IRL impact the recruitment and settlement of the benthic community growing on the Living Docks.


