Article

Occurrence of Persistent Organochlorine Pollutants in Sediments from Lake Piediluco, Italy

by
Tommaso Mercanti
1,
Mohamed El Hachmi
2,3,
Stefano Falcinelli
4,* and
Bartolomeo Sebastiani
1,*
1
Department of Chemistry, Biology and Biotechnology, University of Perugia, Via Elce di Sotto 8, 06123 Perugia, Italy
2
Department of Molecular Medicine, Sapienza University of Roma, Piazzale A. Moro 5, 00185 Roma, Italy
3
HôpitalEuropéen Georges Pompidou, 20 Rue Leblanc, 75015 Paris, France
4
Department of Civil and Environmental Engineering, University of Perugia, Via G. Duranti 93, 06125 Perugia, Italy
*
Authors to whom correspondence should be addressed.
Environments 2023, 10(7), 120; https://doi.org/10.3390/environments10070120
Submission received: 30 March 2023 / Revised: 30 June 2023 / Accepted: 3 July 2023 / Published: 11 July 2023
(This article belongs to the Special Issue Potentially Toxic Elements in Sediments of Protected Areas)

Abstract

:
In surficial sediments of Lake Piediluco, a small, riverine, regulated and heavily modified water body in the Central Italian Apennines, contamination by persistent organochlorine pollutants (POPs) was assessed. During spring and autumn, six representative points were investigated. Reflecting a substantial zonation of pollution within this aquatic ecosystem, concentrations were found to vary from site to site. OCPs, particularly DDT and its metabolites DDE and DDD, were detected at varying frequencies and concentrations from 0.301 to 8.185 ng/g d.w., whilst total PCBs (Σ50 congeners) were from 0.570 to 10.206 ng/g d.w. Although both PCB congener-specific and homolog patterns suggest a prevalent presence of Aroclors 1254 and 1260, a more limited likely contribution of 1248 technical mixture is not to be excluded. In the western area of the lake, affected daily by continuous basin water remixing for hydroelectricity production, major seasonal differences in OCP concentrations were found. Conversely, the eastern area was typified by low seasonal fluctuation and small variation among sites. Regardless of either collection site or seasonality, polychlorinated-p-dioxin and furan (PCDD/Fs) contamination were below 8.3 pg WHO-TEQ/g. In contrast to the present study, POP pollution from PCBs, PCDD/Fs and some DDT-derived pollutants has not been investigated so far. Nevertheless, the concentrations are typical of low-polluted or pristine area lakes and are consistently lower than those of other Italian lakes of greater size and depth (e.g., Como, Garda and Maggiore). The physical and chemical properties of investigated analytes are more consistent with probable diffuse point source contamination originating from the catchment area, rather than from atmospheric depositions by regional or long-range transports. Finally, according to the international sediment quality guidelines (SQGs), Piediluco sediments pose a low risk to sediment-dwelling organisms and, more generally, to the wildlife of such aquatic ecosystems.

1. Introduction

Sediment is a heterogeneous and complex matrix and an element of freshwater ecosystems, of which it is an essential and dynamic component [1]. Due to their extensive surface and structure, sediments not only play a crucial role in the transport and fate of pollutants, but also provide habitats and food sources for aquatic life, including sediment-dwelling organisms, epibenthic species and infaunal communities [2].
For these reasons, in the wider context of water management, sediment quality is a matter of great concern. Point and non-point sources are the major pathways responsible for the potential contamination of superficial water bodies. Both contribute synergically to the contamination of an aquatic ecosystem [3], exerting adverse effects on non-target organisms and bioaccumulative potential in both wildlife and humans [4]. In addition, contaminants may enter water bodies either directly, by wet and dry atmospheric deposition, or indirectly, when regional inputs affect the catchment area too [5]. In sediments, the most investigated pollutants are organic chemicals with distinct physical and chemical properties (e.g., low vapor pressure and aqueous solubility, high octanol-water partition coefficients, Kow, and organic carbon partition coefficients, Koc), which tend to accumulate, binding strongly to components of sediment [6]. Usually, a logKoc or log Kow ≥ 3 is used as a threshold value for pollutants to be found.
As a result, the sediment acts as a definitive natural sink, slowing down further dispersion of harmful chemicals, through their long-term immobilization and thus acting as a historical memory of pollution in a hydrographic basin. In addition, the natural or artificial re-suspension of their particles constitutes a further secondary potential source, releasing the contaminants from sediment and sediment pore water to the water column [7], becoming a further non-negligible environmental issue.
The toxicity of contaminated sediments to benthic and epibenthic invertebrates as well as fish is well documented, with detrimental effects on reproduction, growth, survival and depletion of an ecosystem’s biodiversity [8]. Moving up through the trophic web, toxic chemicals generate biomagnification phenomena [9] with risks to sediment-dwelling organisms, water-dependent wildlife and human health [10,11], as well as to drinking water supplies, recreation and fishing.
Although many of these widespread toxic and bioaccumulative chemicals (PBTs) [12,13], inter alia the sub-families of organochlorine pesticides (OCPs), polychlorinated biphenyls (PCBs) and dibenzo-p-dioxins and furans (PCDD/PCDFs), have been banned in most countries over the world, according to the Stockholm Convention (2001) [14] and the extension of United Nations Environment Programme (UNEP, 2018) [15], even after removing the primary sources, they continue to persist in the ecosystems. The levels of contaminants in bed sediments and their potential impact on aquatic life often result in an under- or over-estimation of the associated risk, especially when the characterization of key toxic and persistent chemical groups is not accurate, complete and comprehensive. This is the case of Lake Piediluco (Umbria, Italy), for which extensive literature is available on ichthyofauna [16,17], sediment-dwelling organisms [18], macro invertebrates [19], larvae [20] and deterioration due to eutrophication process [21,22].
In contrast, very few and incomplete investigations have assessed the levels of POPs [20,23] and to date, to our knowledge, relatively limited or insufficient data are available on the distribution of PCBs (including non-ortho and co-planar congeners) and PCDD/Fs, on the presence of historical pollution by organochlorine pesticides and their degradation products. Therefore, also in light of the national current regulations implementing the Water Frame Directive (2000/60/EC) [24], the objective of this analytical work is to attempt to fill this gap and take a snapshot of the pollution from such POPs, to assess their possible sources and distribution, toxicological potential, as well as the degree of sediment contamination.
Therefore, the search for these priority hazardous substances is crucial: (a) to comprehensively monitor their presence and (b) to demonstrate the “non-deteriorating” condition in sediment quality according to WFD guidelines [24], particularly in a water body classified as regulated and heavily modified. However, this last condition allows sediment particles to migrate into emissary rivers affecting a larger catchment area.
Furthermore, there is ample evidence that even when the conditions of the guidelines are satisfied, toxic effects in the benthic community have been not observed, as well as vice versa on account of combined toxicity or the presence of undetected compounds [1].

2. Materials and Methods
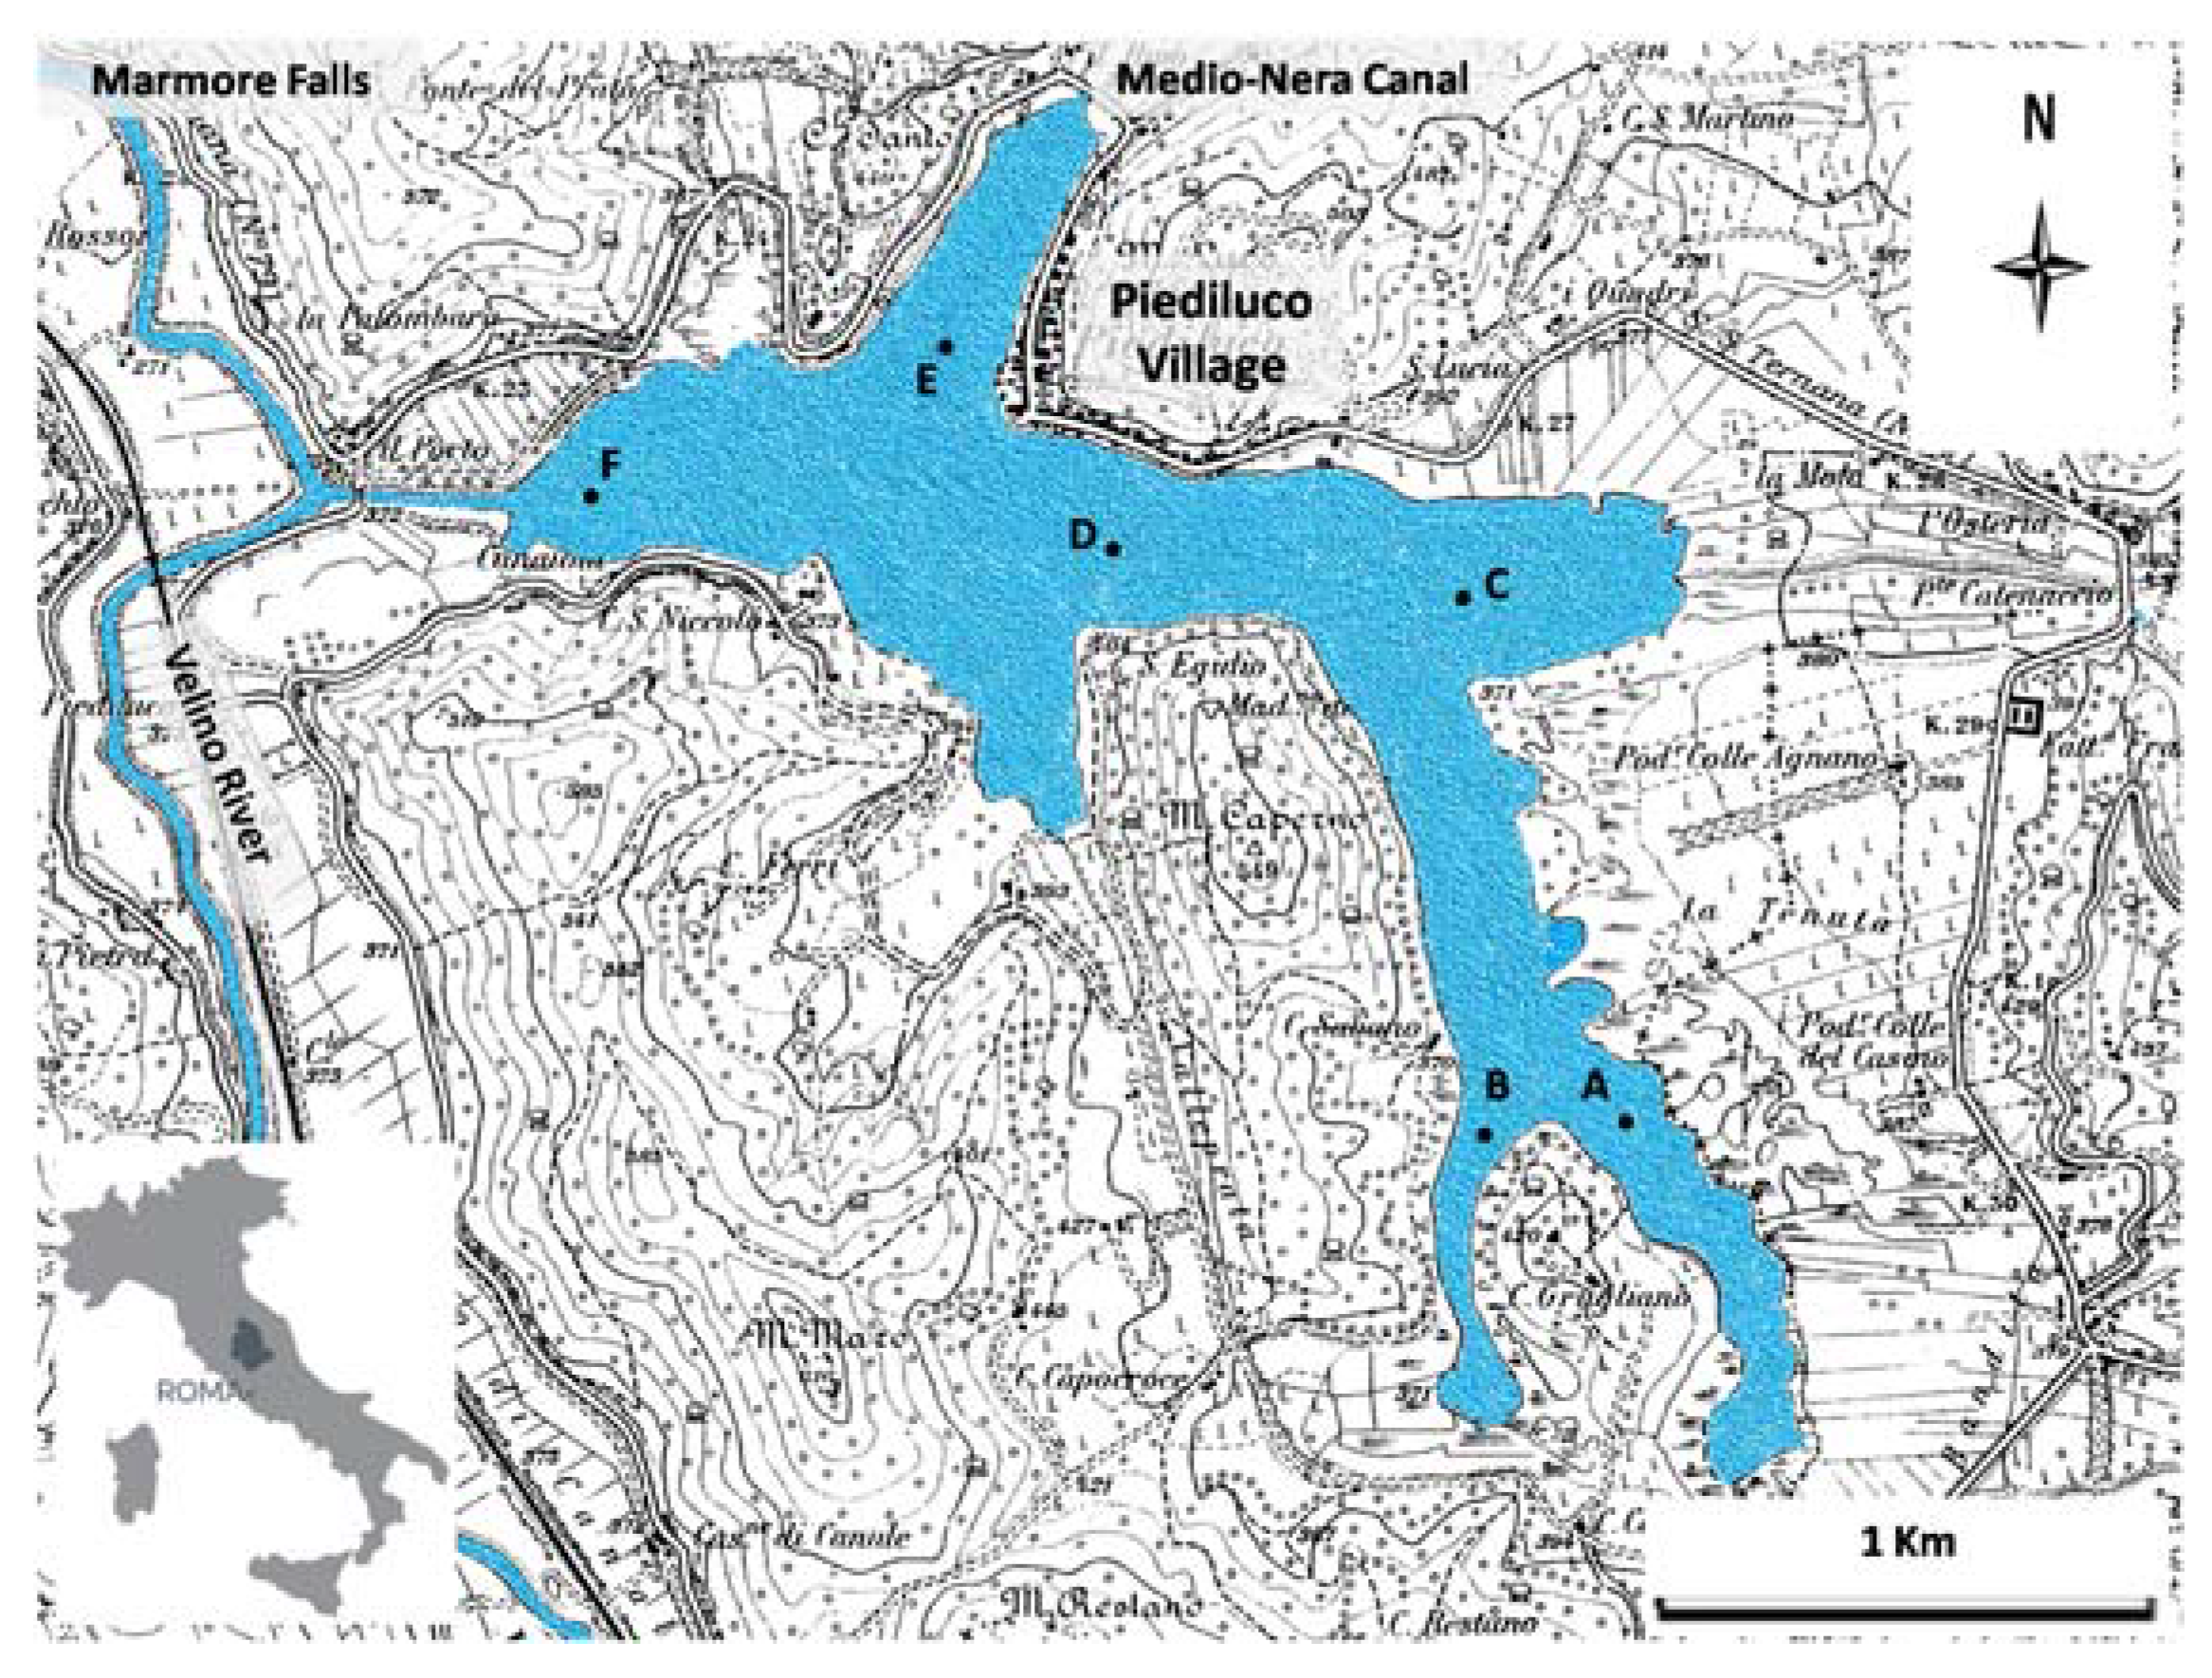
2.1. Study Area

Lake Piediluco is a natural riverine basin of alluvial origin dating back to the Quaternary period, overlooking the Nera river valley below. It is at the center of the Italian peninsula (42°31′57.36″ N–12°45′48.42″ E; 368 m a.s.l.), a few kilometers from one of Italy’s and Europe’s largest integrated-cycle stainless steel plants (1,000,000 tons/year), owned by Thyssen-Krupp, on the outskirts of the city of Terni (~120,000 inhabitants). Its irregular shape (sinuosity index = 3.28) makes it similar to an alpine lake, Figure 1.
It extends along an East-West axis and consists of a central area with a maximum depth of 21 m (geographical center), with shore slopes of up to 50%, while the North-South axis is typified by branches with shallower waters and less steep shore slopes. Table 1 summarizes synoptically the main morphometric parameters of the lake.
The current extension (1.67 km2) is what remains of the once larger ancient lake Velino. The morphological position of the valley and the chemical properties of water, rich in bicarbonate, have over the millennia resulted in the formation of a natural travertine barrage, preventing the normal flow of water. In order to drain the basin, the Roman Consul Curium Dentatum (≈300 B.C.) dug a 2 km canal, resulting in the highest waterfalls in Europe (Marmore Falls, 165 m) [19].
Since 1924, the lake has been used as a daily reservoir to feed two hydroelectric power plants in the Nera river valley below. Then, the Velino river alternatively acts as a tributary (by night) and effluent (during the day). The daily variation of the basin’s free surface area of approximately 0.6 m implies an irregular hydraulic regime, expanding the catchment area from 75 to 3200 km2 [22]. Therefore, according to the Water Framework Directive (2000/60/EC) [24], the lake is classified as a regulated and heavily modified water body. To further increase the water level in the basin, a 42 km artificial canal (Medio-Nera) was built in 1934, which became the main tributary of the lake with a flow rate of 25 m3/s. This complex hydrology produces continuous water remixing in the eastern part of the lake, giving it a lotic behavior, while in the other a lentic condition [25]. The water temperature shows the typical pattern of a monomitic warm lake, different from that of most lakes in temperate zones: strong thermal stratification in warm seasons (May–August) and full circulation in cold seasons (November–March). With the exception of Piediluco village, the coasts of the lake are sparsely populated and mostly covered by woods and clearings. In the period 1988–1996, sediment accumulation was estimated at 24 cm/year [26]. Currently, the rate is lower and field measurements highlight a uniform sediment thickness ranging from 0.4 to 1.0 m [27]. The predominant contributions to pollution from the surrounding catchment area enter the lake through the Medio-Nera canal and Velino river while the contribution of water courses of torrential character, responsible for both diffuse sources (agricultural activity) and point sources (urban and industrial), is minor. The area is now the headquarters of the National Olympic Training Centre of the Italian Rowing Federation and a summer bathing and recreational fishing.

2.2. Sample Collection and Pre-Treatment

Six lake locations were selected for the investigation. In order to have representative sediment samples and to minimize the variance of the analytical data, almost three cores were collected at each sampling site during two seasons, spring and autumn. A global positioning system (GPS) was used to locate and map all the sites. Figure 1 and Table 2 show the geographical position (latitude, longitude and depth) of the sites. Five of these (A, B, C, E and F) were about 30–40 m offshore and, according to Italian environmental regulation (D. Lgs 152/2006), one (D) in the middle of the lake. This last one was in front of Piediluco village, while the other two points were near the mouth of Medio-Nera Canal (E) and Velino river (F), respectively. The other points were in front of the major arms of the lake. Core sediments were collected by a modified Eckman gravity sampler. The average lengths of the cores collected ranged from 11 to 36 cm, at the mouth of the Velino river (point F, depth 5.0 m) and at the geographical center of the lake (point D, depth 19.0 m), respectively (Table 2). Only surficial fractions of the sediment (0–5 cm depth) were collected in glass vessels, previously washed with pure HNO3 and rinsed with ultra-pure water (Millipore, Milan, Italy), keeping the water towering above. The samples were stored in the dark at 4 °C until analysis. The interstitial water of the sediment was removed by centrifugation at 8000 rpm for 10 min. Afterward, the samples were air-dried in the dark in a ventilated room, manually grounded, sieved to 2 mm, homogenized and split into sub-samples.

2.3. Chemicals and Reagents

All solvents, acetone, n-pentane, n-hexane, dichloromethane and carbon tetrachloride, used for extraction and clean-up sediment samples were residue-free analytical grade for pesticide analysis ≥99% (Sigma-Aldrich, Deisenhofen, Germany). Activated copper powder (>99% purity, Carlo Erba Reagents) was added and mixed in the sample to reduce or eliminate the elemental sulfur contents in the sediment. Before use, copper was activated with hydrochloric acid (1M). The Silica gel 60 (70–230 mesh) high purity grade, Extrelut20, Alumina (120–230 mesh) and sodium sulfate anhydrous, carbonate and chloride used for chromatographic separation and cleanup of analytical fraction, were purchased from Sigma-Aldrich (Deisenhofen, Germany). The internal standards used to spike all sediment samples before extraction were a solution of PCB210 congener from AccuStandard, Inc. (New Haven, CT, USA) and a mix of 10 fully13C-labeled PCDD/PCDFs from Cambridge Isotope Laboratories (Cambridge, UK) in isooctane. The analytical standards used for the identification and quantification of organochlorine compounds and the optimization of tandem mass spectrometry (MS/MS) and multireaction monitoring (MRM) conditions were a mixture of eleven pesticides α-, β-, γ-HCH (hexachlorocyclohexane); HCB (hexachlorobenzene) and the two o,p- and p,p- isomers of DDT, DDE and DDD (Supelchrom, Milan, Italy); an analytical standard of heptachlor (Dr. Ehrenstorfer); a mixture of nineteen PCB congeners (namely IUPAC 1, 5, 18, 31, 44, 52, 66, 87, 101, 110, 138, 141, 151, 153, 170, 180, 183, 187, 206) (Resteck, Bellafonte-PA, CA, USA) and a mixture of seventeen substituted native isomers of 2,3,7,8-PCDD and PCDF (Cambridge Isotope Laboratories—Cambridge, UK), all in isooctane.

2.4. Extraction, Clean Up and Fractionation

The extraction, clean up and fractionation steps were performed according to the procedure ISTISAN 99/28 (Italian National Health Service, 1999) [28]. Briefly, an aliquot of15 g (dry weight) of powdered representative sediment was subjected to liquid/solid extraction with a mixture of n-hexane-acetone (1:1, v/v) under reflux in a Soxhlet extractor for 12 h at 40 °C. Before extraction, activated copper was added to the sediment samples to reduce or eliminate any elemental sulfur eventually present. To estimate the recovery of the analytical method, all samples were spiked with an aliquot of internal standard solutions of PCB210 and a mixture of isotopically 13C-labeled PCDDs and PCDFs standard. The extracts were reduced to a small volume in a rotary evaporator and quantitatively fractionated on three sequential chromatography columns: the first one packed with Extrelut20 (acidified by H2SO4 95% of purity, 1:1, w/w), the second one with a multilayer of Na2SO4, Silica gel 60, Na2SO4/NaHCO3 (4:1, w/w), Extreluct20, Extreluct20/H2SO4 (1:1, w/w), Na2SO4/NaCl (3:1, w/w) and the third one with alumina (120–230 mesh). With the exception of Extreluct20, all components were preconditioned overnight at 120 °C and alumina at 500 °C. The first two columns were eluted with 150 mL of n-hexane and n-pentane, respectively, while the third with 5 mL n-hexane, 18 mL pentane/carbon tetrachloride (1:1, v/v) (OCPs and PCBs) and 9 mL dichloromethane (PCDD/Fs). The elutes were reduced to dryness and resuspended in an isooctane aliquot.

2.5. Gas Chromatographic-Low Resolution Tandem Mass Spectrometry (GC-LRMS/MS) and Multi Reaction Monitoring (MRM) Analysis

One µL of each analytical fraction was qualitatively and quantitatively analyzed under GC-LRMSMS and MRM conditions on a CHROMPACK CP3800 GC coupled with an ITD (Ion Trap Detector) SATURN 2200 (VARIAN, Walnut Creek, CA, USA), equipped with 30 m (0.25 mm ID, 0.25 μm film thickness) CPSil8-MS fused silica column and a 1079 temperature programmable injector. The oven temperature program for chromatographic separations and the MS/MS, MRM conditions (ion trap, manifold and transfer line temperature; collisional induced dissociation voltages; filament emission current) for detections follow the analytical methods for OCPs and PCBs exhaustively described by Sebastiani and Falcinelli [29] and for PCDD/PCDFs by Küchler and Brzezinski [30].

3. Results and Discussion

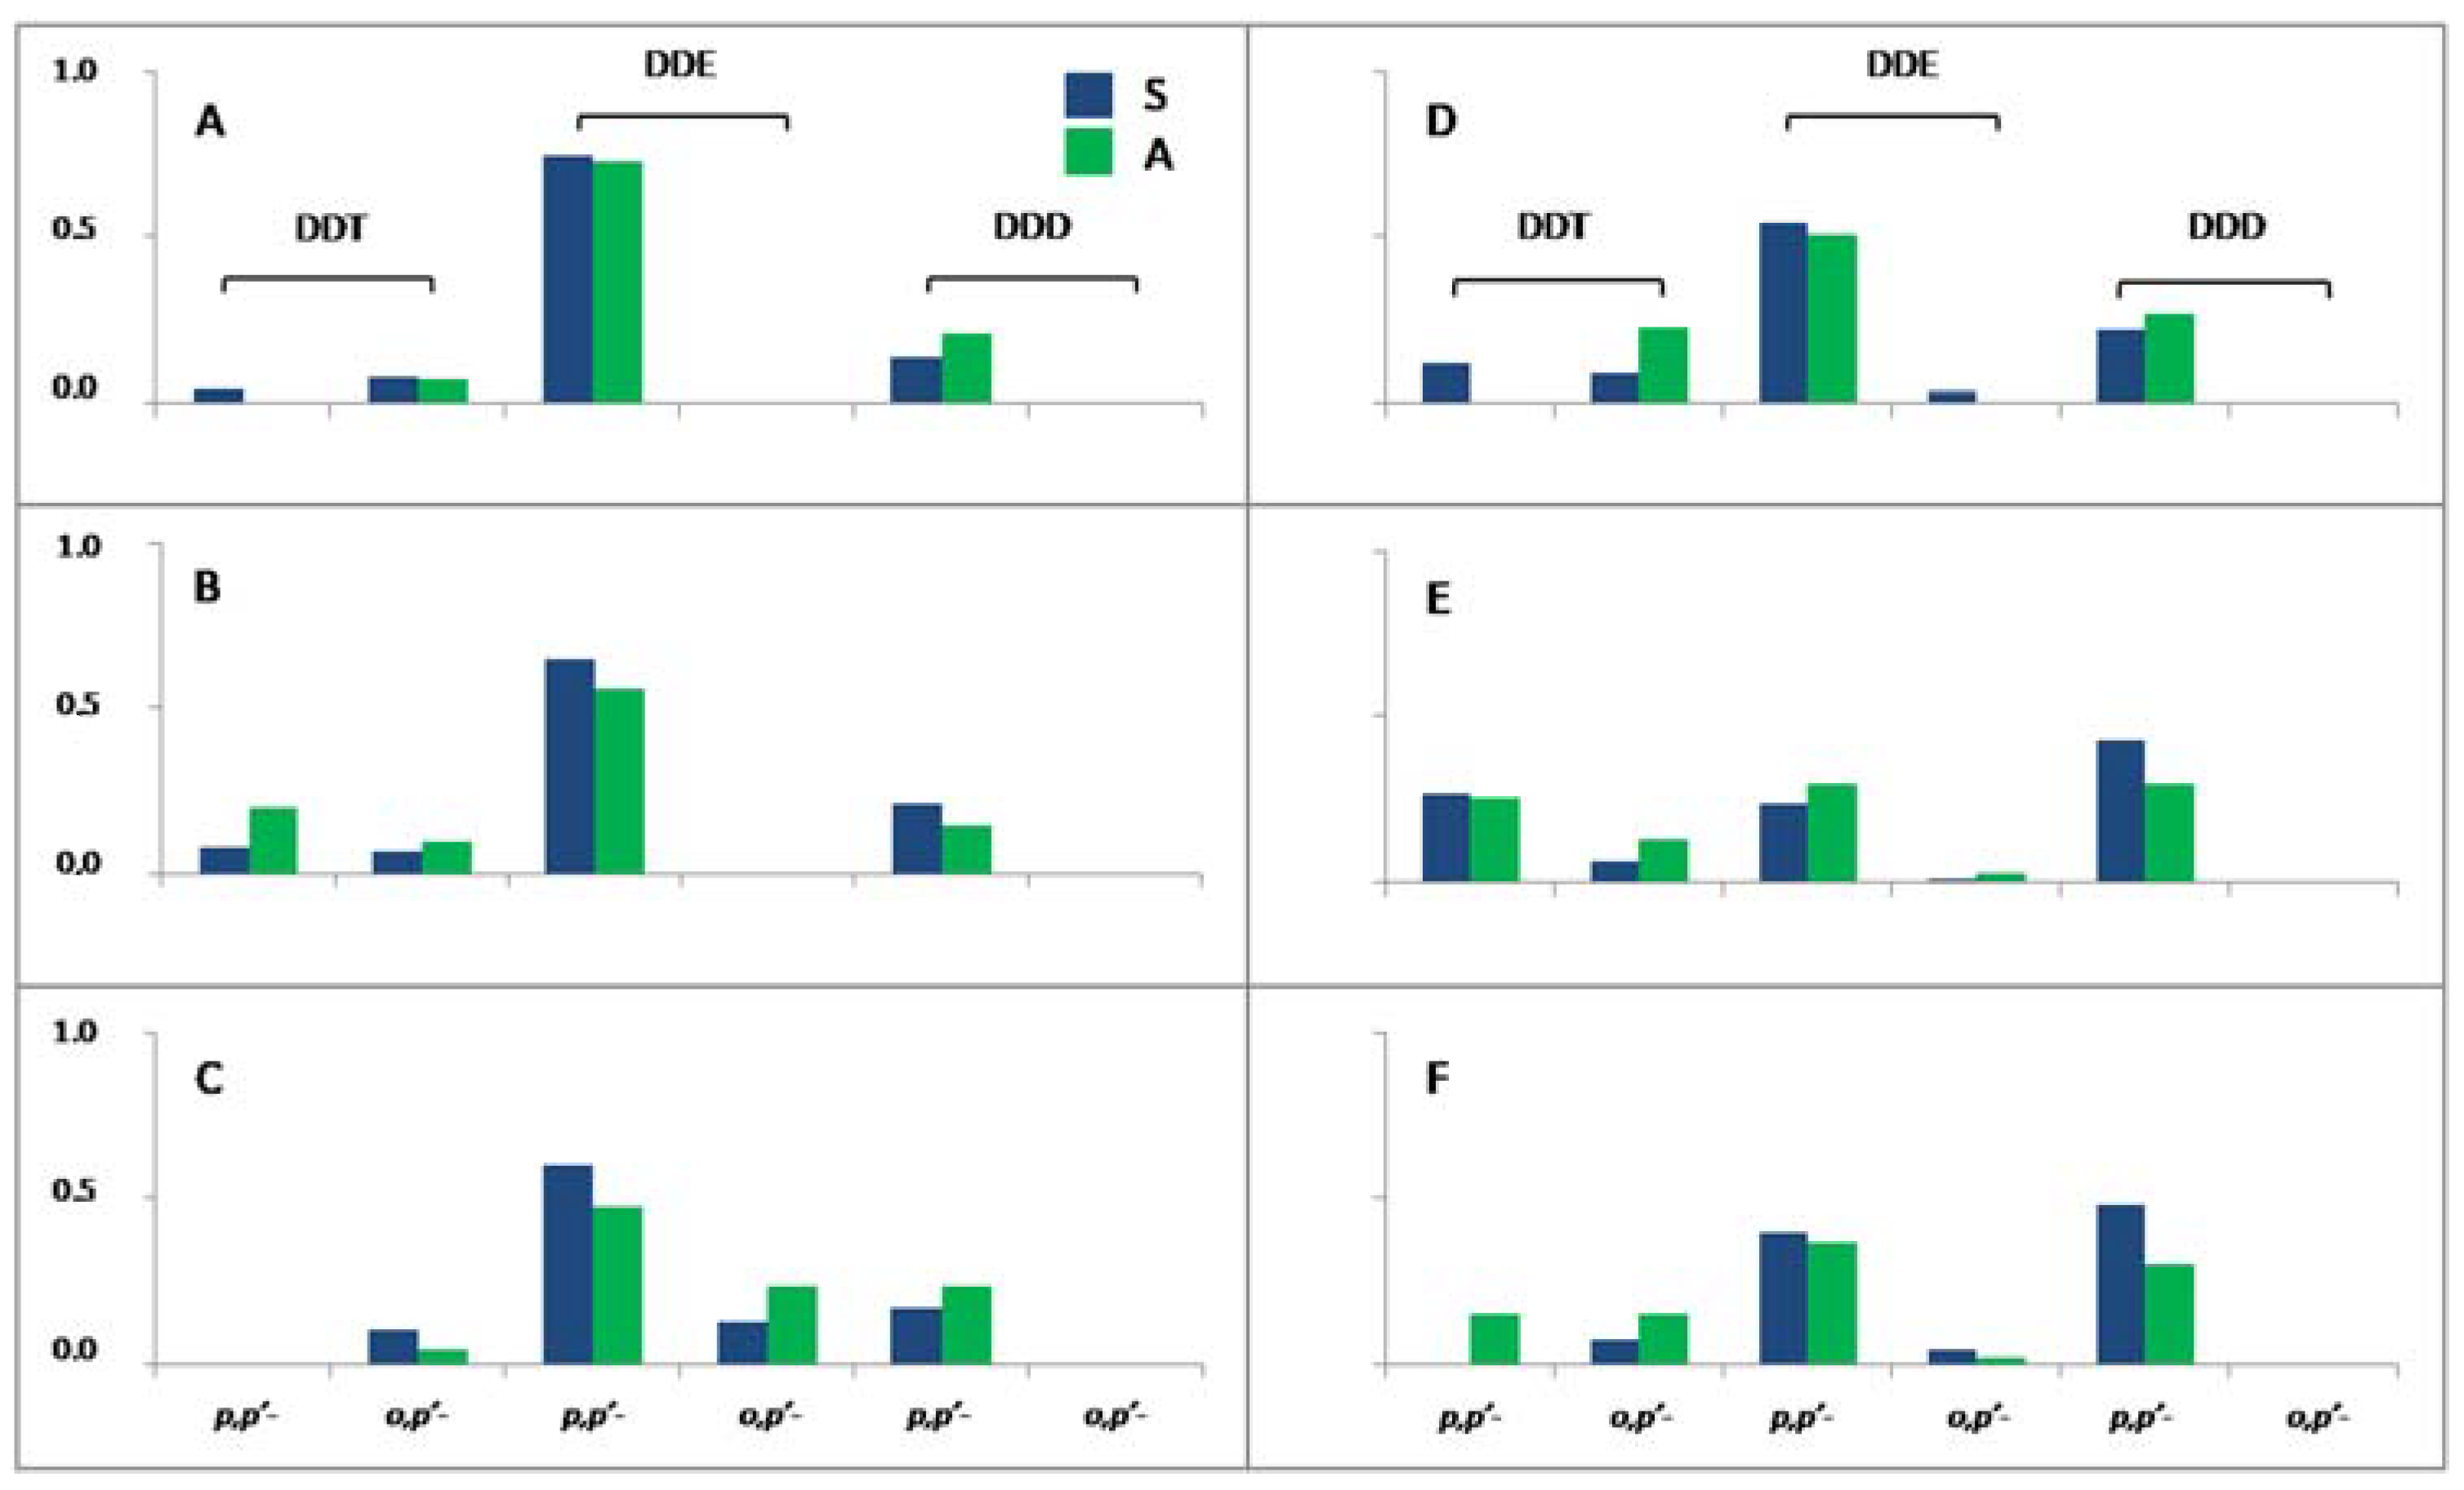
3.1. Organochlorine Pesticides

A set of 11 organo-halogenated pesticides, including hexachlorobenzene (HCB), three isomers of hexachlorocyclohexane (α-, β-, γ-HCH) and heptachlor as well as DDT, both the isomers o,p’- and p,p’-, and its metabolite products (DDE and DDD) were screened and quantified in surficial sediment cores (0–5 cm) of the lake Piediluco. The seasonal data distribution for each individual analyte from the six sampling stations is shown synoptically in Table 3.
Total OCP concentrations were from 0.301 to 8.185 ng/g d.w. at sites E and F in autumn and spring, respectively, Table 3. Generally, pesticide concentrations in the different sites varied, reflecting a zonation of pollution. Relatively higher levels of contamination were found on the western side of the lake (E and F), while the sediments east of the geographical center of the basin showed lower average values, 0.456 ± 0.106 ng/g d.w. In the front inlet and outlet of the Velino river (E, depth 5.0 m) and at the mouth of the Medio-Nera canal (F, depth 14.7 m), sites of the lake affected by continuous water mixing due to daily use for hydroelectric production, consistent seasonal differences were observed. At the remaining points, the sediments showed constant and similar concentrations in both seasons, 0.549 ± 0.035 and 0.362 ± 0.042 ng/g d.w. Compared to other Italian lakes, Garda, Como [31], Maggiore [32] and Sirimbizzi [33], classified as low-to-moderately polluted, the levels of total OCPs are comparable, while qualitatively and quantitatively disagreeing with those reported in earlier work on the lake [20]. With the exception of Site E, the concentrations of the individual pesticides comply with the maximum allowable threshold values set by the Italian Environmental Quality Standards (EQS) for sediments, which are 1.0, 0.8, 1.8, 0.2 and 0.4 ng/g d.w. for DDT, DDD, DDE, HCH and HCB, respectively (Legislative Decree 172/2015). These pollutants are listed as priority substances in accordance with the Water Framework Directive (2000/60/EC) [24] and subsequent implementations (2008/105/EC, 2013/39/EU). These directives constitute the central tool for water management and protection in the EU, in order to define the chemical status of water to be achieved by all European Member States, as well as being the legal basis for monitoring these pollutants in sediments and biota.
In contrast to the previous study mentioned [20], in the whole sediment, the isomers of hexachlorocyclohexanes (HCHs), identified as α-, β-, γ-, respectively, and the heptachlors arebelow the limit of quantification (0.030 and 0.020 ng/g d.w.). The chemical-physical properties of these pesticides (higher water solubility, vapor pressure, biodegradability, lower lipophilicity and particle affinity) as compared to DDTs [34] and non-intensive and non-recent use in the area, both as an industrial emission (α-, β-form) and as an effective pesticide (γ-form), could explain the non-detectable concentrations in surface sediments. Furthermore, γ-HCH, a pesticide among the organochlorine pesticides with the lowest persistence, tends to decompose to trichlorobenzene under particular environmental conditions [35]. Only at the western site of the lake (points D, E and F), although in trace amounts, HCB was present close to or above detection limits (>0.007 ng/g d.w.), despite its persistence and not immediate biological and chemical decomposition.In both seasons, confirming the widespread contamination of the lake, DDT residues (as the sum of the six isomers) are present on the whole sediment surface, providing a predominant contribution to the total concentration of OCPs. As is known, these chemicals are the most frequently detected in biocoenosis together with PCBs. The amounts of these ubiquitous compounds were: p,p’-DDT, <0.023–2.172 ng/g d.w.; o,p’-DDT, 0.018–0.500 ng/g d.w.; p,p’-DDE, 0.152–1.917 ng/g d.w.; o,p’-DDE, <0.020–0.091 ng/g d.w.; p,p’-DDD, 0.057–3.499 ng/g d.w. Of the all isomers, only o,p’-DDD was not detected, being below the limit of quantification of the analytical method (<0.020 ng/g d.w.), Table 3. The DDT pollution is however consistent with a history of probable non-intensive use of insecticide in the surrounding catchment area. The o,p’-DDT and p,p’-isomers of the metabolites DDE and DDD showed the highest frequency of detection, while p,p’-DDT and o,p’-DDE were less than 60%. On average, DDE accounted for 55.0 ± 17.0% of the total amount of DDTs, while DDD levels were about half that of DDE (25.9 ± 10.6%). A smaller contribution was recorded for DDT parents with an average value of 19.2 ± 11.4%, Figure 2.
To date, no literature data are available for a comparison with the distribution of these pollutants in the present work. The relatively low concentrations of DDT in comparison with DDE and DDD suggest a high degradation of the parent, indicating thatthere is no more recent input of its technical product into the surrounding catchment area. Furthermore, the ratio between the two isomers of DDT and its degradation metabolites can provide information on both the time elapsed since the use of DDT [36,37] and the technical formulation of insecticide or “dicofol-type DDT” [38]. It is interesting to note how the o,p’-DDT shows a dominant concentration of the corresponding p,p’-isomer, Table 3. This would seem consistent with a slower degradation of o,p’- than p,p’- since, in the technical-grade DDT product, the o,p’-isomer contributes 15–21% [39]. This finding is also supported by the low concentrations of its related metabolites. With regard to the technical formulation of the products, the ratio between o,p’- and p,p’-DDT concentrations could provide information on the likely source of pollution, as this quotient is not significantly influenced by the environmental weathering processes [40]. Indeed, values for this parameter >1 would correlate with a “dicofol-type” source of pollution, whilst <1 with a technical formulation of DDT [38,41], although analysis of the enantiomeric fraction of the o,p’-isomer would provide a more reliable signature for tracing the transport, pathways and fates in the overall DDT cycle [42,43]. For this index ratio, however, the sediments exhibit two different fingerprints: at point A pollution consistent with a source “dicofol-type” (>1) and in the other parts of the lake sediment with the probable dominant contribution of technical DDT (≤1) [38,41]. The discordant values obtained at each individual sampling site in both seasons are more difficult to explain. Since the DDT degradation products are influenced by the redox state in situ, the metabolite DDE originates from surface sediments under aerobic conditions (abiotic dehydrochlorination), while DDD originates from deep sediments under anaerobic conditions (reductive biotic dechlorination). In particular, in all samples from the eastern site (points A, B, C) and in the middle of the basin (point D), the dominance of DDE over DDD (ratio > 1) should indicate a prevailing aerobic degradation pathway. Onthe opposite end, the two locations closest to the in- and out-effluent of the Velino river and the inlet of the Medio-Nera canal (points E, F) show a higher concentration of DDD metabolite (ratio < 1), reflecting reasonably anoxic degradation phenomena [44]. This would not seem to be in agreement with the known lotic and lentic traits of the lake (see above). This could be attributed to the peculiar hydraulic regime of the lake, rather than an improbable past use of Rothane (an insecticide with a high level of DDD as a bioactive substance) in the catchment area [45]. The effects of continuous and turbulent mixing of water at points E and F could result in the removal of the upper sediment layer. This would result in the exposure of the anoxic state of the deeper layers of the sediment to the water, leading to an increase in the detected DDD levels. In the remaining part of the lake, the presence of high concentrations of the other metabolite, DDE, was interpreted as the result of UV conversion of the DDT parent during atmospheric transport or residence on the surrounding soil, before being transferred into the basin, or by its photolysis in the water surface and column. Further indications, concerning the period of pesticide application, can be obtained by analyzing the DDT/DDE ratio. Most of the bottom sediment analyzed indicated “aged” or weathered DDT sources (DDT/DDE < 0.5), with the exception of the station near Medio-Nera canal inlet (point E) and in front of the urbanized area of Piediluco Village with DDT/DDE ≈1 [46], suggesting a little DDT degradation in this last site or more recent accidental release of the insecticide, probably in the recent years before sampling. As expected, this evidence is confirmed by values of another significant ratio as well, (DDE + DDD)/DDTs, close to 0.5 in site E and >0.5 in all remaining sediment [44]. Furthermore, the constant ratio for sites with values >0.5 confirm the uniform chemical and biological transformations of DDT in all sediments of the lake.

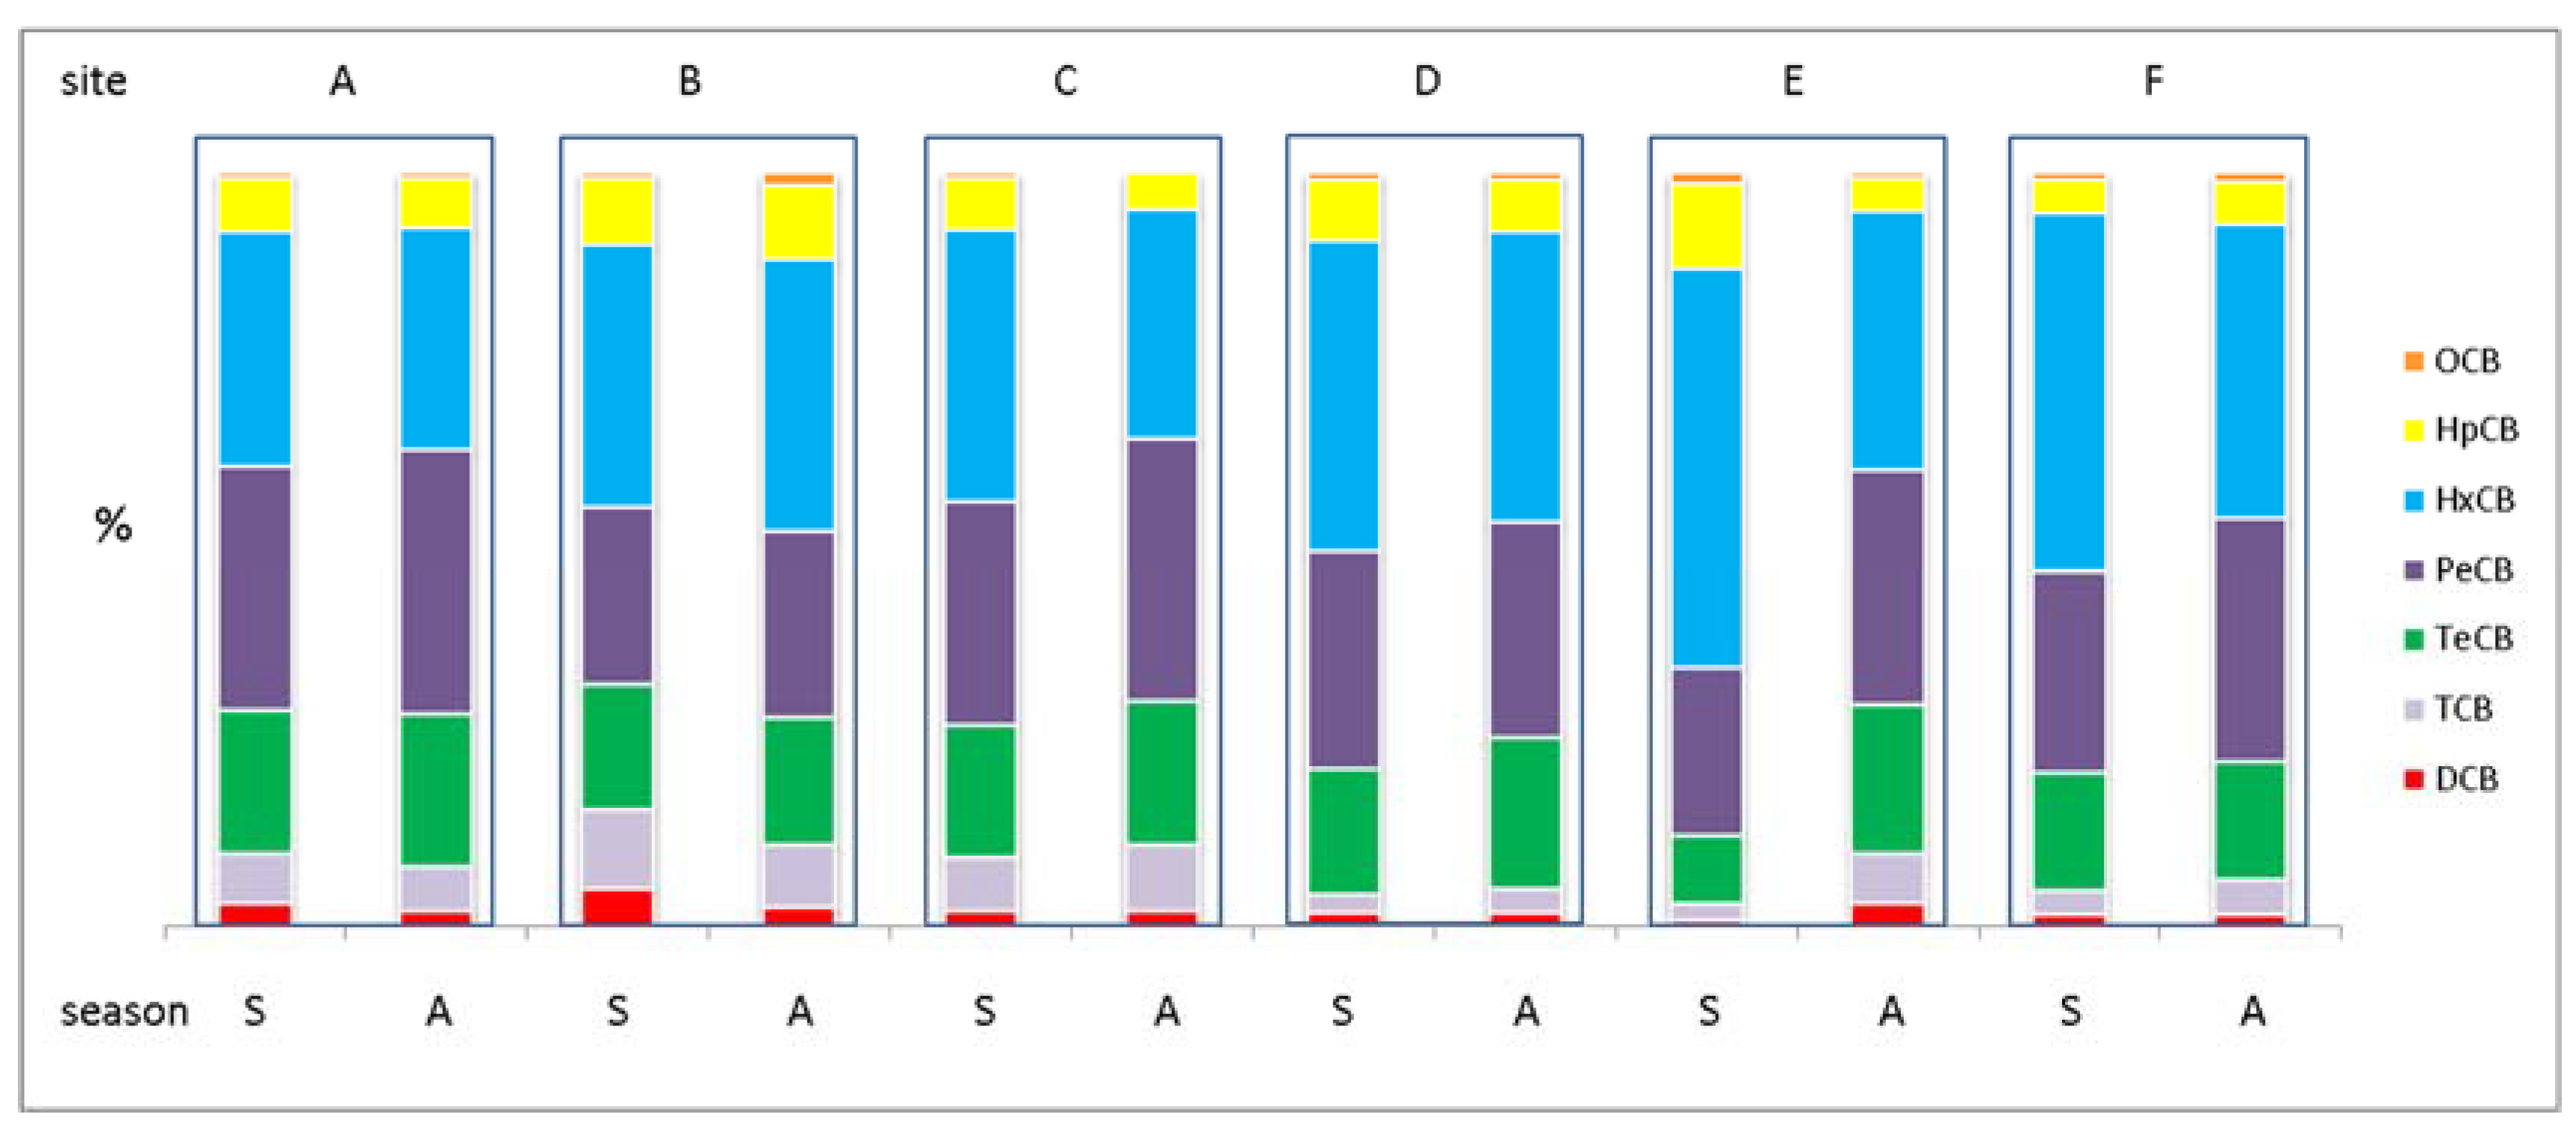
3.2. Polychlorobiphenyls

On the whole surface sediments, the presence of PCBs among the POPs analyzed, as well as DDTs, confirms the widespread contamination of these compounds. GC-MSMS speciation showed the presence of 50 congeners, ranging from di- to octa-homologues. Nine chlorine-substituted congeners were not detected. The analytical results of individual congeners, coeluents and their total concentrations are summarized in Table 4.
Total residue levels (Σ50PCBs) varied widely from 0.570 to 10.206 ng/g d.w., B and F, respectively, in spring, with an average concentration of 2.768 ± 2.609 ng/g d.w. In contrast to OCPs, the highest PCB contamination was found in front of the mouth of the River Velino in- and out-effluent (F), with 10.206 ng/g d.w. in spring and in the middle of the lake (D) with 4.454 ng/g d.w. in autumn. In the southeastern area of the lake, where the river plume is presumably more dispersed and the different sedimentation flow rate and transport of the current system imply variations in the accumulation rate of bottom sediments, the pollution load would appear to decrease. This could be indicative of a gradual decline of contamination away from the sources. However, no substantial seasonal mean differences were observed, 3.078 ± 3.587 and 2.459 ± 1.371 ng/g d.w. in spring and autumn, respectively, although a higher variability in the analytical data is associated with the warm season, despite the absence of full circulation of the lake water during this period. Even when normalizing contaminant concentrations to sediment organic content (TOC), according to assessment criteria, the variability of the data is not reduced. On the other hand, a highly significant Pearson correlation (p < 0.001) between TOC and PCB data was observed. After all, pollutant concentrations in sediments depend not only on the distance from a particular emission point or diffuse sources but also on organic carbon content and grain size distribution. Typically in sediment, organic contaminants are positively correlated with fine-grained and higher TOC content. In detail, increases in total PCB concentration were recorded at sites B and D, from spring to autumn, six and three times, respectively; whereas they decreased by seven times at site F, probably due to the dynamic and complex hydrology of the lake, resulting from the use of basin by power plants for electricity production. It is possible that the daily remobilization of the sediments may explain the singular and unexplained fluctuating trends in the levels detected.
On the contrary, as already observed for OCPs, a marked geographical distribution of average contamination seems to characterize the lake. Samples obtained in the western part (sites A, B and C) show lower average levels, 0.750 ± 1.018 ng/g d.w., than in the eastern part (sites D, E and F), 3.985 ± 3.223 ng/g d.w. It is common knowledge that the concentration of pollutants gradually decreases in surface sediments over time, as new ones are deposited. When old contaminated anoxic sediments are re-suspended owing to the forced inflow and outflow of new water into the lake, this leads to increased pollution levels as a result of exposure and bioturbation of the deeper sedimentary layers.
Although PCBs are not listed in the Water Framework Directive (2000/60/EC) [24] as priority chemicals in sediment, under Italian legislation (Legislative Decree 172/2015), they can be used for the optimization of water quality monitoring, as a sum of only 13 PCB congeners (28, 52, 77, 81, 101, 118, 126,128, 138, 153, 156, 169, 180). The concentrations in the lake of these 13 congeners are well below the set Maximum Allowable Value (8 ng/g d.w.), in the range of 0.223–3.592 ng/g d.w., with an average of 1.012 ± 0.908 ng/g d.w. On the whole, total PCB levels were comparable with data from lakes with little pollution, such as Sirimbizzi [33], Baikal [47], Ladoga [48], Höytiäinen and Frazer Lakes [49] and some lakes in pristine areas such as Ste Therese, Amituk [50], but an order of magnitude less than other Italian lakes, such as Iseo [31], Como, Garda [51] and Maggiore [32,52].
For a comparison with the past contamination of this aquatic ecosystem, unfortunately, no data are available and consequently no conclusions can be drawn on temporal changes.
In environmental samples, the distribution of PCB congeners can provide useful information on their source, transport and fate of these chemicals [53], although changes due to the environmental “weathering” process may not simply be related to chemical and physical properties. Limited mixtures ofAroclor with a specific homolog and congener fingerprint have been produced and are widespread. Each commercial formulation is an unambiguous combination of up to about 50 individual congeners at significant relative concentrations. Additional congeners may be detected in biocoenosis as a consequence of transformation processes (such as microbial dechlorination in an anaerobic environment), altering the chemical composition and misleading its fingerprint and source identification. Consequently, both congener-specific and homologous PCB data were evaluated. In this regard, the results for the individual congeners showed that pattern distribution in sediments was dominated in nearly equal proportions by hexa-CB153 and 149 (0.047–1.352 and 0.040–1.469 ng/g d.w., respectively, (Table 4), followed by the coeluents hexa-138 + 158 and penta-CBs118 + 123 with comparable levels (0.034–0.567 and 0.025–0.693 ng/g d.w., respectively). The CB153 and 138 are among the most abundant congeners usually present in sediments. Furthermore, CB138 and 149, containing two adjacent hydrogen atoms in their structures, may be less resistant to biodegradation than 153, so the ratio of 138 vs. 153 concentrations could indicate historical degradation, as could 149 vs. 153. The first ratio is constant in overall surficial sediments of the lake, 0.6 ± 0.1, and comparable to those found in Masan Bay, Korea [34], indicating a rate of biodegradation particular to the warmer waters, rather than to temperate European and American zones [54]. The second mean ratio was also constant and close to 1.0 ± 0.2. Considering that commercial mixtures of Aroclor have average values for the 149/153 ratio of 0.8 as do used capacitor oils (0.7), slightly higher levels than this seem to suggest a connotative value of the mixtures entering the environment. This evidence is consistent with that also found in sediments of the Venice lagoon with high industrial contamination [55].
However, CB180 and 99 also contribute largely to the profile with concentrations not far from those of the dominant congeners at 0.025–0.160 and 0.010–0.097 ng/g d.w., respectively, proof of probable cross-contamination by commercial formulations of Aroclor 1254 and 1260. This is also confirmed by the presence of penta-CB101 and 110 in pattern distribution. Furthermore, the level of 66-tetraCB, a congener with high dechlorination potential close to the limit of quantification (<0.003 ng/g d.w.) in all samples, could confirm this evidence, as well as a negligible contribution from Aroclor 1242 to pollution [56]. In this commercial formulation, the 66 congener contribution should be close to 2%. Its total degradation would seem not plausible, given the absence of one of the two dechlorination products (CB25) in the whole lake sediment. This hypothesis would also seem to be corroborated by the low presence of a more volatile PCB fraction.
In this respect, either congeners 28 and 52 are present at relatively low levels in the sediment analyzed, further confirming a negligible contribution to the global PCB profile of Aroclor 1242. Therefore, the pollution pattern could be a combination of commercial mixtures of 1242, 1254, and 1260, where the last two are more pronounced.
The contribution of the seven indicator congeners, present in higher percentage in technical formulation and with high environmental persistence (namely 28, 52, 101, 118, 138, 153 and 180), is 35.2 ± 3.1%, while that of the most toxicologically relevant “dioxin-like” (dl-PCBs) is 13.6 ± 1.7%. The speciation of these dl-PCBs shows two non-ortho congeners (77 and 126), two mono-ortho (105 and 118) and two di-ortho (170 and 180). Penta-congeners (105 and 118) and hepta- (170 and 180) were detected in all samples and account for 15.8–38.6% and 12.7–26.6% of total dl-PCB contamination, respectively. The most toxic congeners, CB-77 and 126, contributed 5.9–3.9% of the total dl-PCBs, with a detection frequency of 67 and 58%, respectively, while the CB-169, the most toxicologically relevant, was always undetectable.
Taking into account the chemical and physical properties of this complex class of compounds (Henry’s constant, octanol-water partition coefficient, water solubility), it might be appropriate to investigate the ratio between specific congeners, as is the practice for polycyclic aromatic hydrocarbons. Sometimes, variations in the compositional pattern could highlight a change in the source composition, in addition to those due to environmental processes. The low-chlorinated congeners, 28 and 52, tend to be more easily dispersed to the atmosphere. In fact, they are more volatile, water-soluble, less linked and less bound to the suspended particles in a body of water. As a result, they are more easily remobilizable from the sediment. In contrast, the other five mid-chlorinated congeners are strongly bound to sediment particles. Consequently, the concentration ratio between these two groups of congeners could be a practical index for the assessment of distance and pathway contamination [57]. For this ratio, lake Piediluco sediment has values between 0.10 and 0.38 (average 0.26 ± 0.08), confirming the predominance of more hydrophobic congeners (probable point source of PCB contamination), rather than from atmospheric transport from the two hydroelectric plants, downstream of the Marmore falls and fed by the waters of the lake. For completeness, Figure 3 shows the comparative percentage composition of the eight chlorination groups, relating to the two seasons for the six sampling stations.
The major contribution to the total PCBs was of tetra-, penta- and hexa-chlorobiphenyls (Figure 3), with an average of 17.1 ± 3.1, 29.3 ± 4.2 and 37.7 ± 7.0%, respectively, confirming what was already supposed about the possible mix of Aroclor technical formulation to sediment pollution. These profiles are not consistent with the contamination by low-chlorinated commercial mixtures, reflecting a contribution of heavier congeners. The distribution patterns are similar in all sites, suggesting only one probable potential input source from the three hydroelectric power plants still operating upstream of the artificial Medio-Nera canal.

3.3. Dioxins and Furans

On the whole bed surface sediment, concentration levels of PCDD/Fs were below the detection limit of the analytical screening method used, 8.3 pgWHO-TEQ/g, quantified as the sum of half LOD of the 17 single congeners (medium-bound estimate).
However, a comparison with Italian-EQS values would not be possible, as D. Lgs 172/2015 establishes a limit of 2 pg/g WHO-TEQ d.w., for the sum of PCDD/Fs and dioxin-like PCBs, setting an analytical method detection limit of 1/3 of the maximum allowable concentration for dioxins/furans. Nothing detracts from making comparative considerations with concentration levels found in other European water bodies, as the contribution of dioxin-like PCBs alone is at or exceeding the allowed limit with 2 pgWHO-TEQ/g at sites D (autumn) and E (spring), respectively, and 3 and 6 pgWHO-TEQ/g at B (autumn) and F (spring), Table 4.
The detection of changes in the sediment depositional rate of these pollutants over time is not possible, because no previous literature data about this lake basin are currently available, even though, since 1884, one of Europe’s largest historic integrated-cycle stainless steel plants has been in operation in the city of Terni, just a few kilometers west of Lake Piediluco. The “virtual absence” of these compounds would seem to be typical of lakes of unpolluted areas in Subarctic Finland [58] and consistent with pollution levels of the other chlorinated pesticides found in the sediments. However, the concentrations were well below those found in other Italian lakes, e.g., Lake Maggiore, 0.13–32.00 pg WHO-TEQ/g d.w. [59].
Moreover, as it is widely known, thermal processes in the metallurgical industry are one of the foremost sources of PCDDs and PCDFs [60], comparable to waste and generic combustion processes. Due to their physical characteristics (low vapor pressures 10−6 to 10−9 Torr), the bulk of these organochlorine compounds do not move very far from their sources or from warm to cold latitudes [61] and are deposited through a combination of dry and wet deposition dynamics of gas phase and particulate congeners on soil or water surfaces. Therefore, in estimating impacts, higher PCDD/Fs concentrations have been found in close proximity to source areas, e.g., within a few kilometers.
Considering that the PCDD/Fs released in the atmosphere by the European country per steel plant annually amounts to 1–50 g I-TEQ [62], specifically, in the urban basin of Terni, they amount to an average value of 2.9 g I-TEQ by atmospheric deposition of 5.6 pg I-TEQ/m2d (ARPA Umbria, 2012), the analytical data would seem in disagreement with the emission of this significant regional source.
Consequently, all this could be only explained in terms of the local orography of the basin, where both the steel plant and the city of Terni are located, surrounded by heights up to 1200 m in the north, west and east directions, with dominant winds mainly oriented along the valley of the Nera river, NE-SW direction [63], inhibiting the dispersion of pollutant plume toward the catchment area of lake Piediluco instead located SE of plant emissive source.

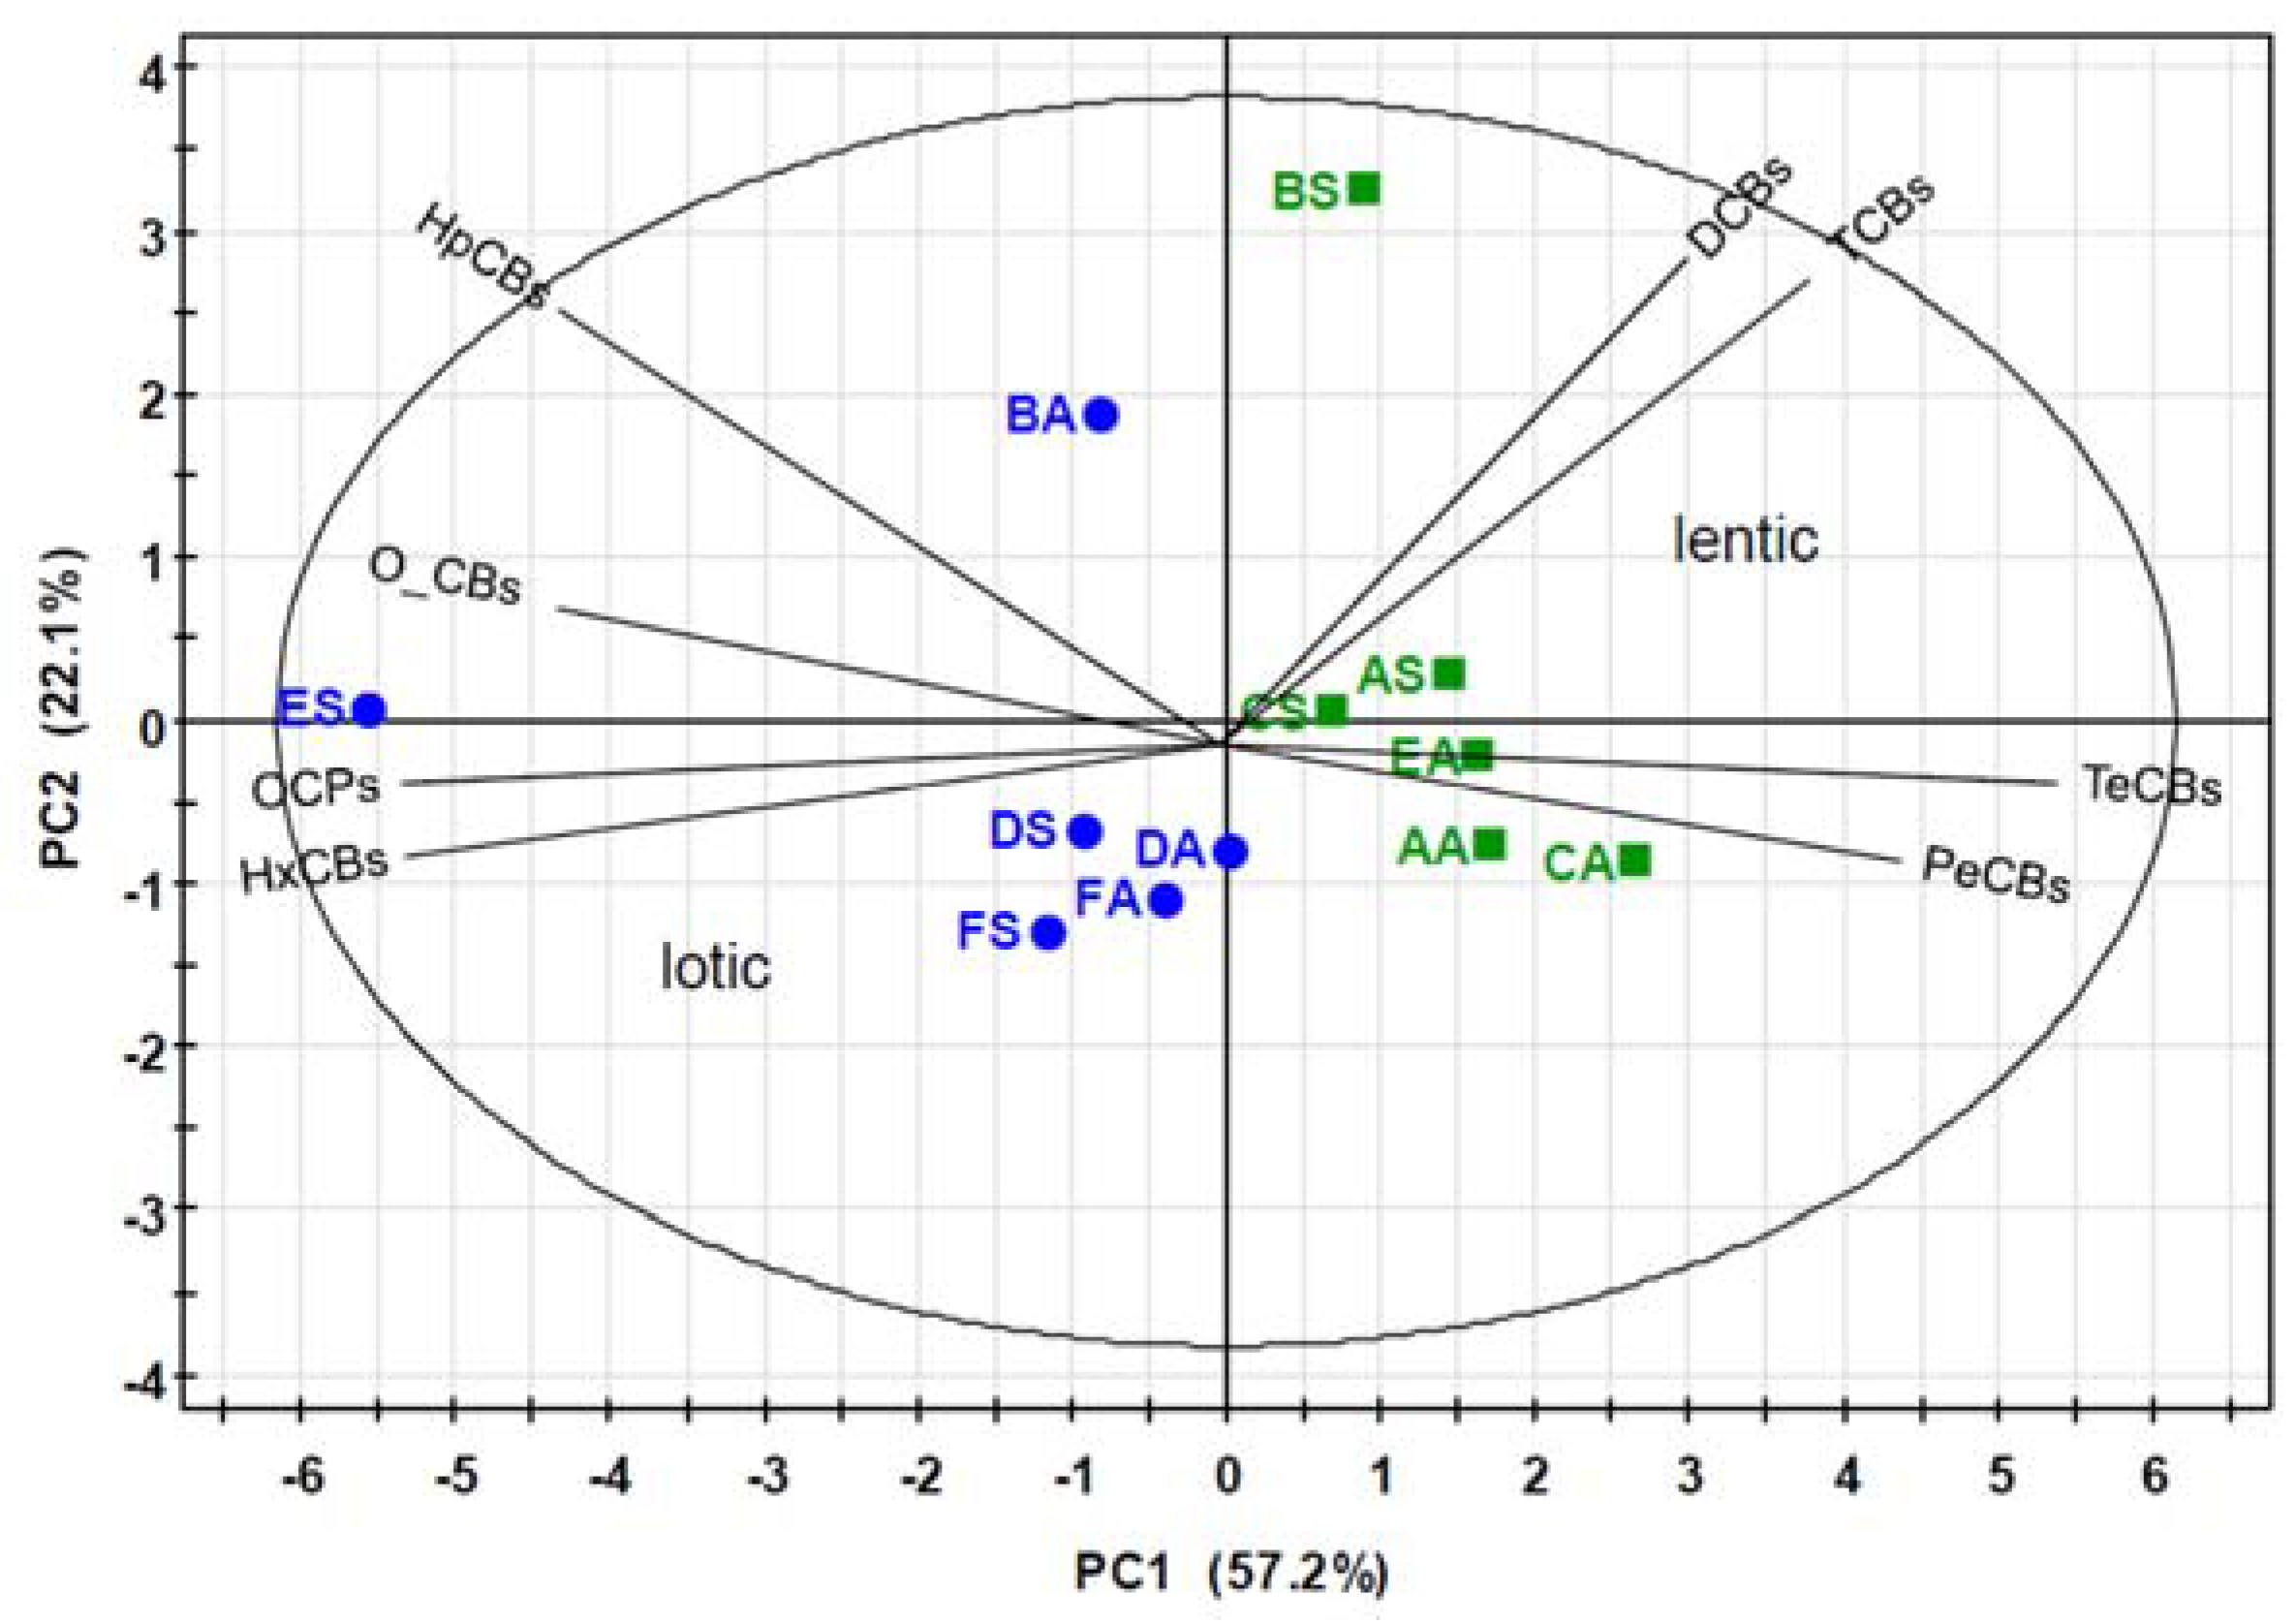
3.4. Statistical Analysis

No statistically significant difference (Student’s t-test) was observed between the mean values of OCP and PCB concentrations. However, separating the data by seasonality, only in autumn was this difference significant, p < 0.05 (0.0173). In contrast, highly significant correlations, p < 0.001, were found for the two classes of organochlorine compounds with both the depth values of the lake and the sediment height values at the respective sampling points.
Considering individually the two subclasses of organochlorine compounds, no significant difference appeared to be evident either by site or seasonality, confirming what was previously noted about the trends of the analytical data in the two seasons and in the sites under investigation.
These findings, in fact, are partially confirmed also by Principal Component Analysis (PCA) results, which account for about 80% of the total variance. The sum of the contributions of the first two components, PC1 (57.2) and PC2 (22.1%), with eigenvalues of 4.57 and 1.76, respectively, suggests a possible clustering by site, distinguishing between the lentic (A, B, C) and lotic (D, E, F) parts of the lake, along the PC1. However, there is a more ambiguous situation with respect to seasonality, Figure 4.

3.5. Ecological Risk Assessment

A well-known indicator of sediment quality condition is its chemistry. In fact, once the concentrations of pollutants affecting a basin have been estimated, numerical guidelines for sediment quality can be formed. These guidelines may include PECs, concentrations above which harmful effects are likely to be observed, and TECs, below which harmful effects are unlikely to be observed [64,65,66,67,68], allowing for an effective assessment of the potential consequences of contaminated sediments on biota and sediment-dwelling organisms.
In all examined sediment samples from the lake, the analytical data for PCBs and DDTs are below the threshold values for ERL, ERM, TEL and PEL, with low possibility of adverse effects on sediment-dwelling organisms, Table 5.
An exception is the sediment from site E collected in the spring season characterized by the presence of DDT, DDE and DDD whose individual concentrations, as well as their sum, exceed the corresponding proposed values of ERL and TEL but are lower than those of ERM and PEL.These findings suggest that adverse biological effects may occasionally occur on the site.
Since the recommended ERM levels for all classes of organochlorine compounds were not exceeded at any of the sites, the mean-effect range median(m-ERM) analysis, a method recommended by Long and MacDonald [69] for assessing the combined ecological risk of several toxic chemicals, was not contemplated upon.

4. Conclusions

The study campaign of the bottom sediments of Lake Piediluco revealed, especially in the eastern part of the basin, the presence of a pollutant load of organochlorine compounds. In at least four stations, the limits exceed the allowable limits of the regulations currently in force for both dioxin-like PCBs and, in one station, for DDTs. Based on these findings, further monitoring would be desirable in order to ascertain whether this pollutant load is attributable to historical pollution through sediment resuspension, or to an emission source to be monitored. This would be a promising basis for further investigations into the state of water quality and its effect on the lake’s ecosystem.

Author Contributions

Conceptualization, B.S. and S.F.; formal analysis, B.S. and T.M.; investigation, data curation, writing-review and editing, B.S., S.F., M.E.H. and T.M. All authors have read and agreed to the published version of the manuscript.

Funding

This research received no external funding.

Data Availability Statement

The data present in this paper can be shared.

Acknowledgments

The authors are grateful to Maria Elettra Cardarelli for constructive support in manuscript preparation and full-text language revision.

Conflicts of Interest

The authors declare no conflict of interest.

References

  1. Brils, J. Sediment monitoring and the European Water Framework Directive. Ann. Ist. Super. Sanità 2008, 44, 218–223. [Google Scholar]
  2. Mac Donald, D.D.; Ingersoll, C.G. Introduction. In An Ecosystem-Based Framework for Assessing and Managing Contaminated Sediments; Fisheries Foundation: Washington, DC, USA, 2002; Volume 1, pp. 1–3. [Google Scholar]
  3. Barceló, D. Analysis of soil, sediment and sludge. Trend Anal. Chem. 2004, 23, 677–679. [Google Scholar] [CrossRef]
  4. Mochungong, P.; Zhu, J. DDTs, PCBs and PBDEs contamination in Africa, Latin America and South-southeast Asia—A review. AIMS Environ. Sci. 2015, 2, 374–399. [Google Scholar] [CrossRef]
  5. Mac Donald, R.W.; Shaw, D.P.; Gray, C. Contaminants in Lake Sediments and Fish. Available online: http://publications.gc.ca/collections/collection_2015/ec/En47-119-1999-4-eng.pdf (accessed on 20 December 2022).
  6. Harkey, G.A.; Landrum, P.F.; Klaine, S.J. Comparison of whole-sediment, elutriate and pore water exposures for use in assessing sediment-associated organic contaminants in bioassays. Environ. Toxicol. Chem. 1994, 13, 1315–1329. [Google Scholar] [CrossRef]
  7. Förstner, U. Traceability of sediment analysis. Trend Anal. Chem. 2004, 23, 217–236. [Google Scholar] [CrossRef] [Green Version]
  8. Sandin, L.; Solimini, A.G. Fresh water ecosystem structure–function relationships: From theory to application. Freshw. Biol. 2009, 54, 2017–2024. [Google Scholar] [CrossRef]
  9. Yuan, H.; Liu, E.; Zhang, E.; Luo, W.; Chen, L.; Wang, C.; Lin, Q. Historical records and sources of polycyclic aromatic hydrocarbons (PAHs) and organochlorine pesticides (OCPs) in sediment from a representative plateau lake, China. Chemosphere 2017, 173, 78–88. [Google Scholar] [CrossRef]
  10. Mackay, D.; Fraser, A. Bioaccumulation of Persistent Organic Chemicals: Mechanisms and Models. Environ. Pollut. 2000, 110, 375–391. [Google Scholar] [CrossRef]
  11. Ingersoll, C.G.; Mac Donald, D.D. Interpretation of the Results of Sediment Quality Investigations. In Guidance Manual to Support the Assessment of Contaminated Sediments in Freshwater, Estuarine, and Marine Ecosystems in British Columbia; Environmental Protection Division, British Columbia Ministry of Water, Land and Air Protection: Victoria, BC, Australia, 2003; Volume III. [Google Scholar]
  12. Binelli, A.; Provini, A. Risk for human health of some POPs due to fish from Lake Iseo. Ecotoxicol. Environ. Saf. 2004, 58, 139–145. [Google Scholar] [CrossRef]
  13. Roche, H.; Vollaire, Y.; Persic, A.; Buet, A.; Oliveira-Ribeiro, C.; Coulet, E.; Banas, D.; Ramade, F. Organochlorines in the Vaccarès Lagoon trophic web (Biosphere Reserve of Camargue, France). Environ. Pollut. 2009, 157, 2493–2506. [Google Scholar] [CrossRef]
  14. United Nations Environment Programme. UNEP 2009 Annual Report. Available online: http://hdl.handle.net/20.500.11822/7824 (accessed on 24 February 2023).
  15. UNEP. ‘Chemicals Proposed for Listing under the Convention’, Stockholm Convention. 2018. Available online: http://chm.pops.int/TheConvention/ThePOPs/ChemicalsProposedforListing/tabid/2510/Default.aspx (accessed on 18 March 2023).
  16. Lorenzoni, M.; Carosi, A.; Pedicillo, G.; Trusso, A. A comparative study on the feeding competition of the European perch Perca fluviatilis L. and the ruffe Gymnocephalus cernuus (L.) in Lake Piediluco (Umbria, Italy). BFPP/Bull. Fr. Pêche Piscic. 2007, 387, 35–57. [Google Scholar] [CrossRef] [Green Version]
  17. LaPorta, G.; Angeli, V.; Bicchi, A.; Carosi, A.; Pedicillo, G.; Viali, P.; Lorenzoni, M. Variations in the fish community in lake Piediluco (Italy) caused by changes in the lakes trophic status and the introduction of alien species. J. Appl. Ichthyol. 2010, 26, 53–59. [Google Scholar] [CrossRef]
  18. DiVeroli, A.; Goretti, E.; Marcucci, C.; Fabrizi, A.; Scopetta, L.; Di Giovanni, M.V. Incidence of larvae mouth part deformities in Chironomus plumosus and Procladius sp. From Piediluco Lake, Italy. Bol. Mus. Mun. Funchal 2008, 13, 13–20. [Google Scholar]
  19. Mastrantuono, L.; Pilotto, F.; Rossopinti, A.; Bazzanti, M.; Solimini, A.G. Response of littoral macroinvertebrates to morphological disturbances in Mediterranean lakes: The case of Lake Piediluco (central Italy). Fundam. Appl. Limnol. 2015, 186, 297–310. [Google Scholar] [CrossRef]
  20. DiVeroli, A.; Selvaggi, R.; Pellegrino, R.M.; Goretti, E. Sediment toxicity and deformities of chironomia larvae in Lake Piediluco (Central Italy). Chemosphere 2010, 79, 33–39. [Google Scholar] [CrossRef]
  21. Mearelli, M. Eutrofizzazione. Riv. Idrobiol. 1988, 27, 651–661. [Google Scholar]
  22. Cioffi, F.; Gallerano, F. Response of lake Piediluco to the change of hydrodynamic conditions and nutrient load reductions. Ecol. Model. 2000, 135, 199–229. [Google Scholar] [CrossRef]
  23. Umbria Regional Agency for Environmental Protection (ARPA Umbria). Monografia15/Caratterizzazione Ambientale del Lago di Piediluco. 2005. Available online: https://www.arpa.umbria.it/au/pta/monografie/MONOGRAFIA%2015.pdf (accessed on 30 January 2023).
  24. EuropeanCommunity. Directive2000/60/EC of the European Parliament and of the Council of 23 October 2000 establishing a framework for Community action in the field of water policy. Off. J. Eur. Communities 2000, 22, L327. [Google Scholar]
  25. Mearelli, M.; Tiberi, O. Caratteristichefisiograficheedatifisico-chimici. Monografia–Contributi alla conoscenza del Lago di Piediluco. Riv. Idrobiol. 1988, 27, 607–633. [Google Scholar]
  26. Italian Electric Energy Agency (ENEL). Monitoraggio del Lago di Piediluco; Rapporto finale; Italian Electric Energy Agency: Rome, Italy, 1997. [Google Scholar]
  27. Umbria Regional Agency for Environmental Protection (ARPA Umbria). Rilievo Batimetrico del Lago di Piediluco; Rapporto finale; ARPA Umbria: Perugia, Italy, 2001. [Google Scholar]
  28. De Felip, E.; Miniero, R. Analytical procedures adepte to determine microcontaminants in lagoon sediments. In Rapporti ISTISAN 99/28; Istituto Superiore di Sanità: Roma, Italy, 1999; ISSN 1123-3117. [Google Scholar]
  29. Sebastiani, B.; Falcinelli, S. Contamination of Plants from Amazonia by Environmental Pollution. Environments 2018, 5, 33. [Google Scholar] [CrossRef] [Green Version]
  30. Küchler, T.; Brzezinski, H. Application GC-MS/MS for the analysis of PCDD/Fs in sewage effluents. Chemosphere 2000, 40, 213–220. [Google Scholar] [CrossRef] [PubMed]
  31. Bettinetti, R.; Galassi, S.; Guilizzoni, P.; Quadroni, S. Sediment analysis to support the recent glacial origin of DDTpollution in Lake Iseo (Northern Italy). Chemosphere 2011, 85, 163–169. [Google Scholar] [CrossRef] [PubMed]
  32. Marziali, L.; Guzzella, L.; Salerno, F.; Marchetto, A.; Valsecchi, L.; Tasselli, S.; Roscioli, C.; Schiavon, A. Twenty-year sediment contamination trends in some tributaries of Lake Maggiore (Northern Italy): Relation with anthropogenic factors. Environ. Sci. Pollut. Res. 2021, 28, 38193–38208. [Google Scholar] [CrossRef] [PubMed]
  33. Kalajzic, T.; Bianchi, M.; Muntau, H.; Kettrup, A. Polychlorinatedbiphenyls (PCBs) and organochlorine pesticides (OCPs) in the sediments of an Italian drinking water reservoir. Chemosphere 1998, 36, 1615–1625. [Google Scholar] [CrossRef]
  34. Hong, S.H.; Yim, U.H.; Shim, W.J.; Oh, J.E.; Lee, I.S. Horizontal and vertical distribution of PCBs and chlorinated pesticides in sediments from Masan Bay, Korea. Mar. Pollut. Bull. 2003, 46, 244–253. [Google Scholar] [CrossRef]
  35. Said, T.O.; Okbah, M.A.; Mohamed, L.A.; Othman, I.M. Detection of persistent OCPs and PCBs in the near-shore coastal waters of Alexandria, Egypt. Environ. Monit. Assess. 2015, 187, 353. [Google Scholar] [CrossRef]
  36. Perez-Maldonado, I.N.; Trejo, A.; Ruepert, C.; Jovel Rdel, C.; Mendez, M.P.; Ferrari, M.; Saballos-Sobalvarro, E.; Alexander, C.; Yáñez-Estrada, L.; Lopez, D.; et al. Assessment of DDT levels in selected environmental media and biological samples from Mexico and Central America. Chemosphere 2010, 78, 1244–1249. [Google Scholar] [CrossRef]
  37. Martínez-Salinas, R.I.; Díaz-Barriga, F.; Batres-Esquivel, L.E.; Pérez-Maldonado, I.N. Assessment of the levels of DDT and its metabolites in soil and dust samples from Chiapas, Mexico. Bull. Environ. Contam. Toxicol. 2011, 86, 33–37. [Google Scholar] [CrossRef]
  38. Qiu, X.H.; Zhu, T. Using the o,p’-DDT/p,p’-DDT ratio to identify DDT sources in China. Chemosphere 2010, 81, 1033–1038. [Google Scholar] [CrossRef]
  39. Boul, H.L.; Garnham, M.L.; Hucker, D.; Baird, D.; Aislabie, J. The influence of agricultural practices on the levels of DDT and its residues in soil. Environ. Sci. Technol. 1994, 28, 1397–1402. [Google Scholar] [CrossRef]
  40. Qiu, X.; Zhu, T.; Yao, B.; Hu, S. Contribution of Dicofol to the current DDT pollution in China. Environ. Sci. Technol. 2005, 39, 4385–4390. [Google Scholar] [CrossRef]
  41. Manaca, M.N.; Grimalt, J.O.; Garí, M.; Sacarlal, J.; Sunyer, J.; Gonzalez, R.; Dobaño, C.; Menendez, C.; Alonso, P.L. Assessment of exposure to DDT and metabolites after indoor residual spraying through the analysis of thatch material from rural African dwellings. Environ. Sci. Pollut. Res. Int. 2012, 19, 756–762. [Google Scholar] [CrossRef] [Green Version]
  42. Tarcau, D.; Cucu-Man, S.; Boruvkova, J.; Klanova, J.; Covaci, A. Organochlorine pesticides in soil, moss and tree-bark fromNorth-Eastern Romania. Sci. Total Environ. 2013, 456, 317–324. [Google Scholar] [CrossRef]
  43. Yuan, G.L.; Sun, Y.; Qin, J.-X.; Li, J.; Wang, G.-H. Chiral signature of α-HCH and o,p′-DDT in the soil and grass of the Central Tibetan Plateau, China. Sci. Total Environ. 2014, 500, 147–154. [Google Scholar] [CrossRef]
  44. Da, C.; Liu, G.; Tang, Q.; Li, J. Distribution, sources, and ecological risks of organochlorine pesticides in surface sediments from the Yellow River Estuary, China. Environ. Sci. Process. Impacts 2013, 15, 2288–2296. [Google Scholar] [CrossRef]
  45. Beckvar, N.; Lotufo, G.R. DDT and Other Organohalogen Pesticides in Aquatic Organisms. In Environmental Contaminants in Biota: Interpreting Tissue Concentrations, 2nd ed.; Beyer, W.N., James, P.M., Eds.; US-EPA: Boca Raton, FL, USA, 2011; pp. 48–91. [Google Scholar]
  46. Tavares, T.M.; Beretta, M.; Costa, M.C. Ratio of DDT/DDE in the all saints bay, Brazil and its use in environmental management. Chemosphere 1999, 38, 1445–1452. [Google Scholar] [CrossRef]
  47. Iwata, H.; Tanabe, S.; Ueda, K.; Tatsukawa, R. Persistent organochlorine residues in air, water, sediments, and soils from the lake Baikal region, Russia. Environ. Sci. Technol. 1995, 29, 792–801. [Google Scholar] [CrossRef]
  48. Ristola, T.; Pellinen, J.; Van Hoof, P.L.; Leppänen, M.E.; Kukkonen, J. Characterization of lake Ladoga sediments. II.Toxic chemicals. Chemosphere 1996, 32, 1179–1192. [Google Scholar] [CrossRef]
  49. Environment Canada. A Reconnaissance of Contaminants in the Frazer River Drainage Basin Using Dated Sediment Cores from Six Lakes, DOE FRAP 1998-19; Environment Canada: Fredericton, NB, Canada, 1998. [Google Scholar]
  50. Muir, D.C.G.; Alex Omelchenko, A.; Grift, N.P.; Savoie, D.; Khart, W.L.; Wilkinson, P.; Brunskill, G.J. Spatial Trends and Historical Deposition of Polychlorinated Biphenyls in Canadian Mid latitude and Arctic Lake Sediments. Environ. Sci. Technol. 1996, 30, 3609–3617. [Google Scholar] [CrossRef]
  51. Provini, A.; Galassi, S.; Guzzella, L.; Valli, C. PCB profiles in sediments of lakes Maggiore, Comoand Garda(Italy). Mar. Freshw. Res. 1995, 46, 129–136. [Google Scholar] [CrossRef]
  52. Vives, I.; Canuti, E.; Castro-Jiménez, J.; Christoph, E.H.; Eisenreich, S.J.; Hanke, G.; Huber, T.; Mariani, G.; Mueller, A.; Skejo, H.; et al. Occurrence of polychlorinated dibenzo-p-dioxins and dibenzofurans (PCDD/Fs), polychlorinatedbiphenyls (PCBs) and polybrominated diphenyl ethers (PBDEs) in Lake Maggiore (Italy and Switzerland). J. Environ. Monit. 2007, 9, 589–598. [Google Scholar] [CrossRef] [PubMed]
  53. Li, A.; Rockne, K.J.; Sturchio, N.; Song, W.; Ford, J.C.; Wei, H. PCBs in sediments of the GreatLakes—Distribution and trends, homolog and chlorine patterns, and in situ degradation. Environ. Pollut. 2009, 157, 141–147. [Google Scholar] [CrossRef] [PubMed]
  54. Zitko, V. Chlorobiphenyls in sediments. Environ. Pollut. 2007, 145, 401. [Google Scholar] [CrossRef] [PubMed]
  55. Baldassarri, L.T.; D’Agostino, O.; DeFelip, E.; Di Domenico, A.; Fulgenzi, A.R.; Iacovella, N.; LaRocca, C.; Rodriguez, F.; Volpi, F. The ratio of 2,2′,3,4′,5′,6-Hexachlorobiphenyl (149) to 2,2′,4,4′,5,5′-Hexachlorobiphenyl (153) as a possible degradational and analytical indicator. Microchem. J. 1997, 22, 1–11. [Google Scholar] [CrossRef]
  56. Elliot, J.E.; Martin, P.A. Chlorinated hydrocarbon contaminats in Grebesans Seaducks wintering on the coast of British Columbia, Canada: 1988–1993. Environ. Monit. Assess. 1998, 53, 337–362. [Google Scholar] [CrossRef]
  57. Naffrechoux, E.; Cottin, N.; Pignol, C.; Arnaud, F.; Jenny, J.P.; Perga, M.E. Historical Profiles of PCB in Dated Sediment Cores Suggest Recent Lake Contamination through the “Halo Effect”. Environ. Sci. Technol. 2015, 49, 1303–1310. [Google Scholar] [CrossRef]
  58. Vartiainen, T.; Mannio, J.; Korhonen, M.; Kinnunen, K.; Strandman, T. Levels of PCDD, PCDF and PCB in Dated Lake Sediments in Subarctic Finland. Chemosphere 1997, 34, 1341–1350. [Google Scholar] [CrossRef]
  59. Umlauf, G.; Canuti, E.; Castro-Jimenez, J.; Christoph, E.H.; Eisenreich, S.J.; Ghiani, M.; Hanke, G.; Mariani, G.; Mueller, A.; Tourliti, V.; et al. Spatial distribution of PCDD/F in surface sediments of lake Maggiore (Italy). Organohalog. Compd. 2006, 68, 1141–1145. [Google Scholar]
  60. Dopico, M.; Gomez, A. Review of the current state and main sources of dioxins around the world. J. Air Waste Manag. Assoc. 2015, 65, 1033–1049. [Google Scholar] [CrossRef]
  61. Wagrowski, D.M.; Hite, R.A. Insights into the global distribution of polychlorinated dibenzo-p-dioxins and dibenzofurans. Environ. Sci. Technol. 2000, 34, 2952–2958. [Google Scholar] [CrossRef]
  62. Grochowalski, A.; Lassen, C.; Holtzer, M.; Sadowski, M.; Hudyma, T. Determination of PCDDs, PCDFs, PCBs and HCB Emissions from the Metallurgical Sector in Poland. Environ. Sci. Pollut. Res. 2007, 14, 326–332. [Google Scholar] [CrossRef]
  63. Meloni, D.; Carpine, F. Cinquanta Anni (1953–2002) di Osservazioni Meteo a Terni; di Terni, P., Ed.; Umbria: Perugia, Italy, 2004; p. 79. [Google Scholar]
  64. MacDonald, D.D.; Dipinto, L.M.; Field, J.; Ingersoll, C.G.; Long, E.R.; Scwartz, R.C. Development and evaluation of consensus-based sediment effectc on centrations for polychlorinated biphenyls. Environ. Toxicol. Chem. 2000, 19, 1403–1413. [Google Scholar] [CrossRef]
  65. MacDonald, D.D.; Ingersoll, C.G.; Berger, T.A. Development and evaluation of consensus-based sediment quality guidelines for freshwater ecosystems. Arch. Environ. Contam. Toxicol. 2000, 39, 20–31. [Google Scholar] [CrossRef]
  66. Ingersoll, C.G.; MacDonald, D.D.; Wang, N.; Crane, J.L.; Field, L.J.; Haverland, P.S.; Kemble, N.E.; Lindskoog, R.A.; Severn, C.G.; Smorong, D.E. Predictions of sediment toxicity using consensus-based freshwater sediment quality guidelines. Arch. Environ. Contam. Toxicol. 2001, 41, 8–21. [Google Scholar] [CrossRef]
  67. Ingersoll, C.G.; MacDonald, D.D.; Brumbaugh, W.G.; Johnson, B.T.; Kemble, N.E.; Kunz, J.L.; May, T.W.; Wang, N.; Smith, J.R.; Sparks, D.W.; et al. Toxicity assessment of sediments from the Grand Calumet River and Indiana Harbor Canal in north western Indiana. Arch. Environ. Contam. Toxicol. 2002, 43, 156–167. [Google Scholar] [CrossRef]
  68. Macfarlane, M.; MacDonald, D.D. Criteria for Managing Contaminated Sediment in British Columbia; Environmental Protection Division, British Columbia Ministry of Water, Landand Air Protection: Victoria, BC, Australia, 2002. [Google Scholar]
  69. Long, E.R.; Field, L.J.; MacDonald, D.D. Predicting toxicity in marine sediments with numerical sediment quality guidelines. Environ. Toxicol. Chem. 1998, 17, 714–727. [Google Scholar] [CrossRef]
Figure 1. Shape of Piediluco lake.
Environments 10 00120 g001
Figure 2. The relative contribution profiles of DDT and its breakdown products in all six surficial sediment analyzed, sampled in spring (S) and autumn (A).
Environments 10 00120 g002
Figure 3. PCB homolog % fingerprints of all sediment samples collected in both seasons, spring (S) and autumn (A), respectively, in the Lake Piediluco.
Environments 10 00120 g003
Figure 4. Score and loading plot of samples and variables in the dimensional space of factors 1 and 2, obtained by the PCA of the concentrations of PCB homologs (D, T, Te, Pe, Hx, Hp and OCBs) and those of total organochlorine pesticides (OCPs). (Blue dots for sites with lotic status; Green square for sites with lentic status).
Environments 10 00120 g004
Table 1. Morphometric parameters of Lake Piediluco (Regione Umbria, 1997).
ParameterValue
Perimeter (km)14.84
Area (km2)1.67
Volume (Mm3)18.56
Maximum depth (m)21
Mean depth (m)10.9
Length (km)2.8
Mean width (km)0.39
Sinuosity index3.28
Mean annual temperature (°C)15.33
Table 2. Site description of the lake Piediluco stations.
SiteSampling LocationDepth (m)Thickness Sediment (cm)
SASA
A42°31′18.1″ N 12°46′10.7″ E8.57.52117
B42°31′17.2″ N 12°45′55.1″ E6.05.52126
C42°31′53.8″ N 12°46′06.2″ E9.07.51533
D42°31′59.5″ N 12°45′29.1″ E18.519.02736
E42°32′21.1″ N 12°45′11.9″ E14.515.02126
F42°32′03.7″ N 12°44′30.8″ E5.05.01115
S = spring; A = autumn.
Table 3. Concentrations of individual organochlorine pesticides and their sum values in analyzed coresediments sampled in spring (S) and autumn (A), expressed as ng/g d.w. 1.
SiteABCDEF
SeasonSASASASASASA
α-HCH 2<0.030<0.030<0.030<0.030<0.030<0.030<0.030<0.030<0.030<0.030<0.030<0.030
β-HCH 3<0.030<0.030<0.030<0.030<0.030<0.030<0.030<0.030<0.030<0.030<0.030<0.030
γ-HCH 4<0.030<0.030<0.030<0.030<0.030<0.030<0.030<0.030<0.030<0.030<0.030<0.030
HCB 5<0.007<0.007<0.007<0.007<0.007<0.0070.021<0.0070.007<0.007<0.0070.010
Heptachlor<0.020<0.020<0.020<0.020<0.020<0.020<0.020<0.020<0.020<0.020<0.020<0.020
p,p’-DDT 60.023<0.0230.0430.078<0.023<0.0230.067<0.0232.1720.302<0.0230.261
o,p’-DDT 60.0420.0260.0360.0370.0540.0180.0510.0680.5000.1500.0700.260
p,p’-DDE 70.4080.2810.3590.2170.3020.1780.3060.1521.9170.3510.3810.632
o,p’-DDE 7<0.020<0.020<0.020<0.0200.0640.0890.020<0.0200.0910.0310.0450.035
p,p’-DDD 80.0750.0800.1180.0570.0850.0880.1240.0813.4990.3530.4560.522
o,p’-DDD 8<0.020<0.020<0.020<0.020<0.020<0.020<0.020<0.020<0.020<0.020<0.020<0.020
Totals0.5480.3870.5560.3890.5050.3730.5890.3018.1851.1860.9511.720
S = spring; A = autumn; 1 = dry weight; 2–4 = hexachlorocyclohexane; 5 = hexachlorobenzene; 6 = dichlorodiphenyltrichloroethane; 7 = dichlorodiphenyldichloroethylene; 8 = dichlorodiphenyldichloroethane.
Table 4. Concentrations of individual and coeluting PCB congeners and their sum values found in coresediments in spring (S) and autumn (A), expressed as ng/g d.w. 1 and total dioxin-like PCBs, as pg WHO-TEQ/g.
Sample SitesABCDEF
SeasonsSASASASASASA
DCB 2
100.002<0.0020.0020.0040.0030.0040.0030.0060.0020.0070.0090.002
40.0120.0080.0150.0330.0200.0130.0110.0280.0110.0510.0400.007
80.0080.0060.0080.0230.0140.0090.0110.0220.0040.0230.0700.009
150.004<0.0030.0030.0140.0060.0060.0050.013<0.0030.0130.0140.004
TCB 3
16 + 320.004<0.0040.0050.0420.024<0.004<0.004<0.0040.0120.0220.0680.009
28 + 310.0270.0340.0300.1110.0960.0660.0320.1280.0300.1200.1440.030
200.0110.0100.0110.0610.0350.056<0.006<0.0060.0090.0450.0590.006
330.009<0.0050.0080.049<0.005<0.0050.005<0.005<0.0050.0220.0330.012
220.008<0.0040.004<0.004<0.0040.0260.0070.0240.010<0.0040.0270.013
TeCB 4
520.0330.0380.0170.1310.0670.0600.0490.1420.0430.1260.2480.051
490.0120.0130.0090.0360.0220.0180.0180.0570.0230.0540.0940.021
47 + 480.006<0.005<0.0050.0290.0150.0120.0100.0250.0150.0260.0510.005
440.0150.0120.0080.0510.0290.0290.0230.0750.0210.0660.1200.027
420.002<0.002<0.0020.008<0.002<0.0020.0060.027<0.0020.0120.0290.004
410.003<0.0020.0020.0120.0100.0100.0070.0440.0090.0250.050<0.002
640.0110.0140.0060.0310.0230.0220.0180.0720.0170.0420.0790.014
740.0150.0120.0090.0470.0380.0220.0380.1120.0220.0460.1360.018
700.0320.0310.0160.0960.0720.0740.0540.1770.0490.1070.3180.056
800.0210.0150.0130.0420.0540.0290.0370.1070.0380.0620.2440.024
600.0110.0060.0110.0430.0230.0360.0230.0430.0110.0390.1190.012
770.0060.0120.005<0.0050.0140.0190.017<0.005<0.0050.0140.047<0.005
PeCB 5
820.003<0.003<0.0030.0130.015<0.003<0.003<0.003<0.003<0.0030.054<0.003
930.0360.0300.0150.0960.0680.0640.0570.1560.0690.1400.2520.053
920.0200.0110.0060.0120.0230.0300.0150.0720.0280.0300.0540.013
840.0170.006<0.0060.0330.0150.0330.0150.0200.0160.0350.0850.015
1010.0490.0460.0270.1230.1170.0870.0840.1910.1190.1830.2400.080
990.0200.0160.0100.0490.0470.0310.0360.0970.0450.0750.0900.037
970.0080.012<0.0080.0300.0210.0200.0190.0420.0280.0380.0810.024
870.0180.0200.0060.0550.0450.0490.0350.0870.0340.0660.1630.037
850.006<0.0060.0050.0130.0100.0160.0140.0390.0170.0190.0870.011
1100.0480.0580.0280.1610.1160.1240.1090.2580.1260.1790.7110.097
118 + 1230.0450.0470.0250.1240.1200.0990.0980.2250.0980.1560.6930.085
1050.0180.0180.0120.0650.0580.0480.0390.0730.0310.0660.2130.038
1260.004<0.004<0.0040.0280.0090.006<0.0040.0200.016<0.0040.058<0.004
HxCB 6
1510.023<0.0100.0100.1520.0750.0380.0490.1370.1290.1030.3700.043
1350.0180.0280.0230.1090.0400.0570.0570.1250.1130.0710.3380.049
1490.0680.0720.0400.2780.1950.1360.1940.4980.4200.2651.4690.132
131<0.012<0.0120.012<0.012<0.012<0.0120.0220.0410.0400.0230.1640.028
1460.009<0.009<0.0090.0300.0160.0170.0260.0650.0590.0390.1840.021
1530.0800.0750.0470.3040.2100.0920.1960.4180.3810.2601.3520.150
141 + 1790.020<0.0200.0200.0850.0760.0660.0530.1270.1040.0950.2350.037
130<0.032<0.032<0.032<0.032<0.032<0.032<0.032<0.032<0.032<0.0320.032<0.032
137<0.017<0.017<0.017<0.017<0.017<0.0170.0170.0270.0240.0300.0510.018
138 + 1580.0450.0460.0340.1500.1420.0870.0970.2100.1630.1480.5670.080
1280.016<0.0130.0130.0510.0320.0330.0390.0730.0440.0510.0970.031
HpCB 7
1740.012<0.0110.0110.076<0.0110.0410.0350.0700.0850.0230.2450.023
1800.0370.0340.0250.1580.1020.0230.0740.1600.1500.0870.1460.044
1700.0140.0160.0140.0740.0490.0200.0340.0740.0800.0290.0620.020
OCB 8
199<0.0050.006<0.0050.018<0.005<0.0050.0080.0120.0130.0050.0560.006
196 + 2030.007<0.0040.0040.0400.015<0.0040.0120.0340.0270.0160.0550.012
Total PCBs0.8910.7500.5703.1902.2101.7011.8094.4542.7813.15310.2061.506
Σ dl-PCBs 90.4110.0140.0082.8280.9240.6330.0262.0391.6220.0335.9220.015
1 = dry weight; 2, = dichloro-; 3 = trichloro-; 4 = tetrachloro-; 5 = pentachloro-; 6 = hexachloro-; 7 = heptachloro-; 8 = octachlorobiphenyls; 9 = dioxin-like (Σ 77, 126, 105, 118, 170 and 180 congeners).
Table 5. SQCs values for DDTs and PCBs for Lake Piediluco.
CompoundSQC ERL-ERM
ng/g d.w.
Sediment SamplesSQG TEL-PEL
ng/g d.w.
Sediment Samples
<ERLERL-ERM>ERM<TELTEL-PEL>PEL
p,p’-DDT1–7111-N.G.---
p,p’-DDE2–15111-1.42–6.8111-
p,p’-DDD2–20111-3.54–8.51111-
ΣDDTs3–350111-7–4500111-
PCBs50–40012--34–27712--
N.G. = no guideline; 1 = dry weight; ERL = Effects Range Low; ERM = Effects Range Median; TEL = Threshold Effect Level; PEL = Probable Effect Level.
Disclaimer/Publisher’s Note: The statements, opinions and data contained in all publications are solely those of the individual author(s) and contributor(s) and not of MDPI and/or the editor(s). MDPI and/or the editor(s) disclaim responsibility for any injury to people or property resulting from any ideas, methods, instructions or products referred to in the content.

