1. Introduction
Solid waste management is a worldwide problem. In 2020, the total production of urban waste in mainland Portugal was approximately 5.28 megatons, which corresponds to an annual capitation of 512.6 kg/(habitant/year), corresponding to a daily production of 1.4 kg per inhabitant. These values confirm the predisposition for growth in the production of solid waste that has been observed since 2014 [
1]. Therefore, it becomes imperative to find solutions for waste recovery.
Currently, one of the most used methods for energy recovery from waste is the transformation of raw waste into refuse-derived fuel (RDF), which is suitable for thermochemical processes [
2]. As it is derived from solid urban waste, RDF covers a wide variety of materials, such as cardboard, textiles, most varied types of plastic, organic waste, and also various types of unidentifiable components. This heterogeneity can have a strong influence on the properties of the RDF, such as density, lower heating value (LHV), moisture content, ash, and chlorine. These properties may end up limiting the application of RDF as a raw material in thermochemical conversion processes [
2]. Among the diversity of most varied types of thermochemical processes, in this work, emphasis will be given to carbonization and gasification. The pyrolytic carbonization process can be considered as a pyrolysis carried out at low temperatures, therefore causing the conversion of raw material, under an oxygen-free atmosphere, into a char [
3,
4].
From the several types of thermochemical processes, commercially available gasification technologies are classified according to several parameters, including the heat supply method, the gasification agent used, and the type of reactor [
5]. As for the gasifier concessions, they typically fall into four main categories: fixed bed (co-current, counter-current, and cross-current), fluidized bed (bubbling and circulating), entrained fluidized bed, and plasma gasifiers [
6,
7,
8,
9]. All these reactors have advantages and disadvantages and the selection depends on the scale of operation, the characteristics of the raw material, and the application of the desired product gas [
10].
Fixed-bed gasifiers are the simplest gasification technology that takes place through a slow system. These gasifiers use oxidizing agents, and gasification takes place over a time of approximately 900–1800 s at high pressure [
11]. Fixed-bed systems have a cylinder-shaped space where the feedstock is introduced at the top of the reactor, while the gassing agent is added at the bottom. The reactor is at high pressures and a temperature of around 500–1200 °C, thus resulting in a high carbon conversion [
6]. In the downdraft reactor, the feedstock enters the top of the reactor; however, the gasification agents enter the side or top of the gasifier. Therefore, the output of syngas takes place at the bottom of the bed. Several studies have recognized that fixed-bed reactors can be used on various types of waste with a high carbon conversion rate and low ash emissions. However, this type of gasifier is not typically used on large scales due to the low moisture content required in the raw material, which is one of the limitations for the use of municipal solid waste [
6]. Nevertheless, regardless of the type of gasifier used, there is always the formation of different types of by-products, namely large amounts of char. This reality is leading the scientific community to continue to look for applications for this type of by-product, which may involve the use of physical and chemical modification processes, such as activation processes, to improve their physical and chemical properties. When biomass materials are used in these thermochemical processes, the large amounts of char become a good precursor to produce activated char [
7,
12,
13,
14,
15,
16,
17,
18,
19,
20,
21,
22,
23,
24,
25,
26,
27]. Another stage of the process that is sometimes important to consider and explore is the pre-treatment of waste, particularly biomass, which can influence these results [
12,
13].
Liquid phase adsorption is a commonly used process in the removal of pollutants from the aqueous phase. It is possible to use low-cost adsorbents in wastewater treatment. Adsorption processes are also used to remove harmful compounds from a wide range of industrial effluents, such as paints, pesticides, oil, printing, pharmacology, wood, paper, and steel industries [
14,
15,
16]. Another frequent application for low-cost adsorbents is gas phase adsorption, for example, to clean exhaust gas or syngas, and overall gas purification [
17,
18,
19].
Phenol is a chemical compound from the family of aromatic hydrocarbons in which a hydrogen atom in the ring is replaced by a hydroxyl group. Phenols have been increasingly considered over the last few years due to their high toxicity. Phenolic compounds can be derived from various manufacturing processes and industries, such as pharmaceuticals, oil refineries, coke plants, and phenolic resin. Another problematic compound is
p-nitrophenol or 4-nitrophenol (PNF), which is also a phenolic compound and is among the common contaminants in the discharge of effluents generated from the most varied types of industries, such as pharmaceutical products, petrochemicals, coke ovens, steel, insecticides, herbicides, and other chemical production industries [
20].
The main objective of this work was to evaluate the possibility of valuing the by-products resulting from the gasification and carbonization of RDF and lignocellulosic biomass through applications in adsorption processes. The samples obtained from all the raw materials, carbonized raw materials, and selected mixtures were analyzed using a set of characterization techniques. This work intends to contribute to a better understanding of the potential of these waste-derived char materials and how they can be relevant to increasing circularity in these thermochemical processes.
2. Materials and Methods
2.1. Precursor Materials
The olive tree pruning (OTP) biomass is a well-studied lignocellulosic biomass and comes from olive tree branches from the Alentejo region in Portugal. The CMC biomass sample (CMC) is characterized by being derived from pine and has a small amount of plastic waste in its composition. This biomass originates from the recycling of furniture and waste from the manufacturing process and is supplied by a Portuguese company. The RDF sample used throughout this study came from a waste recovery and treatment company in Portugal. Because it is a residue derived from solid urban waste, RDF covers a wide variety of materials, such as cardboard, textiles, the most varied types of plastic, metals, rubber, organic waste, and also various types of non-identifiable components.
To facilitate the understanding of this work and sample identification, the nomenclature was simplified and is showed in
Table 1. More information about the chemical and physical composition of the samples can be found in the subsequent subsections.
2.2. Thermogravimetric Analysis—TGA
For the thermogravimetric analysis (TGA), a thermogravimetric analyzer model PerkinElmer STA6000 (Billerica, MA, USA) was used. The analyses were performed under an oxidative atmosphere, without gas flow, and the tests were carried out from 30 to 995 °C at a heating rate of 10 °C/min. The sample mass used was between 3.5 and 7 mg. After the analysis is completed, the equipment allows us to analyze the data obtained by TGA and calculate the derivative of the obtained curve (DTG).
2.3. X-ray Fluorescence—XRF
X-ray fluorescence analysis was performed on a Thermo Scientific Niton (Billerica, MA, USA) XRF analyzer. This analysis was performed using a weighted average of three analyses and using the AllGeo (Palo Alto, CA, USA) test method.
2.4. Fourier Transform Infrared Spectroscopy—FTIR
Fourier transform infrared (FTIR) spectra were obtained in a range of 4000 to 500 cm−1. The equipment used was a Thermo Scientific model Nicolet iS10 (Miami, OK, USA), with an accessory for the analysis of solid samples, ATR SMART iTR. For the most heterogeneous samples, three analyses were performed to ensure accuracy in the analysis. For the remaining samples, only one analysis was performed.
2.5. Elemental Analysis CHNS-O—AE-CHNS-O
Due to the heterogeneity of the RDF and the biomass, a precise knowledge of the chemical composition is necessary. The equipment used to obtain these results was a Thermo Scientific model Flash 2000 Organic Elemental Analyzer (Miami, OK, USA), with an autosampler with a capacity of thirty-one samples.
2.6. Nitrogen Adsorption at 77 K—N2-77 K
Nitrogen adsorption isotherms at 77 K were carried out in a volumetric adsorption apparatus from Micrometrics, model ASAP 2020 (Norcross, GA, USA). The use of specific software, the ASAP 2020 program, allows for the control of the entire equipment. The results obtained, number of moles adsorbed per unit mass of adsorbent, expressed in mmol g−1, as a function of the different values of relative pressure constitute the nitrogen adsorption isotherm at 77 K. The process of sample preparation consisted in the rigorous and accurate weighing of a sample amount between 0.0950 and 0.3 g. Then, the sample was degassed for a period of eight hours at the final temperature of 453 K, which was reached using a heating rate of 1 Kmin−1. After cooling to room temperature, the sample was carefully weighed again immediately before the start of the analysis.
2.7. Determination of the Point of Zero Charge—pHpcz
In determining the pHpcz, a current pH meter was used. Activated char was placed in a sodium nitrate solution (0.1 M) in a thermostated bath (Grant brand and model OLS Aqua Pro (Cambridge shire, UK)) with stirring. After filtering the suspension, the pH of the filtrate was measured after 48 h of contact. For this determination, approximately 0.15 g of the samples considered representative was used.
2.8. Modification of the Precursor Materials—Carbonization
The carbonization of the samples was carried out in a Stuart Scientific Furnace (Stuart, FL, USA) muffle at a temperature of 350 °C with a residence time of 30 min.
2.9. Modification of the Precursor Materials—Gasification
For the two gasification tests, C biomass and R were used. The gasifications were carried out in a gasifier with a downdraft reactor. Two tests were carried out: the first with C biomass only and the second test with C+R in a proportion of 90–10%. The gasification tests were carried out on a Power Pallets AllPowerLabs PP20 (Berkeley, CA, USA). At the bottom of the reactor there is a char collection system, with an endless screw, which pushes the material into a deposit. The chars used for this study were collected in the unconverted material deposit of the gasification system.
2.10. Preparation of Adsorbents
The preparation of activated carbon adsorbents, based on precursor residues previously carbonized and gasified, was carried out in a semi-industrial horizontal furnace of the brand Termolab and model TR-334 (Maharashtra, India). In the preparation of physically activated chars using the previously mentioned oven, for the samples stabilized with N2, the temperature ramp was used from room temperature to 500 °C with a heating rate of 10 °C/min and a residence time at the maximum temperature of 15 min, with an average nitrogen flow of 110 mL/min. For samples activated with air, a temperature ramp was used from room temperature to 500 °C with a heating rate of 10 °C/min and a residence time at the maximum temperature of 90 min, with an average gas flow of 180 mL/min. In the preparation of chemically activated chars, sodium hydroxide, NaOH, and phosphoric acid, H3PO4, were used as activating agents. The impregnation time of these samples was approximately 96 h and in a ratio of 2:1 for both activating agents. After drying, the samples were taken to the activation furnace. For samples activated with NaOH and H3PO4, the temperature ramp was used from room temperature to 500 °C with a heating rate of 10 °C/min and a residence time at the maximum temperature of 60 min.
2.11. Liquid Phase Adsorption Tests of Probe Molecules
Adsorption tests of probe molecules, phenol and p-nitrophenol, on activated chars took place in a thermostatic bath of the Grant brand and OLS Aqua Pro (Cambridge, UK) model with agitation at 25 °C. The reagents used were p-nitrophenol (99+% purity) and phenol (99+% purity). Sodium hydroxide (1 M) and hydrochloric acid (1 M) were used for pH control in the adsorption medium. Higher concentration solutions were prepared, mother solutions, from which lower concentration solutions were prepared. These solutions were placed in contact with the adsorbents for the analysis of removal of the studied molecules from the liquid phase. In this study, the p-nitrophenol and phenol concentration ranges between 0.2 and 10 mmol/L. Solid masses of between 0.5 and 1.5 g were used for both kinetic and equilibrium studies.
2.12. Dosage of the Phenolic Probe Molecules
The quantification of the probe molecules was carried out using a visible ultraviolet spectrophotometer, UV-Vis, Thermo model and NICOLEt evolution 300 model (Berkeley, CA, USA), and quartz cells were used for these analyses with an optical path of 1 cm. Dosing was performed in a basic medium for p-nitrophenol and in an acidic medium for phenol; whenever the absorbance values were outside the range measurable directly in the equipment (UV-Vis), dilutions of the solution were made after adsorption.
3. Results
3.1. Thermogravimetric Analysis—TGA
In general, for raw biomass, the first changes in the thermogravimetric curve are due to the drying of the material; some moisture and certain volatile compounds are eliminated, usually from the initial temperature up to 180 °C [
21]. When considering lignocellulosic biomass, the degradation temperature of hemicellulose and lignin is lower when compared to the degradation temperature of cellulose [
21]. In the case of materials with a high percentage of ash and impurities, this initial degradation step could be interpreted as a lower initial thermal degradation under oxygen limiting conditions [
21]. Hemicellulose begins to decompose at temperatures above 180 °C [
21]. The maximum weight of the sample was verified in the region of rapid combustion approximately between 280 °C and 480 °C. The profiles of the thermogravimetric curves show that the sample C (the thermal profiles of these samples can be found in the
Appendix A in
Figure A1) presents an initial inertia to the transformation, reaction, and degradation as a function of temperature, higher than that of the O sample, which is more evident in the higher temperature range (about 400 °C). In
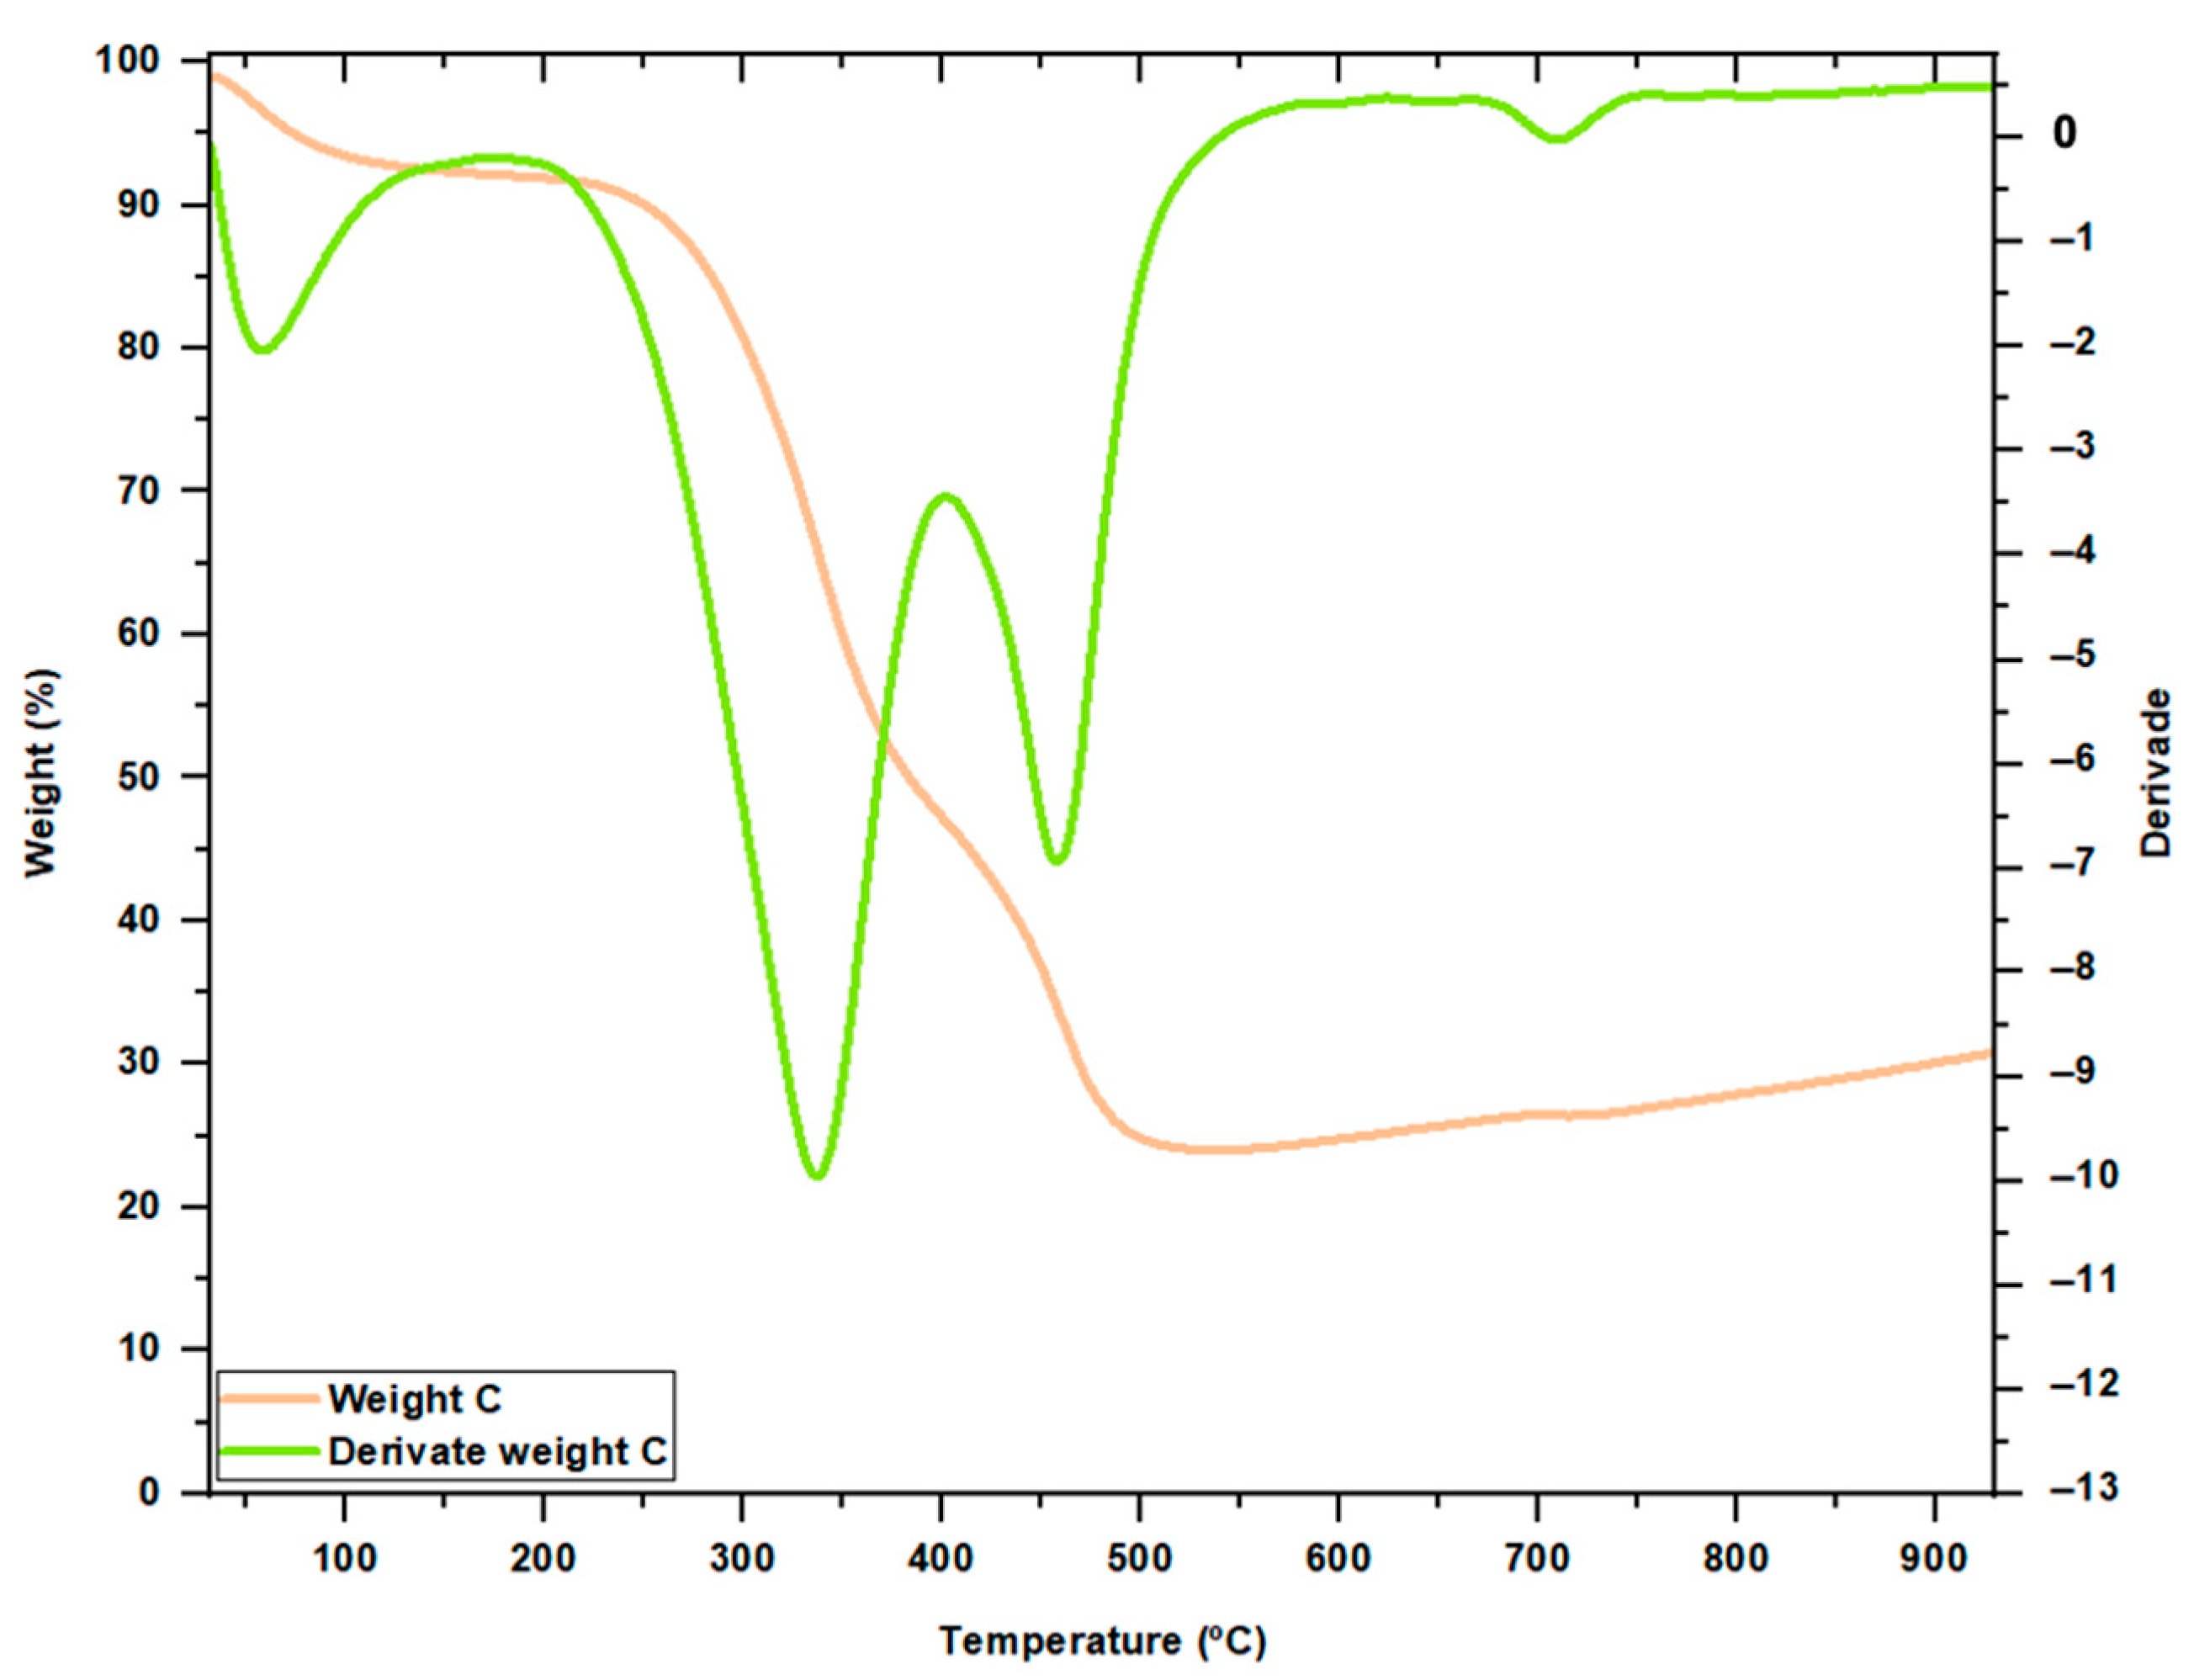
Figure 1a, it is possible to see the TGA analysis of sample O. It is possible to realize that the samples have a low moisture content. Compared to sample C, it was observed that the C samples have a much higher ash content than the O sample.
The thermal behavior of sample R,
Figure 1b, is clearly different, which is explained by the nature and composition of this material. We are in the presence of a material composed of a mixture of constituents of very different natures (inorganic and organic), namely plastics, rubber, aluminum, food waste, wood, aggregates, and others, which determine a quite different thermogravimetric profile, with loss of mass and very different reactivity. Reactivity and mass variation occur with incidence in the range between 250 °C and 550 °C, and the final residual mass reaches very high values, around 50%. It is worth noting the appearance of a peak in the higher temperature range, around 725 °C, which is related to the final mass loss around 700 °C, due to the decomposition of carbonates [
22].
It was possible to verify that both carbonized biomasses have a low moisture content (possibly atmospheric humidity), a small amount of volatile matter, and a very high percentage of fixed carbon. This behavior is typical of carbonized biomass and is present in both the C(C) and C(O) samples. The carbonized mixtures, samples C(C+R) and C(O+R), behave like carbonized biomass. In
Figure 1c, we can observe this type of behavior for sample C(C+R).
3.2. X-ray Fluorescence—XRF
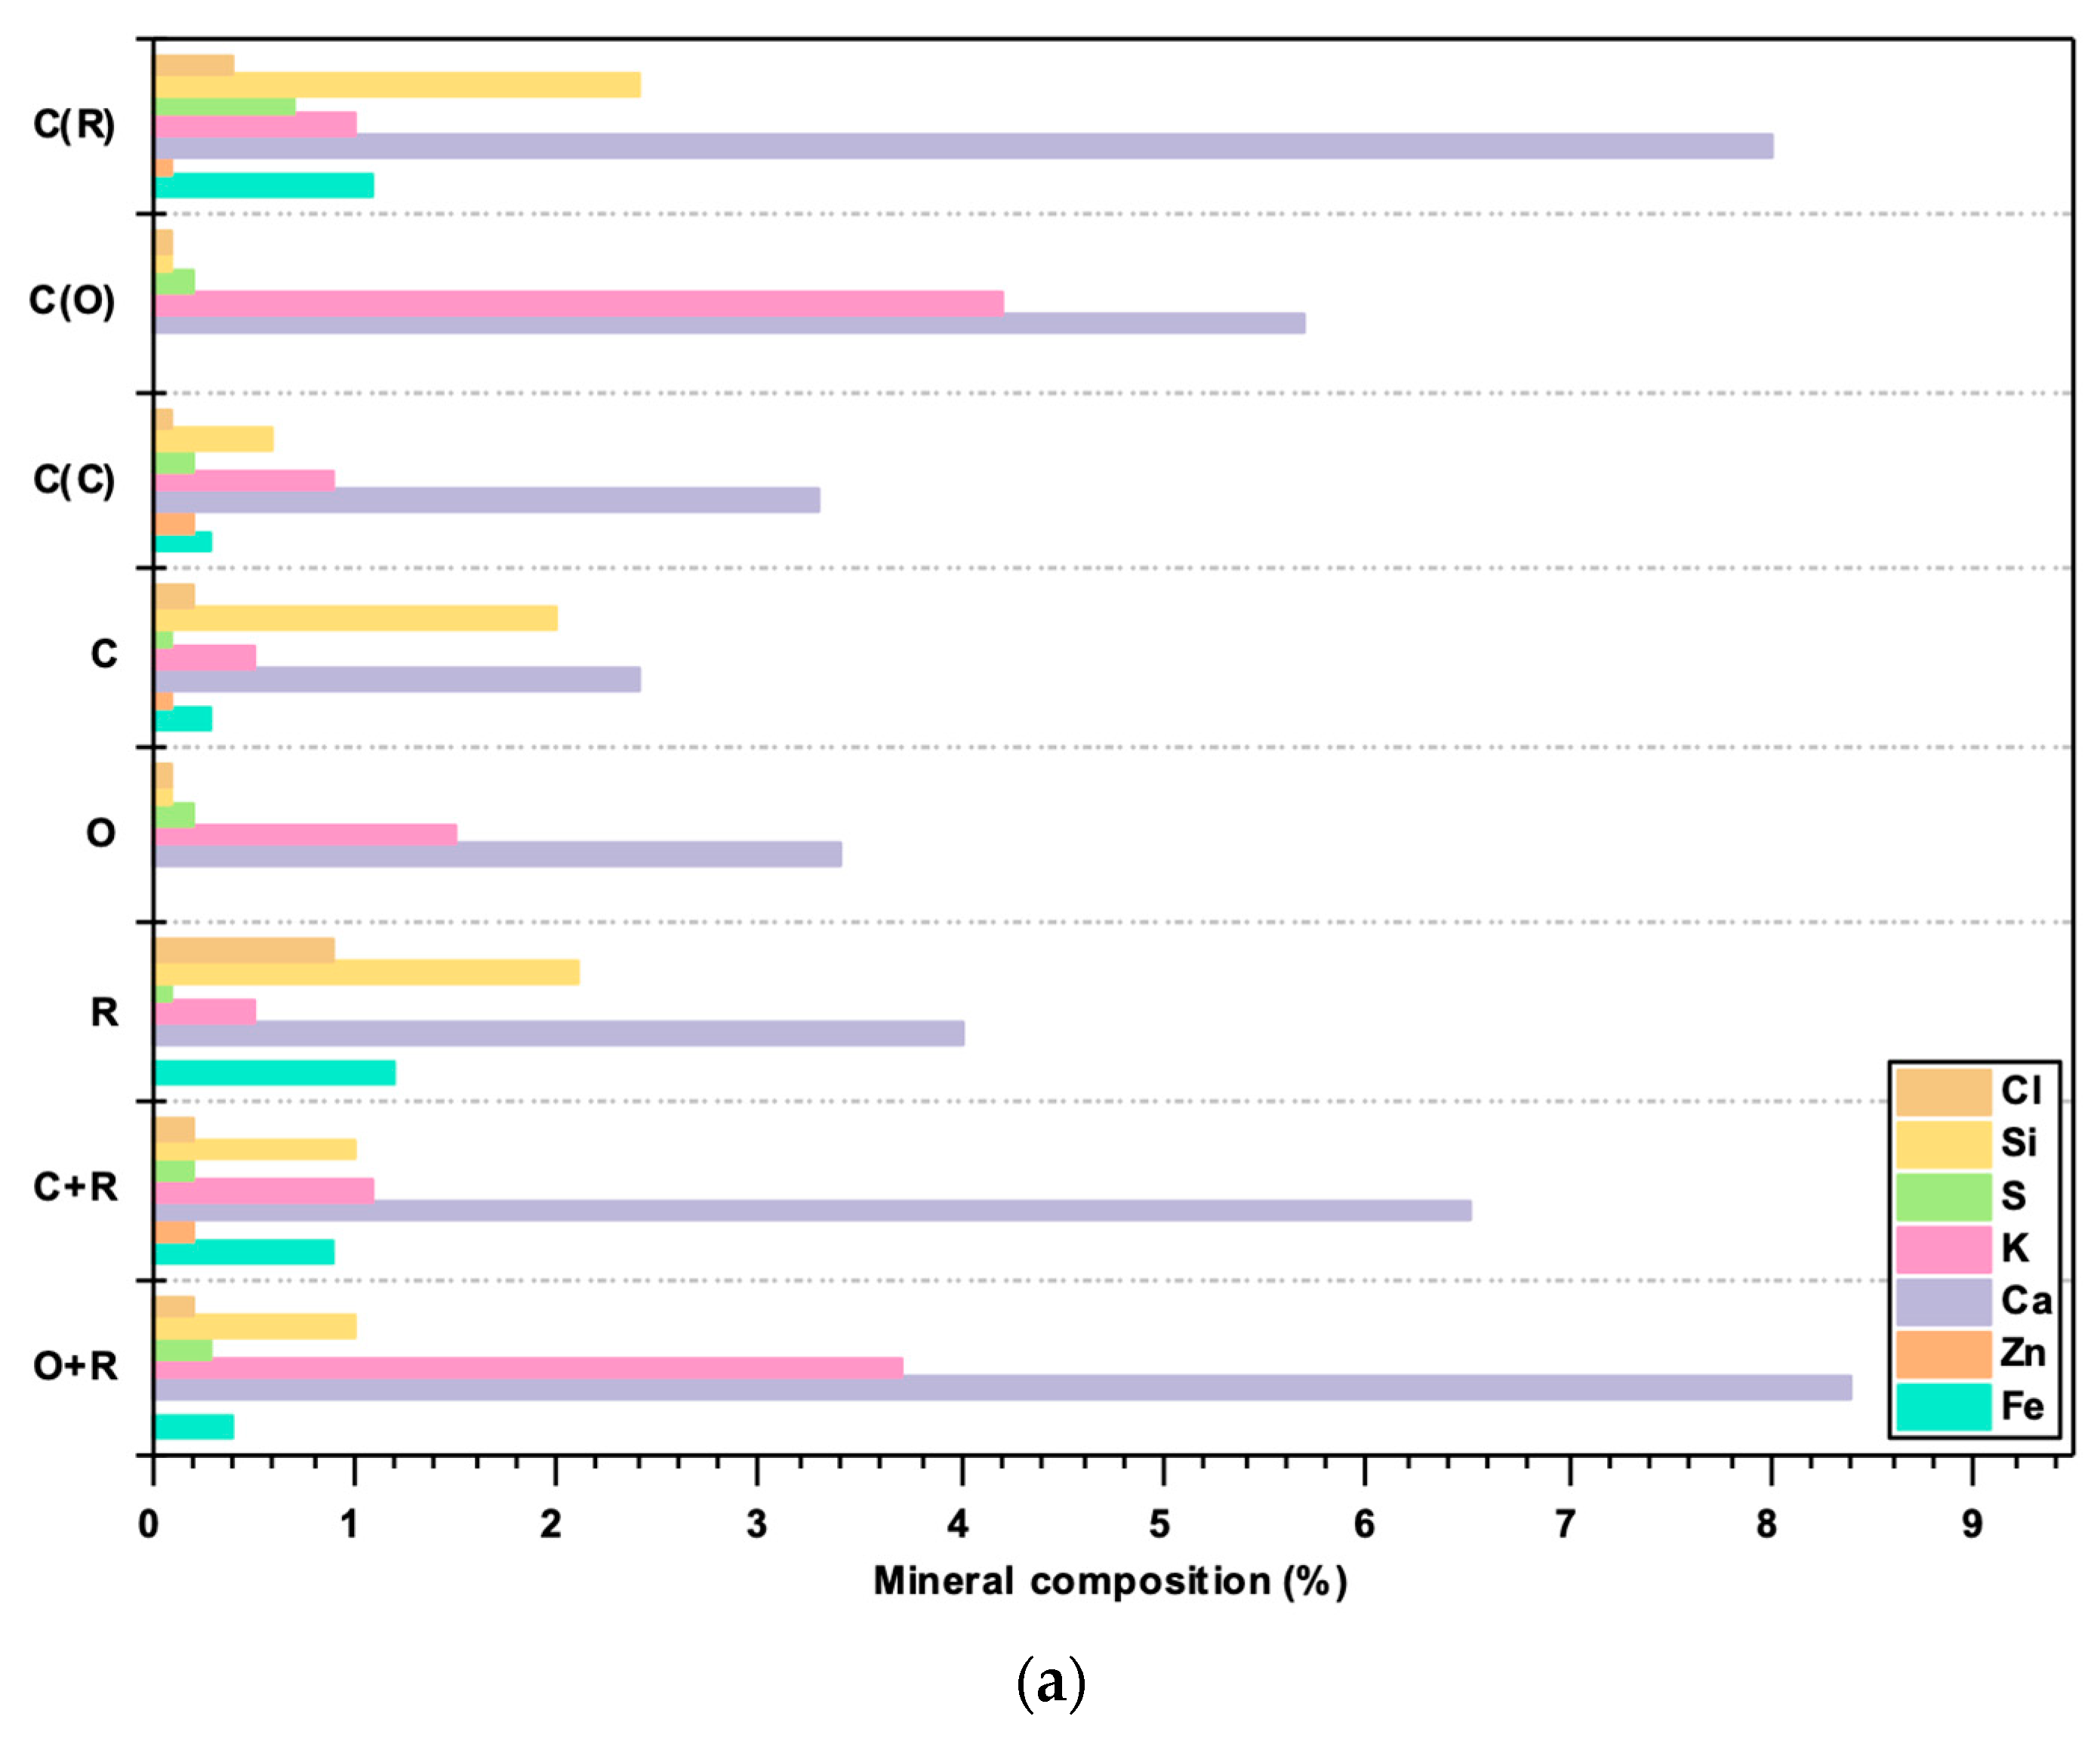
In the thermochemical processes, it is very important to consider the Cl content of the material since a high concentration of Cl can cause serious problems, such as equipment deterioration and the formation of toxic gases.
In
Figure 2, it is possible to observe the Cl content of each analyzed sample. The R sample is the sample that has the highest percentage of Cl. For these samples, carbonization decreases the Cl content in the samples. For the remaining representative elements, also illustrated in
Figure 2, these graphs tell us that the elements Ca and K and samples activated with H
3PO
4 have the highest concentrations. P can also be found in large amounts. The elements with the lowest concentrations are S and Zn. The percentage of chlorine present in the biochar tends to increase when the material is carbonized, due to the loss of sample mass and the devolatilization of the chlorine deposited on the sample surface [
23]. In this case, it does not. It should be noted that gasified samples tend to have a higher percentage of Cl, possibly due to the gasifying equipment. In these samples, it is also possible to verify a significant increase of Fe, and the gasification reactor has iron components; this is possibly the reason for this increase.
3.3. Fourier Transform Infrared Spectroscopy—FTIR
Figure 3,
Figure 4 and
Figure 5 refer to some examples of the FTIR analysis of the samples. It can be verified that there are no relatively large differences between the carbonized samples (only biomass and mixtures). For the R sample, there is a very big difference between the raw material and the carbonized material; most of the functional groups present in the raw material are not present in the carbonized material. This feature can be explained by the strong impact that heat treatment has on this complex material, leading to a poorer material from a chemical point of view. Regarding the chemically and physically activated samples, it is possible to verify through the graphs the differences that occur between the raw material and the activated samples.
According to previously published work [
24], the main functional groups found in the samples are the bands located between 3200 and 3500 cm
−1 that can be attributed to the O-H stretching of the hydroxyl groups. The bands seen at approximately 2928 and 2398 cm
−1 can possibly be attributed to the C-H stretching of the methyl groups. The bands that are shown at approximately 1066 cm
−1 can possibly be attributed to C-O, and the bands between 1610 and 1700 cm
−1 are from the stretching C=O groups of the carboxyl groups. Around 900 cm
−1, it is possible to see the vibration of aromatic compounds [
24].
For the gasified samples, it is possible to observe that they are relatively poorer from a chemical point of view than the gasified and activated samples. Since gasification occurs at much higher temperatures than carbonization, this behavior was to be expected.
Lastly, a peak appears between 2225 and 2400 cm−1 in almost all the spectra of the analyzed samples. This is related to the presence of carbon, namely in the form of bonds of the type —C≡C—, N=C=O, and C=N=O and the presence of atmospheric CO2 retained by the samples in the preparation and realization process of the analysis.
3.4. Elemental Analysis CHNS-O—AE-CHNS-O
In
Table 2, it is possible to observe the values obtained through elemental analysis for the samples in this study. Normally, for the carbon content of biomasses, ranges from 44% to 75% are expected [
25]. For the biomasses under study, sample C has a carbon content of 46.8%, and for sample O, it is 44.4%. For the R sample, the carbon value is 41.0%. For the samples O and R, the percentage of carbon increased when the samples were carbonized, as expected. However, the same did not happen for sample C. Both biomasses have very similar hydrogen and sulfur values; however, regarding nitrogen composition, sample C has much more of this element in its composition. For the R sample, it is possible to observe that in relation to the elements nitrogen, hydrogen, and sulfur, it has a behavior quite different from the biomass under analysis.
Regarding the activated samples, the carbon values are similar throughout the set of samples except for the samples prepared from CMC biomass and the H3PO4/C(R) sample. In the first case, these low values can be explained by the low content of carbon that was previously detected on the precursor. In the case of sample H3PO4/C(R), factors such as the heterogeneity of the precursor batch and the acid chemical interaction with the RDF waste could explain the values achieved. Regarding hydrogen, the values are also quite similar to each other, with the exception of the H3PO4/C(C) sample. For nitrogen, the values remain similar among all the activated samples. The sulfur that appears in the Air/C(O+R), Air/C(C+R), and N2/C(O+R) samples can have several origins, including originating from the precursors, which are quite heterogeneous, despite having the same origin. On the other hand, insignificant percentages of sulfur in the precursors gain percentage weight when the sample is subjected to thermal conditioning in the presence of air and N2.
As far as the percentage of carbon is concerned, the G(C) sample has about 10% more carbon than the G(C+R) sample. For the gasified samples activated with H3PO4, both samples show similar results. For the gasified NaOH activated samples, the carbon percentage values obtained are quite different; the NaOH/G(C+R) sample has approximately 20% more carbon percentage than the NaOH/G(C) sample. The nitrogen and hydrogen values are similar for all gasified samples. For the element sulfur, the G(C+R) sample has a very high percentage, 3.5%, which could be due to the gasifying equipment.
It should be noted that due to the heterogeneity of the materials under study, these values may have alterations.
3.5. Nitrogen Adsorption at 77 K—N2-77 K
The specific surface area of the samples was calculated according to the Brunauer–Emmett–Teller (BET) method. The linear part of the nitrogen adsorption isotherms at 77 K was used for each sample [
26].
Table 3 presents the values obtained for the specific surface area (BET) of the carbonized materials. The values obtained for these samples vary approximately between 120 and 370 m
2/g.
According to previously published work [
24], we can perceive that in biochar from wood chips, similar to the biomass under study, the surface area (BET) of the biochar was 172 m
2/g. For the C sample, we can observe that the incorporation of RDF leads to a decrease in the surface area. For the O sample, it is the opposite: the incorporation of the RDF material increases the BET surface area by 10 m
2/g. Although the observed variations are slight, this distinct behavior can be explained by the different nature of the precursors, which will lead to the formation of slightly different RDF–biomass interactions. This interpretation can be confirmed by the FTIR analysis, which highlights this slight difference of chemical nature, and thus also a structural variation with measurable consequences in the BET analysis.
Regarding the activated carbonized sample H3PO4/C(O+R), the surface area of this sample increases by more than 50% in relation to the sample without activation. The activated carbonized samples from H3PO4/C(O) and the activated H3PO4/C(C) increase by about 20% in relation to the sample without activation. The NaOH/C(C+R) sample decreases by about 20% compared to the sample without activation. The activated sample NaOH/C(O+R) decreases by around 90 m2/g in relation to the sample without activation, and the sample Air/C(C+R) increases by around 120 m2/g in relation to the sample without activation. Comparing the gasified samples to the carbonized samples, the C(C) and C(C+R) samples have a relatively smaller surface area than the G(C) and G(C+R) samples. All activated and gasified samples have an increase in their surface area when chemically activated. The NaOH/G(C+R) and H3PO4/G(C+R) samples have an increase of about 30 m2/g; however, the NaOH/G(C) sample has the highest increase, about 180 m2/g, and the H3PO4/G(C) sample increases by about 120 m2/g compared to gasified samples without activation.
For the remaining samples, there are no significant differences in the surface area obtained.
3.6. Determination of the Point of Zero Charge—pHpcz
Due to the small amount of some of the samples, only certain samples were subject to determination of the point of zero charge. By observing the pH
pcz values, shown in
Table 4, it is possible to infer that for the samples chemically activated with H
3PO
4, the values are approximately 2. Thus, for the chemically activated samples H
3PO
4, the acid character of the prepared samples is contacted. In relation to the chemically activated sample with NaOH, the point of zero charge was 9, having a basic character. The physically activated samples present a point of zero charge of around 10, verifying their basic character. Through these two samples, it is possible to say that all the chemically activated samples have a basic character.
3.7. Liquid Phase Adsorption Tests of Probe Molecules
3.7.1. Phenol
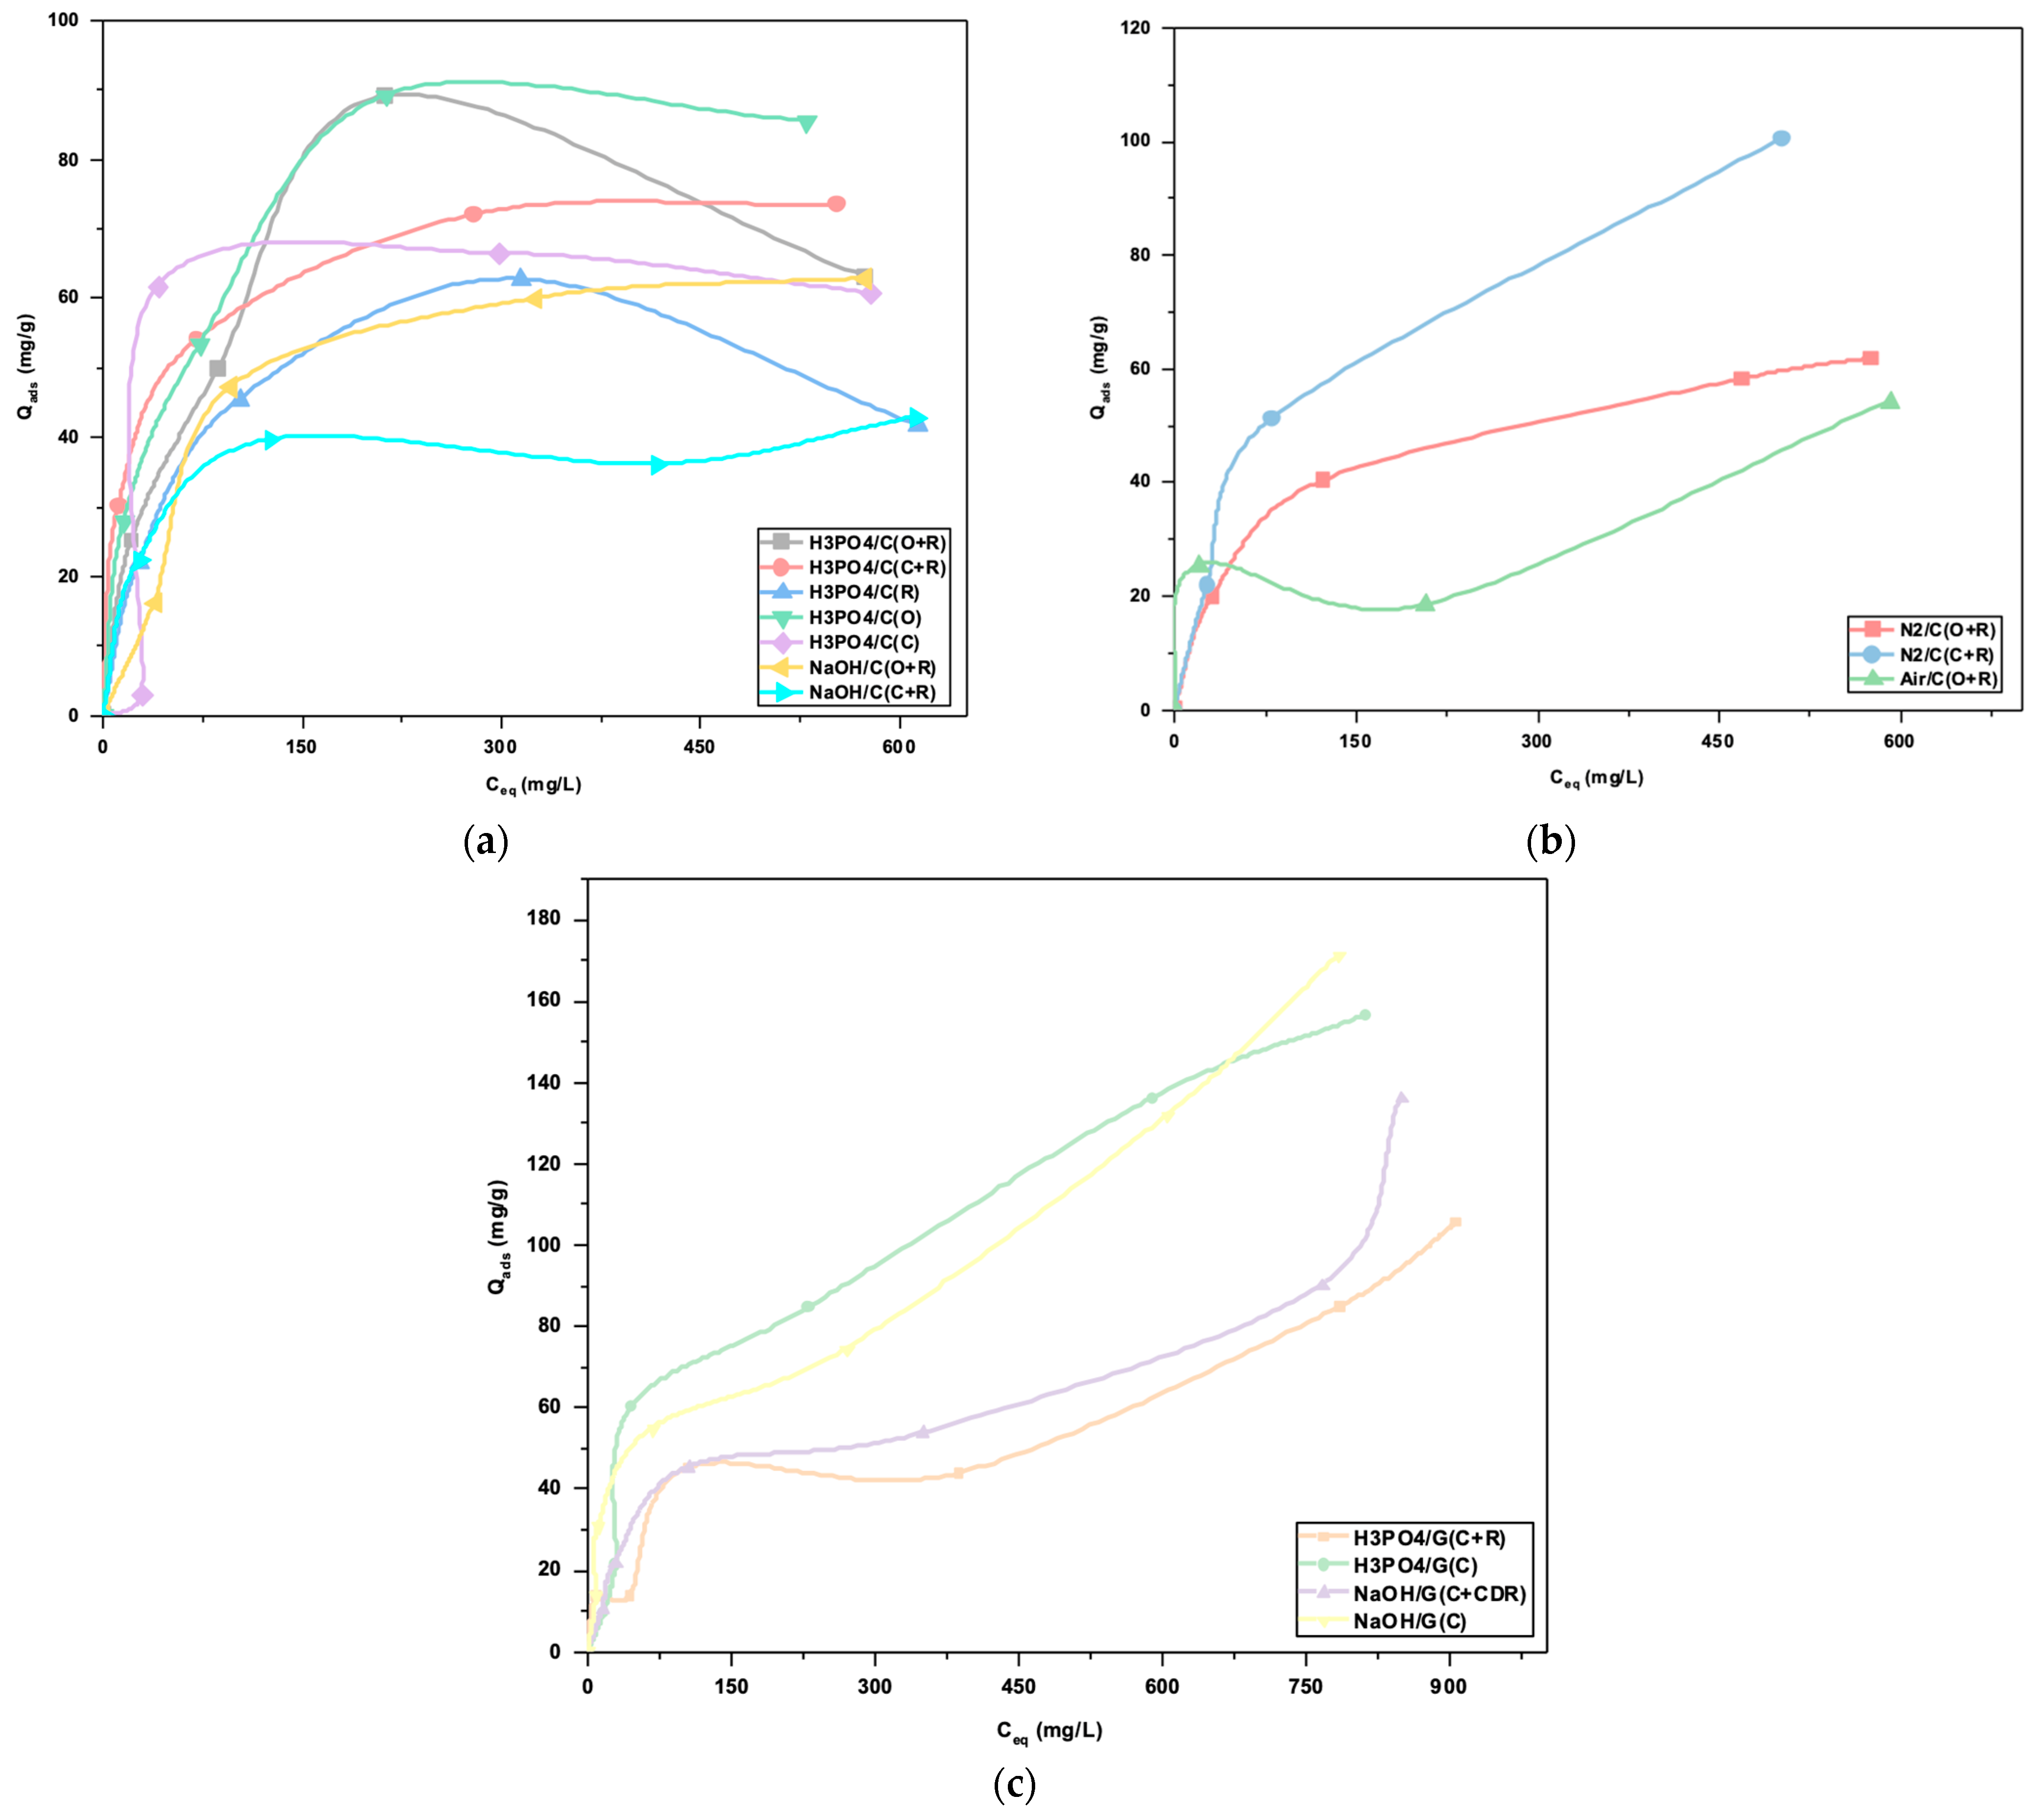
Figure 6a shows the adsorption isotherms of the compound phenol for the chemically activated carbonized samples in an acid medium. They are characterized by an increase in the amount absorbed as the concentration of equilibrium is increased, except for the NaOH/C(C+R). The sample H
3PO
4/C(O) and the sample H
3PO
4/C(O+R) are the samples that have the best results under these analysis conditions, and the sample H
3PO
4/C(R) is the worst sample. Therefore, it can be said that for the compound phenol and with chemically activated adsorbents, the samples with the most potential are those that have the sample O as a precursor.
Figure 6b shows the adsorption isotherms of the compound phenol for physically activated carbonized samples in an acid medium. They are characterized by an increase in the amount absorbed as the concentration of equilibrium is increased. The sample N
2/C(O+R) and the sample N
2/C(C+R) are the samples that have the worst results, but they are like each other, under these analysis conditions, and the sample Air/C(O+R) is the best sample. Therefore, it can be said that for the phenol compound and with physically activated adsorbents, the samples with more potential are samples prepared through activation with air.
Figure 6c shows the adsorption isotherms of the compound phenol for gasified chemically activated samples in an acid medium. They are characterized by an increase in the amount absorbed as the equilibrium concentration is increased. The H
3PO
4/G(C+R) and the NaOH/G(C+R) samples have the worst results under these analysis conditions, which leads us to believe that the introduction of RDF in the gasification process deteriorates the adsorbents. Therefore, it can be said that for the compound phenol and chemically activated gasified adsorbents, the samples with the most potential are those with only sample C as a precursor.
The results obtained by the samples in this work are equivalent, and in some cases superior, in terms of the removal of phenolic compounds, namely phenol, as can be seen from a comparison with recently published work on char [
27,
28]. Specifically, the results were obtained with activated char prepared from coconut shells as a precursor and report values in the range of 0.53 mmol g
−1 (~49.9 mg g
−1) for chemically activated samples and 0.36 mmol g
−1 (~33.9 mg g
−1). These values compare with the adsorbed amounts, for most samples in our work, in the order of 60 mg g-1 (for chemical activated samples,
Figure 6a), 50 mg g
−1 (for physical activated samples,
Figure 6b), and 55 mg g
−1 (for chemical activated gasified samples,
Figure 6c).
3.7.2. PNF
Figure 7a shows the adsorption isotherms of the
p-nitrophenol compound for the chemically activated samples in a basic medium. They are characterized by an increase in the amount absorbed as the concentration of the equilibrium is increased. The NaOH/C(C+R) sample has the worst results under these analysis conditions, and the H
3PO
4/C(O) is the best sample. Therefore, it can be said that for the compound
p-nitrophenol and with chemically activated adsorbents, the samples with less potential are activated with NaOH.
Figure 7b shows the adsorption isotherms of the
p-nitrophenol compound for the physically activated samples in a basic medium. They are characterized by an increase in the amount absorbed as the concentration of the equilibrium is increased. The N
2/C(C+R) sample has the best results under these analysis conditions, and the Air/C(O+R) is the worst sample. Therefore, it can be said that for the
p-nitrophenol compound and with physically activated adsorbents, the samples with less potential are activated with Ar.
Figure 7c shows the adsorption isotherms of the compound
p-nitrophenol for the gasified chemically activated samples in a basic medium. They are characterized by an increase in the amount absorbed as the concentration of the equilibrium is increased. The H
3PO
4/G(C) and the NaOH/G(C) samples have the best results under these analysis conditions, which leads us to believe that the introduction of CDR in the gasification process worsens the adsorbents. Consequently, it can be said that for the compound
p-nitrophenol and chemically activated gasified adsorbents, the samples with the most potential are those with only the C sample as a precursor.
The results obtained from the samples in this work are equivalent, and in some cases superior, in terms of the removal of phenolic compounds, namely
p-nitrophenol, as can be seen from a comparison with recently published work on char [
29]. Specifically, the results were obtained with activated char prepared from dried fruits of
L. cylindrica as a precursor and report values in the range of 125 mg g
−1 for chemically activated samples. These values compare with the adsorbed amounts, for most samples in our work, in the order of 70 mg g
−1 (for chemical activated samples,
Figure 7a)), 45 mg g
−1 (for physical activated samples,
Figure 7b)), and 120 mg g
−1 (for chemical activated gasified samples,
Figure 7c)).
4. Conclusions
The main conclusion that can be drawn from this work is that it is possible to prepare materials with added value from the residues studied (C, O, and R). Materials are obtained with structural and chemical characteristics with the potential to be used in the process of liquid phase adsorption: these results also demonstrate that there is an open path and potential, which consequently requires further studies for some of the systems studied.
It is possible to deduce that the C sample has a higher ash content than the O sample. Through the analysis of the FTIR spectra, it is demonstrated that there are changes in the functional groups of the biomass composition when the RDF is added and activation processes are used, but it is considered that the changes are not that significant. Materials with a surface area superior to that of the starting materials are obtained. At this point, the samples H3PO4/C(O+R), Air/C(C+R), and N2/C(C+R) stand out. Regarding the gasified samples, both samples chemically activated with the sample C precursor stand out. On the contrary, the samples NaOH/C(O+R) and H3PO4/C(R) present very poor surface areas. For the gasified samples, it is possible to see that the samples with a lower surface area are the non-activated gasified samples. Through the analysis of the adsorption isotherms of the target molecules from the aqueous liquid phase, it is possible to draw several conclusions. For the chemically activated samples, for the phenol molecule, the samples with the best results are those that were prepared using sample O as a precursor. The least interesting results are generally obtained with the samples activated with NaOH. For the physically activated samples, for the phenol compound, the samples with the most potential are the samples prepared with air activation; on the contrary, for the p-nitrophenol compound, these are the samples with the worst results. Regarding the gasified chemically activated samples, the ones that show the best results for liquid phase adsorption are those that do not have the incorporation of RDF in their composition.


