

The Labile and Resistant Soil Organic Carbon Pools in the North America Great Plains
Center for Water Resources, College of Agriculture and Food Sciences, Florida A&M University, Tallahassee, FL 32307, USA
Environments 2023, 10(11), 197; https://doi.org/10.3390/environments10110197
Submission received: 30 September 2023
/
Revised: 6 November 2023
/
Accepted: 13 November 2023
/
Published: 16 November 2023
(This article belongs to the Special Issue Soil Organic Carbon Assessment, 2nd Edition)
Abstract
:Among the three major global carbon cycle components, the terrestrial one has been the most uncertain because of the complexity of the soil organic carbon (SOC) dynamics. Previous tracer studies, however, have shown that SOC consists of labile and resistant pools. Labile pools turn over in decades, and resistant pools turn over in hundreds or thousands of years. Labile pools are active in carbon and nutrient cycles and responsive to land-use management changes, whereas resistant pools are less so. Very few studies have actually quantified labile and resistant SOC pools because the isotopic tracer methods, such as the paired-plot bulk-carbon (PPBC) method, can only be applied to a few special cases. I found a study of SOC in the North America Great Plains, in which some of the data are suitable for the PPBC method. The results revealed that the turnover times of the labile SOC pools ranged from 17 years to 93 years, and the sizes ranged from 1.2 g kg−1 to 17.6 g kg−1. The turnover times of the resistant pools ranged from 899 years to 5138 years, and the sizes ranged from 5.0 g kg−1 to 12.4 g kg−1. Land management practices changed the sizes of the labile pools but not their turnover times. This study also pointed out a possibility that allows the application of the PPBC method to a set of much broader cases.
1. Introduction
There are gaps and uncertainties in the dynamics of soil organic carbon (SOC) because SOC is a complicated mixture of substances with vast differences in turnover times [1,2]. However, studies of isotopic carbon tracers suggested that SOC contains labile and resistant pools, which are separated by a huge difference in turnover times. The turnover times of the labile SOC pools have been determined to be from several years to several decades, whereas those of the resistant SOC pools are from hundreds to thousands of years [1,3,4,5,6]. The labile SOC pools, therefore, are active in carbon and nutrient cycles and responsive to land-use management changes. The resistant SOC pools, on the other hand, are relatively inert in those regards.
Traditional radiocarbon dating applies to biological samples that ceased to exchange carbon with atmospheric CO2 for at least 120 years under the assumption of a relatively constant atmospheric 14CO2 level [7]. However, due to the vast difference in turnover times between labile and resistant pools in SOC, direct interpretation of bulk-soil radiocarbon ages has very limited meaning. Furthermore, the atmospheric nuclear testing between 1953 and 1963 injected a large amount of bomb 14CO2 into the atmosphere and has since significantly changed the atmospheric 14CO2 level [8,9,10]. The variable bomb 14CO2 in the atmosphere thus invalidates the basic assumption of the traditional radiocarbon dating for the post-bomb soil samples.
The carbon dating nomenclature assigns samples with 14C activities equivalent to 95% of a 1950 oxalic acid standard as Modern [11]. Radiocarbon counts are expressed as percent modern carbon (pmC). Due to the contamination of bomb radiocarbon in the atmosphere since 1953, the 14C activity of a post-bomb labile SOC pool could exceed 100 pmC. The 14C activity of a SOC pool exceeding 100 pmC has been interpreted as “modern,” indicating the incorporation of bomb radiocarbon in modern times (e.g., [12]). On the other hand, bomb radiocarbon can be used as a tracer to determine the turnover time of a labile SOC pool. O’Brien and Stout [9] and O’Brien [13] were the first to apply a quantitative interpretation of bomb 14C regarding the turnover times of SOC pools. They used the existing atmospheric bomb 14CO2 records and the bulk-soil radiocarbon data along a soil profile to fine-tune a simulation model in which they assumed a uniformly and vertically distributed “old” carbon that did not incorporate bomb radiocarbon, whereas the “young” carbon did. By that approach, they identified the turnover times of the young and old SOCs of the selected soils in New Zealand. Although their studies shed light on the dynamics of SOC, their results were speculative at best because of the unverifiable assumption and the non-unique simulation solutions. Later, Hsieh [5] devised a bomb radiocarbon signature method to determine the turnover time of a post-bomb labile SOC pool. This bomb radiocarbon signature method can determine the turnover time of a post-bomb labile pool from a few years to 150 years, which otherwise cannot be determined by the traditional radiocarbon method due to the short turnover time (<120 years), and bomb radiocarbon contamination.
Among the carbon isotopic tracer studies, only a few provided definite answers to the SOC dynamics [3,4,5,6]. Others that used the simulation modeling approach provided only speculations because of their non-unique solutions [1,9,13,14,15].
One of the carbon isotopic tracer methods that can give a definite answer to the SOC dynamics is the paired-plot bulk-carbon (PPBC) isotopic inference method [4]. The PPBC method defines a labile pool as the fraction of SOC that would respond to land-use management changes over a period of time. Since a labile pool is defined as management-responsive, the SOC difference between a pair of soil plots that received different management practices would represent the difference in size between the labile pools. With the constraints of mass balance and carbon isotopic contents (14C and 13C) between the pair, the sizes and turnover times of the labile and resistant SOC pools, respectively, can be determined under certain conditions [4,5]. The turnover times of the labile and the resistant SOC pools in temperate surface soils have thus been determined to be in the range of 35–70 years and 900–3000 years, respectively [4,5], and those of the tropical soils ranged from 5–8 years and 250–400 years, respectively [6]. Unfortunately, the PPBC method has only been applied to limited cases of long-term agricultural experiments because of the requirements of certain conditions.
Several chemical fractionation approaches have been attempted to separate the labile pools from the resistant pools. For example, SOC had been fractionated into fulvic, humic, and humin fractions followed by 14C dating (e.g., [16,17]). These studies concluded that humic acid and humin were generally older than the corresponding fulvic acid, but those fractions did not represent labile or resistant SOC pools. In fact, several incubation experiments using 14C labeled materials showed the distribution of the labeled carbon in all the fulvic, humic, and humin fractions [18]. In a comparison of the 14C in pre- and post-bomb SOC fractions (i.e., fulvic, humic, and humin), Trumbore et al. [19,20] showed that, in general, (1) the least bomb 14C increased in the fraction with the oldest pre-bomb 14C age and (2) bomb 14C was in all fractions to some extent.
Among the chemical fractionation approaches, acid-hydrolysis has produced the most separation between the fractions regarding the radiocarbon age [12,21,22]. However, the radiocarbon age relationships of the hydrolyzable and non-hydrolyzable fractions were not consistent among samples from different soil depths or soils [23]. The physical fractionations of SOC in those studies showed that although their radiocarbon ages differed among the fractions, those fractions do not represent labile or resistant SOC pools. Furthermore, with the possible contamination of bomb radiocarbon in all fractions, direct interpretation of the radiocarbon age in those fractions could give misleading information on the SOC dynamics.
There was a study of the SOC dynamics in the North America Great Plains using the acid-hydrolysis approach and radiocarbon measurements [12]. Part of their data, including several long-term agricultural experimental sites and plots, are also interpretable by the PPBC method. I used the PPBC method to determine the turnover times and sizes of the labile and resistant SOC pools of the surface soils in the North America Great Plains.
2. Turnover Times and Sizes of Labile and Resistant SOC Pools by the PPBC Method
Based on the PPBC method [4], the 14C activity of the labile SOC, Aa, in a pair of soil samples that have significant differences in SOC levels due to different managements was determined by the formula:
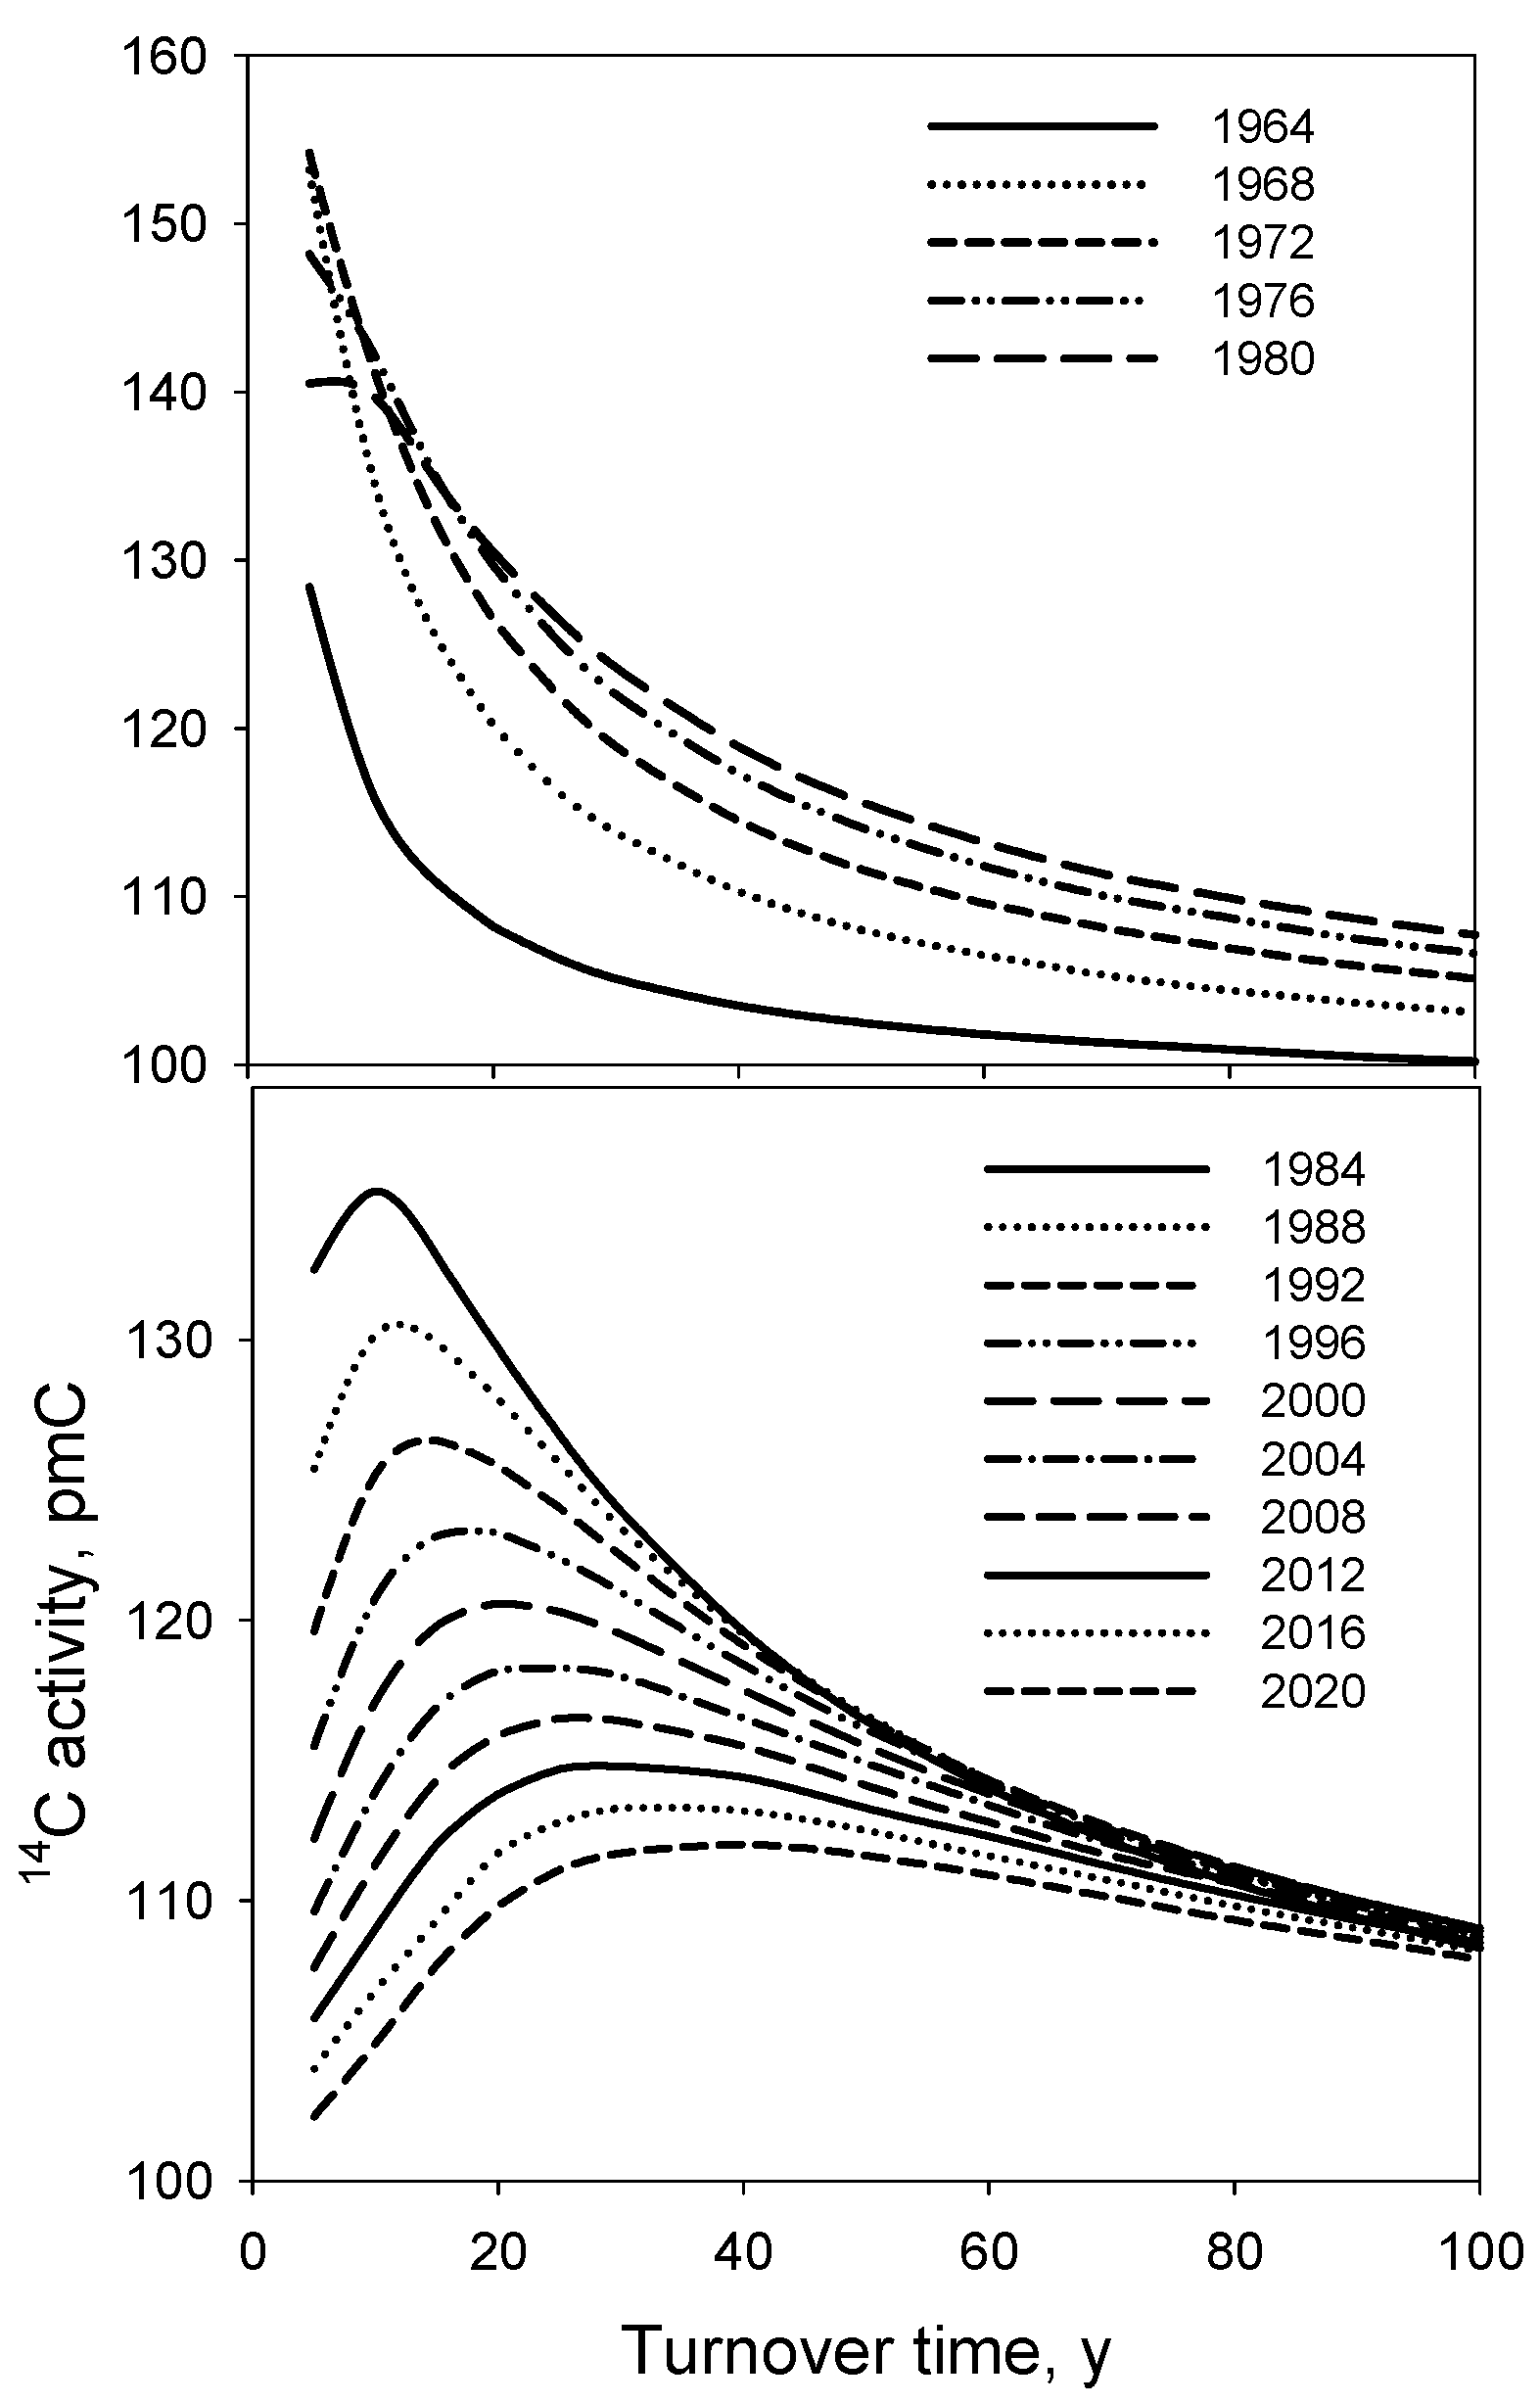
where At1 and At2, respectively, were the bulk-soil 14C activities (pmC) of the paired soil samples. Ct1 and Ct2, respectively, were the bulk-soil organic carbon contents (g kg−1) of the paired soil samples. Notice that Aa can be determined without the knowledge of the size of the labile pool. The value of Aa, which could be greater than 100 pmC in the post-bomb samples, was then used to determine the turnover time of the labile pool according to the bomb 14C signature method for labile SOC pools [5] (Figure 1).
Aa = (Ct1At1 − Ct2At2)/(Ct1 − Ct2)
The sizes of the labile SOC in the soils of the Akron, CO, and Sidney, NE, sites were estimated using the 13C data provided by Follett et al. [25], which was the companion paper of Paul et al. [12], by the following approach. The native vegetation of the Akron, CO, and Sidney, NE, sites was C4 dominated which had a 13C signature distinct from that of the continuous C3 wheat crop [25]. By using a two-end member mixing model, the fraction of the crop-derived SOC in a plot (fc) was calculated using the following equation,
fc = (δ13C sample − δ13C native SOC)/(δ13C crop − δ13C native SOC)
The fraction of the crop-derived SOC (fc) may not be equivalent to the fraction of the labile pool because a steady state might not have been established yet. The fraction of the labile pool in the crop plot (fa), however, was deduced by the crop-derived SOC fraction (fc, Equation (2)), the turnover time of the labile pool (ta), and the duration of the continuous crop management (tm), i.e.,
where tm was 84 and 22 years, respectively, for Akron, CO, and Sidney, NE, sites as described by Paul et al. [12], and ta was determined by the bomb 14C signature method [5] according to the calculated Aa (Equation (1)). The 14C activity of the resistant SOC pool, i.e., As, was then calculated using the mass balance relationship:
where At was the 14C activity of the bulk soil. The turnover time of the resistant SOC was determined by the traditional carbon dating method, i.e.,
where 5730 was the half-life of the radiocarbon in years.
fa = fc/[1 − exp(−tm/ta)]
As = (At − Aa fa)/(1 − fa)
Turnover time (year) = (−5730/0.693) ln [(As, pmC)/100]
3. Data
Paul et al. [12] presented the soil radiocarbon data, including the bulk carbon and its acid-hydrolysis fractions, of several long-term experiment sites in the North America Great Plains. Part of their data from the Akron, CO, Sidney, NE, and Mandan, ND, sites met the requirements of the PPBC method, which is paired samples from a long-term agricultural experiment that has established a significant management-induced difference in SOC levels. The data of Paul et al. [12] are listed in Table 1, along with the 13C data provided by Follett et al. [25]. In addition, the experiment sites, soils, vegetation, management history, soil sampling, and analytical procedures have been described in detail by Paul et al. [12].
4. Results
The turnover times and the sizes of the labile and the resistant pools in the Akron, CO, Sidney, NE, and Mandan, ND, sites determined are presented in Table 2. The turnover times of the labile pools were determined by the bomb radiocarbon signature method (Figure 1), and those of the resistant pools were determined by the traditional radiocarbon dating method (Equation (5)).
At the Akron, CO, site, the turnover time of the labile pool increased from 34 years at the 0–10 cm depth to 93 years at the 20–30 cm depth. The turnover time of the resistant pool also increased from 3763 years at the 0–10 cm depth to 5138 years at the 20–30 cm depth. The turnover times of the labile and the resistant pools support the concept of the labile pool (responsive to management change) and the resistant pool (non-responsive to management change) and justify the use of the bomb radiocarbon signature method and the traditional radiocarbon dating method, respectively, for estimating their turnover times.
Previous studies have shown that the bulk soil 14C age increased with depth [26]. This study showed that the turnover times of the labile and the resistant pools increased with depth, too. The weighted turnover times of the labile pools in the top 20 cm soil at the Akron site were 46 and 47 years, respectively, for the native and cultivated plots. The results indicate that cultivation did not change the turnover rates but drastically changed the labile pool sizes. In comparison, the reported turnover times of labile pools at similar depths (0–20 cm) in other temperate soils were 67 years in the Rothamsted Experiment Station (Harpenden, Hertfordshire, UK) [1], 67 years in the Morrow Plots (Urbana, IL, USA) [5] and 34 years in the Sanborn Field (Columbia, MO, USA) [5]. The turnover times of the resistant SOC in the Akron site (3763–5138 years) were longer than those reported in the above-mentioned long-term experiments studies (850–3000 years). The sizes of the resistant SOC at the Akron site were relatively constant concerning soil depth in the top 30 cm (5.0–5.5 g kg−1).
At the Akron, CO site, the size of the labile SOC of the native plot decreased from 8.1 g kg−1 (59.6% of the total SOC) at the 0–10 cm depth to 2.9 g kg−1 (36.7% of the total SOC) at the 20–30 cm depth. In the cultivated plot, the size of the labile SOC decreased from 3.4 g kg−1 (38.2% of the total SOC) at the 0–10 cm depth to 1.2 g kg−1 (19.4% of the total SOC) at the 20–30 cm depth. The decreased size of the labile SOC with depth apparently was due to the reduced organic carbon input to the SOC pools with depth. Compared to the native plot, the 84 years wheat-fallow management at the Akron site lost 58%, 49%, and 59% of the labile SOC, respectively, at 0–10, 10–20, and 20–30 cm depths. According to the turnover times of those labile SOC, 92%, 71%, and 60% of the labile SOC had been replaced by the wheat C in the 0–10, 10–20, and 20–30 cm depths, respectively, in the 84 years of cultivation.
The turnover times of the labile and the resistant SOC pools at the Sidney, NE, site were 17 years and 899 years, respectively, significantly shorter than the respective values of the Akron, CO, site. The size of the labile SOC pool in the native plot of the Sidney site at the 0–10 cm depth was comparable to that of the Akron site at the same depth, but the resistant SOC was more than twice that of the Akron site (12.4 g kg−1 vs. 5.5 g kg−1).
The data provided by Paul et al. [12] at the Sidney site allowed only the analysis of the 0–10 cm depth by the PPBC method. The native, sod, and plow plots, however, facilitated three independent estimations of the 14C activity of the labile pools (Aa) using Equation (1). The three estimates of the 14C activity of the labile pools agreed well with one another (127.7 ± 0.7 pmC), which corresponded to a turnover time of 17 years by the bomb radiocarbon signature method [5]. This again showed that the different managements did not change the turnover times of the labile pools, although they changed their sizes drastically (Table 2). Previous studies also found that cultivation did not change the turnover time of the labile pools [4,5]. Compared to the native plot, the plow plot lost 81% of the labile SOC, while the sod plot gained an additional 105% of the labile SOC. The cultivation history at the Sidney site was much shorter (22 years) than that at the Akron site (84 years). However, about 73% of the labile pool had already been replaced by crop-derived C because of the shorter turnover time (17 years). This shorter turnover time of the labile pool also explained why drastic changes in the sizes of the labile pools could occur after only 22 years of management history.
The data set of the 1947 sample from the Mandan, ND site only allowed calculating the 14C activity of the labile SOC, which was 100.2 pmC. The 1947 sample should not contain any bomb radiocarbon. Instead, there should have been a Suess effect [27], which would slightly lower the radiocarbon content of the labile pool below 100 pmC [24]. Paul et al. [12] suspected that the 1947 sample might have been contaminated with an unknown 14C source. Other than the contamination of an unknown radiocarbon source, the turnover time of the 1947 sample cannot be determined because it would be too short to be determined by the traditional radiocarbon dating method.
5. Discussion
The PPBC method defines a labile pool as the fraction of SOC that is responsive to land-use management practices, whereas a resistant pool is not. The turnover times determined for the labile pools (17 years to 93 years) and the resistant pools (899 years to 5138 years) supported those concepts and they were consistent with the results of the previous SOC dynamic studies [1,3,4,5]. Understanding the turnover time and the size of a labile pool is critical in understanding the effect of land-use management on ecosystem productivity, sustainability, and carbon and nutrient cycles. For example, the plow plot at the Sidney, NE, site lost 33% of its total SOC in comparison to that of the native plot. But that loss represented a 71% reduction of the critically important labile pool.
The labile/resistant dual-pool model of SOC is one of the ways to represent the SOC dynamics in temperate soils. There are other multi-pool models. For example, Jenkinson and Rayner [1] divided the SOC into five pools: decomposable plant material (DPM), microbial biomass (BIO), resistant plant material (RPM), physically protected material (PPM), and chemically protected material (CPM). The turnover times for the DPM, BIO, RPM, PPM, and CPM were 0.24 years, 2.44 years, 3.33 years, 71.43 years, and 2857 years, respectively. Their respective sizes were 0.04%, 1.15%, 1.94%, 46.58%, and 50.29% of the total SOC. One would notice the relationship between turnover time and pool size. The shorter the turnover time, the smaller the pool size. This is because the relationship is dictated by the mechanism of SOC formation, which is the balance between the input rate and the decomposition rate of SOC in a pool [28]. The three shortest turnover time pools (i.e., DPM, BIO, and RPM) comprised only 3.13% of the total SOC with a weighted turnover time of 2.96 years. The first four pools (DPM, BIO, RPM, and PPM) of the Jenkinson-Rayner model all had much shorter turnover times (<71.43 years) than that of the CPM pool (2857 years). The four shorter pools of the Jenkinson-Rayner model could be combined into a labile pool, in which the combined size and weighted turnover time would be 49.7% of total SOC and 67 years, respectively. The labile/resistant dual-pool model, therefore, is a much simpler but effective representation of the SOC dynamics when compared to the five-pool model. Moreover, the dynamics of the shorter turnover-time (<3 years) pools can be conveniently determined in short-term incubation experiments if so desired. For example, the size of the BIO pool can be conveniently measured in real-time by a rapid method [29].
This study enabled a direct comparison between the acid-hydrolysis method and the PPBC method in SOC dynamic studies. The results of the acid-hydrolysis method reported by Paul et al. [12] are presented in Table 3. At the Akron site, the 14C activities of the acid hydrolyzable fractions were determined to be between 75 pmC and 123 pmC. The estimated turnover times were in a range from “modern” to 2355 years. In comparison, the 14C activities by the PPBC method were between 109.9 pmC and 121.1 pmC, which corresponded to the turnover time between 34 and 93 years. At the Sidney site, the 14C activities of the hydrolyzable fractions ranged between 101.4 pmC and 150.9 pmC, and the estimated turnover times were all “modern.” The PPBC method determined the 14C activities of the labile pools in the native, sod, and plow plots to be 127.7 ± 0.7 pmC, corresponding to a 17 years turnover time by the bomb radiocarbon signature method [5]. The wide variation and inconsistent trend of the 14C activities and the estimated turnover times of the acid-hydrolyzable fractions suggest that they did not represent the labile pools, as indicated in the study of Goh et al. [23].
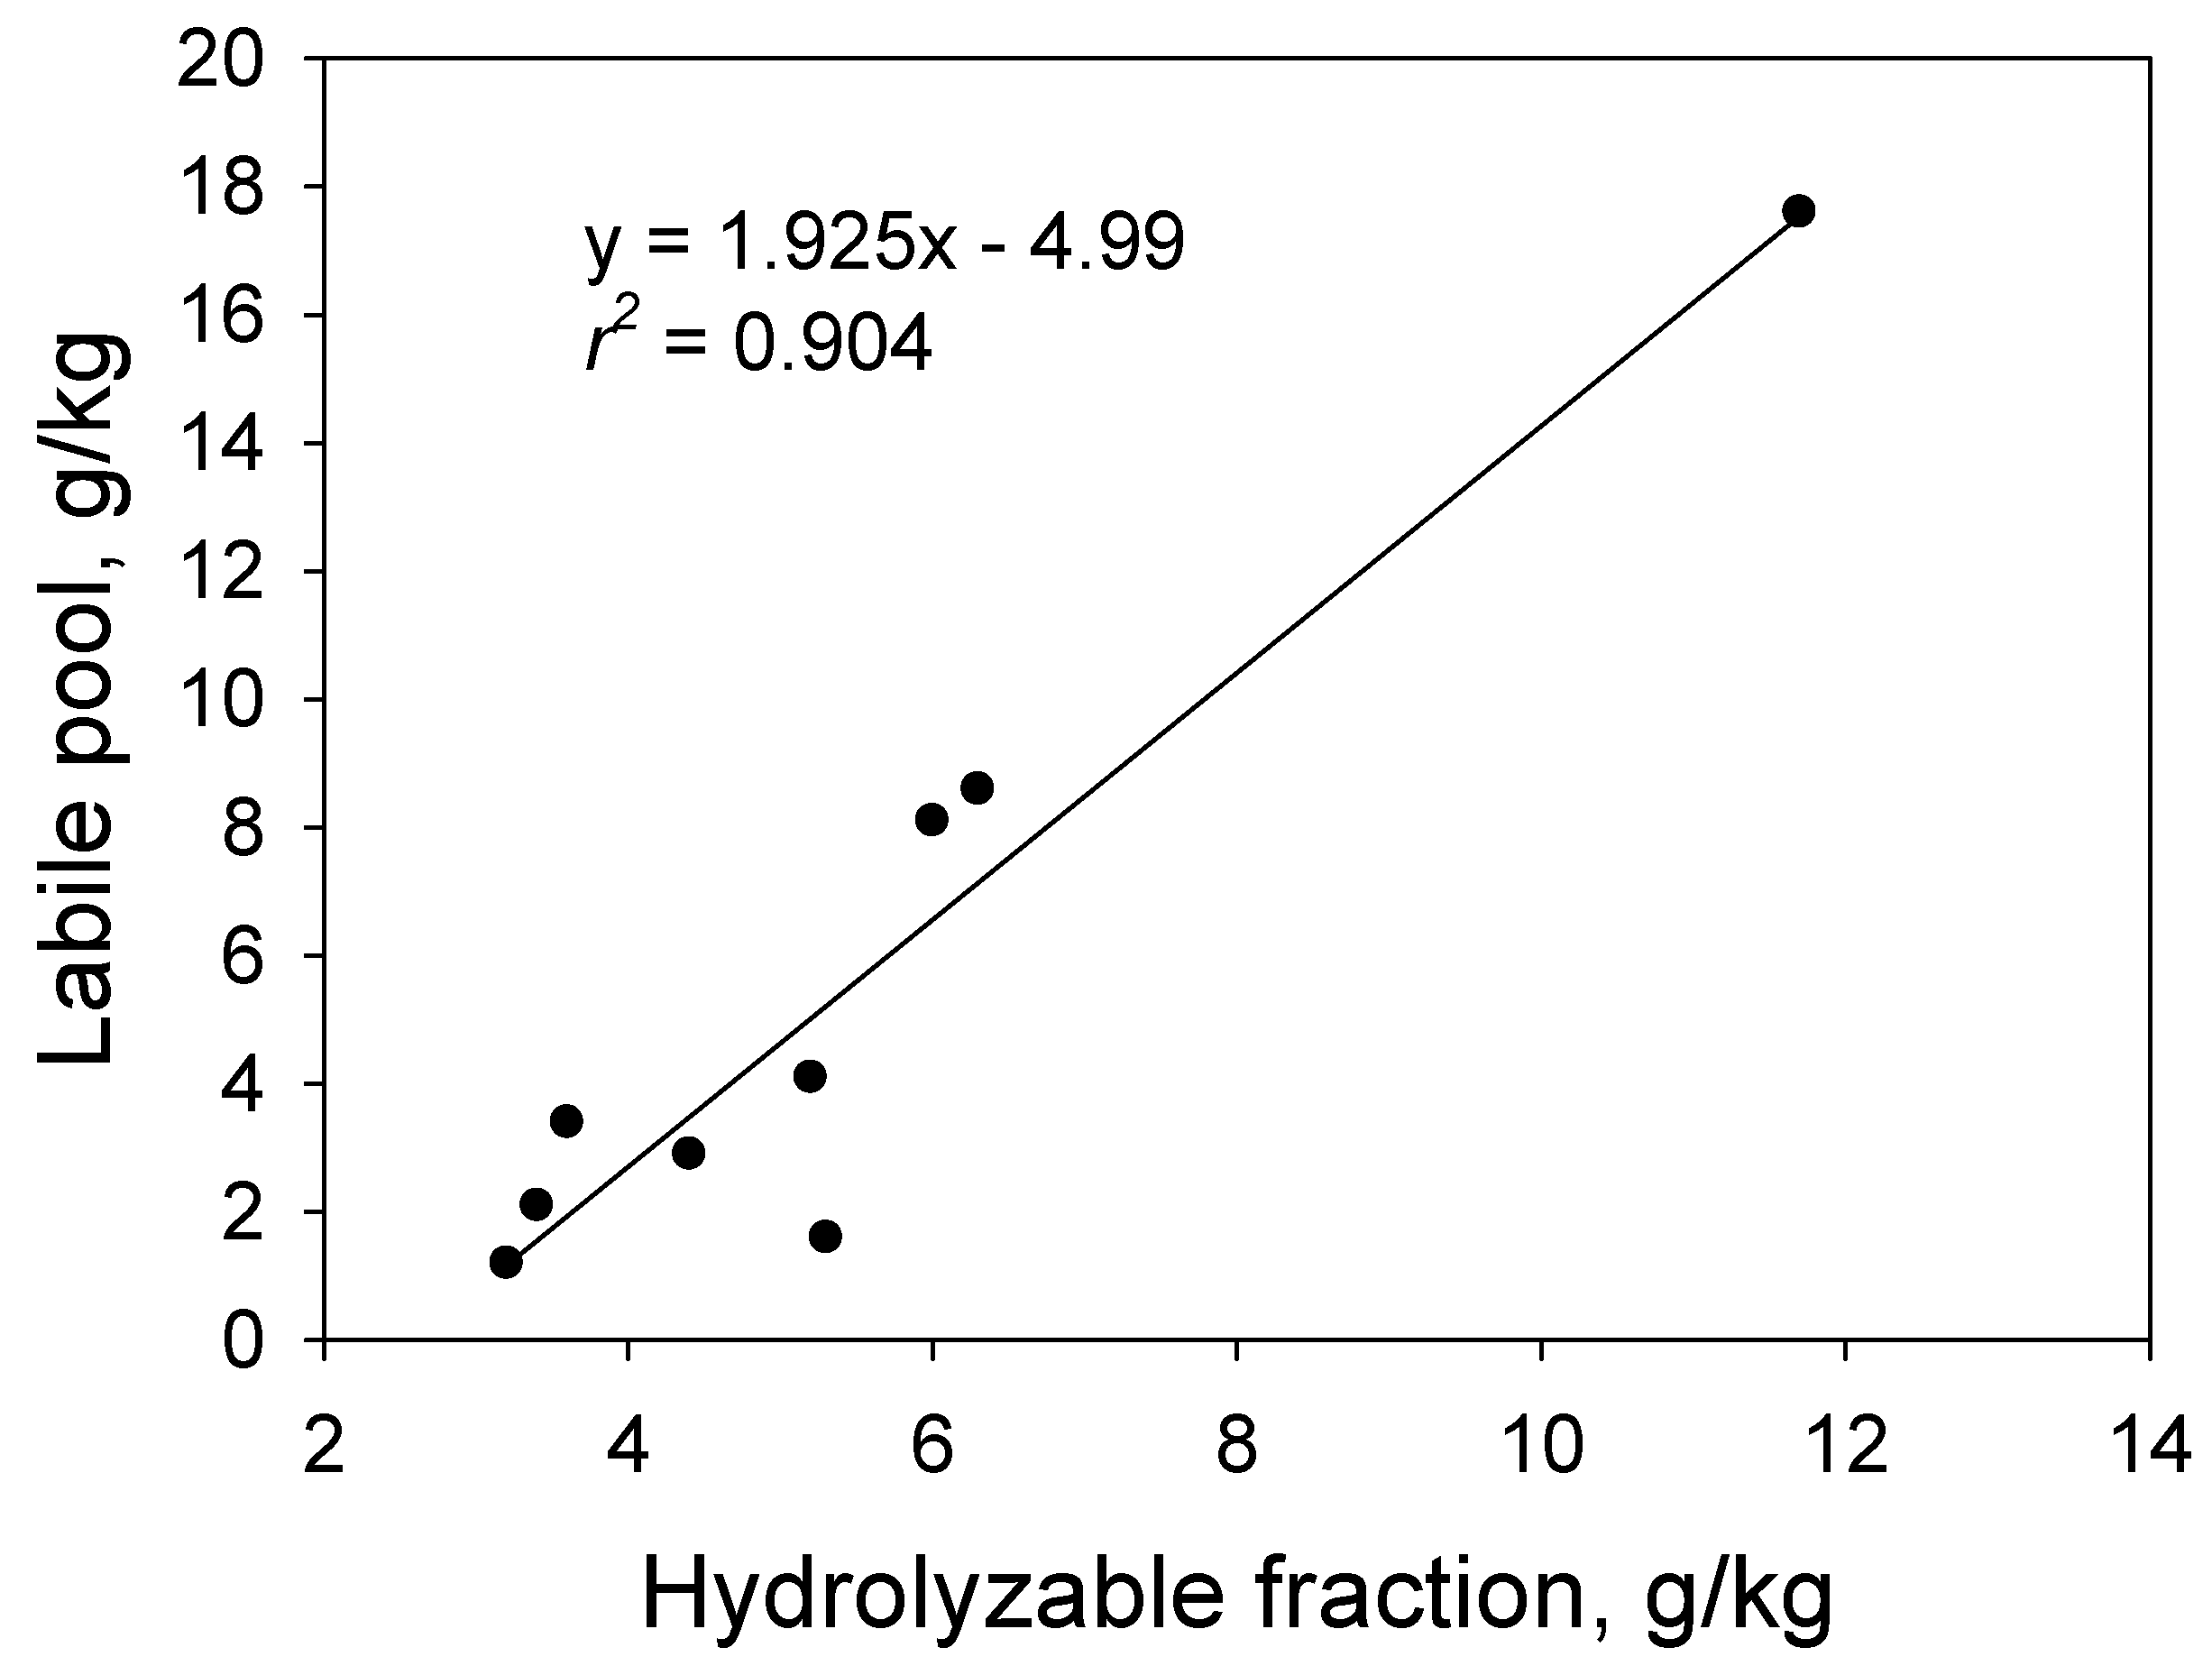
While the acid-hydrolyzable fractions did not represent the labile pools, their sizes correlated well with those determined by the PPBC method (r2 = 0.904, Figure 2), although their absolute values differed by almost a factor of 2. Nevertheless, the good correlation suggested that the sizes of the labile pools could be estimated by the sizes of the acid-hydrolyzable fractions through the regression equation. This could be quite valuable for broadening the application of the PPBC method in the study of SOC dynamics for the following reasons.
The PPBC method can determine the 14C activity and the turnover time of a labile pool from any valid paired soil samples (Equation (1)). The size of the labile pools in the paired samples, however, has to be determined by one of the following two methods: (1) Using the 13C tracer method if the 13C signature of the native SOC is distinctive from that of the continuous crop such as the case demonstrated in this study; or (2) Obtaining the archived soil samples of the same paired plots taken from a distant past (over decades), such as the case demonstrated in the original PPBC method paper [4]. Because of this pool-size determination constraint, the PPBC method can only be applied to limited special cases. If the size of a labile pool can be estimated by the acid-hydrolyzable fraction through the regression relationship, the pool-size determination constraint of the PPBC method would be lifted, and its application could be extended to a broader set of cases.
The turnover time of a labile pool in a post-bomb soil sample can be determined by the bomb radiocarbon signature method (Figure 1). The sensitivity of the bomb radiocarbon signature method, however, depends on when the soil sample was taken. The bomb radiocarbon signature is most sensitive in the soil samples taken between 1970 and 1980, followed by those taken between 1980 and 2000. In the soil samples taken after 2008, the bomb radiocarbon signature became insensitive to the labile pools whose turnover times were greater than 25 years (Figure 1). Archived paired soil samples taken between 1970 and 2008, therefore, would be valuable resources for SOC dynamic studies.
6. Conclusions
The PPBC interpretation of the data of the America Great Plains revealed that the turnover times of the labile SOC pools ranged from 17 years to 93 years, depending on the sites and depths of the soils. The turnover times of the labile pools increased with the depths. The sizes of the labile pools ranged from 1.2 g kg−1 to 17.6 g kg−1. Cultivation reduced the size of the labile pool on average by 53% of that of the native plots. Management, however, did not change the turnover times of the labile pools. The turnover times of the labile pools indicated that they are important to the carbon and nutrient cycles of an ecosystem and responsive to management changes.
The turnover times of the resistant pools ranged from 899 years to 5138 years, depending on the sites. The turnover time of the resistant pool also increased with the depth of the soil. The sizes of the resistant pools ranged from 5.0 g kg−1 to 12.4 g kg−1 depending on the sites but not the depth of the soil. The depth-independent size suggests that the resistant pools were inactive and unaffected by the existing organic carbon input, which should have been diminished with depth.
A direct comparison of the results of the PPBC method with those of the acid-hydrolysis method confirmed the results of the previous study [23], that the acid-hydrolyzable fractions do not represent labile pools. The sizes of hydrolyzable fractions, however, were found to correlate well with those of the corresponding labile pool, although their absolute values differed by almost a factor of 2. This finding suggested that the size of a labile pool could be estimated by the size of the hydrolyzable fraction through a linear regression equation (Figure 2). This possibility could broaden the application of the PPBC method to a broader set of cases.
Quantifying the turnover time of a labile pool can only be done by the bomb radiocarbon signature on post-bomb soil samples (Figure 1). The sensitivity of bomb radiocarbon signatures in determining the turnover time of a labile pool depends on the year a soil is sampled. Archived soil samples taken between 1970 and 2008 are valuable resources for future study of SOC dynamics.
Funding
This study was partially supported by the NIFA/USDA Evans-Allen Program #003083 to the College of Agriculture and Food Sciences, Florida A&M University.
Data Availability Statement
The data presented in this study are available in all cited papers.
Conflicts of Interest
The author declares no conflict of interest.
References
- Jenkinson, D.S.; Rayner, J.H. The turnover of soil organic matter in some of the Rothamsted classical experiments, 1977. Soil Sci. 1977, 123, 298–305. [Google Scholar] [CrossRef]
- Wang, Y.; Hsieh, Y.P. Uncertainties and novel prospects in the study of the soil carbon dynamics. Chemosphere 2002, 49, 791–804. [Google Scholar] [CrossRef] [PubMed]
- Balesdent, J.; Wagner, G.H.; Mariotti, A. Soil organic matter turnover in long-term field experiments as revealed by carbon-13 natural abundance. Soil Sci. Soc. Am. J. 1988, 52, 118–124. [Google Scholar] [CrossRef]
- Hsieh, Y.P. Pool size and mean age of stable soil organic carbon in croplands. Soil Sci. Soc. Am. J. 1992, 56, 460–464. [Google Scholar] [CrossRef]
- Hsieh, Y.P. The radiocarbon signatures of turnover rates in active soil organic carbon pools. Soil Sci. Soc. Am. J. 1993, 57, 1020–1022. [Google Scholar] [CrossRef]
- Hsieh, Y.P. Dynamics of soil organic carbon pools of two tropical soils as inferred by 14C and 13C signatures. Soil Sci. Soc. Am. J. 1996, 60, 1117–1121. [Google Scholar] [CrossRef]
- Libby, W.F. Radiocarbon Dating; University of Chicago Press: Chicago, IL, USA, 1952; 124p. [Google Scholar]
- Rafter, T.A. Carbon-14 in nature. Part 2. Increase in C14 activity in the atmosphere of the Southern Hemisphere from the testing of nuclear weapons. N. Z. J. Sci. 1965, 8, 472–493. [Google Scholar]
- O’Brien, B.J.; Stout, J.D. Movement and turnover of soil organic matter as indicated by carbon isotope measurements. Soil Biol. Biochem. 1978, 10, 309–317. [Google Scholar] [CrossRef]
- Nydal, R.; Lovseth, K. Tracing bomb 14C in the atmosphere 1962–1980. J. Geophys. Res. 1983, 88, 3621–3642. [Google Scholar] [CrossRef]
- Stuiver, M.; Polach, H.A. Discussion: Reporting of 14C data. Radiocarbon 1977, 19, 355–363. [Google Scholar] [CrossRef]
- Paul, E.A.; Follett, R.F.; Leavitt, S.W.; Halvorson, A.; Peterson, G.A.; Lyon, D.J. Radiocarbon dating for determination of soil organic matter pool sizes and dynamics. Soil Sci. Soc. Am. J. 1997, 61, 1058–1067. [Google Scholar] [CrossRef]
- O’Brien, B.J. Soil organic carbon fluxes and turnover rates estimated from radiocarbon enrichments. Soil. Biol. Biochem. 1984, 16, 115–120. [Google Scholar] [CrossRef]
- Harkness, D.D.; Harrison, A.F.; Bacon, P.J. The potential of bomb 14C measurements for estimating soil organic matter turnover. In Advances in Soil Organic Matter Research; Wilson, W.S., Ed.; The Royal Society of Chemistry: Cambridge, UK, 1991; pp. 239–252. [Google Scholar]
- Harrison, K.W.; Broecker, W.S.; Bonani, G. A strategy for estimating the impact of CO2 fertilization on soil organic carbon storage. Glob. Biogeochem. Cycles 1993, 7, 69–80. [Google Scholar] [CrossRef]
- Campbell, C.A.; Paul, E.A.; Rennie, D.A.; McCallum, K.J. Applicability of the carbon dating method to soil humus studies. Soil Sci. 1967, 104, 217–224. [Google Scholar] [CrossRef]
- Runge, E.C.A.; Goh, K.M.; Rafter, T.A. Radiocarbon chronology and problems in its interpretation for quaternary loess deposits-South Canterbury, New Zealand. Soil Sci. Soc. Am. Proc. 1973, 37, 742–746. [Google Scholar] [CrossRef]
- Paul, E.A. Plant components and soil organic matter. Recent Adv. Phytochem. 1970, 3, 59–104. [Google Scholar]
- Trumbore, S.E.; Vogel, J.S.; Southon, J.R. AMS 14C measurements of fractionated soil organic matter: An approach to deciphering the soil carbon cycle. Radiocarbon 1989, 31, 644–654. [Google Scholar] [CrossRef]
- Trumbore, S.; Chadwick, O.; Amundson, R. Rapid exchange between soil carbon and atmospheric carbon dioxide driven by temperature change. Science 1996, 272, 393–396. [Google Scholar] [CrossRef]
- Persson, J. A biological chemical study of soil organic matter fractionations. Int. Soc. Soil Sci. Trans. Comm. 1967, II–IV, 59–64. [Google Scholar]
- Martel, Y.A.; Paul, E.A. The use of radiocarbon dating of organic matter in the study of soil genesis. Soil. Sci. Soc. Am. Proc. 1974, 38, 501–506. [Google Scholar] [CrossRef]
- Goh, K.M.; Stout, J.D.; O’Brien, B.J. The significance of fractionation in dating the age and turnover of soil organic matter. N. Z. J. Sci. 1984, 27, 69–72. [Google Scholar]
- Hua, Q.; Turnbull, J.C.; Santos, G.M.; Rakowski, A.Z.; Ancapichun, S.R.; Plo-Holz, D.; Hamma, S.; Lehman, S.J.; Levin, I.; Milley, J.B.; et al. Atmospheric radiocarbon for the period 1950–2019. Radiocarbon 2022, 64, 723–745. [Google Scholar] [CrossRef]
- Follett, R.F.; Paul, E.A.; Leavitt, S.W.; Halvorson, A.D.; Lyon, D.; Peterson, G.A. Carbon isotope ratios of Great Plains soils and in wheat-fallow systems. Soil Sci. Soc. Am. J. 1997, 61, 1068–1077. [Google Scholar] [CrossRef]
- Guillet, B. Study of the turnover of soil organic matter using radioisotopes (14C). In Constituents and Properties of Soils; Bonneau, M., Souchier, B., Eds.; Academic Press: London, UK, 1982; pp. 238–260. [Google Scholar]
- Suess, H.E. Radiocarbon concentration in modern wood. Science 1955, 122, 415–417. [Google Scholar] [CrossRef]
- Hsieh, Y.P. Dynamics of soil organic matter formation in croplands—Conceptual analysis. Sci. Total Environ. 1989, 81–82, 381–390. [Google Scholar] [CrossRef]
- Hsieh, Y.P.; Anderson, G.A.; Miller, R.O.; Nemours, D. Non-instrumental Real-time Soil Respiration Rate and Soil Microbial Biomass Carbon Determinations. Commun. Soil Sci. Plant Anal. 2020, 51, 2479–2490. [Google Scholar] [CrossRef]
Figure 1.
The relationship between the 14C activity and the turnover time of a labile SOC pool. Notice that the relationship changed depending on when the soil was sampled. These bomb-radiocarbon signatures of turnover times were calculated according to the annual atmospheric radiocarbon record of Hua et al. [24] and the formulation of Hsieh [5].

Figure 2.
The relationship between the size of the labile SOC pool and that of the acid-hydrolyzable fraction in this study.
Figure 2.
The relationship between the size of the labile SOC pool and that of the acid-hydrolyzable fraction in this study.


Table 1.
Soil 14C and 13C data of the paired samples were taken from several long-term experiments in the North America Great Plains [12,25].
| Sample | Depth | Organic C | 14C | 13C # |
|---|---|---|---|---|
| cm | g kg−1 | pmC | permil | |
| Akron, CO, 1992 | ||||
| Native | 0–10 | 13.6 ± 1.5 | 97.6 ± 1.4 | −16.1 |
| 10–20 | 9.5 ± 0.6 | 82.7 ± 1.3 | −15.3 | |
| 20–30 | 7.9 ± 0.7 | 74.2 ± 0.2 | −14.7 | |
| Cultivated | 0–10 | 8.9 ± 1.0 | 85.2 ± 2.7 | −19.3 |
| 10–20 | 7.5 ± 0.4 | 74.5 ± 0.9 | −17.3 | |
| 20–30 | 6.2 ± 0.4 | 64.4 ± 2.1 | −15.9 | |
| Sidney, NE, 1992 | ||||
| Native | 0–10 | 21.0 ± 0.9 | 105.0 | −16.4 |
| Sod | 0–10 | 30.0 ± 0.7 | 112.0 ± 7.0 | −20.1 |
| Plow | 0–10 | 14.0 ± 0.3 | 94.1 ± 1.0 | −19.8 |
| Mandan, ND, 1947 | ||||
| Native | 0–15 | 25.6 ± 1.1 | 86.2 ± 0.8 | NA |
| Cultivated | 0–15 | 17.5 ± 0.5 | 78.5 ± 0.5 | NA |
Note: The soils of Akron, CO, Sidney, NE, and Mandan, ND, were classified as Weld loam, fine, montmorillonitic, mesic Aridic Paleustoll; Duroc loam, fine-silty, mixed, mesic Pachic Haplustoll; and Temvik silt loam, fine-silty, mixed, Typic Haploborol, respectively. NA = not available. # From Follett et al. [25].
Table 2.
The sizes and turnover times of the labile and the stable soil organic carbon pools as determined by the paired-plot bulk-carbon method [4] and the bomb radiocarbon signature [5].
| Crop-C in | Labile-C in | ||||||||
|---|---|---|---|---|---|---|---|---|---|
| Soil Sample | Depth | Labile Pool 1 | Total SOC | Size | 14 C | Mean Age | Size | 14 C | Mean Age |
| Labile Pool | Resistant Pool | ||||||||
| cm | % | % | g kg−1 | pmC | year | g kg−1 | pmC | year | |
| Akron CO, 1992 | |||||||||
| Native | 0–10 | 59.6 | 8.1 | 121.1 | 34 | 5.5 | 63.4 | 3763 | |
| 10–20 | 43.2 | 4.1 | 113.5 | 68 | 5.4 | 59.4 | 4314 | ||
| 20–30 | 36.7 | 2.9 | 109.9 | 93 | 5.0 | 53.7 | 5138 | ||
| Cultivated | 0–10 | 91.6 | 38.2 | 3.4 | 121.1 | 34 | 5.5 | 63.4 | 3763 |
| 10–20 | 70.9 | 28.0 | 2.1 | 113.5 | 68 | 5.4 | 59.4 | 4314 | |
| 20–30 | 59.5 | 19.4 | 1.2 | 109.9 | 93 | 5.0 | 53.7 | 5138 | |
| Sidney, NE, 1992 | |||||||||
| Native | 0–10 | 41.0 | 8.6 | 127.7 | 17 | 12.4 | 89.7 | 899 | |
| Sod | 0–10 | 58.7 | 17.6 | 127.7 | 17 | 12.4 | 89.7 | 899 | |
| Plow | 0–10 | 72.6 | 11.4 | 1.6 | 127.7 | 17 | 12.4 | 89.7 | 899 |
| Mandan, ND, 1947 | |||||||||
| Native | 0–15 | 100.2 | |||||||
| Cultivated | 0–15 | 100.2 | |||||||
1 Calculated by the 13C data provided by Follet et al. [25] and the turnover times of labile pools.
Table 3.
The 14C activities and 14C ages of the acid-hydrolysis fractions of the soil organic carbon, as initially reported by Paul et al. [12].
Table 3.
The 14C activities and 14C ages of the acid-hydrolysis fractions of the soil organic carbon, as initially reported by Paul et al. [12].
| Soil Sample | Depth | Size | 14C | 14C Age | Size | 14C | 14C Age |
|---|---|---|---|---|---|---|---|
| Hydrolyzable | Nonhydrolyzable | ||||||
| cm | g kg−1 | pmC | year | g kg−1 | pmC | year | |
| Akron CO, 1992 | |||||||
| Native | 0–10 | 6.0 | 123.0 | Bomb | 7.6 | 78.0 | 1994 |
| 10–20 | 5.2 | 98.0 | 130 | 4.3 | 66.5 | 3260 | |
| 20–30 | 4.4 | 93.06 | 625 | 3.5 | 51.4 | 5355 | |
| Cultivated | 0–10 | 3.6 | 114.0 | Bomb | 5.3 | 66.7 | 3326 |
| 10–20 | 3.4 | 106.0 | Bomb | 4.1 | 61.4 | 5736 | |
| 20–30 | 3.2 | 75.0 | 2355 | 3.0 | 53.4 | 5070 | |
| Sidney, NE, 1992 | |||||||
| Native | 0–10 | 6.3 | 131.4 | Bomb | 14.7 | 94.4 | 462 |
| Sod | 0–10 | 11.7 | 150.9 | Bomb | 18.3 | 87.1 | 1110 |
| Plow | 0–10 | 5.3 | 101.4 | Modern | 8.7 | 89.6 | 905 |
| Mandan, ND, 1947 | |||||||
| Native | 0–15 | 10.8 | 100.8 | Modern | 14.9 | 75.6 | 2245 |
| Cultivated | 0–15 | - | - | - | - | 78.5 | 1945 |
Disclaimer/Publisher’s Note: The statements, opinions and data contained in all publications are solely those of the individual author(s) and contributor(s) and not of MDPI and/or the editor(s). MDPI and/or the editor(s) disclaim responsibility for any injury to people or property resulting from any ideas, methods, instructions or products referred to in the content. |
© 2023 by the author. Licensee MDPI, Basel, Switzerland. This article is an open access article distributed under the terms and conditions of the Creative Commons Attribution (CC BY) license (https://creativecommons.org/licenses/by/4.0/).
Share and Cite
MDPI and ACS Style
Hsieh, Y.-P. The Labile and Resistant Soil Organic Carbon Pools in the North America Great Plains. Environments 2023, 10, 197. https://doi.org/10.3390/environments10110197
AMA Style
Hsieh Y-P. The Labile and Resistant Soil Organic Carbon Pools in the North America Great Plains. Environments. 2023; 10(11):197. https://doi.org/10.3390/environments10110197
Chicago/Turabian StyleHsieh, Yuch-Ping. 2023. "The Labile and Resistant Soil Organic Carbon Pools in the North America Great Plains" Environments 10, no. 11: 197. https://doi.org/10.3390/environments10110197
Note that from the first issue of 2016, this journal uses article numbers instead of page numbers. See further details here.