Article

A Follow-Up Study on the Influence of Personal, Family, and School Factors on Learning Outcomes of Students with Disabilities in Senior High School

1
Department of Special Education, National Tsing Hua University, No. 521, Nanda Rd., East Dist., Hsinchu City 300193, Taiwan
2
Department of Industrial Education and Technology, National Changhua University of Education Bao-Shan Campus, No.2, Shi-Da Rd., Changhua City 500208, Taiwan
3
NCUE Alumni Association, National Changhua University of Education Jin-De Campus, No. 1, Jinde Rd., Changhua City 500207, Taiwan
*
Author to whom correspondence should be addressed.
Behav. Sci. 2023, 13(7), 554; https://doi.org/10.3390/bs13070554
Submission received: 1 June 2023 / Revised: 22 June 2023 / Accepted: 27 June 2023 / Published: 4 July 2023
(This article belongs to the Special Issue Behaviors in Educational Settings)

Abstract

:
The purposes of this study were to describe the learning outcomes of students with disabilities in senior high school, to establish a model to explain the effects of personal, family, and school experience factors on the learning outcomes of students with disabilities, and to determine the relationship between post-school and in-school outcomes. There were 496 participants selected in the 2011 and 2012 academic year from the database of Special Needs Education Longitudinal Study. The survey data obtained from questionnaires for teachers, parents, and students were used to conduct secondary analysis. Descriptive statistics such as frequencies and percentages, a PLS structural equation model, and multiple regression were used in this study. The results of this study were as follows: (1) Students with disabilities had the best learning performances in school, and most parents were satisfied with their students’ education in school; however, employment performance was the weakest upon leaving school. (2) School experience factors had the greatest influence on the school learning outcomes model, followed by student factors and family factors. (3) In-school outcomes effectively predicted postsecondary education, employment, social adaptation, and satisfaction after leaving school. In conclusion, the results of this study found that personal, family, and school factors have a significant impact on the learning outcomes of students with disabilities, and in-school outcomes can effectively predict postsecondary education, social adaptation, and satisfaction after leaving school.

1. Introduction

Since the announcement of the Education for All Handicapped Children Act in 1975 in the United States, it has been emphasized that the federal government should understand the effectiveness of special education implemented by state and local educational institutions through evaluation [1,2]. This act was amended in 1990 as The Individuals with Disabilities Education Act (IDEA). Article 612 emphasizes that states should establish performance indicators for students with disabilities to measure their progress [3,4]. It was revised again in 2004, emphasizing that all students with disabilities, like general students, must receive regular state-wide or school-district assessments to understand their learning outcomes in general education subjects [5]. In Taiwan, Article 47 of the Special Education Law also stipulates: “The effectiveness of special education in schools at all levels of education below senior high school shall be evaluated by the competent authority at least every four years” to understand the accountability of special education.
Students with disabilities have higher rates of absenteeism and dropouts [6,7], their academic performance lags behind that of general students [7,8,9], and their graduation rate is relatively low [6], but there is no obvious difficulty in social adaptation and self-care ability [8]. Furthermore, the rate of students with disabilities participating in postsecondary education and employment increases as the time of leaving school increases [7,10]. Conversely, the frequency of community volunteer service and participation in club organization activities decreases with an increase in the time away from school [7,11].
It can be seen that the special education regulations of the United States and Taiwan both emphasize the learning outcomes of students with disabilities and the effectiveness of special education through regular assessments. However, there few studies on the learning outcomes of students with disabilities in high school in Taiwan. Therefore, one of the purposes of this study is to explore the learning outcomes of students with disabilities in senior high school.
Secondly, there are many factors related to learning outcomes. Many studies have found that the characteristics of students’ disabilities, gender, intelligence, school environment, and school size will affect students’ learning outcomes [6,12,13,14,15]. Wagner et al. (2003) also pointed out that personal background variables such as student disability categories, gender, and race; family background variables such as family income, parental participation, and parental expectations; and school background variables such as time spent participating in regular class activities, receiving teaching adjustments, and support services were important factors affecting learning outcomes. Therefore, the second purpose of this study is to construct an impact model of learning outcomes of students with disabilities [8].

2. Literature Review

2.1. Learning Outcomes

Learning outcomes refer to the results that students acquire after receiving education in school, including cognitive learning, emotional expression, psychosocial development, practical ability, values, attitudes, skills, etc. [16,17,18,19]. In the field of education, students’ learning outcomes are mostly informed by their academic achievements, specifically their mastery of subject content and the school’s accountability [8]. Second, attendance is the most basic indicator of participation in school activities, and high absenteeism is an important predictor of academic failure and dropout among students with disabilities [20]. This is because adolescents spend most of their time at school, and school is where they learn to solve problems, follow instructions, and build relationships with peers and adults. Therefore, adolescents’ behavior at school is also a key factor in social adjustment.
For regular students and students with disabilities, the main purpose of education is to prepare for future adult life. Before the mid-1990s, most of the post-school outcomes of students with disabilities emphasized employment outcomes. However, studies have shown that before 1959, only 20% of workers required at least a college degree for their jobs, and this had increased to 56% by 2000 [21]. Therefore, being able to access and participate in postsecondary education is an important challenge in secondary education and transition for students with disabilities [22]. Secondly, the use of leisure time and the time spent with friends by regular students and students with disabilities after leaving school are also different from those at school, including the use of leisure time, interaction with friends, and participation in community organizations or activities [23].
The National Longitudinal Transition Study of Special Education Students (NLTS) proposes that academic achievement, graduation rate, postsecondary education, employment, and independence are the learning outcomes of middle school students in and out of school [7]. Since 2000, The National Longitudinal Transition Study-2 (NLTS2) has proposed four dimensions of school participation, academic performance, social adaptation, and independence as in-school outcomes, and postsecondary education, employment, independence, social participation, and civic activities have been proposed post-school outcomes [8,23]. In Taiwan, the SNELS also divides the educational outcomes of students with disabilities into two parts: in-school outcomes and post-school outcomes. In-school outcomes include learning participation, learning performance, life and independence, social adaptation, satisfaction, and family outcomes, while post-school outcomes include employment and vocational rehabilitation, postsecondary education, responsibility and independence, social adaptation, self-determination, health and safety, and satisfaction.

2.2. In-School and Post-School Outcomes

Wagner et al. (1993) analyzed NLTS data and found that 18.7% of students were absent for more than 20 days per semester, and the dropout rate of students with emotional disabilities was the highest [7]. Wagner et al. (2003) analyzed the first wave of NLTS2 data and found that only 30% of students with disabilities fell between A and B in subject achievement and averaged 3.6 grades behind general students in reading and math tests. However, most of the students got along well with their peers and had good self-care skills [8]. Wagner et al. (2006a) analyzed the second wave of NLTS2 data and also found that 14–27% of students with disabilities had a score of less than 70 on the standardized achievement test, among which reading comprehension was scored the lowest [9]. Barrat et al. (2014) compared the results of students with disabilities and regular students in grades 6–12 in Utah, showing that the dropout rates of students with disabilities were higher than those of regular students, and the graduation rate were lower than that of regular students [6].
It can be seen that in terms of in school learning outcomes, students with disabilities have higher absentee and dropout rates, poor academic performance, and lower graduation rates than regular students, but exhibit better in social adaptation and independence [6,7,8,9,24,25].
Wagner et al. (2005) analyzed the results of students with disabilities within two years of leaving school and found that 30.6% of students participated in postsecondary education, with most attending two-year community colleges and the least attending four-year universities [23]. Additionally, 42.9% of students participated in employment, and only 28% of them joined social organizations. Wagner et al. (1993) compared the outcomes of students with disabilities who had left school for two years and those who had left school for three to five years and found that the participation rate in postsecondary education increased from 14% to 26.7% [7] and the rate of participation in competitive employment increased from 45.7% to 57.8%. However, their weekly interaction rate with friends or other family members decreased from 51.9% to 38.2%, and the rate of participation in club activities also decreased from 28.0% to 21.4%. In addition, Newman et al. (2011) compared the results of students with disabilities within three years after leaving school and within five to eight years and found that the rate of participation in postsecondary education increased from 52.3% to 61.9%, the rate of participation in employment increased from 49.5% to 59.1% and the rate of joining social organizations increased from 30.2% to 42.2% [26].
Based on the above discussion, we know that the participation rate of students with disabilities in postsecondary education and employment will increase with an increase of time away from school. After leaving school, two-year community colleges are the most common, and four-year universities are the least common. Also, the rate of interacting with friends is significantly lower [7,23]. However, studies have found that the rate of students with disabilities participating in social organizations and activities after graduation produces inconsistent results [7,26]. Therefore, this study will explore the outcomes of high school students with disabilities leaving school from the perspectives of postsecondary education, employment, social adaptation, and satisfaction.
In Taiwan, the Special Needs Education Longitudinal Study (SNELS) is a longitudinal database which was established to collect the data of individuals with disabilities, their families, and schools in the four stages of education: preschool, primary school, junior high school, and senior high school. This is done in a comprehensive and longitudinal manner, facilitating investigations into the important issues for the education of individuals with disabilities. It also allows for related analysis of the teaching situation and educational achievements of students with disabilities [27,28].
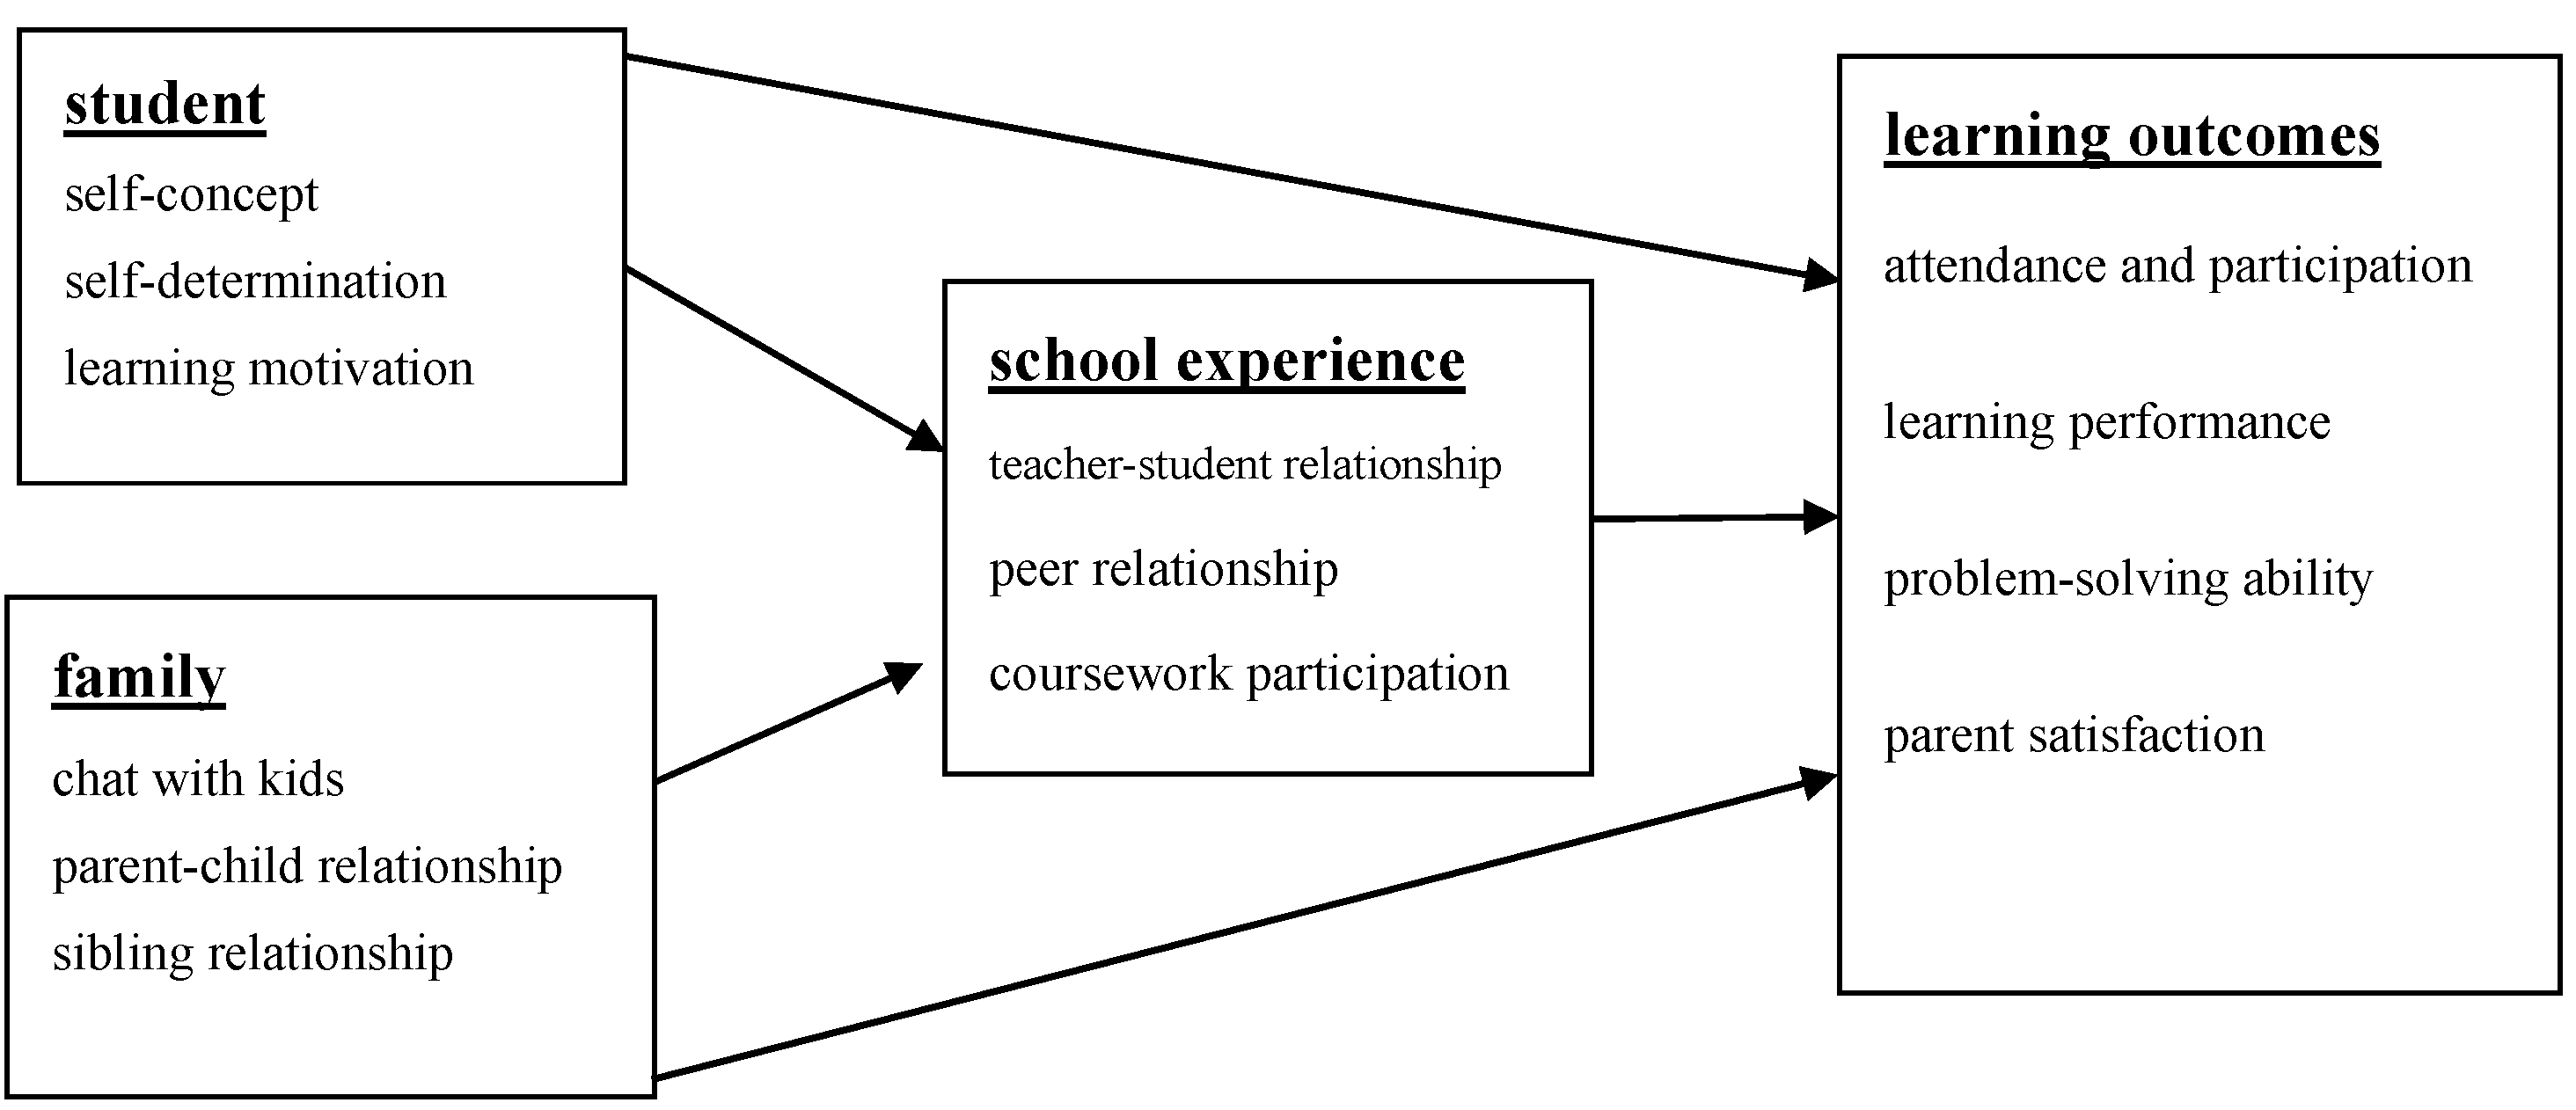
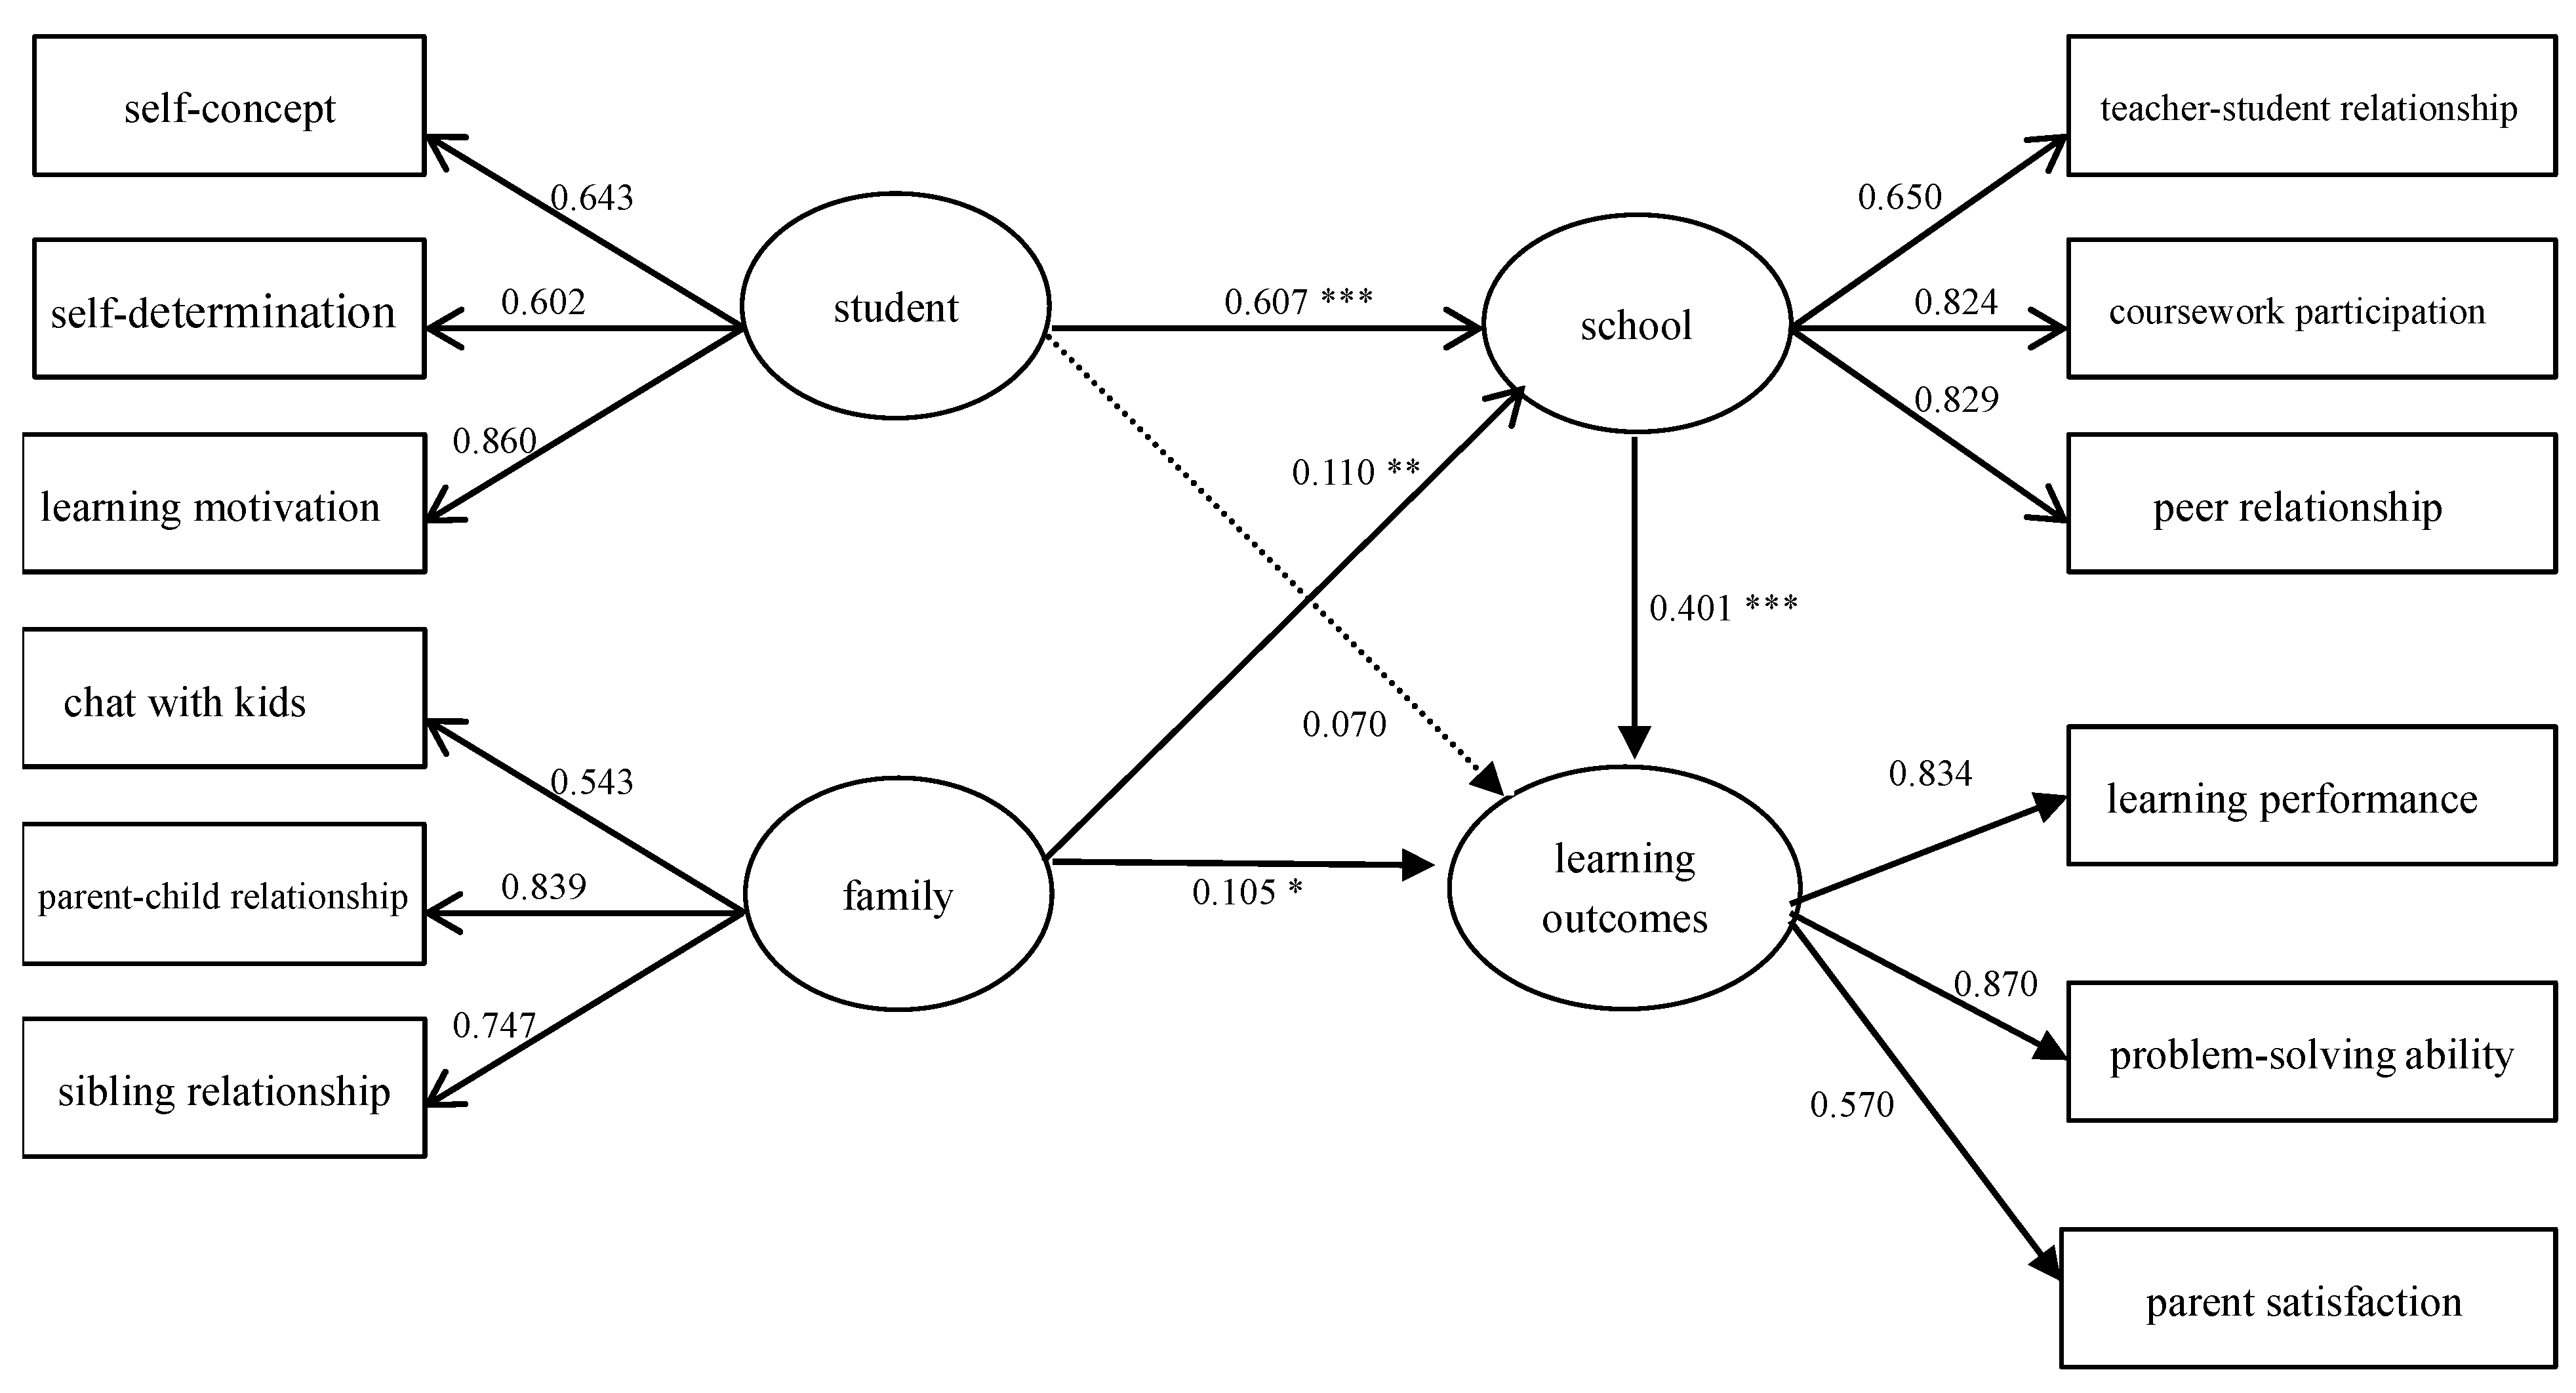
Therefore, the main purpose of this study was to use the data from the SNELS to explore the learning outcomes of students with disabilities in senior high school, the influence model of the learning outcomes of students with disabilities, and the correlation between post-school and in-school outcomes. The research questions are as follows: (1) According to the data of the 2011 and 2012 academic years, what are the learning outcomes of students with disabilities in-school and post-school? (2) What are the influences of personal factors, family factors, and school experience factors on learning outcomes of students with disabilities in senior high school? (3) According to the data of the 2011 and 2012 academic years, which dimensions of the in-school learning outcomes can effectively predict post-school postsecondary education, employment, social adaptation, and satisfaction?

3. Methodology

3.1. Research Model

The researchers refered to the three databases, NLTS [7], NLTS2 [8], and SNELS, to define the scope of in-school outcomes, and IDEA emphasizes the rights of parents to participate in the learning activities of students with disabilities and to review learning outcomes. Therefore, the researchers constructed a theoretical framework for the learning outcomes of students with disabilities in school, and structure of this study is shown in Figure 1. The latent dependent variable was learning outcomes, including attendance and activity participation, learning performance, problem-solving ability, and parent satisfaction. Latent independent variables included student factors, family factors, and school experience factors. Therefore, this study used school experience as the mediating variable to construct an impact model on the learning outcomes of students with disabilities in high school.

3.2. Participants

The participants in this study consisted of the data from the 2011 and 2012 academic years released by the SNELS. From the 2011 academic year data file, the researchers found that there were a total of 3654 students with disabilities in the first and third years of senior high school. After excluding those who left after the first year of senior high school, 1451 students remained, and 496 students were selected and placed exclusively in general classes. The total number of samples released in the 2012 academic year was 1293. However, since the placement category of the sample in the third year of senior high school was unknown, the researchers selected the subjects who were placed in the regular class in the 2011 academic year with the same student code. Due to data loss for 92 participants, a total of 404 students who had left school were obtained. The 496 participants of this study in the 2011 academic year and their areas of residence, gender, and disability categories are shown in Table 1. Table 1 shows that the largest number of students with disabilities lived in the northern area (25.0%), followed by the central area (24.4%). There were more males than females (64.7%), and the most common types of disabilities were orthopedic disabilities (17.7%), followed by learning disabilities (16.9%).

3.3. Measures

In this study, certain topics were selected as observed indicators from the student questionnaire, teacher questionnaire, and parent questionnaire in the 2011 academic year, and the student questionnaire and parent questionnaire in the 2012 academic year (there was no teacher questionnaire because they had left school). Secondly, the researchers conducted factor analysis on the selected topics, and the names of the factors are shown in Table 2 and Table 3. There were four options for the selected questions, and the scoring method was given from one to four points. Table 2 shows the latent independent variables, including students, families, and schools. Table 3 shows the latent dependent variables, including in-school and post-school outcomes.

3.4. Data Analysis

This study used data from the SNELS database for secondary data analysis. Firstly, the researchers used the frequency distribution and percentage to understand the learning outcomes of students with disabilities in and out of school to answer research question 1. The PLS-SEM structural equation model was used to verify the impact model of learning outcomes of students with disabilities constructed in this study to answer research question 2. Secondly, the relationship between in and out of school outcomes was analyzed using a Pearson product–moment correlation, followed by multiple regression analysisto predict the in-school outcomes and post-school outcomes to answer research question 3.

4. Results

4.1. In-School and Post-School Learning Outcomes of Students with Disabilities

The learning outcomes of students with disabilities in school are shown in Table 4. The results show that the absentee rate of students with disabilities was relatively high, with a sometimes absentee rate of 52.4% and a frequent absentee rate of 1.4%. In terms of learning performance, including listening attentively in class, following teacher instructions, completing homework on time, and being able to focus on learning tasks, the agreement rate was as high as 80%. In terms of problem-solving ability, including making appropriate choices and decisions by themselves, finding solutions when encountering difficulties, managing their own time, and knowing the direction of their future career development, nearly 20% of the disabled students disagreed, especially for their future career development planning, and as many as 33.9% of students with disabilities had no clear direction.
As far as parent satisfaction was concerned, although more than 80% of parents were satisfied with their children’s relationships with teachers, classmates, and participation in school activities, nearly 17% of parents were still dissatisfied with their children’s learning progress at school. The results show that students with disabilities in the third year of senior high school had better school outcomes in terms of “learning outcomes”, and nearly 20% of the students said that they had difficulties in “problem-solving ability”. Most parents were satisfied with the overall situation of students with disabilities receiving education in school.
This study refers to relevant literature and lists the four dimensions of postsecondary education, employment, social adaptation, and satisfaction as the learning outcomes of school-leaving students. Table 5 shows the learning outcomes of school-leaving students with disabilities in the 2012 academic year. Among the 404 students with disabilities who left school, only 315 continued to enter universities after graduation (78.0%), and only 43 were employed (10.6%).
In terms of school-leaving outcomes, students with disabilities performed better in postsecondary education, social adaptation, and satisfaction, and performed poorly in employment. In particular, the employment rate of the participants in this study was extremely low. Only 8.9% of participants were satisfied with the salary of their current job, and only 9.7% liked their current job. Secondly, although the students with disabilities who had left school were more than 90% satisfied with their current living environment and conditions, more than 17% of parents were still dissatisfied with the current living conditions of their children with disabilities.

4.2. The Learning Outcomes Impact Model

The researchers used PLS-SEM to develop the impact model of the learning outcomes and found that the factor loading of “attendance and participation” was too low, so it was deleted. Based on the results, the factor loadings of individual variables ranged from 0.543 to 0.870, and from the perspective of compositional reliability, they ranged from 0.749 to 0.814. The average variation extraction of latent variables ranged from 0.505 to 0.597, conforming to the value suggested by Fornell and Larcker (1981) [29].
Secondly, based on the path relationship of the pattern of influencing factors on the learning outcomes of students with disabilities shown in Figure 2, the direct effect of individual student factors on learning outcomes did not reach the significance level of 0.05 (t < 1.96). The rest of the path relationships reached significant levels above 0.05 (t > 1.96). It can be seen that “student factors” had a greater impact on “school experience”, with a path coefficient of 0.61 (t > 3.29, p < 0.000). “School experience” also had a significant positive and direct impact on “learning outcomes”, with a path coefficient of 0.40 (t > 3.29, p < 0.000), and “student factors” and “family factors” also had a positive indirect impact on “learning outcomes” through “school experience”. The results also show that “school experience”, “student factors”, and “family factors” are all important influencing factors for the learning outcomes of students with disabilities. In terms of explanatory power, “student factors”, “family factors”, and “school experience” can explain 24.3% of the variance in the learning outcomes of students with disabilities, of which 16.1% of the variance comes from “school experience” and 8.2% of the variance comes from student and family factors. In conclusion, among the impact modes of the learning outcomes of students with disabilities, “school experience” had the greatest influence, followed by student factors and family factors.

4.3. Prediction of In-School Outcomes on Post-School Outcomes

Based on the impact model of the learning outcomes of students with disabilities shown in Figure 2, the researchers first conducted a product–moment correlation analysis between the three dimensions of in-school outcomes, including: learning performance, problem-solving ability, parent satisfaction, and the four dimensions of school-leaving outcomes, including: postsecondary education, employment, social adaptation, and satisfaction. According to the correlation analysis, although the correlation between most dimensions was significant, the correlation coefficients were all below 0.3, which indicates a low correlation. Next, the researchers conducted a stepwise regression analysis using the three dimensions of in-school outcomes as independent variables and the four dimensions of school-leaving outcomes as dependent variables. The results are shown in Table 6, Table 7, Table 8 and Table 9.
The results in Table 6 show that among the in-school outcomes of students with disabilities, there were two variables that could effectively predict postsecondary education after leaving school. They were parent satisfaction and learning performance (parent satisfaction β = 0.204, p < 0.000, learning performance β = 0.150, p = 0.002) which could explain 7.6% of the variance in total. Among them, the amount of variation that could be explained by parent satisfaction was relatively high. Secondly the results in Table 7 show that among the in-school outcomes of students with disabilities, only the learning performance could effectively predict employment after leaving school (β = −0.155, p = 0.002), but it could only explain 2.4% of the variance. The results in Table 8 show that among the in-school outcomes of students with disabilities, there were two variables that could effectively predict the social adaptation after leaving school. They were parent satisfaction and problem-solving ability (parent satisfaction β = 0.184, p < 0.000, problem-solving ability β = 0.133, p = 0.007) which could explain 6.1% of the variance, of which parent satisfaction could explain a higher amount of the variation. The results in Table 9 show that among the in-school outcomes of students with disabilities, only parent satisfaction could effectively predict satisfaction after leaving school (β = 0.363, p < 0.000), which could explain 13.2% of the variance.

5. Discussion

The results of this study demonstrated that the learning outcomes of students with disabilities were better in “learning performance”, and the students experienced more difficulties in “problem-solving ability”. Most students could participate in school activities but had a high absentee rate, and parents were satisfied with the education situation of students with disabilities in schools. This result is consistent with Wagner et al. (1993) and Wagner et al. (2003), who found that the absentee rate of students with disabilities is higher than that of general students [7,8]. Secondly, Newman (2005) analyzed the Special Education Elementary Longitudinal Study (SEELS) and NLTS2 database and pointed out that more than 85% of parents are satisfied with the overall situation of school education for their children with disabilities [30], which is also consistent with the findings of this study. Secondly, because the participants in this study were all placed in general classes, nearly 17% of parents were less satisfied with the learning progress of their children with disabilities. This situation is also consistent with Barrat et al. (2014), Newman et al. (2011), Paul (2011), and Wagner (1993), who found that students with disabilities performed worse than their peers [6,7,14,26].
In terms of the performance situation of school-leaving outcomes, students with disabilities performed better in postsecondary education, social adaptation, and satisfaction, and they performed the worst in employment. According to the analysis of the NLTS database, the participation rate of students with disabilities in postsecondary education within two years of leaving school was 14%, and the employment rate was as high as 46% [7]. The analysis of the second wave of the NLTS2 database also showed that the participation rate of students with disabilities in postsecondary education within two years of leaving school was 30.6%, and the employment rate was as high as 43%. This result is inconsistent with the findings of this study, which may be due to the fact that the participants in this study had only graduated from senior high school for one year, most of them chose to pursue higher education, and relatively few were employed [23].
Secondly, this study explored the impact model of the in-school learning outcomes and found that “family factors”, “student factors”, and “school experience” are all important factors. Among them, “school experience” has the greatest influence, followed by student factors and family factors. Dell’Anna et al. (2022) found that teachers provide more teaching time and increase opportunities for students with disabilities to interact with general peers, which can improve their learning outcomes [31]. Doren et al. (2012) also found that student factors and parent expectations have a significant relationship with children’s learning outcomes [32], which are consistent with the results of this study. In addition, this study also explored the prediction results of students with disabilities in school on school leaving outcomes, although in-school outcomes could effectively predict postsecondary education, employment, social adaptation, and satisfaction after leaving school. However, based on the coefficient of determination, the in-school outcomes of students with disabilities could explain only a small amount of variation in their school-leaving outcomes, especially because only 2.4% of the variance was explained by their post-school employment outcomes. However, this result is inconsistent with Chiang et al. (2012) [33], who found that factors such as learning performance and parent expectations can effectively predict autistic students’ participation in postsecondary education. Chiang et al. (2013) also found that factors such as career counseling and high school vocational training programs can effectively predict employment outcomes for students with autism [34]. It may be that the participants in this study had just graduated from senior high school for one year, and the outcomes of leaving school, such as postsecondary education, employment, social adaptation, and satisfaction, had not yet been concretely manifested. Therefore, the predictive power was limited.

6. Conclusions

This study adopted the secondary analysis method and used data from the SNELS database to analyze the performance of the learning outcomes of students with disabilities in general classes, as well as the correlation between post-school and in-school outcomes. The results of the study found that students with disabilities had better learning performance in school, but 20% of students still had difficulties in problem-solving ability. Most parents were satisfied with the situation of students receiving education in school. On the other hand, students with disabilities performed better in postsecondary education, social adaptation, and satisfaction, and had the worst performance in employment. The impact model of learning outcomes constructed in this study shows that “school experience” had the greatest influence on the school learning outcomes model of students with disabilities, followed by student factors and family factors. Secondly, in terms of the predictive power of in-school outcomes on post-school outcomes, it was found that the in-school outcomes could effectively predict postsecondary education, employment, social adaptation, and satisfaction after leaving school, but the explanatory power of employment was weaker.
Based on the above conclusions, this study found that school experience factors, including teacher–student relationships, peer relationships, and coursework participation, had an important impact on the learning outcomes of students with disabilities. Therefore, the researchers suggest that schools can provide peer support through regular class teachers or teacher assistants, which can effectively enhance the interaction between regular class peers and students with disabilities and the progress of IEP goals for students with disabilities [35]. It also provides regular class teachers with adjustments to teaching environments and teaching strategies [17], and support services that meet the needs of students with disabilities to improve their learning outcomes. This study also found that students with disabilities were less satisfied with the performance of their self-determination and future career development direction. The researchers also suggest that schools should strengthen the teaching of decision-making and career planning skills through relevant courses and activities, and encourage students to participate in IEP meetings and transition activities to express their own ideas and decision-making rights. This study explored the learning outcomes of students with disabilities who were placed in regular classes and its influencing factors. Due to the significant individual differences in the types and degrees of disabilities among students with disabilities, the performance of learning outcomes also varied greatly. The researchers suggest that follow-up research can explore the learning outcomes of students with different types of disabilities. In addition, this study only selected certain topics from the SNELS database as research tools. Due to the design of the database items, some measurement components had fewer topics. It is recommended that follow-up research can select more representative topics or collect longitudinal data on participants to analyze trends in learning outcomes.

Author Contributions

All authors contributed meaningfully to this study. Research topic, S.-J.S. and W.-S.H.; methodology, S.-J.S. and W.-S.H.; validation, S.-J.S. and W.-S.H.; formal analysis, S.-J.S. and W.-S.H.; investigation, S.-J.S. and W.-S.H.; resources, S.-J.S. and W.-S.H.; data curation, S.-J.S. and W.-S.H.; writing—original draft preparation, S.-J.S. and W.-S.H.; writing—review and editing, S.-J.S. and W.-S.H.; visualization, S.-J.S. and W.-S.H.; supervision, S.-J.S. and W.-S.H.; project administration, S.-J.S. and W.-S.H. All authors have read and agreed to the published version of the manuscript.

Funding

The authors received no financial support for the research, authorship, and/or publication of this article.

Institutional Review Board Statement

The study was approved by the Department of Special Education, National Tsing Hua University.

Informed Consent Statement

Not applicable.

Data Availability Statement

The data described in this article are openly available at https://srda.sinica.edu.tw/browsingbydatatype_result.php?category=surveymethod&type=2&csid=18 (accessed on 1 March 2023).

Acknowledgments

The authors are grateful for the support of the Department of Special Education, National Tsing Hua University.

Conflicts of Interest

The authors declare no potential conflict of interest with respect to the research, authorship, and/or publication of this article.

References

  1. DeStefano, L. Evaluating effectiveness: A comparison of federal expectations and local capabilities for evaluation among federally funded model demonstration programs. Educ. Eval. Policy Anal. 1992, 14, 157–168. [Google Scholar] [CrossRef]
  2. U.S. Department of Education. A History of the Individuals with Disabilities Education Act. 2023. Available online: https://sites.ed.gov/idea/IDEA-History (accessed on 30 May 2023).
  3. Wolfe, P.S.; Hall, T.E. Making inclusion a reality for students with severe disabilities. Teach. Except. Child. 2003, 35, 56–60. [Google Scholar] [CrossRef]
  4. The Council for Exceptional Children. IDEA 1997: Let’s Make It Work; The Council for Exceptional Children: Arlington, VA, USA, 1998. [Google Scholar]
  5. Rothstein, L.; Johnson, S.F. Special Education Law; Sage: Newcastle upon Tyne, UK, 2009. [Google Scholar]
  6. Barrat, V.X.; Berliner, B.; Voight, A.; Tran, L.; Huang, C.W.; Yu, A.; Chen-Gaddini, M. School Mobility, Dropout, and Graduation Rates across Student Disability Categories in Utah. REL 2015-055. Regional Educational Laboratory West. 2014. Available online: https://eric.ed.gov/?id=ED548546 (accessed on 2 January 2023).
  7. Wagner, M. The Transition Experiences of Young People with Disabilities. A Summary of Findings from the National Longitudinal Transition Study of Special Education Students. 1993. Available online: https://eric.ed.gov/?id=ED365086 (accessed on 5 January 2023).
  8. Wagner, M.; Marder, C.; Blackorby, J.; Cameto, R.; Newman, L.; Levine, P.; Davies-Mercier, E. The Achievements of Youth with Disabilities during Secondary School; SRI International: Menlo Park, CA, USA, 2003. [Google Scholar]
  9. Wagner, M.; Newman, L.; Cameto, R.; Levine, P. The Academic Achievement and Functional Performance of Youth with Disabilities. A Report from the National Longitudinal Transition Study-2 (NLTS2). NCSER 2006-3000. Online Submission. 2006. Available online: https://eric.ed.gov/?id=ED494936 (accessed on 6 January 2023).
  10. Newman, L.; Wagner, M.; Cameto, R.; Knokey, A.M. The Post-High School Outcomes of Youth with Disabilities up to 4 Years after High School: A Report From the National Longitudinal Transition Study-2 (NLTS2); NCSER 2009-3017; National Center for Special Education Research: Washington, DC, USA, 2009.
  11. Wagner, M.; Newman, L.; Cameto, R.; Levine, P.; Garza, N. An Overview of Findings from Wave 2 of the National Longitudinal Transition Study-2 (NLTS2); NCSER 2006-3004; National Center for Special Education Research: Washington, DC, USA, 2006.
  12. Summers, A.A. School social systems and student achievement: Schools can make a difference: Wilbur Brookover, Charles Beady, Patricia Flood, John Schweitzer, and Joe Wisenbaker. New York: Praeger, 1979. Pp. 237. No price listed (cloth). Econ. Educ. Rev. 1981, 1, 397–400. [Google Scholar] [CrossRef]
  13. Mortimore, P.; Sammons, P.; Stoll, L.; Lewis, D.; Ecob, R. A study of effective junior schools. Int. J. Educ. Res. 1989, 13, 753–768. [Google Scholar] [CrossRef]
  14. Paul, S.M. Outcomes of students with disabilities in a developing country: Tobago. Int. J. Spec. Educ. 2011, 26, 194–211. [Google Scholar]
  15. Rutter, M. Fifteen Thousand Hours: Secondary Schools and Their Effects on Children; Harvard University Press: Cambridge, MA, USA, 1979. [Google Scholar]
  16. DeStefano, L.; Wagner, M. Outcome Assessment in Special Education: Lessons Learned. 1991. Available online: https://eric.ed.gov/?id=ED327565 (accessed on 8 January 2023).
  17. Spady, W.G. Outcome-Based Education: Critical Issues and Answers; American Association of School Administrators: Arlington, VA, USA, 1994. [Google Scholar]
  18. Liao, C.-W.; Tseng, Y.-J.; Liao, Y.-H.; Chen, B.-S.; Ho, W.-S.; Wang, I.-C.; Lin, H.-I.; Chen, I.-M. A Practical Curriculum Design and Learning Effectiveness Evaluation of Competence-Oriented Instruction Strategy Integration: A Case Study of Taiwan Skills-Based Senior High School. Behav. Sci. 2023, 13, 43. [Google Scholar] [CrossRef] [PubMed]
  19. Sun, S.-J.; Lee, X.-B. A Preliminary Study of Special Education Teacher Students’ Competence in 108 Curriculum Literacy Oriented Teaching Practices. Nantou Spec. Educ. J. 2022, 31, 1–7. [Google Scholar]
  20. Thurlow, M.L.; Sinclair, M.F.; Johnson, D.R. Students with Disabilities Who Drop Out of School: Implications for Policy and Practice. Issue Brief: Examining Current Challenges in Secondary Education and Transition. 2022. Available online: https://eric.ed.gov/?id=ED468582 (accessed on 2 March 2023).
  21. Carnevale, A.P.; Fry, R.A. Crossing the Great Divide: Can We Achieve Equity When Generation Y Goes to College? Leadership 2000 Series; 2000. Available online: https://eric.ed.gov/?id=ED443907 (accessed on 6 March 2023).
  22. National Center on Secondary Education and Transition. A National Leadership Summit on Improving Results for Youth: State Priorities and Needs for Assistance. 2003. Available online: http://www.ncset.org/summit03/NCSETSummit03findings.pdf (accessed on 30 May 2023).
  23. Wagner, M.; Newman, L.; Cameto, R.; Garza, N.; Levine, P. After High School: A First Look at the Postschool Experiences of Youth with Disabilities. A Report from the National Longitudinal Transition Study-2 (NLTS2). Online Submission. 2005. Available online: https://eric.ed.gov/?id=ED494935 (accessed on 2 March 2023).
  24. Wang, Y.-Q.; Sun, S.-J. The effectiveness of integrating table games into social skills programmes to enhance social skills and peer acceptance of students with intellectual disabilities. Bull. East. Taiwan Spec. Educ. 2020, 22, 27–57. [Google Scholar]
  25. Wu, Y.C.; Sun, S.-J. The Study of Promoting Peer Intera ction for the Students with Intellectual Disabilities in Regular Classroom by Super Skills Courses. J. Res. Spec. Educ. Assist. Technol. 2019, 11, 23–57. [Google Scholar] [CrossRef]
  26. Newman, L.; Wagner, M.; Knokey, A.M.; Marder, C.; Nagle, K.; Shaver, D.; Wei, X. The Post-High School Outcomes of Young Adults with Disabilities up to 8 Years after High School: A Report from the National Longitudinal Transition Study-2 (NLTS2); NCSER 2011-3005; National Center for Special Education Research: Washington, DC, USA, 2011.
  27. Sun, S.-J.; Huang, T.-Y. School support services model for students with disabilities in general education classrooms: Using data from the special needs education longitudinal study in Taiwan. J. Lit. Art Stud. 2016, 6, 1063–1077. [Google Scholar] [CrossRef]
  28. Sun, S.-J.; Huang, T.-Y. The performance and influence factors on the learning outcomes of students with disabilities in high school. Dev. Spec. Educ. 2020, 70, 35–52. [Google Scholar]
  29. Fornell, C.; Larcker, D.F. Evaluating structural equation models with unobservable variables and measurement error. J. Mark. Res. 1981, 18, 39–50. [Google Scholar] [CrossRef]
  30. Newman, L. Family Involvement in the Educational Development of Youth with Disabilities: A Special Topic Report of Findings from the National Longitudinal Transition Study-2 (NLTS2). Online Submission. 2005. Available online: https://eric.ed.gov/?id=ED489979 (accessed on 2 January 2023).
  31. Dell’Anna, S.; Pellegrini, M.; Ianes, D.; Vivanet, G. Learning, social, and psychological outcomes of students with moderate, severe, and complex disabilities in inclusive education: A systematic review. Int. J. Disabil. Dev. Educ. 2022, 69, 2025–2041. [Google Scholar] [CrossRef]
  32. Doren, B.; Gau, J.M.; Lindstrom, L.E. The relationship between parent expectations and postschool outcomes of adolescents with disabilities. Except. Child. 2012, 79, 7–23. [Google Scholar] [CrossRef] [Green Version]
  33. Chiang, H.M.; Cheung, Y.K.; Hickson, L.; Xiang, R.; Tsai, L.Y. Predictive factors of participation in postsecondary education for high school leavers with autism. J. Autism Dev. Disord. 2012, 42, 685–696. [Google Scholar] [CrossRef]
  34. Chiang, H.M.; Cheung, Y.K.; Li, H.; Tsai, L.Y. Factors associated with participation in employment for high school leavers with autism. J. Autism Dev. Disord. 2013, 43, 1832–1842. [Google Scholar] [CrossRef]
  35. Brock, M.E.; Biggs, E.E.; Carter, E.W.; Cattey, G.N.; Raley, K.S. Implementation and generalization of peer support arrangements for students with severe disabilities in inclusive classrooms. J. Spec. Educ. 2016, 49, 221–232. [Google Scholar] [CrossRef]
Figure 1. Learning outcomes impact model for students with disabilities.
Behavsci 13 00554 g001
Figure 2. Learning outcomes model for students with disabilities. * p < 0.05 ** p < 0.01 *** p < 0.001.
Behavsci 13 00554 g002
Table 1. Number of valid samples.
n%
Residence areaTaipei, Keelung, Yilan12425.0
Taoyuan, Hsinchu, Miaoli8216.5
Taichung, Changhua, Nantou12124.4
Yunlin, Chiayi, Tainan7815.7
Kaohsiung, Pingtung7014.1
Hualien, Taitung, and Outlying Islands214.2
GenderMale32164.7
Female17535.3
Disability categoryIntellectual disabilities163.2
Visual impairments306.0
Hearing impairments5310.7
Speech or language impairments81.6
Orthopedic disabilities8817.7
Other health impairments6613.3
Emotional and behavior disorders469.3
Learning disabilities8416.9
Multiple disabilities173.4
Autism6513.1
Other significant disabilities234.6
Total496100%
Table 2. Latent independent variables and observed indicators.
Latent VariablesObserved VariablesQuestionnaire SourceQuestions
StudentSelf-conceptStudent
  • Are you satisfied with your appearance?
  • Do you like yourself?
  • Do you think you have any strengths?
Self-determinationStudent
  • Could you solve problems by yourself?
  • Could you make decisions by yourself?
Learning motivationStudent
  • Do you feel that you learned a lot in school?
  • Do you like going to school?
FamilyChat with kidsParent
  • Do you often chat with this child?
Parent-child relationshipStudent
  • Will your parents talk to you about further plan?
  • How is your relationship with your parents?
Sibling relationshipStudent
  • Do you get along well with your siblings?
  • Do you often chat with your siblings?
School experiencePeer relationshipStudent
  • How many good classmates do you have?
  • Do you often chat with your classmates?
  • Do you get along well with your classmates?
Teacher-student relationshipStudent
  • Do you like the teachers at school?
  • Is there anyone to help when you have difficulties?
Coursework participationStudent
  • Could you understand the content of the subjects?
  • Are you interested in the content of the subjects?
  • Will the teacher help you study?
Table 3. Latent dependent variables and observed indicators.
Latent VariablesObserved
Variables
Questionnaire
Source
Questions
In-school outcomesAttendance and participationTeacher
  • How is the student’s attendance?
  • How does the student participate in school activities?
Learning performanceTeacher
  • Pay attention in class
  • Follow the teacher’s instructions
  • Complete homework on time
  • Focus on learning task
Problem-solving abilityTeacher
  • Make your own choices and decisions
  • Find a way to solve the problem
  • Arrange your own time
  • Understand future career development
Parent satisfactionParent
  • The child gets along with the teachers
  • The child gets along with classmates
  • The child participates in school activities
  • The child’s learning progress
Post-school outcomesPostsecondary educationStudent
  • Do you have enough information when choosing a university department?
  • Do you think college life is happy?
  • Are you satisfied with your learning performance?
EmploymentStudent
  • Are you satisfied with the salary of the job?
  • Do you have any difficulties at work?
  • Do you like your current job?
Social adaptationStudent
  • Could you arrange your free time?
  • Could you do housework?
  • Could you manage your money?
SatisfactionStudent, Parent
  • Are you satisfied with your living environment?
  • Are you happy with your life now?
  • Are you satisfied with your child’s current living situation?
Table 4. Summary of in-school learning outcomes.
Latent VariablesObserved VariablesQuestionsOptionsFrequency%
LearningAttendance and participationHow is the student’s attendance?Full attendance22745.8
Outcomes Sometimes absent26052.4
Often absent71.4
Almost absent20.4
How does the student participate in school activities?All participate34870.2
Mostly participated11623.4
Rarely participate255.0
Never participate71.4
Learning performancePay attention in classOften24850.0
Sometimes17835.9
Rarely6112.3
Never91.8
Follow the teacher’s instructionsOften38477.4
Sometimes10721.6
Rarely51.0
Never00.0
Complete homework on timeOften28457.3
Sometimes15431.0
Rarely5010.1
Never81.6
Focus on learning taskOften24349.0
Sometimes19539.3
Rarely5410.9
Never40.8
Problem-solving abilityMake your own choices and decisionsVery agree15330.8
Agree23447.2
Not very agree8817.7
Disagree193.8
Find a way to solve the problemVery agree12124.4
Agree23848.0
Not very agree10922.0
Disagree265.2
Arrange your own timeVery agree13326.8
Agree22745.8
Not very agree10220.6
Disagree336.7
Understand future career developmentVery agree10821.8
Agree21142.5
Not very agree12024.2
Disagree489.7
Parent satisfactionThe child gets along with the teachersVery satisfied15831.9
Satisfied28557.5
Not very satisfied285.6
Dissatisfied61.2
The child gets along with classmatesVery satisfied13427.0
Satisfied26353.0
Not very satisfied6312.7
Dissatisfied173.4
The child participates in school activitiesVery satisfied12124.4
Satisfied28958.3
Not very satisfied448.9
Dissatisfied81.6
The child’s learning progressVery satisfied9018.1
Satisfied30661.7
Not very satisfied6713.5
Dissatisfied173.4
Table 5. Summary of post-school learning outcomes.
Latent VariablesObserved VariablesQuestionsOptionsFrequency%
LearningPostsecondary educationDo you have enough information when choosing a university department?Very enough6616.3
Outcomes Enough20751.2
Not enough368.9
Very not enough61.5
Do you think college life is happy?Very happy11328.0
Happy18846.5
Not happy123.0
Unhappy20.5
Are you satisfied with your learning performance?Very satisfied5714.1
Satisfied20751.2
Not very satisfied4511.1
Dissatisfied61.5
EmploymentAre you satisfied with the salary of the job?Very satisfied71.7
Satisfied297.2
Not very satisfied61.5
Dissatisfied10.2
Do you have any difficulties at work?No difficulty123.0
Not too difficult286.9
Some difficulty20.5
Very difficult10.2
Do you like your current job?Extremely like82.0
Slightly like317.7
Don’t really like41.0
Social adaptationCould you arrange your free time?Definitely yes16139.9
Probably yes17643.6
Probably not5914.6
Definitely not82.0
Could you do housework?Definitely yes18245.0
Probably yes16540.8
Probably not4410.9
Definitely not133.2
Could you manage your money?Definitely yes19147.3
Probably yes17443.1
Probably not317.7
Definitely not82.0
SatisfactionAre you satisfied with your living environment?Very satisfied16340.3
Satisfied22154.7
Not very satisfied194.7
Dissatisfied10.2
Are you happy with your life now?Very happy14435.6
Happy23457.9
Not happy225.4
Unhappy41.0
Are you satisfied with your child’s current living situation?Very satisfied6516.1
Satisfied26966.6
Not very satisfied6014.9
Dissatisfied102.5
Table 6. Summary of regression analysis of in-school outcomes and postsecondary education.
Independent VariablesBSEBβR2∆R2F
Parent satisfaction0.2250.0540.204 ***0.0540.05422.826 ***
Learning performance0.2250.0730.150 **0.0760.0229.469 **
** p < 0.01 *** p < 0.001.
Table 7. Summary of regression analysis of in-school outcomes and employment.
Independent VariablesBSEBβR2∆R2F
Learning performance−0.1980.063−0.155 **0.0240.0229.904 **
** p < 0.01.
Table 8. Summary of regression analysis of in-school outcomes and social adaptation.
Independent VariablesBSEBβR2∆R2F
Parent satisfaction0.1010.0270.184 ***0.0440.04418.459 ***
Problem-solving ability0.0720.0270.133 **0.0610.0177.258 **
** p < 0.01 *** p < 0.001.
Table 9. Summary of regression analysis of in-school outcomes and satisfaction.
Independent VariablesBSEBβR2∆R2F
Parent satisfaction0.1600.0200.363 ***0.1320.13260.742 ***
*** p < 0.001.
Disclaimer/Publisher’s Note: The statements, opinions and data contained in all publications are solely those of the individual author(s) and contributor(s) and not of MDPI and/or the editor(s). MDPI and/or the editor(s) disclaim responsibility for any injury to people or property resulting from any ideas, methods, instructions or products referred to in the content.

