Technical Note

Issues of Bias in Groundwater Quality Data Sets in an Irrigated Floodplain Aquifer of Variable Salinity

by
Barry J. Hibbs
1,*,
Christopher J. Eastoe
2 and
Mercedes Merino
3
1
Department of Geosciences, California State University-Los Angeles, Los Angeles, CA 90032, USA
2
Department of Geosciences, University of Arizona, Tucson, AZ 85721, USA
3
California Department of Transportation, Sacramento, CA 95814, USA
*
Author to whom correspondence should be addressed.
Geosciences 2024, 14(3), 66; https://doi.org/10.3390/geosciences14030066
Submission received: 24 January 2024 / Accepted: 12 February 2024 / Published: 4 March 2024
(This article belongs to the Special Issue Groundwater in Arid and Semiarid Areas II)

Abstract

:
In arid regions characterized by large variations in groundwater salinity, the data derived from irrigation and domestic water supply wells may exhibit bias, reflecting an overall lower salinity than the true aquifer distribution. This bias stems from the decommissioning, non-use, or disrepair of wells that are frequently sources of higher salinity readings, rendering them unavailable for sampling. Baseflow-fed streams, agricultural drains, seeps, springs issuing into agricultural drains, and randomly located test hole samples tend to manifest higher averages and ranges of salinity when compared to supply wells. Agricultural drain flows, springs, and test holes, if sampled following recommended guidelines, are less susceptible to such bias. This study presents a case of groundwater bias identified through an initial water well sampling program in El Paso (Texas, USA). Subsequent rounds of sampling, incorporating drain samples, spring samples, and test hole samples, revealed a more comprehensive understanding of the salinity dynamics. The dataset not only highlights the existence of bias but also provides evidence for a combined geological and agricultural origin of salinity. Additionally, it demonstrates that drain sampling in an earlier study did not accurately depict a primary salinity source due to incomplete analysis of the data. Recommendations are outlined to mitigate bias, emphasizing the importance of sample control from baseflow-fed drains, springs, water wells, and test hole samples. The study also infers the upwelling of saline groundwater from deeper formations in the study area, contributing to a more comprehensive understanding of groundwater salinity dynamics.

1. Introduction

Bias is a prevalent issue in groundwater assessment and analysis, where certain aspects of data acquisition lead to distorted or inaccurate information, failing to represent the true conditions in a groundwater aquifer. The repercussions of bias can be significant when management decisions, remediation strategies, or future monitoring plans are formulated based on skewed data. Various forms of bias are discussed in the groundwater literature, ranging from inaccuracies in interpreting aquifer parameters to issues related to contaminated groundwater sites. For instance, inaccuracies in measurements of transmissivity and hydraulic conductivity may occur during slug tests applied incorrectly [1,2]. Contaminated groundwater sites introduce bias related to well construction materials, sampling procedures, and sample preservation [3,4,5,6,7,8,9,10,11,12,13,14,15,16,17,18,19,20,21]. Other sources of bias include well purging procedures, in which samplers may choose among high purging, low purging or no purging [22,23,24,25,26,27,28], as well as how to monitor aquifers as part of compliance orders in regulatory cleanup and follow-up monitoring [3].
Barcelona et al. [29] emphasized that studies of aquifers can be “fruitless” when biased information is employed. To mitigate bias in groundwater analysis, questions arise regarding the spatial density of required sampling, scheduling for groundwater sampling of trends, and challenges posed by lateral and vertical variation in aquifer parameters caused by lithologic contrasts [30]. The quest to minimize bias is essential for improving the reliability of interpretation in groundwater systems, fostering trust in policy decisions, and reducing unnecessary data collection costs [31].
The roots of bias in groundwater studies date back to instances where well control was insufficient [32,33,34,35,36,37]. These early geoscientists acknowledged bias in their interpretations due to limited data availability. While techniques like surface geophysics, groundwater modeling, and remote sensing have been employed to understand groundwater conditions between well control points, well control remains integral. However, if well control is sparse due to budget constraints, reliance on existing water wells becomes necessary. In some cases, only operational water wells with functional pumps may be sampled, introducing bias because these may produce the highest quality groundwater in an aquifer system.
This paper presents a case study of bias in groundwater salinity in the Rio Grande Aquifer, El Paso Valley in Texas, USA (Figure 1). This aquifer is characterized by large variations in groundwater salinity, often varying spatially by a factor of 5 or more within the main water-bearing strata [38,39]. Bias may arise from sampling only operational water wells, as landowners tend to discontinue wells producing increasingly saline groundwater. This practice results in hydrochemical sampling primarily from wells producing the best quality water, creating a biased impression of overall aquifer salinity. The paper introduces methods to complement conventional well control data, such as drain sampling, spring sampling, and hand-augering shallow well points, which are particularly useful when most irrigation wells are inactive during wet years. Additionally, the paper discusses and re-evaluates the conclusions of Szynkiewicz et al. [40], who found no evidence of a significant geological source of salinity in the Rio Grande Aquifer in the study area, addressing potential bias in their interpretations.

1.1. Imported Project Water Use and Water Well Use in Study Aquifer

The research area encompasses the U.S. segment of the El Paso Valley, from the City of Socorro to Fort Quitman, Texas. Agriculture serves as the primary economic foundation in this region. The international demands for the waters of the Rio Grande Basin and the imperative to develop and manage irrigable lands led to the establishment of the Rio Grande Project in 1938. Administered by the United States Bureau of Reclamation, this project provides water from the Rio Grande to water-rights-holders situated between Elephant Butte Reservoir, New Mexico, and the El Paso–Hudspeth County line (Figure 1 and Figure 2). The surface water system in the Rio Grande, along with the associated ditches and drains, was designed for the distribution of “project water” and the removal of agricultural drain water return flows (see Supplementary Materials for further details).
El Paso County Water Improvement District No. 1 (EPCWID1) caters to farms in the lower El Paso Valley, Texas (area 1 in Figure 2). The Hudspeth County Conservation and Reclamation District No. 1 (HCCRD1, area 3 in Figure 2) oversees irrigation canals and drainage ditches for farms in the El Paso Valley below the El Paso–Hudspeth County line [42,43]. Notably, Hudspeth County does not have entitlement to the raw delivery water from the Rio Grande Project but receives waste flow and drainwater return flows [43,44]. Groundwater pumping from the Rio Grande Aquifer becomes the prevalent source of irrigation water during drought years, supplementing water from the Rio Grande (Supplementary Materials).
Although groundwater pumping from the Rio Grande Aquifer exhibits high variability over time, Alvarez and Buckner [38] emphasized its critical role by stating, “since 1951, and during several years, groundwater has supplied virtually all of the irrigation water requirements of the (El Paso) Valley and has been the survival factor for its agriculture”. The use of water wells for irrigation of the Rio Grande floodplain in the study area was sporadic from the 1980s until 2003, increased from 2004 to 2008, and has varied since then, with limited pumping observed during several field trips to the study area since 2010. Additional details on water availability and use in the study area are provided in the Supplementary Materials.

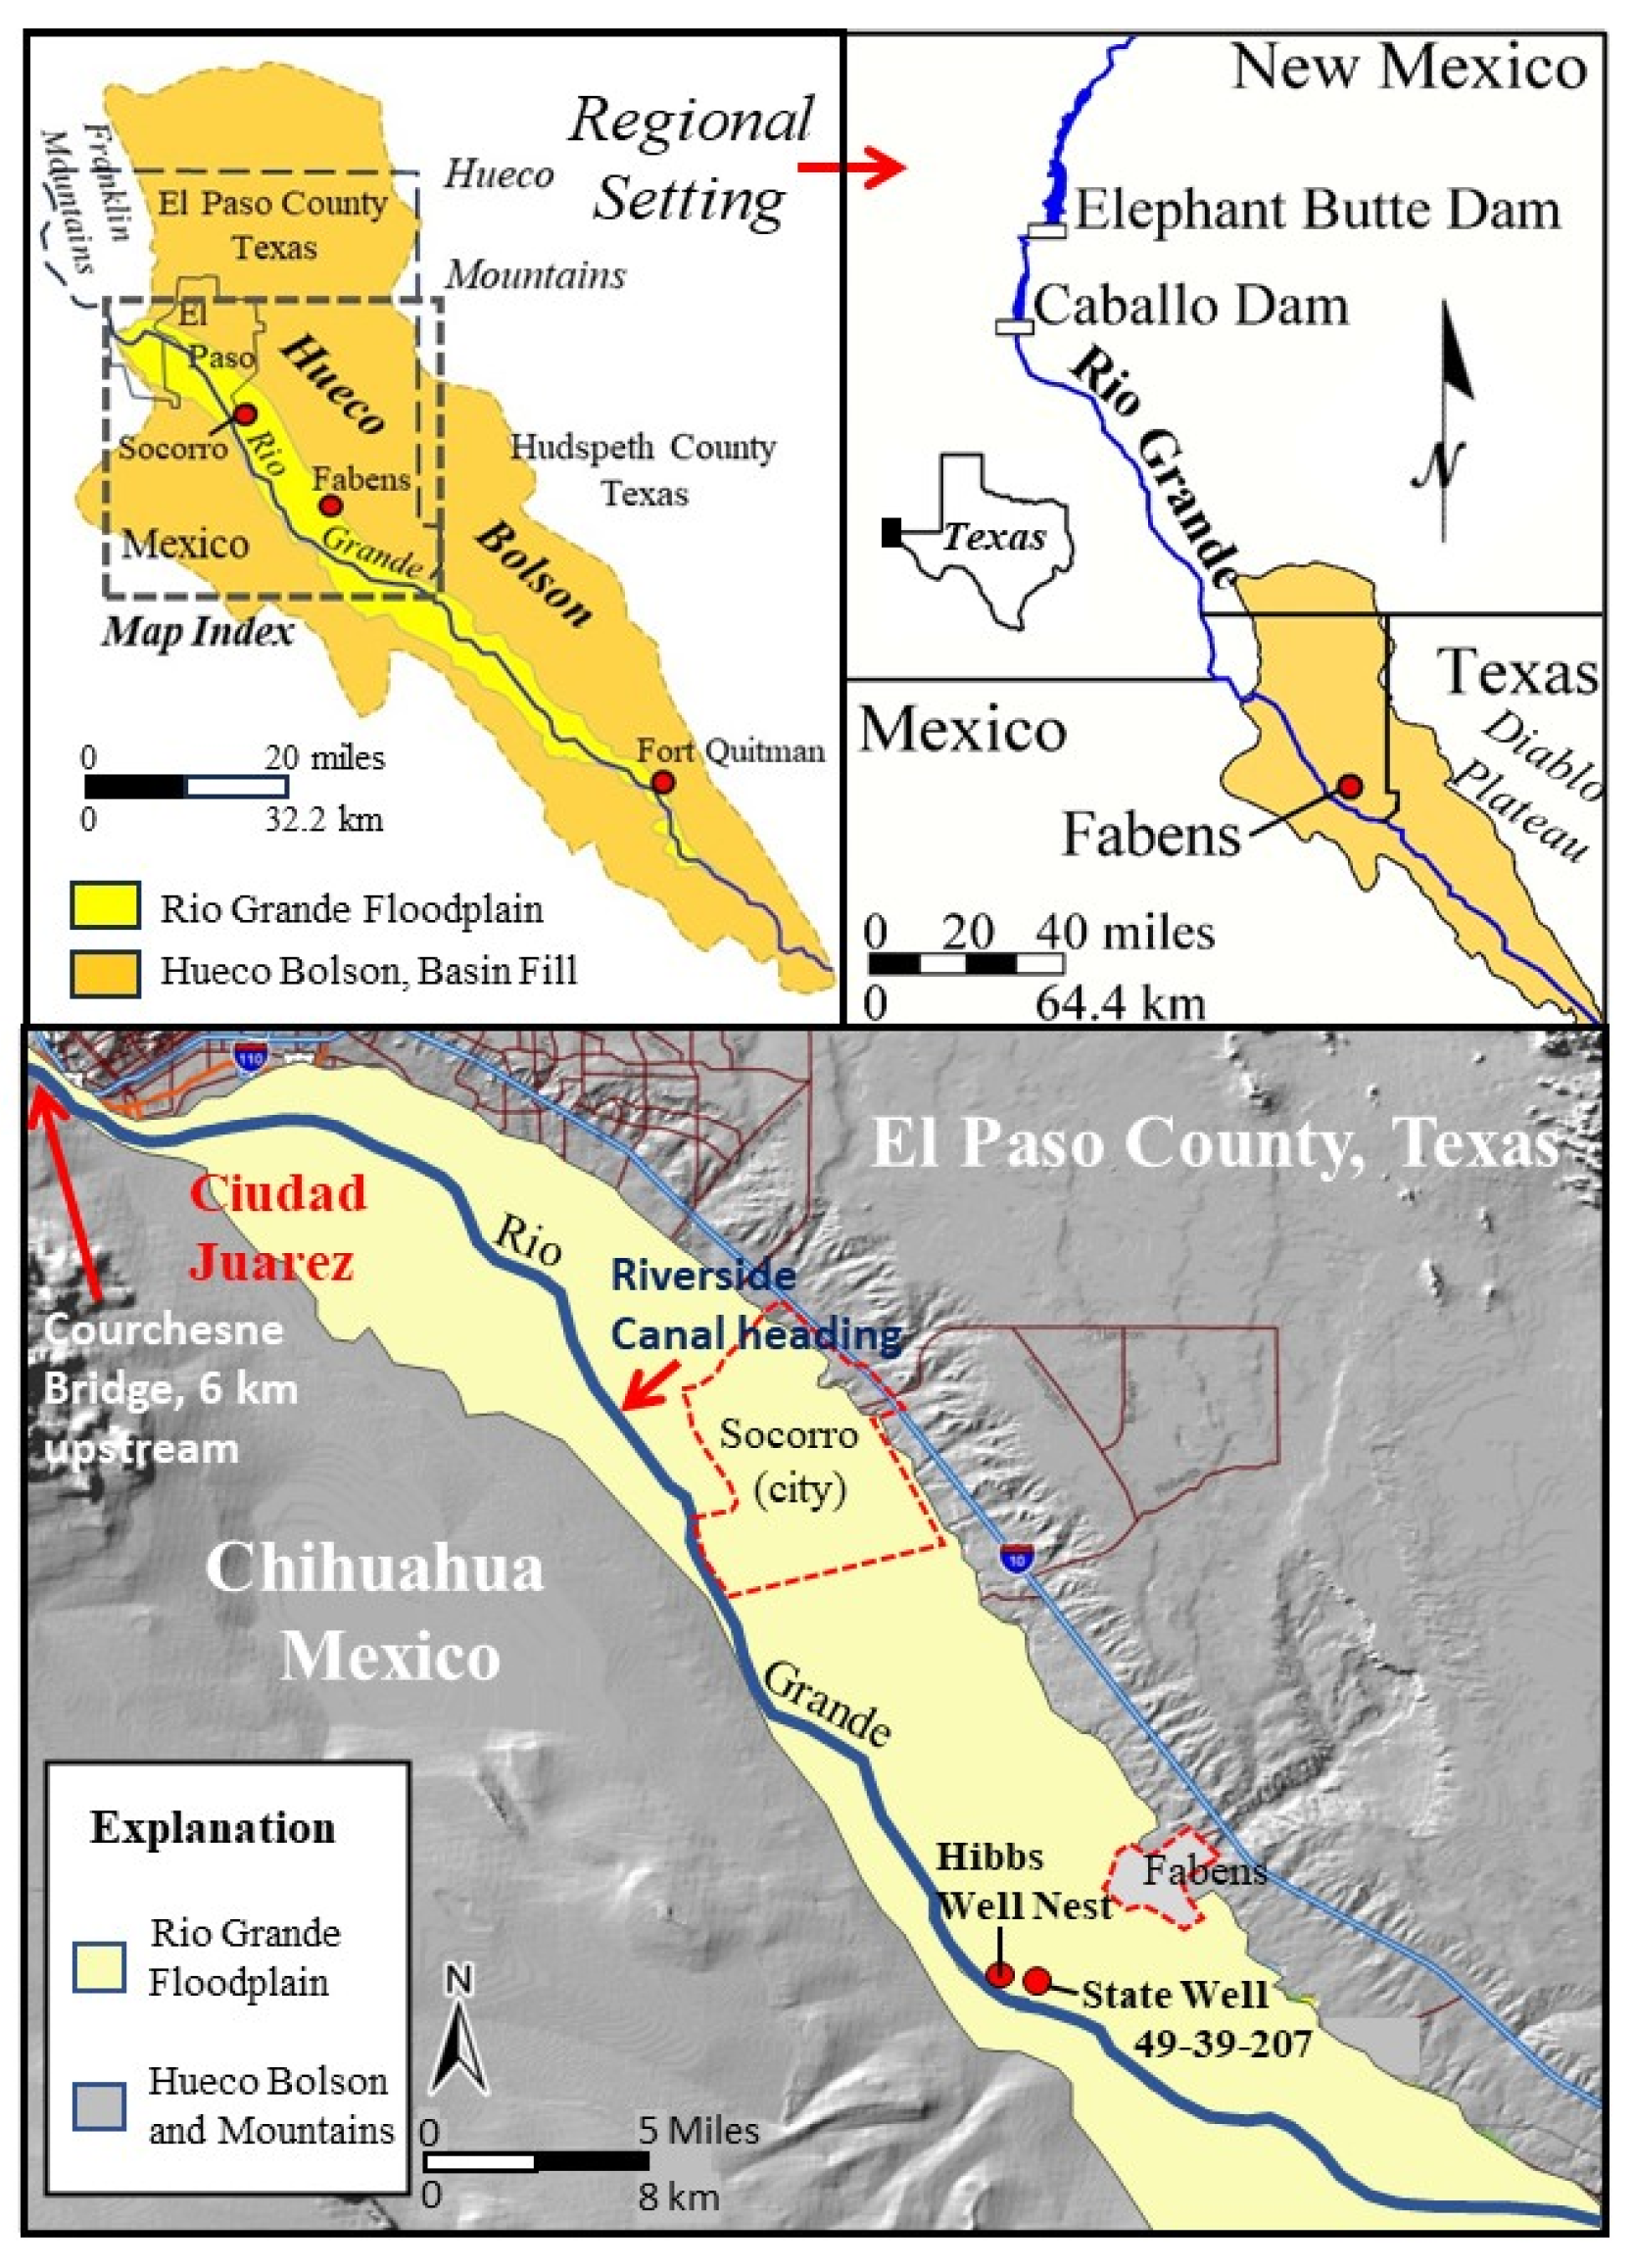
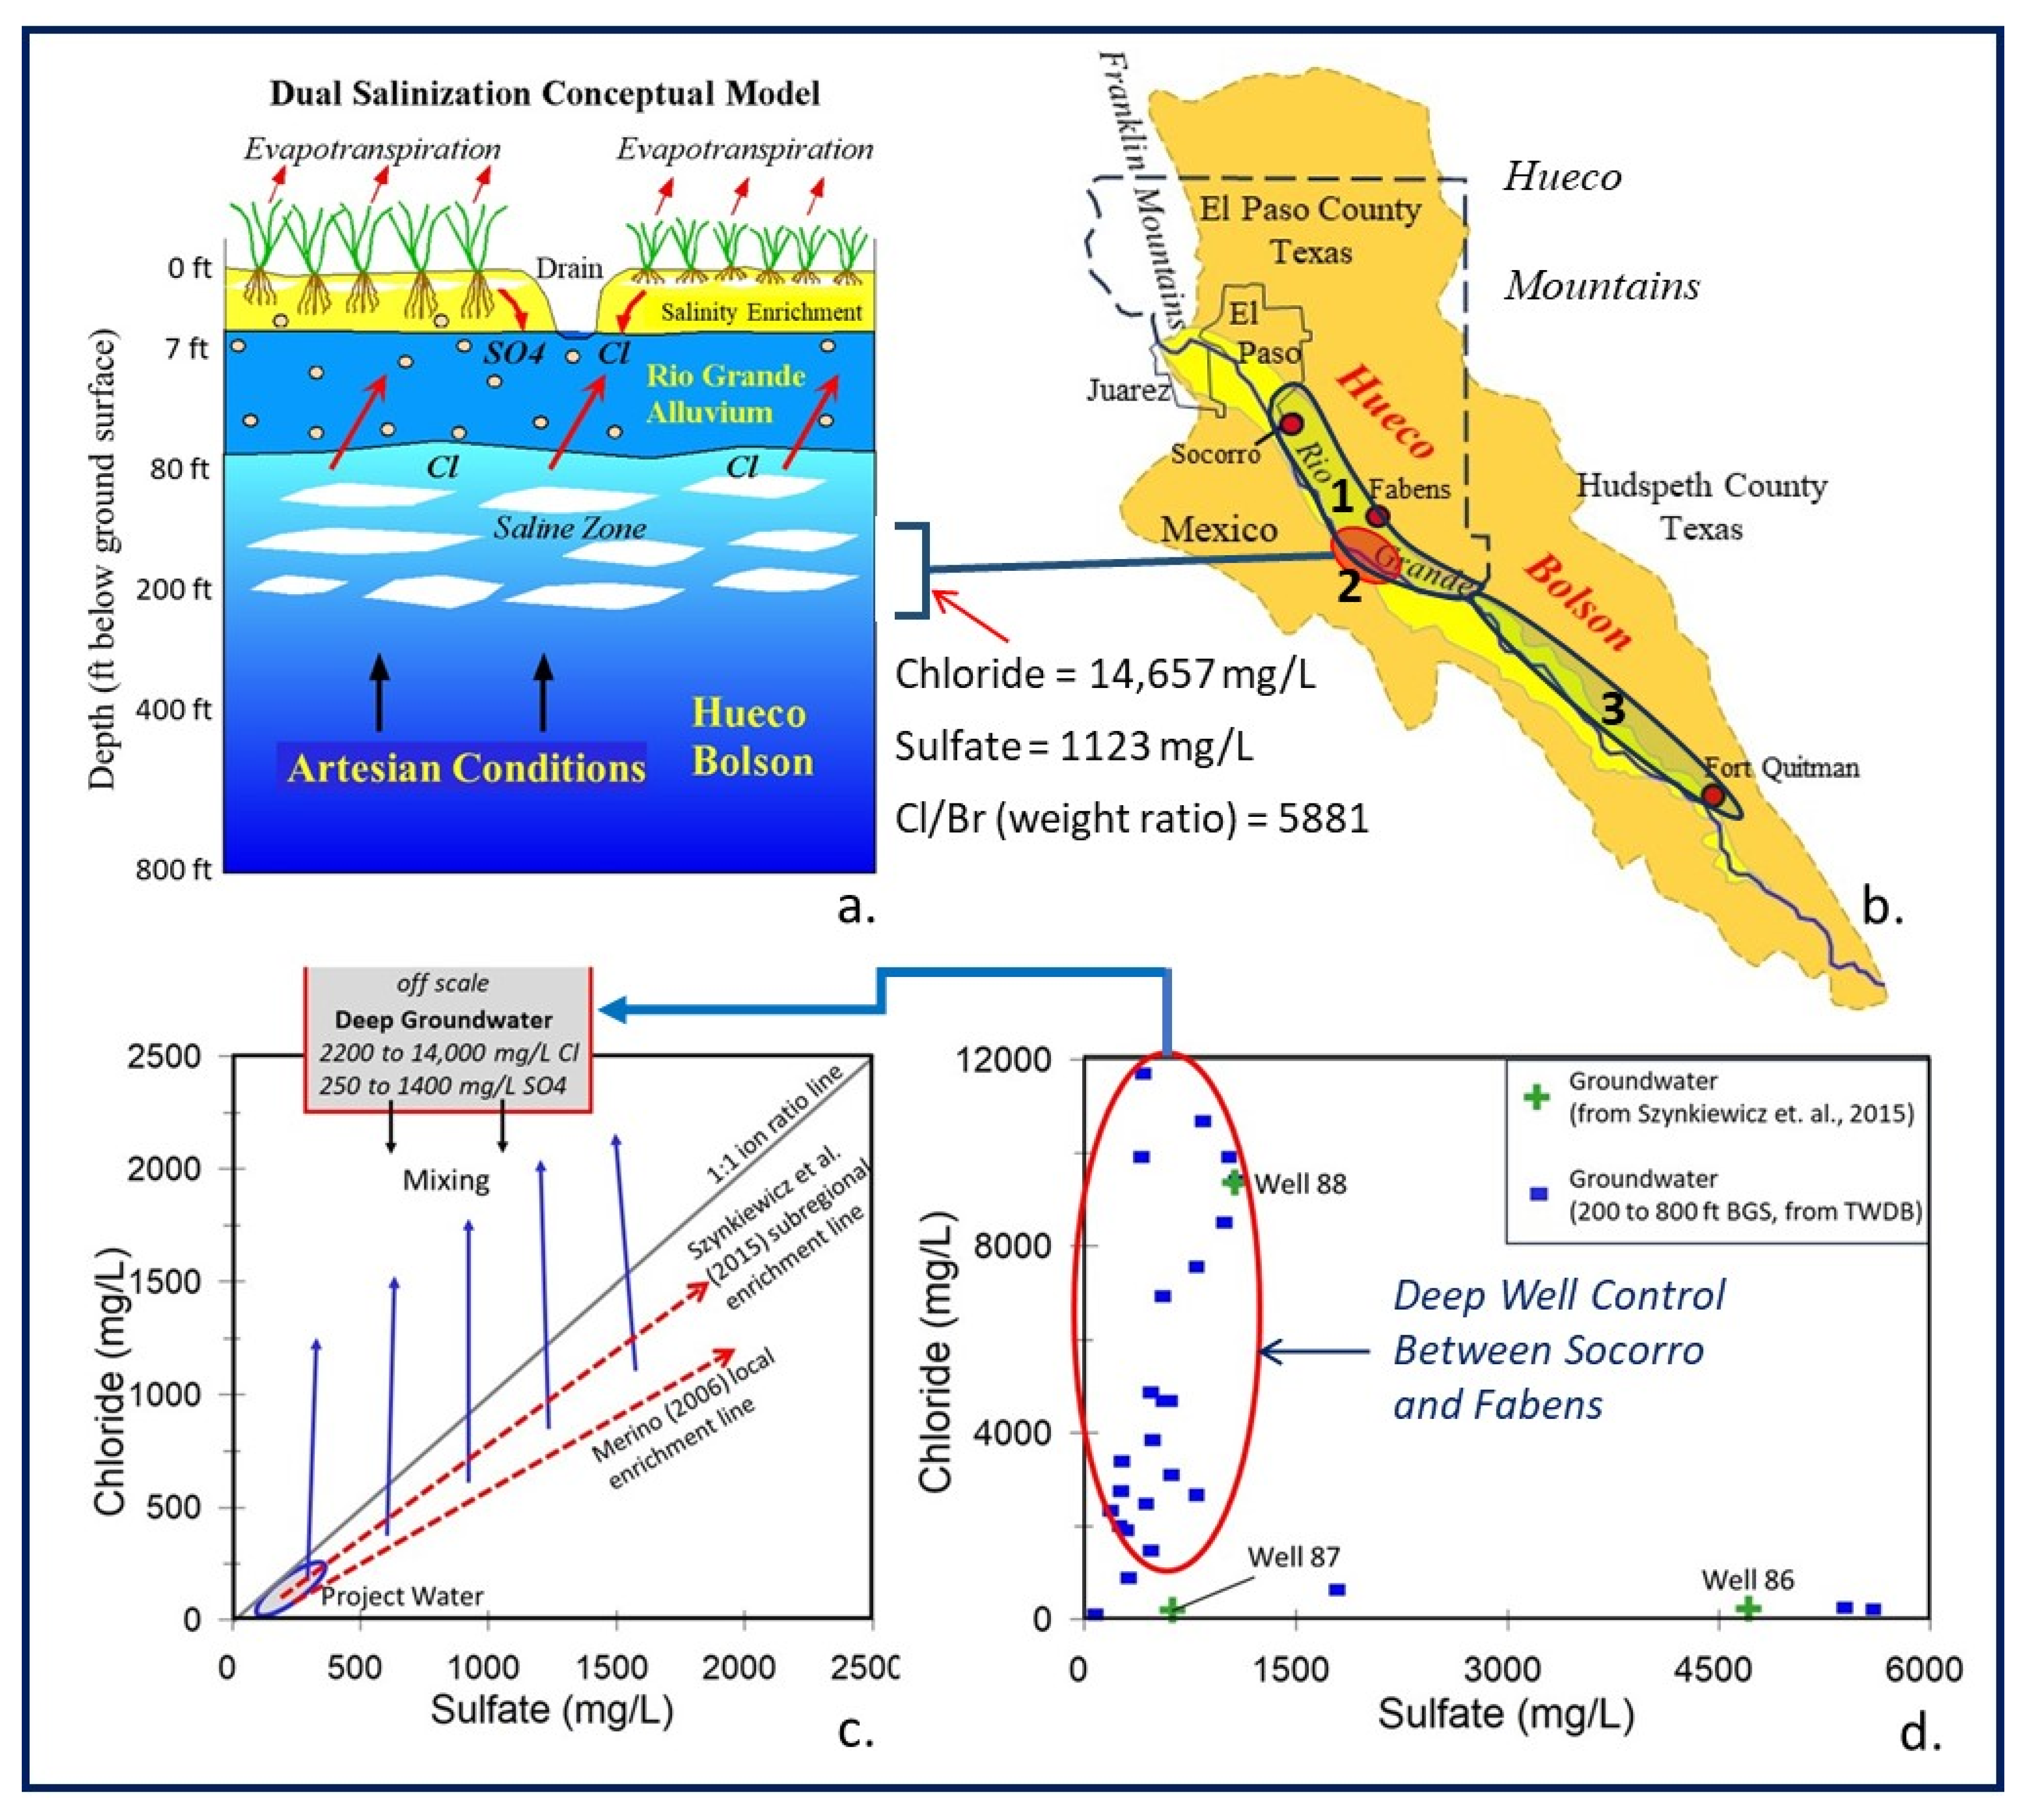
1.2. Geology, Hydrogeology, and Regional Salinity Profile in Study Area

The study focuses on the Rio Grande Aquifer within the “El Paso-Juárez Valley,” specifically where the Rio Grande flows across a broad alluvial floodplain (Figure 1, Figure 2 and Figure 3). The term “modern Rio Grande floodplain” refers to the current surface across which the Rio Grande flows, while floodplains formed by ancestral versions of the Rio Grande are now part of the regional Hueco Bolson Aquifer (orange area of Figure 1). The Rio Grande alluvium, consisting of basal-channel floodplain deposits of late Quaternary (~15 ka to modern) age, averages about 65 to 85 feet (20–26 m) in thickness (Hawley, written communication, 2021 [45]). The Rio Grande Aquifer has been variably described as 150 to 250 feet (46–76 m) thick due to challenges in distinguishing it from similar deposits of the Ancestral Rio Grande of Early Pleistocene age [38,46].
The geology and hydrogeology basics relevant to bias in the paper are summarized. More extensive details and a lithologic section are included in the Supplementary Materials. The Pliocene to early Pleistocene Camp Rice Formation, beneath the Rio Grande alluvium, is the main water-bearing formation of the Hueco Bolson Aquifer, consisting of gravels, sands, muds, volcanic ash, and caliche formed by ancestral Rio Grande channels. Beneath the Camp Rice Formation is the Fort Hancock Formation, of minimal practical importance as a water supply aquifer, with lacustrine muds, evaporites, bentonitic claystone, siltstone, and discontinuous sand lenses ([47]; see Supplementary Materials). A buried saline, phreatic playa unit identified by Hibbs and Merino (2006) [41] is syn-depositional with the latest Camp Rice deposits and lies locally beneath the Rio Grande alluvium (Figure 2). Vadose zone thickness above the Rio Grande Aquifer is typically 7 to 30 feet (2.1 to 9.1 m). Hydraulic interaction exists between the Rio Grande Aquifer and the deeper Hueco Bolson Aquifer, as documented by Hibbs (1998), Hibbs and Boghici (1998), Heywood and Yager (2003); Hutchison and Hibbs (2008); and Eastoe et al. (2010) [39,48,49,50,51]. Fluid exchange occurs between the Hueco Bolson Aquifer, Rio Grande Aquifer, Rio Grande, and agricultural drains [39,50].
During the project, the “Hibbs Well Nest” (Figure 1 and Figure 3) was installed in the upper confining unit of the Fabens Artesian Zone (labeled 2 in Figure 2); it helped show that there is a saline groundwater source contaminating shallow alluvial groundwater and river water in the Fabens–Tornillo area (Figure 1 and Figure 3). An artesian aquifer exists at this site (1300 to 1800 ft; [396 to 548.5 m] deep) and is penetrated by State Well 49-39-207 (Figure 1 and Supplementary Materials) [41,46,52]. Groundwater flows from the artesian aquifer through a thick confining or semi-confining unit into the Rio Grande Aquifer (Figure 2a). Three individually drilled wells spaced several feet apart at Hibbs Well Nest had screens set at 150 to 250 ft (45.5 to 76 m), 350 to 450 ft (107 to 137 m), and 650 to 750 ft (198 to 229 m) below ground surface (BGS). The shallowest well produces highly saline groundwater from the 150 to 250 ft (46 to 76 m) interval, immediately below the Rio Grande Aquifer. This groundwater has an extremely high chloride content of 14,657 mg/L, a Cl/Br weight ratio of 5881, and a sulfate concentration of 1123 mg/L (Figure 2). The Cl/Br weight ratio and high Cl indicate the dissolution of evaporitic halite from the phreatic playa deposit. Dissolution of evaporitic halite is indicated when Cl/Br weight ratios in water samples exceed ~950 (Holser, 1979; Davis et al., 1998; Alcalá and Custodio, 2008) [53,54,55] attributed to bromide’s preferential exclusion from the halite lattice. When halite dissolves in water, Cl/Br ratios consequently increase due to the enrichment of chloride in halite. Rio Grande project water entering the El Paso Narrows typically has a much lower Cl/Br weight ratio, between 500 and 550 [56]. The two deeper wells at Hibbs Well Nest are much more dilute and produce groundwater with less than 30% of the salinity of the shallow well. The two deeper wells produce sulfate-dominated groundwater, indicative of evaporitic gypsum dissolution (see the Supplementary Materials).

2. Methods

Historical data in the study area were sourced from the public groundwater database maintained by the Texas Water Development Board (TWDB). This database represents the most comprehensive record in the region, primarily encompassing data collected during the 1950s to 1970s. The focus of these data is mainly on the Rio Grande Aquifer and the underlying Hueco Bolson Aquifer. Groundwater is rarely extracted from the Hueco Bolson Aquifer in the highly saline zone beneath the Rio Grande Aquifer downstream of Socorro, and changes over time in the deeper aquifer tend to be negligible (Figure 2d). Data retrieved from the database include groundwater quality data from the early 1960s to the early 1970s. TWDB flags well records for which cation-anion imbalance exceeds 5%. Data lacking acceptable cation–anion balance were excluded from our analysis. In cases where incomplete data sets were listed in the TWDB database, such as reports of anions only, the data were cross-checked against specific conductance measurements as a semi-quantitative means of evaluating reliability (see the Supplementary Materials).
More recent water samples collected for the analysis of possible groundwater salinity bias are documented in Dadakis (2004), Hibbs and Merino (2006), Merino (2006), Hibbs and Merino (2020) and Eastoe et al. (2022) [41,57,58,59,60], and in our other unpublished data developed during sampling campaigns between 2003 and 2022. These samples were collected from water wells, springs, agricultural drains, and the Rio Grande. Prior to sampling groundwater wells, stagnant water was purged from the wells, with a minimum of at least three casing volumes of water purged before sampling. Wells with dedicated pumps were purged by sampling when pumping continuously, or by turning the pumps on for the necessary period to evacuate at least three casing volumes. Wells without dedicated pumps were purged, and samples were collected using Grundfos pumps, Whaler pumps, or bailers.
Groundwater samples were collected for general minerals and halides, stable water isotopes, sulfur isotopes, tritium, carbon-14, and chlorine-36. Only results of general minerals and halides are presented in this paper due to their sufficiency in presenting arguments about bias. General minerals and halides collected from 2003 to 2010 were analyzed by Ion Chromatograph in the SAHRA Hydrochemical Laboratory at the University of Arizona following EPA Method 300.1 [61]. General minerals and halides collected in 2018 and 2022 were analyzed by Ion Chromatograph by Isobrine Solutions of Edmonton, Alberta, Canada, following a modification of EPA Method 300.1.

3. Results and Discussion

3.1. Development of Bias Hypothesis Based on Comparison of Water Well Data in 1960 to 1975 and 2003 Data Sets

Historic data collected from the Rio Grande Aquifer in the study area from 1960 to 1975 are plotted (Figure 3), with samples distinguished by location: upstream of Fabens (Socorro to the Fabens Artesian Zone), or downstream of Fabens (the Fabens Artesian Zone to Fort Quitman). The Artesian Zone where salinity infusion occurs between Fabens and Tornillo is omitted in order to emphasize the distinction between the upstream and downstream zones; it shows comingled characteristics of both zones. The data were mostly collected from irrigation wells screened within the interval 20 to 200 feet (6.1 to 60.1 m) BGS, with most screens between 20 and 100 feet (6.1 to 33.2 m) BGS. Above the Fabens Artesian Zone, most of these data follow the sulfate vs. chloride enrichment lines of Merino (2006) and Szynkiewicz et al. (2015) [40,58] for which sulfate is the dominant anion by weight. Note, however, that a few samples plot on or above the 1:1 weight ratio line (Figure 3). From the Fabens Artesian Zone to Fort Quitman, chloride becomes the dominant anion by weight in many samples. The shift in Cl/SO4 weight ratios occurs mainly below the Fabens Artesian Zone and is accompanied by a general increase in salinity. About half of the samples below the Fabens Artesian Zone contain chloride or sulfate concentrations above 1000 mg/L, whereas almost all of the samples above the Fabens Artesian Zone have concentrations of less than 1000 mg/L for each anion. The change near the Fabens Artesian Zone coincides spatially with the appearance of saline artesian water in the Rio Grande Aquifer [41] (Figure 2).
In the summer of 2003, we collected 30 groundwater samples distributed across the alluvial floodplain between the City of Socorro and Fort Quitman to compare to earlier data (Figure 4). Most wells constructed from the 1950s to 1970s were inactive in summer 2003. Believing this number of groundwater samples was adequate for a narrow floodplain aquifer this size, the task was considered complete. From the 2003 dataset, it was apparent that the samples in the Rio Grande Aquifer were more dilute than found in historical studies [38,62]. The groundwater data set collected in 2003 [57], though sparser than the 1960 to 1975 data set, contains very few samples with chloride or sulfate concentrations above 1000 mg/L (Figure 4). TWDB samples were collected primarily from irrigation wells, and a few from stock, domestic, public supply, and test wells. Dadakis’s (2004) [57] samples are from a combination of irrigation, domestic, and public supply wells. Samples above the Fabens Artesian Zone are similar to the historic TWDB samples, plotting near Cl/SO4 = 1 at low salinities, but between the project water enrichment lines of Figure 4 at higher salinities. About half the samples downstream of the Fabens Artesian Zone plot above the 1:1 line, but are of usually of lower salinity. A clear difference is apparent between the 1960–1975 and 2003 data sets, especially in samples collected downstream of the Fabens Artesian Zone (compare graphs in Figure 3 and Figure 4).
Based on these findings, two hypotheses were developed for contrasting salinity in data sets: (1) salinity of the Rio Grande Aquifer changed significantly between the 1960s–1970s and 2003; or (2) well sampling produced unrealistically low salinity in the 2003 data set. The difference between historical and 2003 data was so profound we began to speculate that the 2003 results were biased towards low salinities and were therefore unrepresentative of bulk salinity in the aquifer. The limited number of wells available for sampling in 2003 produced relatively high-quality groundwater from the Rio Grande Aquifer, whereas wells that produced saline groundwater remained inactive. It would be most problematic to conclude that the quality of the groundwater Rio Grande Aquifer had improved considerably by 2003 if the data are biased and follow hypothesis 2. Further work was considered essential in order to evaluate these hypotheses and the potential for bias.

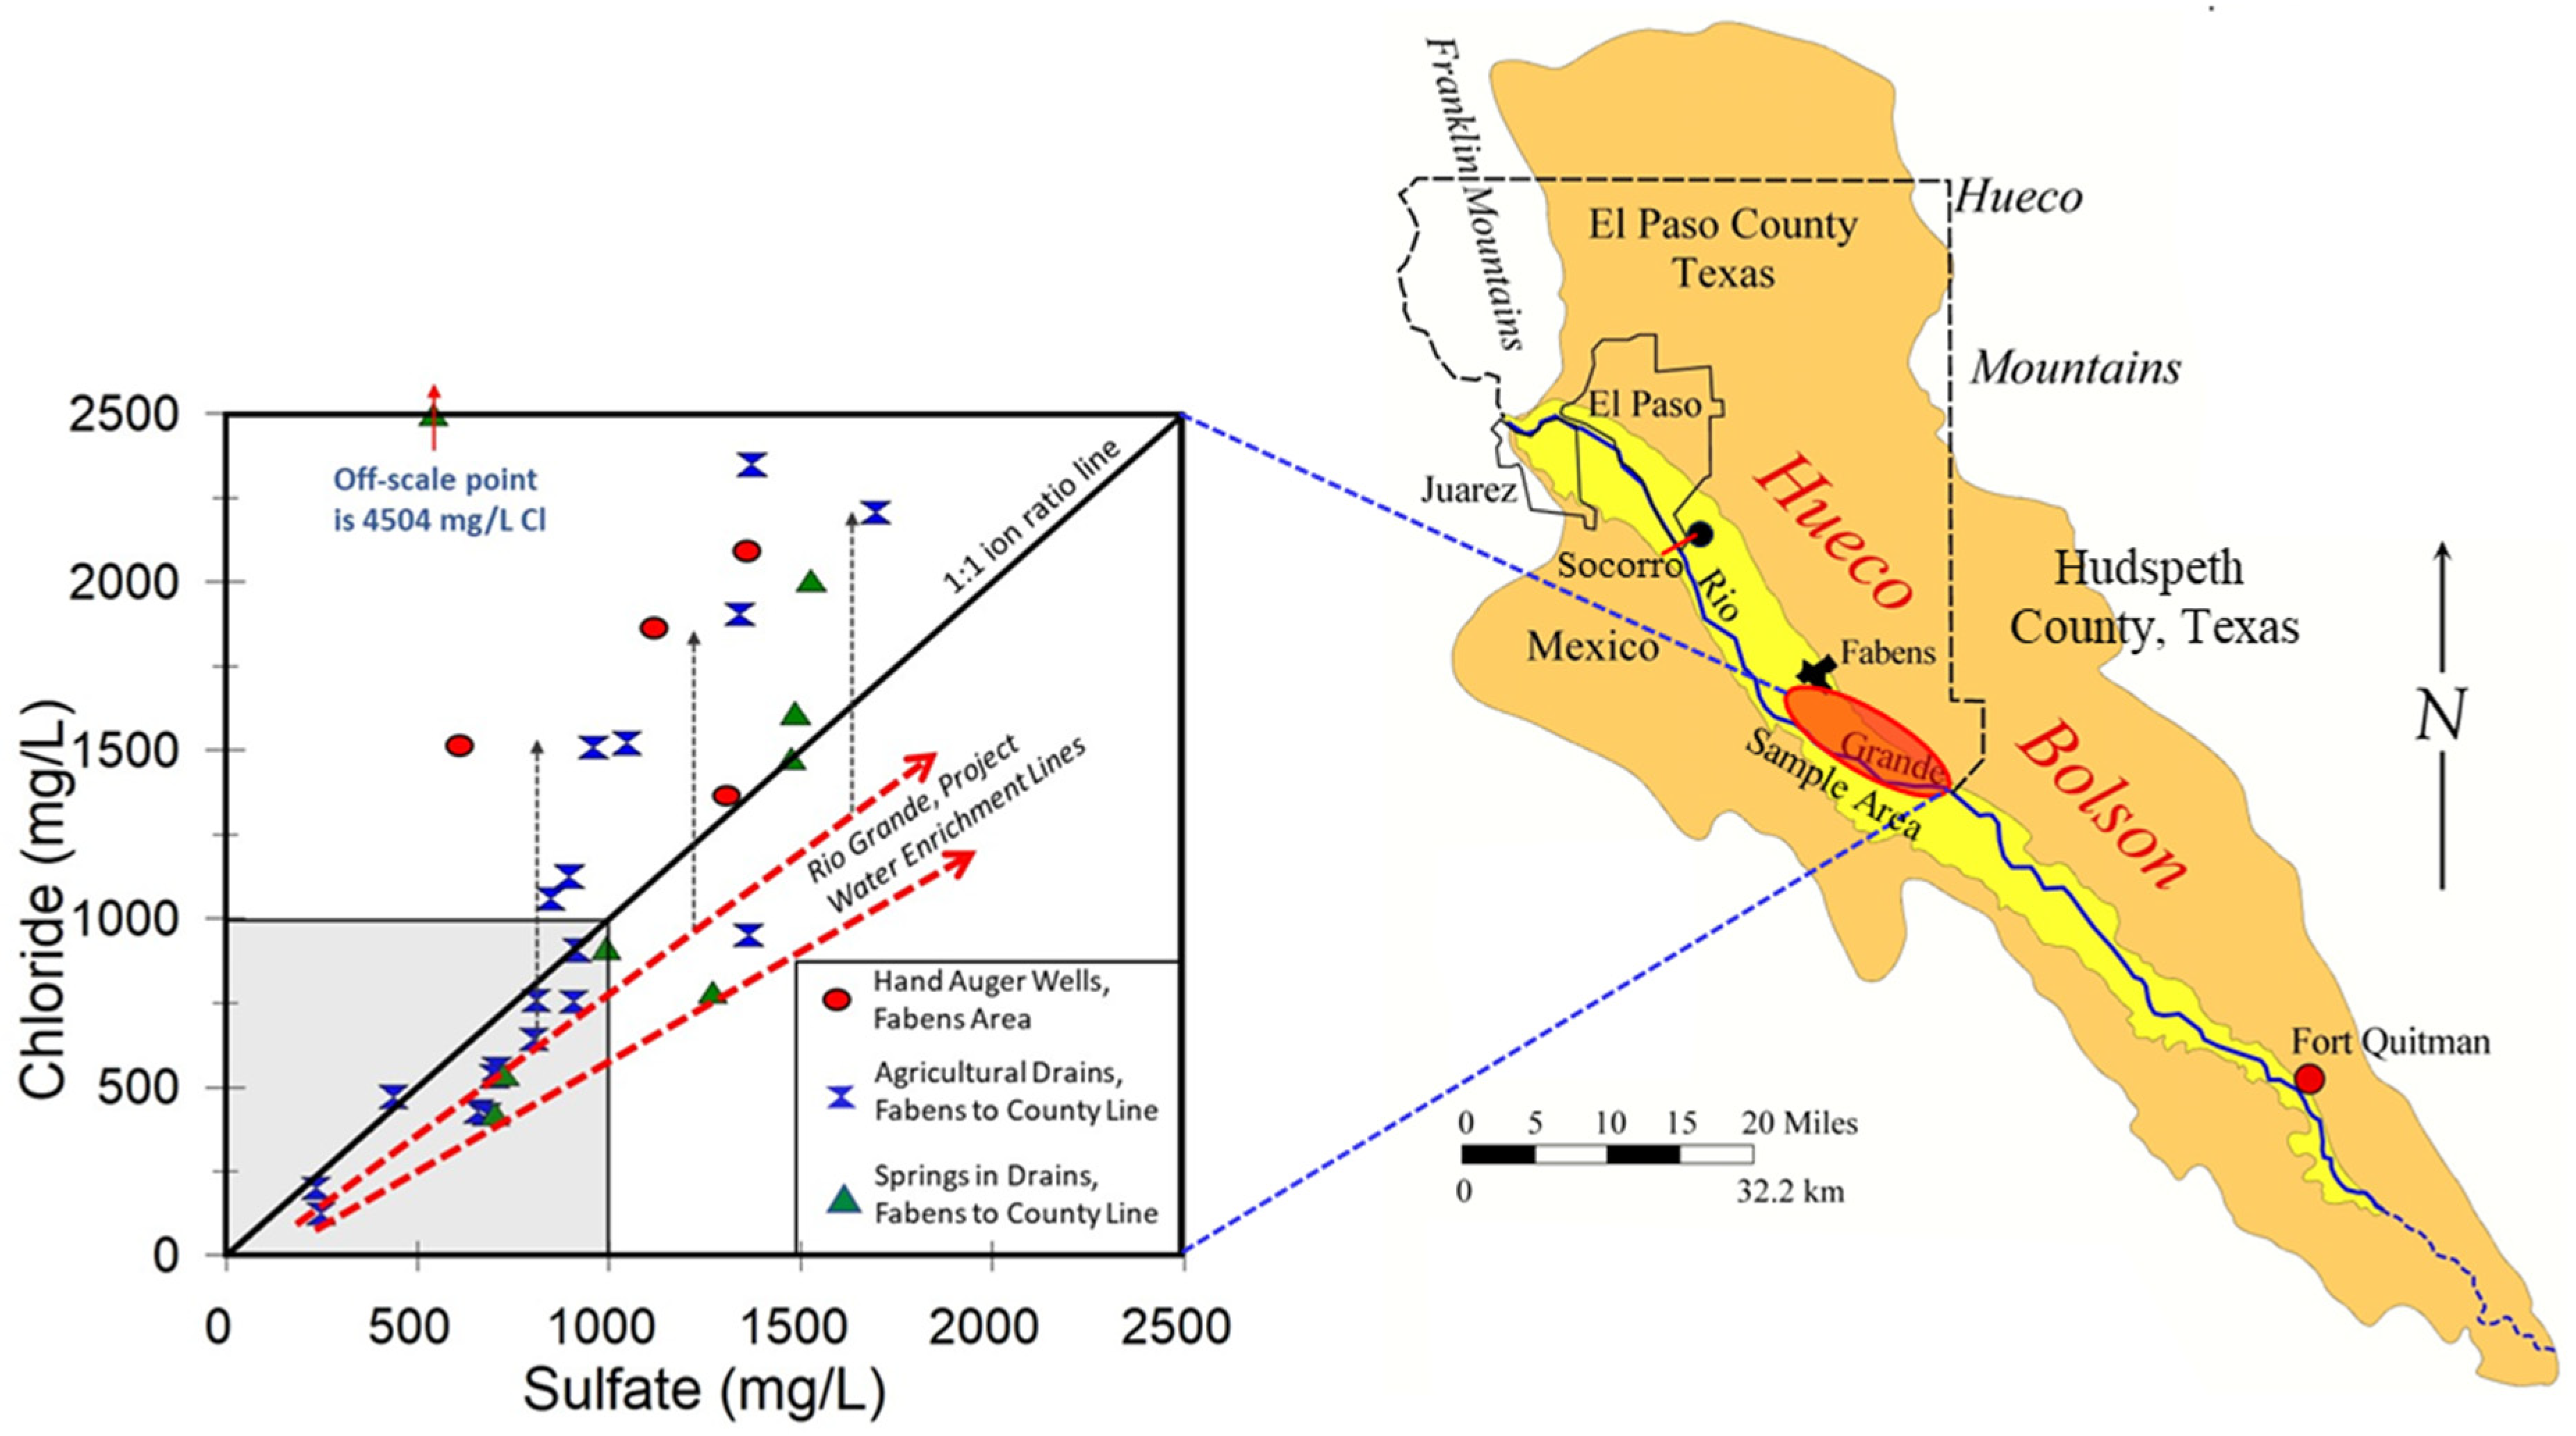
3.2. Bias Testing through Local Sampling of Agricultural Drains, Springs, and Hand-Auger Wells (2003–2006)

To evaluate our working hypothesis and potential bias in the 2003 data set, additional data were collected between late 2003 and 2006. The additional data represent a variety of samples obtained from agricultural drain flows, springs emerging from the sides of drains, and hand-auger wells within the subarea between Fabens and the El Paso/Hudspeth County line (Figure 5). The salinities of drain flows, springs, and hand-auger well samples are notably higher than those observed in the 2003 groundwater well dataset (compare Figure 4 and Figure 5). Over half of the drain and spring samples indicate concentrations exceeding 1000 mg/L for both Cl and SO4 (Figure 5). Generally, these samples exhibit higher sulfate concentrations than all groundwater well samples, with overall salinity typically surpassing what was found in the 2003 groundwater well samples (Figure 4 and Figure 5). Drain flows and springs tend to align with the Rio Grande project water enrichment lines at lower salinities but deviate upwards at higher salinities, with most samples plotting above the 1:1 Cl/SO4 weight ratio line (Figure 5).
The installation of hand-auger wells and the placement of permanent or temporary well points offer a viable method for supplementing groundwater data. In 2004, a few hand-auger water wells were installed in the Fabens area of the Rio Grande Aquifer. The material penetrated in the vadose zone at this location is less than 15 feet (4.6 meters) thick and consists mainly of medium to fine sand with occasional clay stringers. All groundwater samples from hand-auger wells exhibited Cl/SO4 weight ratios greater than 1.0, and chloride and sulfate concentrations exceeded 1000 mg/L (Figure 5), markedly higher than those found in nearly all groundwater samples collected during the 2003 regional study (compare to Figure 4). Note that hand-auger data are biased due to the collection of all samples within a 4.1 square mile (10.6 km2) area near the saline source detected at the Hibbs Well Nest (Figure 2, Figure 3 and Figure 4). Hand-auger samples were collected near the water table, where any salts in the vadose zone first reach the water table when wetting fronts move vertically downward. Water isotope data from hand-auger wells indicate that salinity does not increase due to evaporation [58]. Despite the spatial bias in these few hand-auger samples, they remain useful as they contribute to an understanding of the salinity of the Rio Grande Aquifer. Hand-installed test holes, feasible where sediments allow hand augering, offer excellent control but are limited to groundwater at and just below the water table, which presents a vertical bias. The spatial area represented by these samples is limited compared to areas covered by the 1960–1975 and 2003 sampling (Figure 3 and Figure 4) but the overall salinity of these samples is much higher than found in the 2003 well sampling (compare Figure 4 and Figure 5).

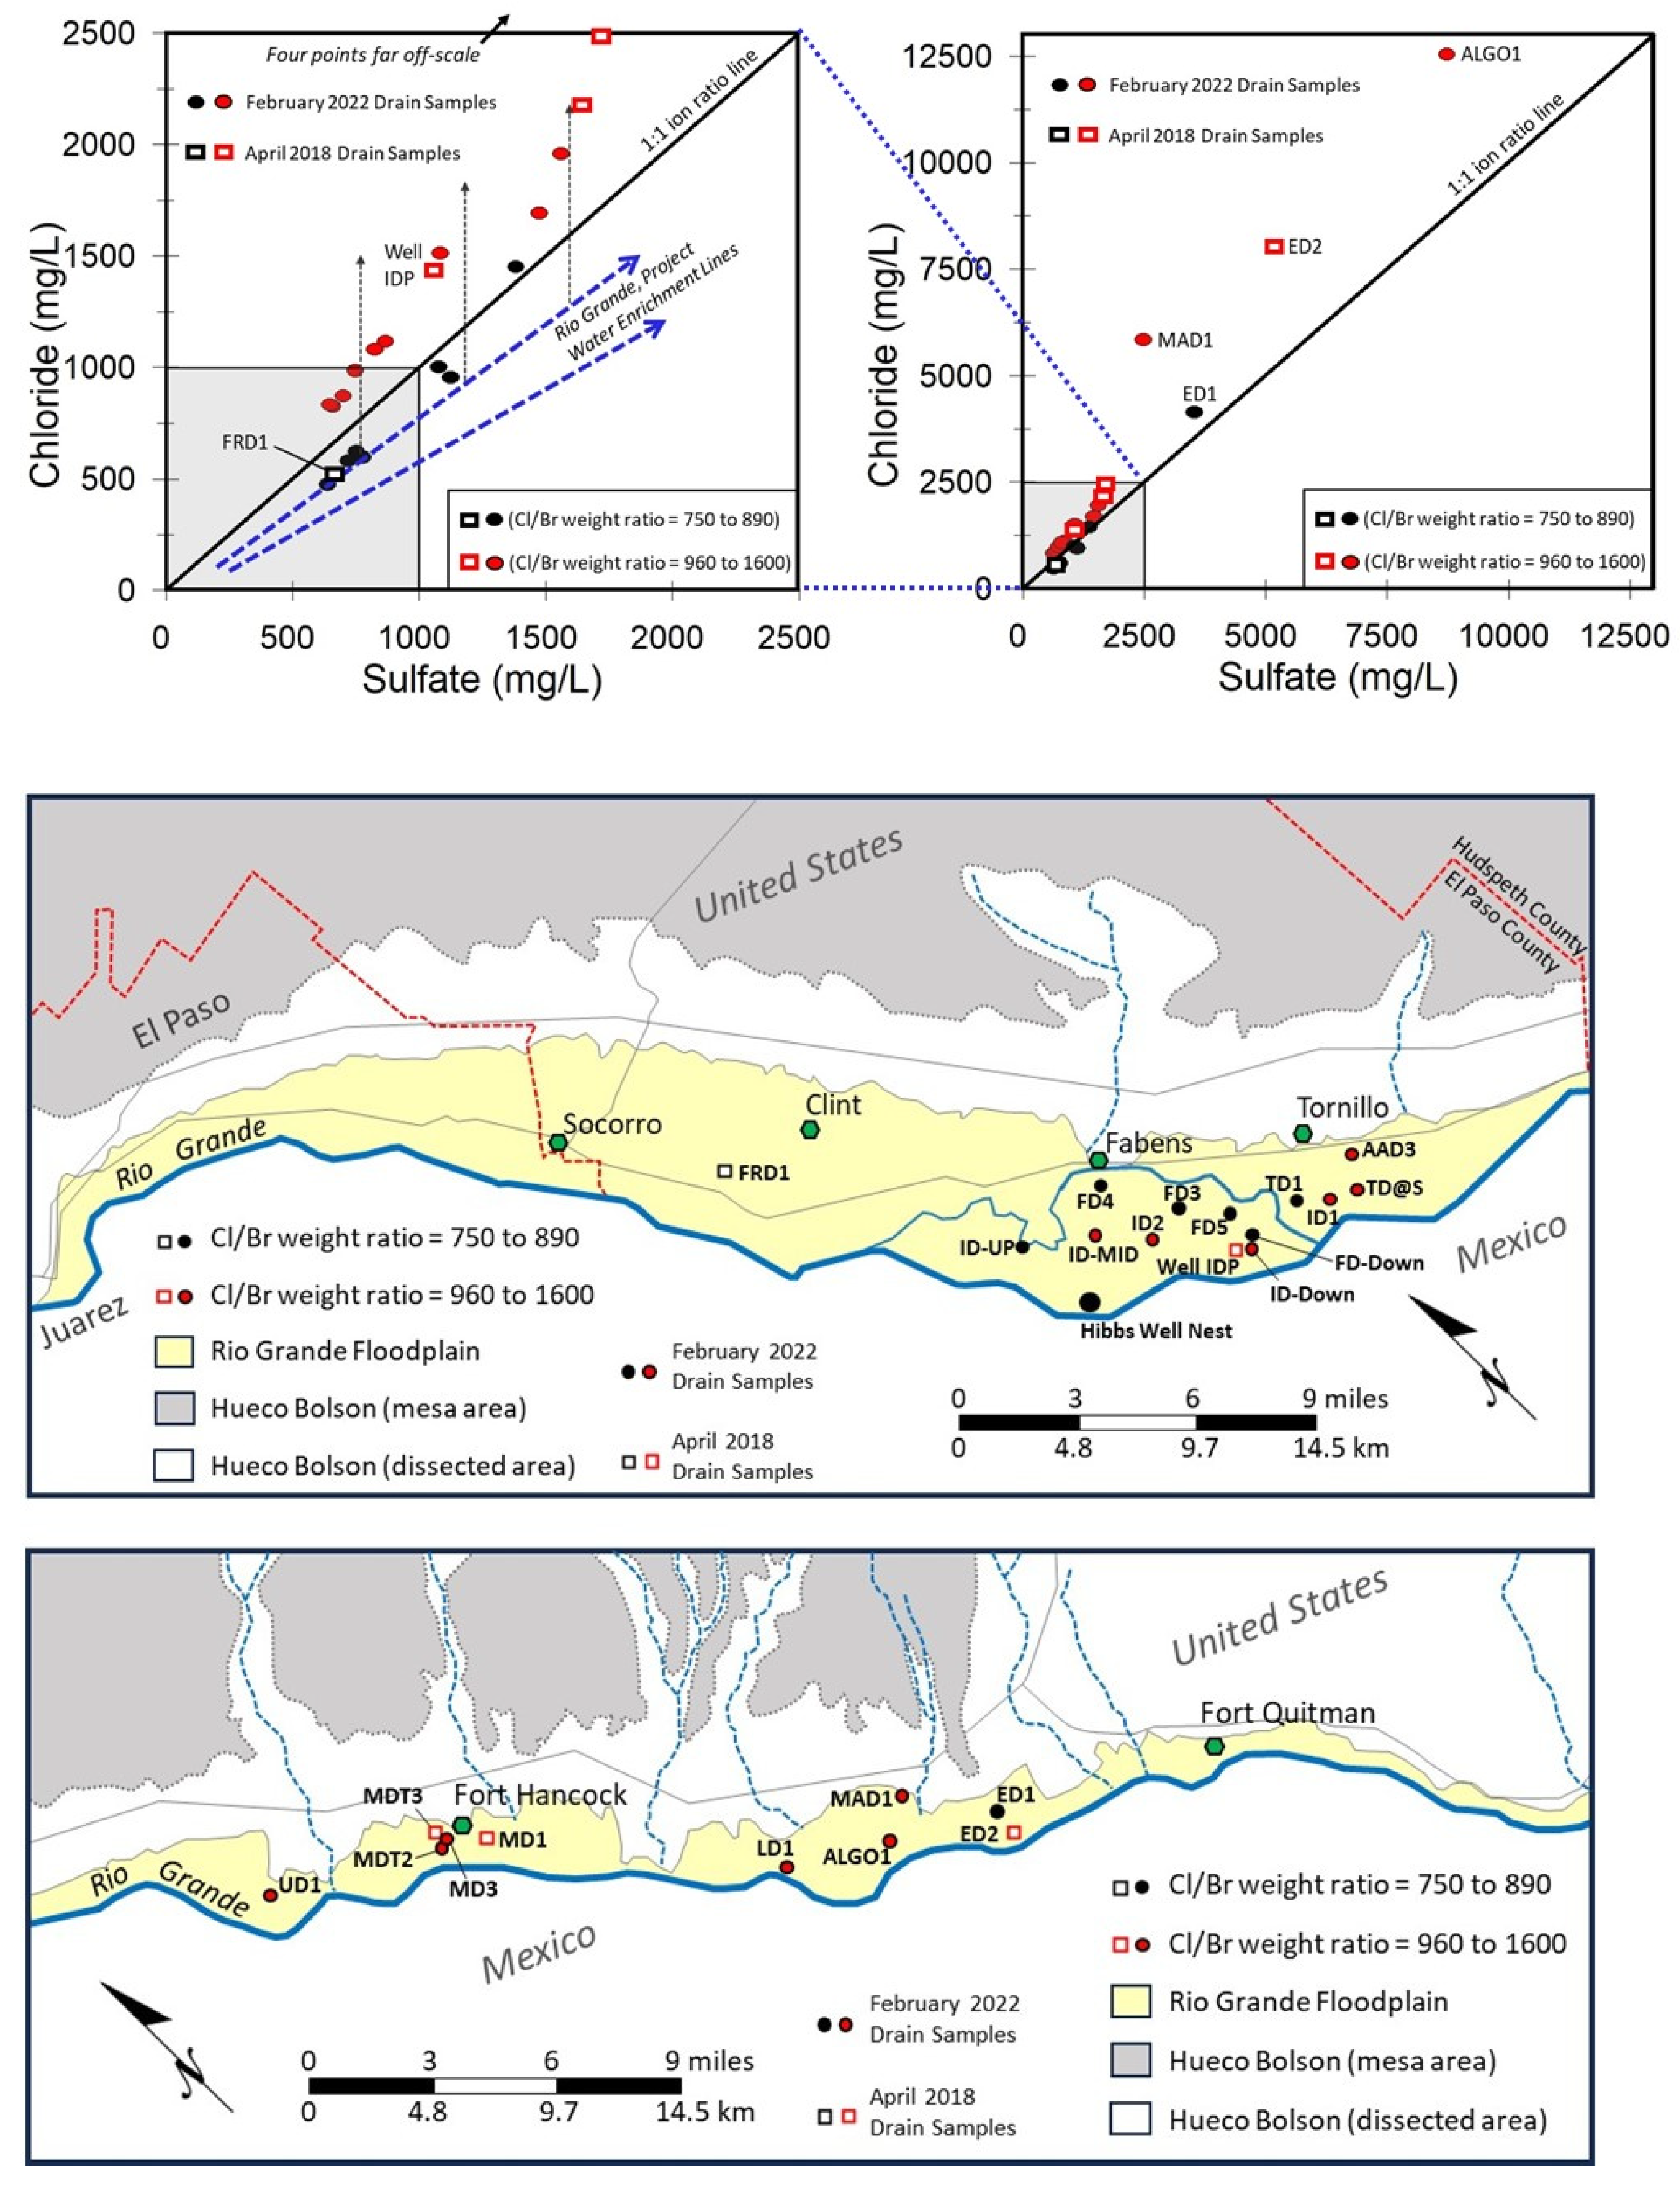
3.3. Sampling of Agricultural Drains for Regional Analysis of Bias—2018 and 2022

To further investigate the bias hypothesis, additional sampling was conducted in April 2018 and February 2022, expanding groundwater analysis into Hudspeth County and providing more contemporary data. This dataset focuses on the Fabens Artesian Zone but extends into Hudspeth County (Figure 6). One sample, FRD1, is from the area above Fabens. Samples were collected from drains, with the exception of Well IDP, where several samples were collected from a large-diameter well casing reaching 50 ft (15.2 m) total depth alongside Island Drain (Figure 6 and Figure 7). Bromide was added to the dataset to distinguish halite dissolution signatures from agricultural salinity.
The samples with lower Cl/Br ratios under 900 (black symbols) primarily align with or close to the Rio Grande Project Water Enrichment lines, exhibiting concentrations below 1000 mg/L for Cl and SO4, and were located furthest from the Fabens Artesian Zone (Figure 6). The up-valley control point FRD1 displayed the lowest Cl/Br weight ratio of all samples at 779, and was one of the most dilute samples (Figure 6). Samples with Cl/Br weight ratios above 960 generally plot above the 1:1 Cl/SO4 weight ratio line, with concentrations usually exceeding 1000 mg/L for both Cl and SO4.
Notably, Well IDP had the highest Cl/Br ratio at 1599. Drain samples (ID-UP and FRD1) from above the Fabens Artesian Zone have low salinity, Cl/Br < 900, and are plotted on the project water lines (Figure 6). In and below the Fabens Artesian Zone, samples with higher salinities, with Cl/Br ratios > 960 and plotting above the 1:1 Cl/SO4 line, appear. Some drain samples in Hudspeth County exhibited extremely high salinity, with one sample (ALG01) reaching 12,546 mg/L Cl and 8744 mg/L SO4. Clearly, any well completed in such saline groundwater would be unfit for any purposes, and likely face abandonment or destruction. All data collected before (Figure 3) and after the 2003 sampling by Dadakis (Figure 5 and Figure 6) indicated much higher salinity in groundwater samples, particularly at and below the Fabens Artesian area. Importantly, drain data were considered less susceptible to forms of bias, as drain water quality was not controlled through the abandonment or non-use of water wells, which could influence overall perceptions of water quality. The data provide supporting evidence of salinity bias in the 2003 dataset, leading to our proposal that drain samples and random test hole drilling may be superior methods for assessing overall water quality and avoiding forms of bias in this system when available well control is limited. The data highlight the usefulness of open agricultural drains as additional sampling sites for assessing the hydrochemistry of groundwater in saline alluvial aquifers.

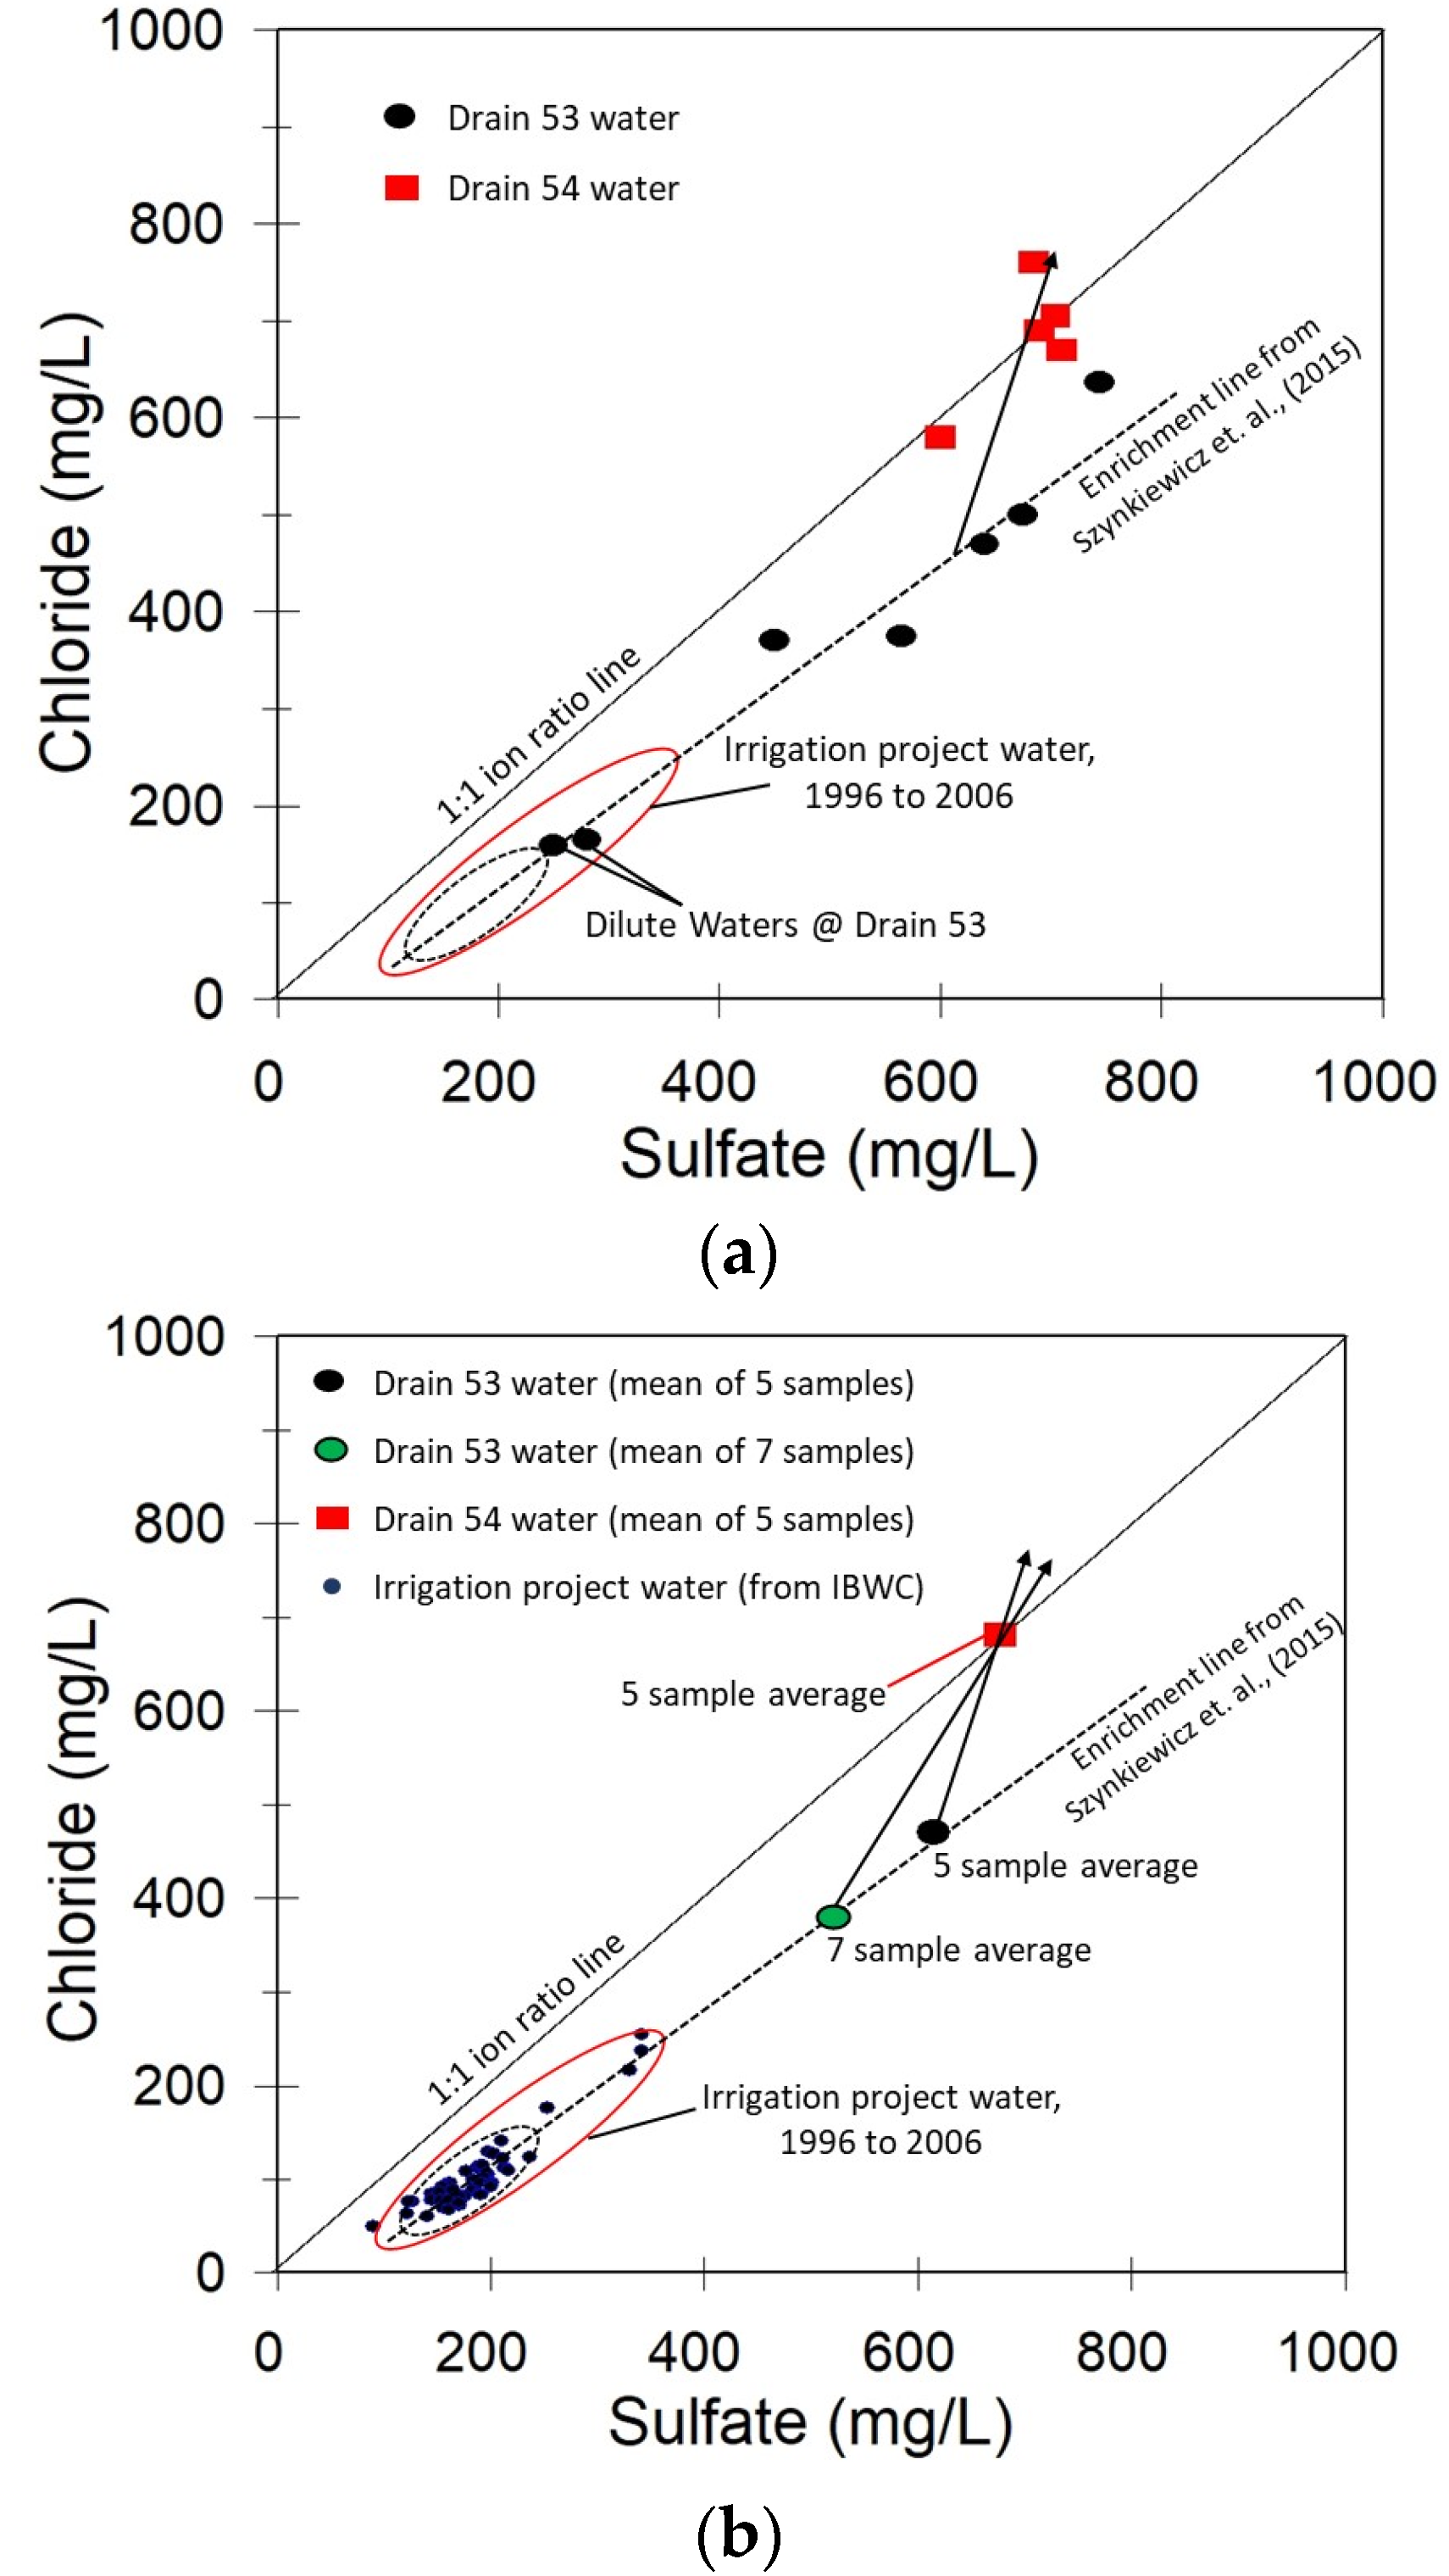
3.4. Mitigating Bias in Hydrochemical Analysis of Saline Aquifers during Drain Sampling

Conventional water wells used for irrigated agriculture, livestock, or domestic purposes may introduce bias due to selective well usage, favoring better water quality. In contrast, collector drains may offer usually unbiased information as they collect seeping groundwater regardless of influent hydrochemistry. The practice of using drains for determining groundwater quality has a history spanning at least 100 years [37,63,64,65,66] and continues to be employed in and near the study area (Phillips et al., 2003; Hogan et al., 2007; Szynkiewicz et al., 2015; Eastoe et al., 2022) [40,60,67,68]. Drains serve as prolific line sinks for groundwater discharge, collecting groundwater from shallow and intermediate depths in alluvial aquifers. For instance, Deverel and Fio (1990, 1991) [64,69] performed an analysis of geochemical and hydrologic data in a drained agricultural field located in the western San Joaquin Valley. Their findings revealed that the chemical and isotopic composition of drain-lateral water is attributed to the mixing of deep groundwater (greater than 6 m below the water table) and shallow groundwater (less than 6 m below the water table). Collector drains, when maintained for free water movement, provide a proxy concentration of mixed aquifer salinity across the aquifer portion feeding baseflow to the drain. “Aquifer compositing” also occurs in high-capacity water wells with screens penetrating multiple intervals in a supply aquifer.
In the collection of hydrochemical data, the drain must function as a gaining channel. Determining losing or gaining stream reaches becomes straightforward with nearby shallow well control. Hydraulic head differences between the channel and aquifer make flow relationships relatively easy to determine. Where well control is sparse, springs and seepage faces issuing into drains confirm gaining stream conditions, offering unbiased point source data along the lateral reaches of drains. Caution is needed to ensure that springs along drains do not originate from small, localized perched aquifer systems.
In cases where well control is unavailable to determine hydraulic head relationships between the drain and aquifer, assessment of groundwater input can be carried out by gauging upstream and downstream segments of the channel. It is crucial to confirm the absence of other influent waters between the gauged stations besides baseflow, such as canal laterals, tailwater return flows, or other non-groundwater inflows and tributaries. Visual reconnaissance for lateral inflows should precede the use of drains for water chemistry assessments.
Drain sampling may introduce biases that can be mitigated through specific protocols. Our continued examination of bias in this paper considers spatial and temporal factors in collecting data from agricultural drains. These aspects are discussed in the following two sections: 3.5—Spatial Analysis of Bias in Hydrochemical Data Collected from Agricultural Drains, and 3.6—Temporal Analysis of Bias in Hydrochemical Data Collected from Agricultural Drains.

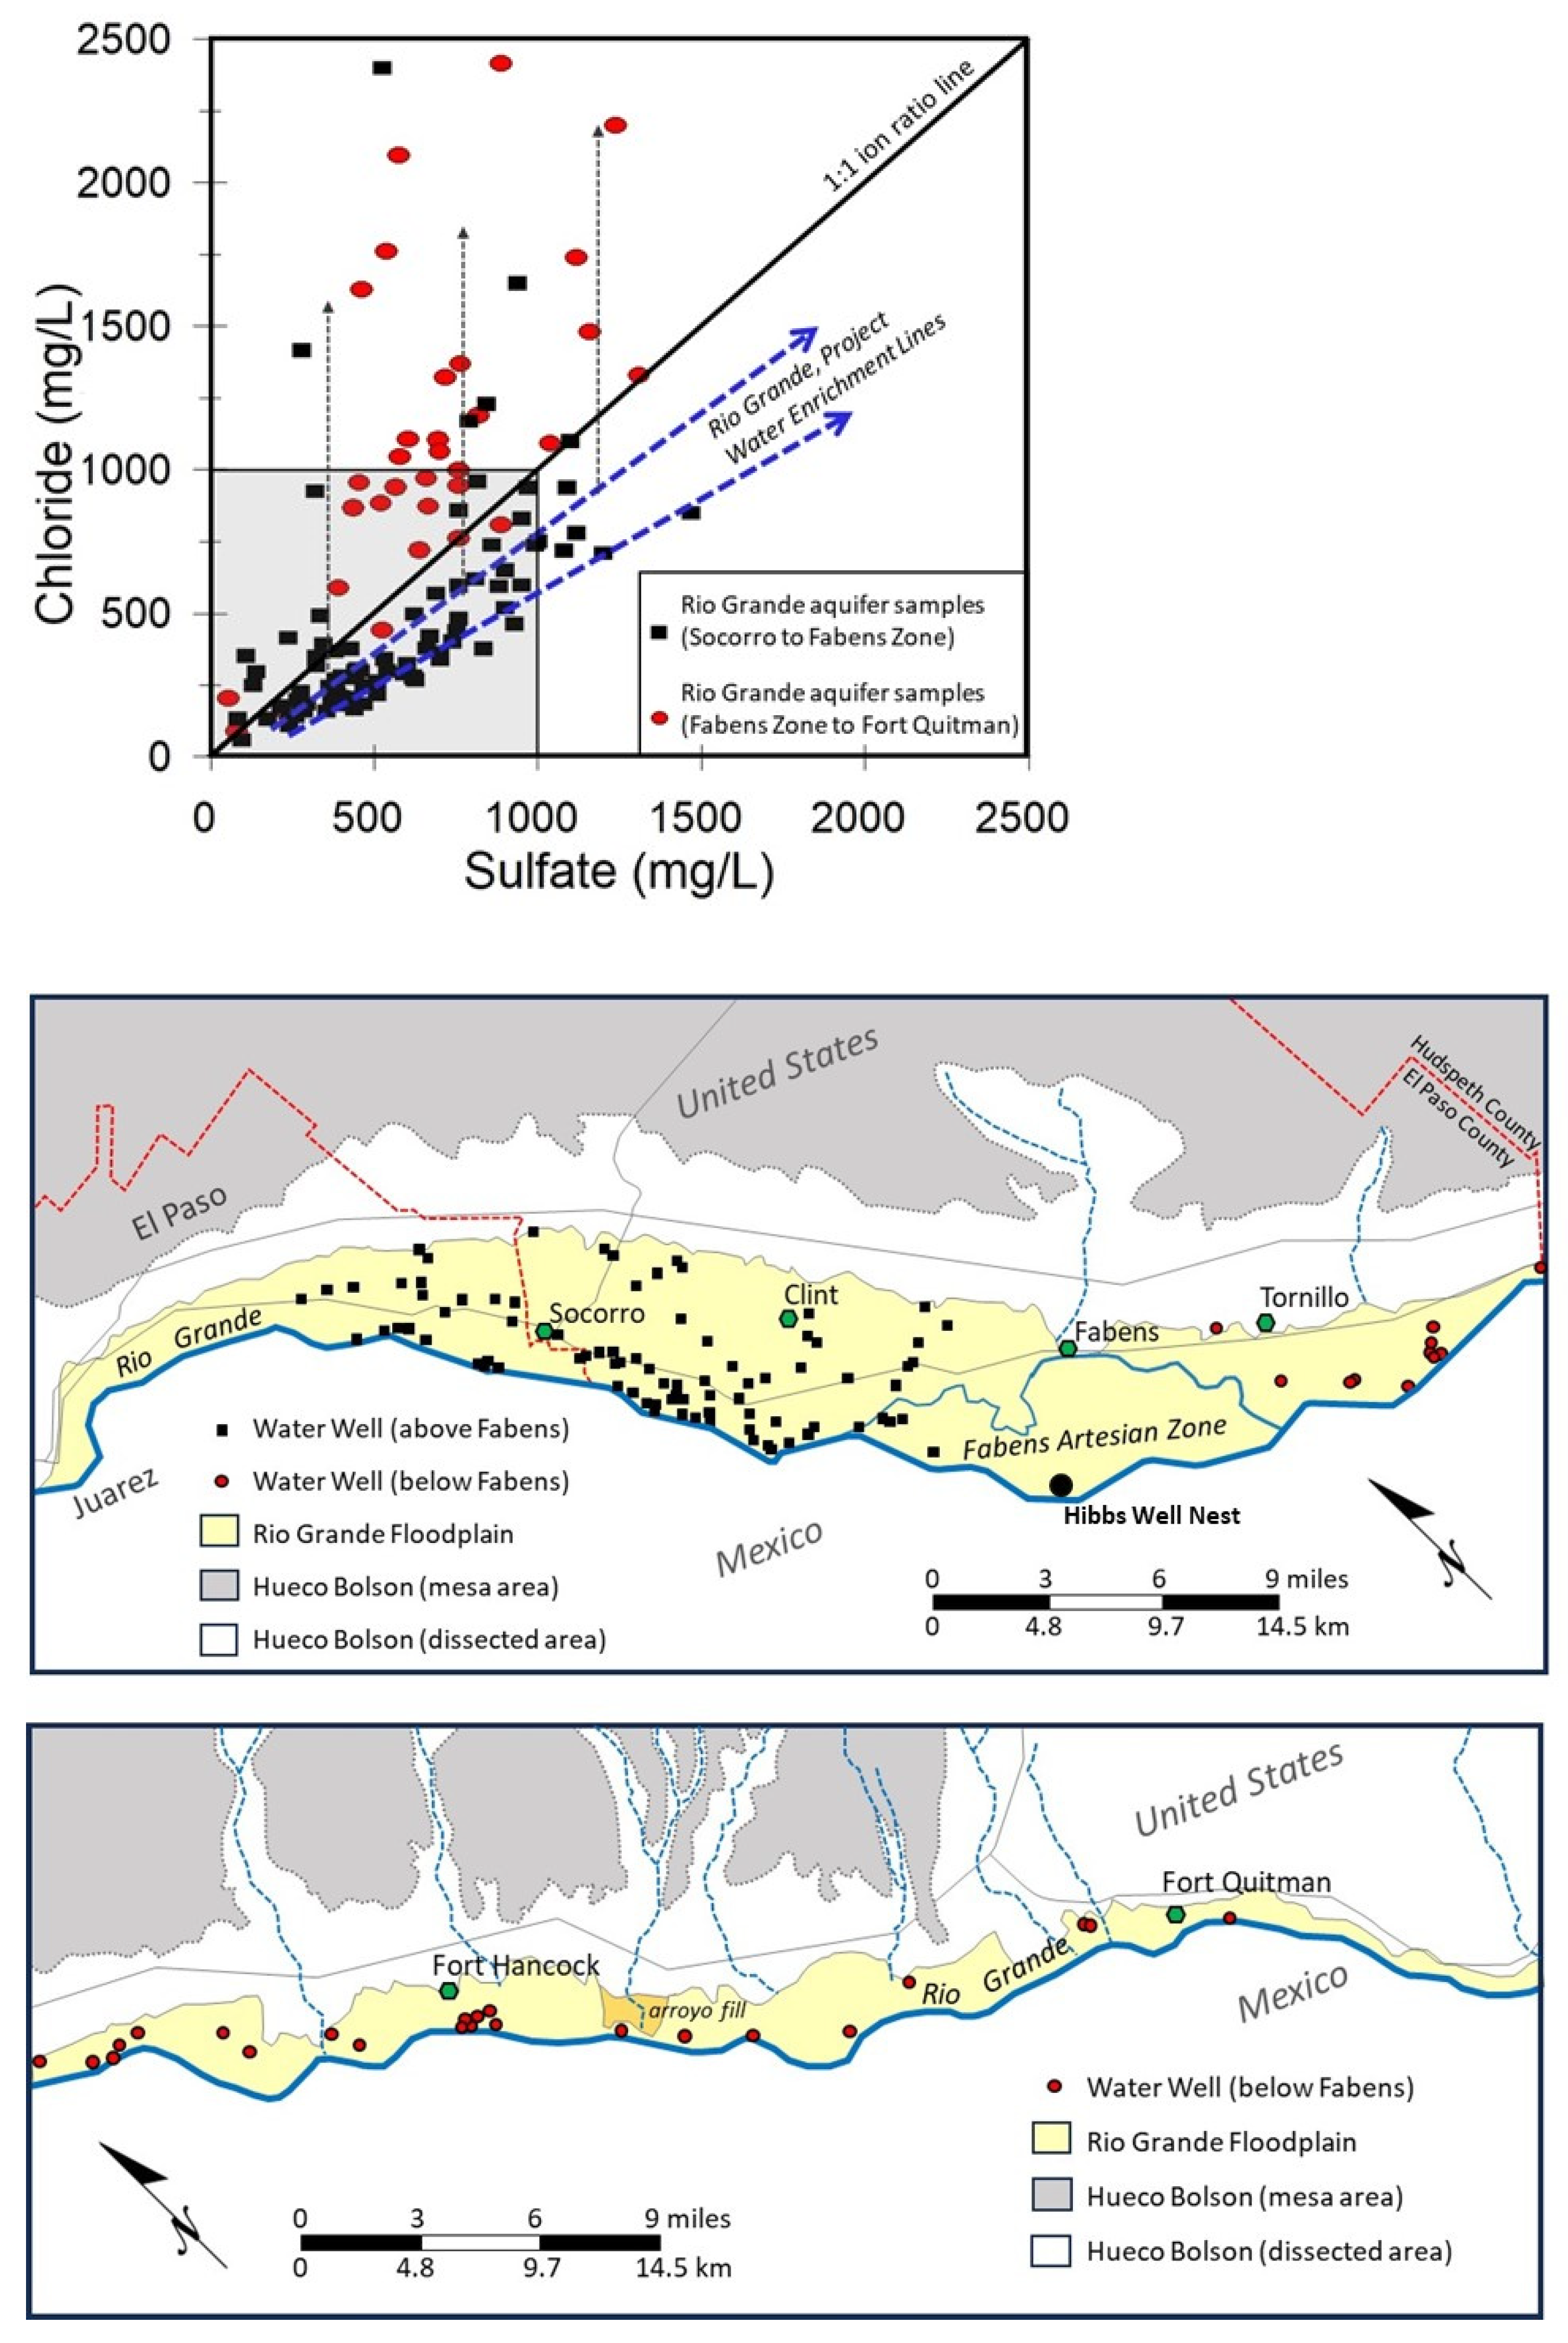
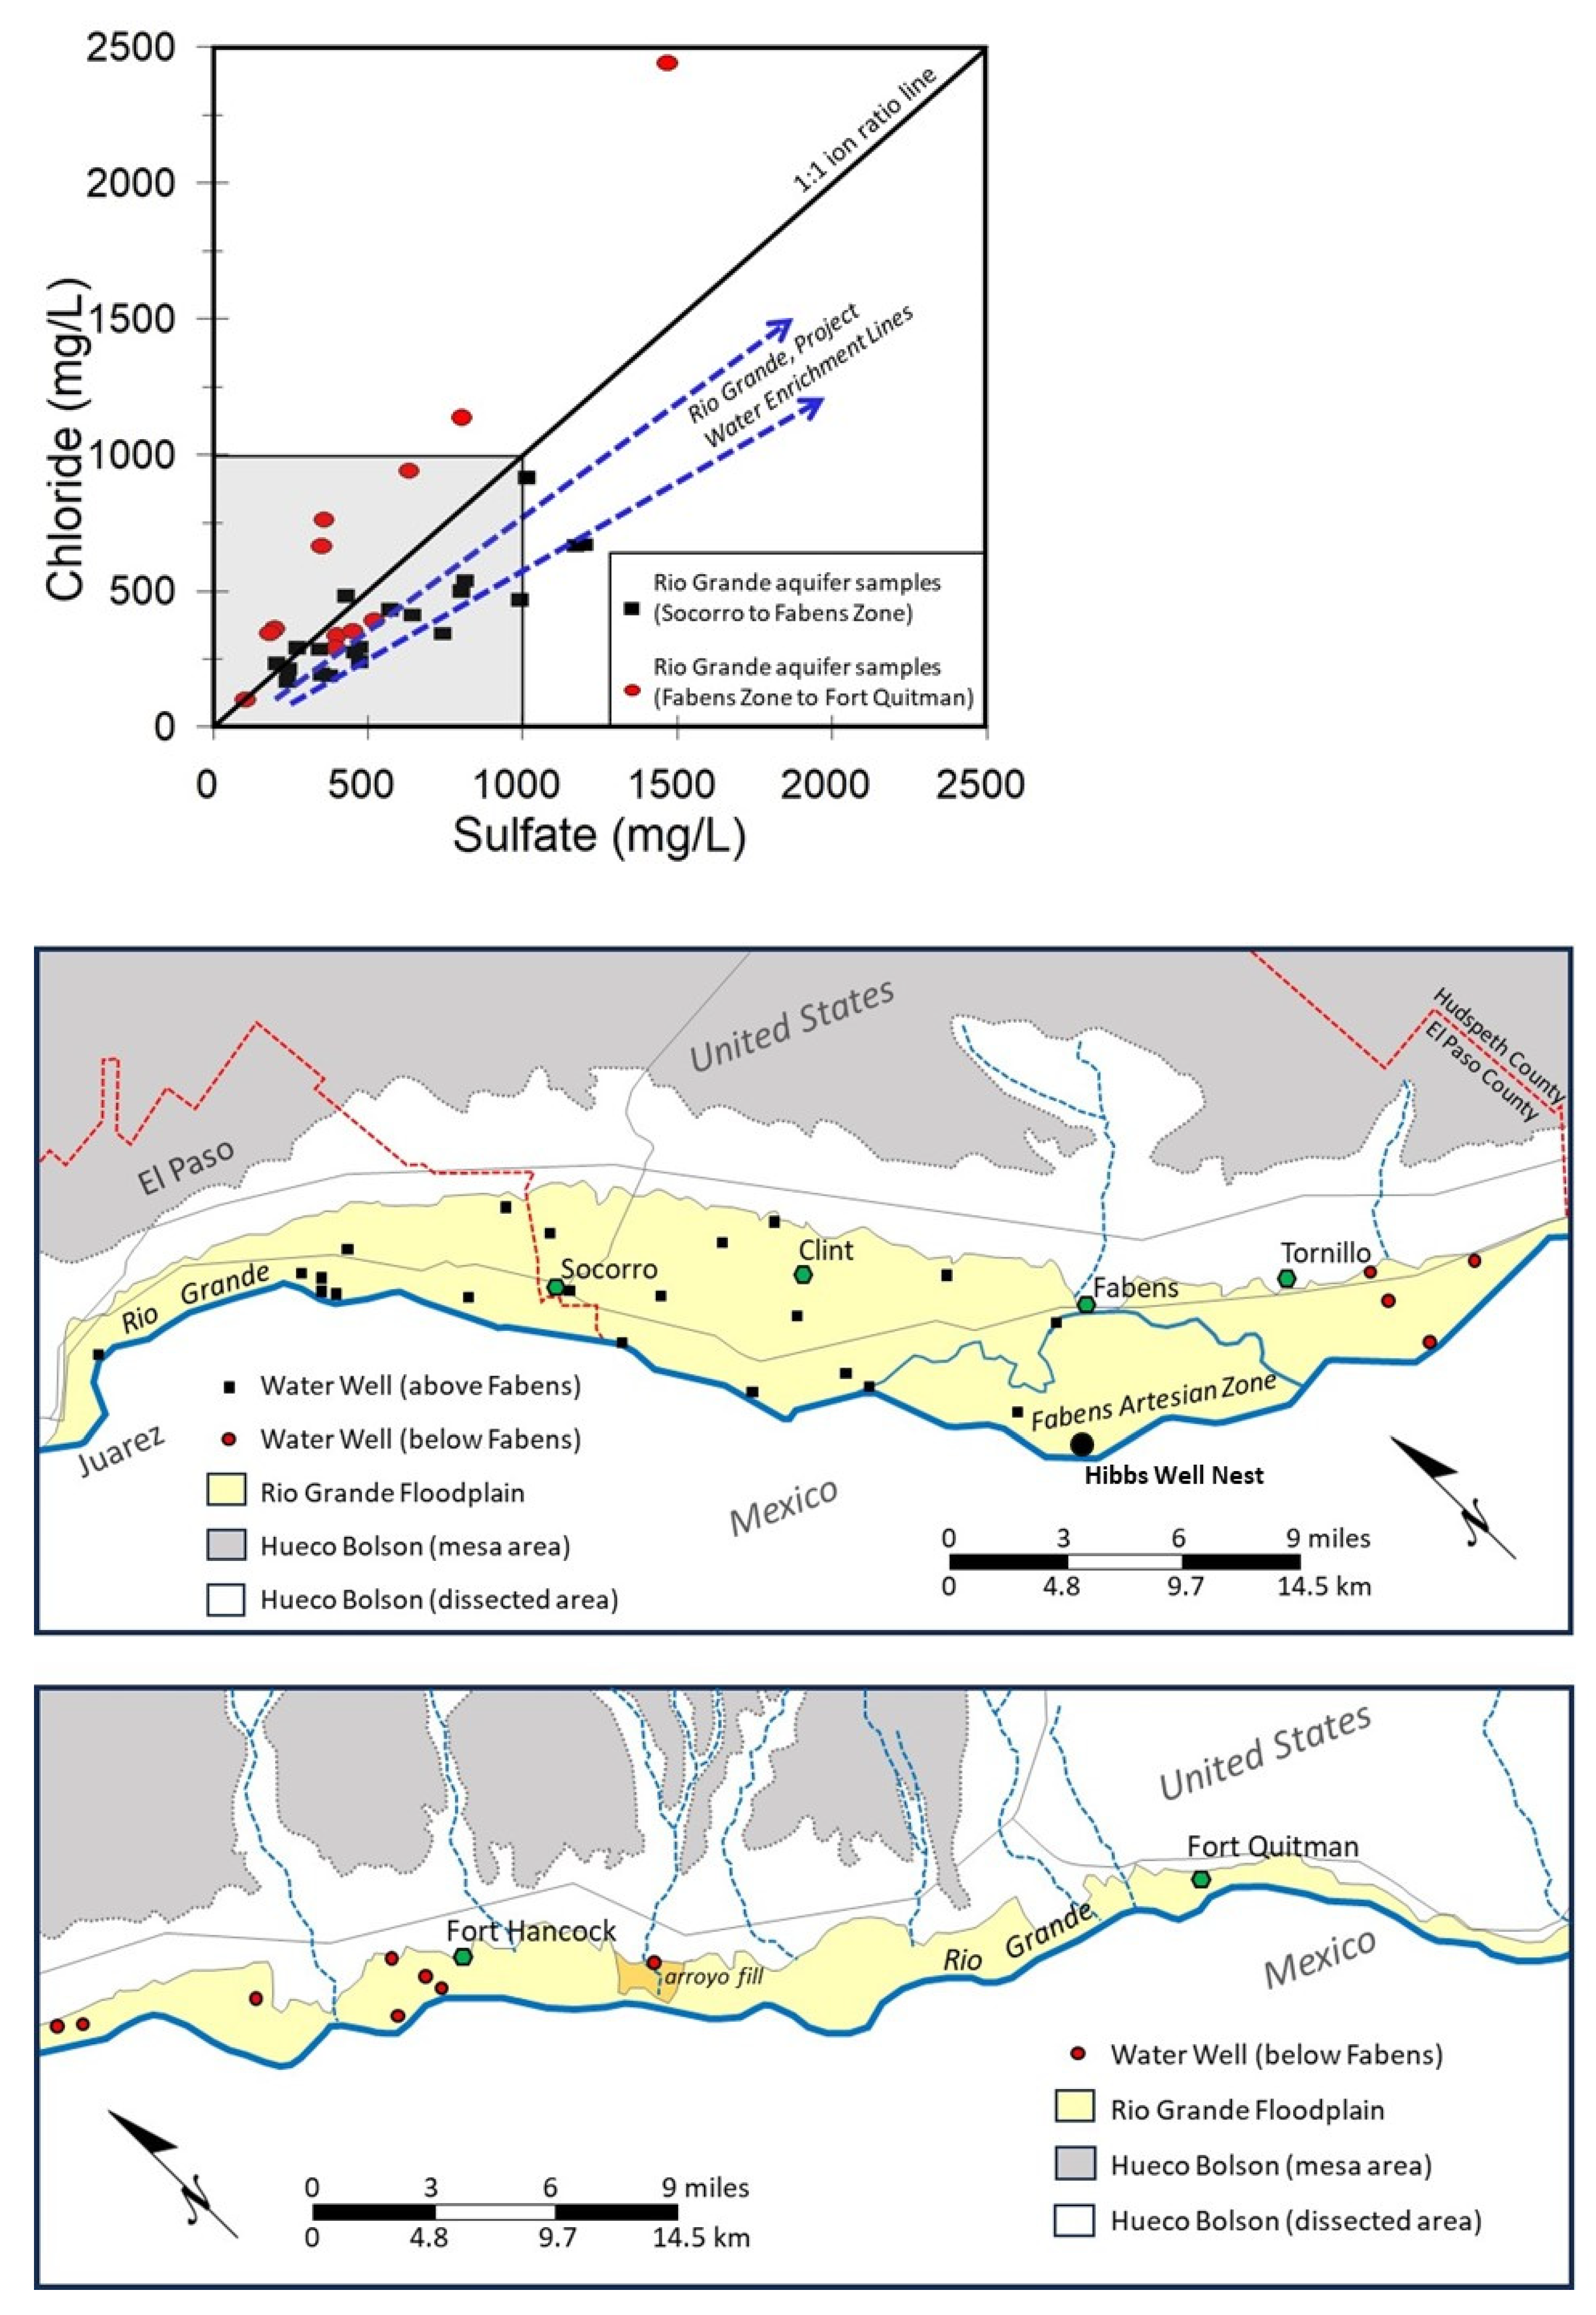
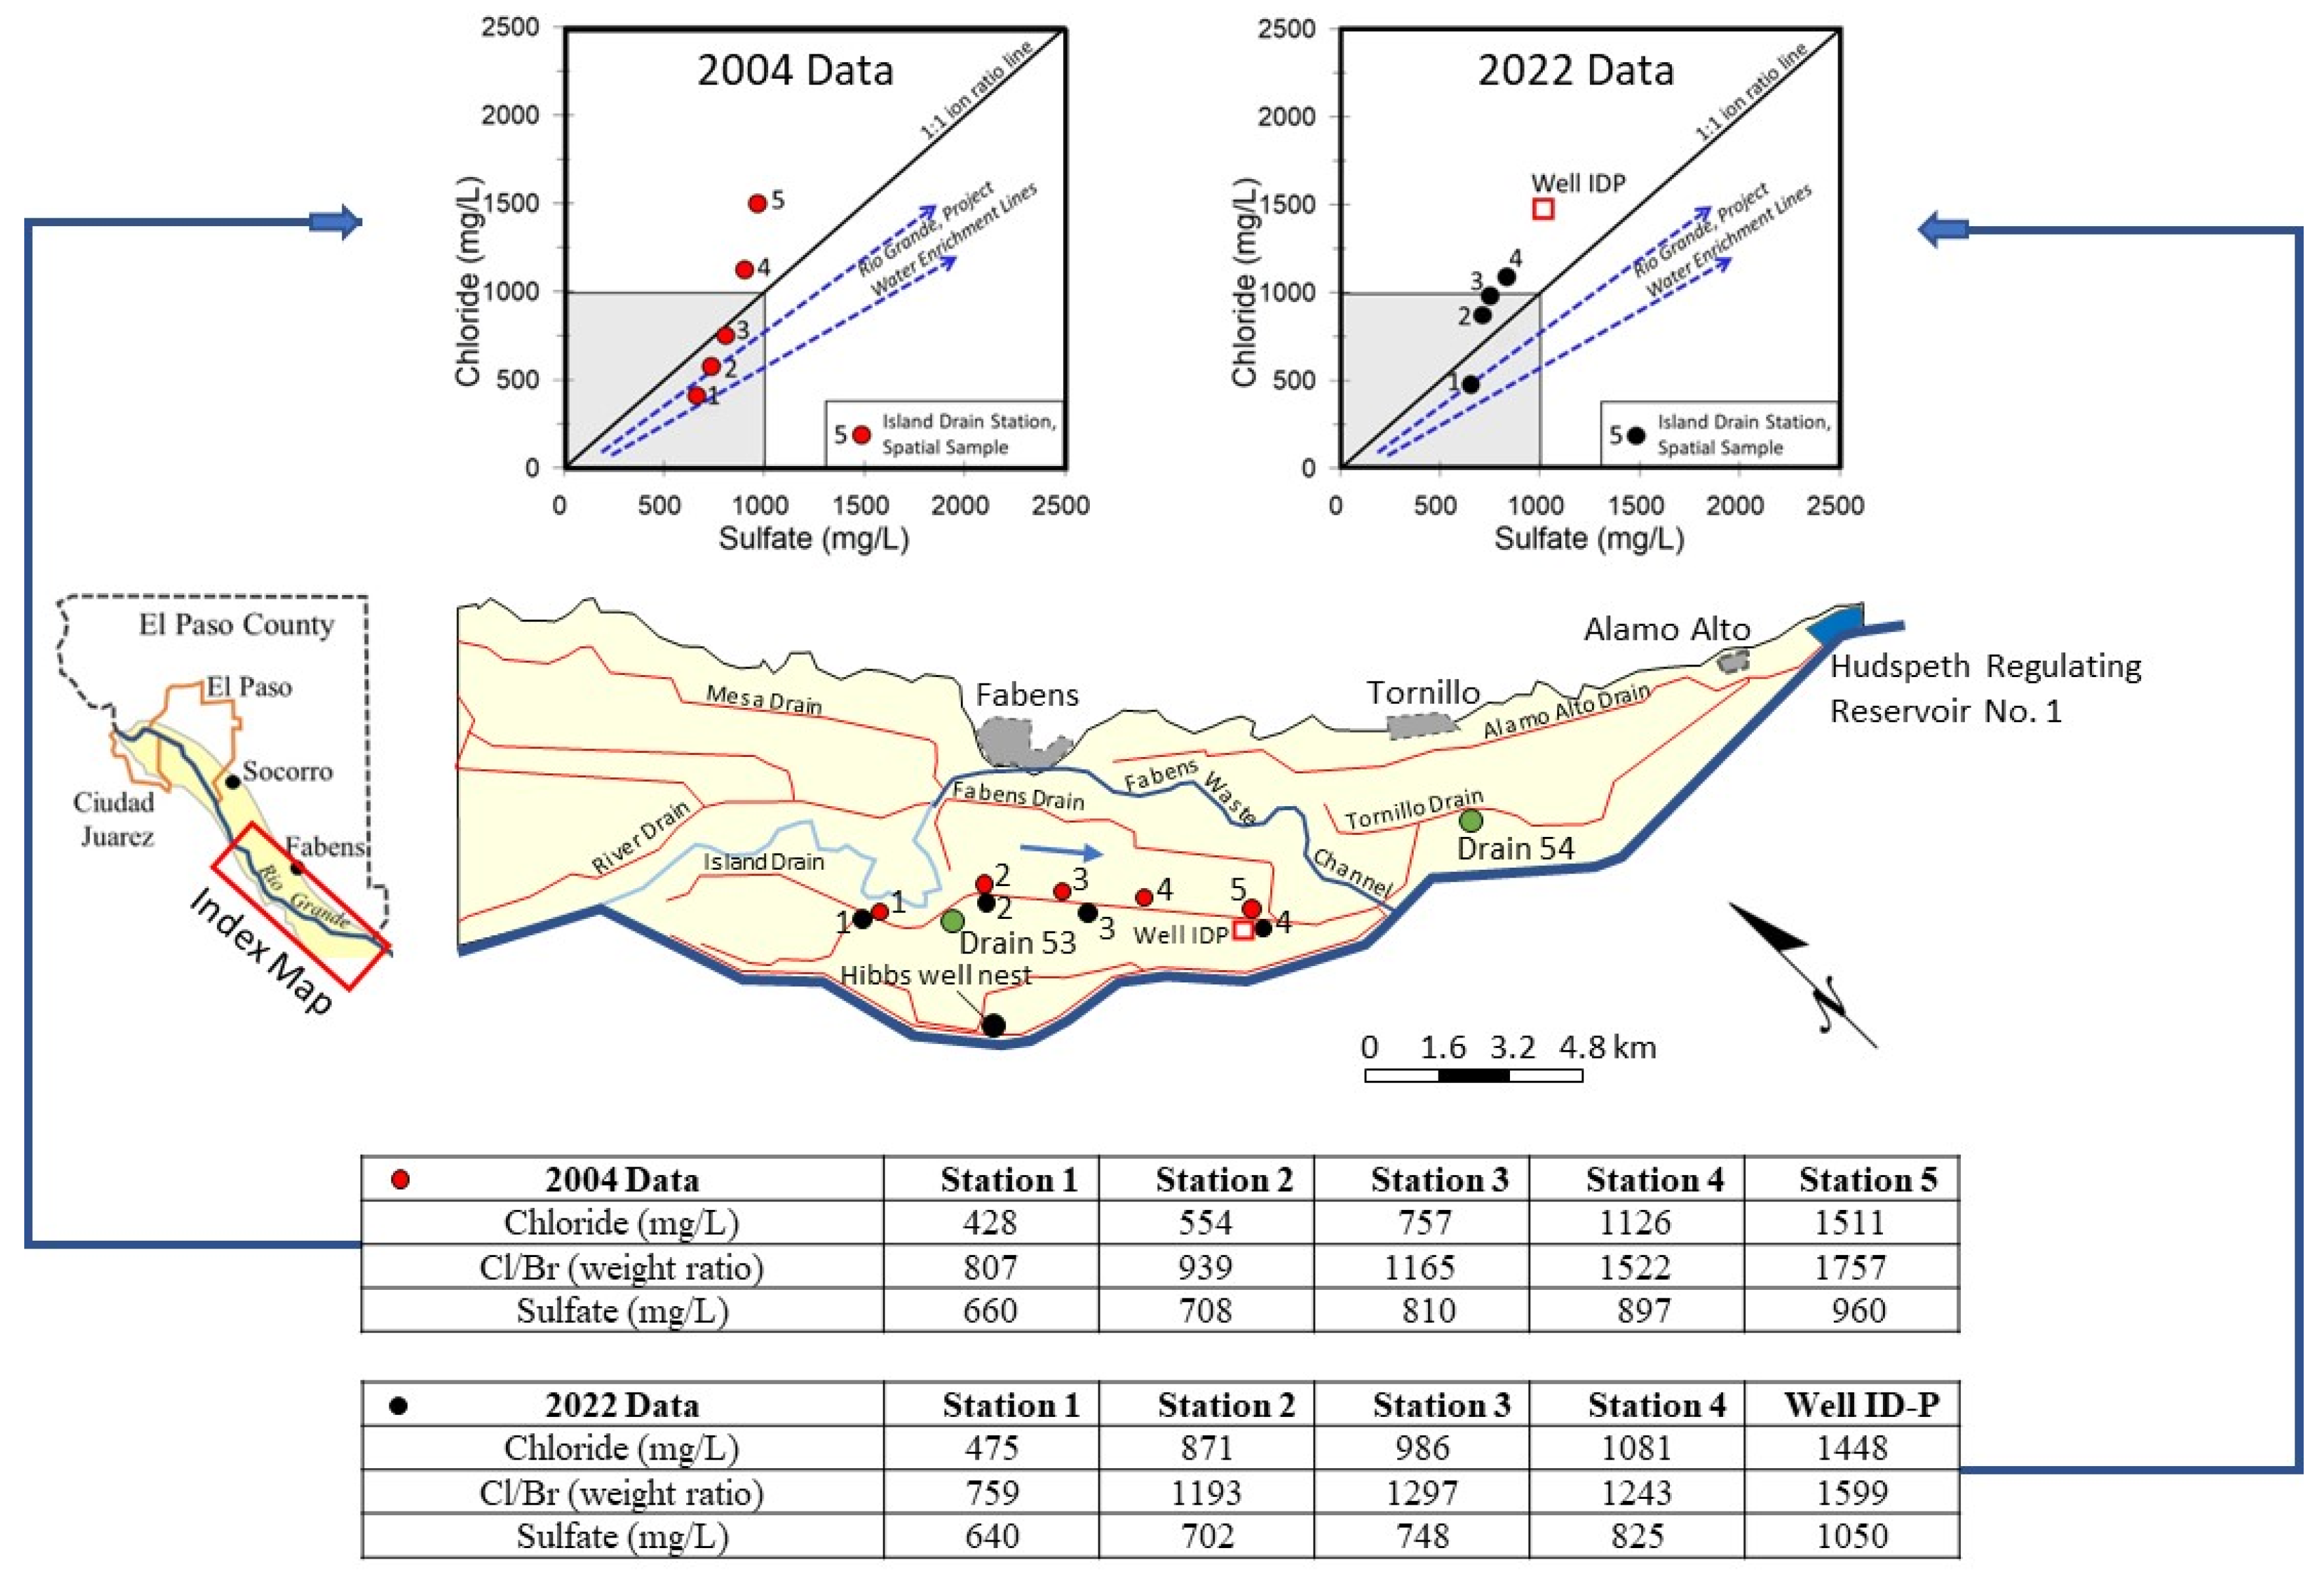
3.5. Spatial Analysis of Bias in Hydrochemical Data Collected from Agricultural Drains

The spatial analysis of hydrochemical data collected from an agricultural drain reveals significant changes in water chemistry along the Island Drain (Figure 7). Described by Hibbs and Merino (2006) [41] and replicated in 2022, the Island Drain exhibits a notable increase in chloride concentration downstream in 2004 (428 mg/L to 1511 mg/L) and 2022 (475 mg/L to 1081 mg/L), with corresponding Cl/Br weight ratio increases from 807 to 1757 (2004) and 759 to 1243 (2022) (Figure 7). Sulfate concentration increases less markedly, from 660 to 960 mg/L (2004) and 640 to 825 mg/L (2022) between stations 1 and 5 and stations 1 and 4, respectively (Figure 7). Comparisons of data at Well IDP (2018) and station 5 (2004) reveal similar parameter concentrations. The saline groundwater identified at Hibbs Well Nest (Figure 1 and Figure 7) contributes to Island Drain salinity, emphasizing a crucial geological source of salinity loading between upstream and downstream samples. The increasing Cl/Br weight ratios confirm the geologic input of halite.
Changes between 2004 and 2022, particularly evident at stations 5 (2004) and station 4 (2022), are attributed to dredging and extensive drain maintenance in 2004 just prior to our sampling of the drain. The drain conditions were degraded in 2022 with collapse features and very dense vegetation. Differences in alluvial aquifer hydraulic heads between 2004 and 2022 may also play a significant role in the overall salinity differences. These findings covering almost two decades are broadly replicated and have wide-ranging implications for the collection of drain water samples to assess aquifer salinity however. Relying on a single sample from the upstream station 1 could introduce substantial negative bias, impacting perceptions of overall groundwater salinity (Figure 7).
The study strongly advocates for synoptic sampling along drains as a crucial step in evaluating spatial changes, with direct implications for understanding aquifer salinity. Trends suggest the influx into the Island Drain of groundwater that had dissolved halite, with noticeable salinity variations observed along a 5 mile (8 km) stretch of the channel in both 2004 and 2022 (Figure 7). These results underscore the importance of strategic drain water sampling. To address potential bias, it is recommended to conduct sampling at multiple stations, taking into account separated upstream and downstream locations, and considering tributary drains, if any, in the sampling protocol. Synoptic sampling becomes instrumental in identifying significant sources of salinity, as demonstrated in this study. Alternatively, it may reveal the introduction of diluent groundwater, providing insights into the spatial variability of lower salinity inputs within alluvial aquifers.

3.6. Temporal Analysis of Bias in Hydrochemical Data Collected from Agricultural Drains

Temporal forms of bias in drain studies are significant as spatial forms of bias, as highlighted in this section. A recent investigation into the salinity of the Rio Grande Aquifer in the study area was conducted by Szynkiewicz et al. (2015) [40]. That paper delves into the origins of salinity in the Rio Grande and Rio Grande Aquifer in the Mesilla and El Paso Valleys of New Mexico and Texas, USA, as well as Chihuahua, Mexico. Hydrochemical and isotope data were primarily collected at the interface between the Mesilla Valley and Hueco Bolson (Figure 1), with a more limited exploration in the Fabens–Tornillo region. The study included testing at two drains and one nested water well site situated between the two drain stations (Figure 7). The two agricultural drains, sites 53 and 54, underwent sampling several times over a 1.3-year period (Figure 8 and Figure 9). Szynkiewicz et al. (2015) [40] reported findings on major cations and anions, sulfate isotopes, and uranium disequilibrium series isotopes. These authors concluded that salinization of alluvial groundwater, drain water, and (by proxy) Rio Grande water in the Fabens–Tornillo area has a negligible influence from deeper geological sources. Their general conclusions were “In the studied portion of the semi-arid Rio Grande, there is no evidence to suggest that the upwelling of saline groundwater near the river has any impact on salt loads; thus, developing management strategies to address this salt input is impractical”. They also noted “Most of the salt loads appear to be attributable to near-surface processes”. Therefore, they recommended reducing evaporation of irrigation water to enhance water use efficiency, leach salts to deeper soil depths, and decrease salinization.
We reinterpret the data at drain sites 53 and 54 in the context of our own findings in the Rio Grande Aquifer in this area and relate our analysis to temporal forms of bias. Notably, Szynkiewicz et al. (2015) [40] did not incorporate bromide into their analysis, despite its essential role as a tracer indicating halite input to the Rio Grande Aquifer. Our findings indicate that the data of Szynkiewicz et al. (2015) [40] collected at drains 53 and 54 also reveal a geologic source, and illustrate a pitfall that should be avoided when using drains in salinity studies, specifically during parts of the year in which agricultural drains often receive direct runoff of project tailwater from excess flows during irrigation system overload and from intentional drainage of canal laterals into agricultural drains for vector control when agricultural demands have been met (Bert Cortez, EPCWID 1, personal communication, 2021) [70]. Agricultural drain water cannot represent aquifer salinity at times when project water is diverted directly into or spills into the drains (Figure 9).
Data of Szynkiewicz et al. (2015) [40] at drain sites 53 and 54 are replotted on a chloride-sulfate scatter plot with identical scales for the x and y axes (Figure 8). Two dilute drain samples in upstream drain 53, referenced in this discussion as dilute waters @ drain 53 (DW @ drain 53), appear to be overflows of Rio Grande project water, because these samples contain a project water signature. Project water data are plotted alongside the Szynkiewicz et al. (2015) [40] data (Figure 8). Project water was collected over a 10-year period specifically during the irrigation season (Figure 8). DW @ drain 53 was plotted within the range of project water salinity, while all other drain samples are much more saline than project water. Three of the five remaining samples from drain 53 are of higher salinity, have a Cl/SO4 weight ratio ~0.85 and are plotted on a trend defined by project water and Rio Grande water enriched in solutes by evaporation (Figure 2, Figure 7, Figure 8 and Figure 9). Such drain water is probably fed by seeping groundwater that has the salinity observed in the Rio Grande Aquifer in the area above Fabens [58]. Drain 54 samples have Cl/SO4 weight ratios near 1.0, reflecting the addition of groundwater in which Cl concentrations exceed those of SO4 (Figure 7, Figure 8 and Figure 9).
DW @ drain 53 is virtually raw project water (river water in Szynkiewicz et al., 2015) when compared with other isotopic and hydrochemical parameters presented by Szynkiewicz et al. (2015) [40]. Time series data from Szynkiewicz et al. (2015) [40] show greater input of chloride compared to sulfate at stations 53 and 54 during both irrigation and non-irrigation seasons (Figure 9). Return flows of project water from canals to drains cannot occur during the non-irrigation season (Figure 9). It is therefore more meaningful to look at the data during the non-irrigation season when the samples more likely represent groundwater baseflow signature only (Figure 9; November 2009, November 2010 and February 2011). Sulfate concentration is virtually unchanged at stations 53 and 54 when no irrigation is occurring, as labeled in Figure 9. Chloride goes up concurrently between stations 53 and 54 by 20%, 8%, and 38% in the non-irrigation samples (Figure 9). These findings present problems for the overall salinity model developed by Szynkiewicz et al. (2015) [40] that favors the enrichment of sulfate slightly over chloride in their enrichment trend line for Mesilla Valley and El Paso Valley (compare our Figure 2 and Figure 8).
The three concurrent pairs of non-irrigation data points at drains 53 and 54 (November 2009, 2010, and February 2011, Figure 9) are virtually indistinguishable in most of the other hydrochemical plots of Szynkiewicz et al. (2015) [40], including bicarbonate vs. sulfate (their Figure 4); δ34S versus δ18O (their Figure 8); and δ34S and δ18O versus SO4 concentration (their Figure 8). The only significant difference in the non-irrigation data is seen in the chloride data (Figure 9 in this discussion). Cl and SO4 data for the non-irrigation samples in both studies, therefore, provide evidence of upwelling of saline, groundwater like that encountered in the area of artesian flow near Fabens and Tornillo (Figure 2 and Figure 3). The upwelling groundwater has elevated Cl/SO4 (~1) relative to river water (Cl/SO4 ≤ 0.85). Drains in this area are highly contaminated by a chloride-dominated source of salts of geologic origin as discussed by Hibbs and Merino (2006) [41] and Merino (2006) [58] and as presented in several data sets in our paper.
Drains in which any lateral inflows from other sources can be ruled out receive groundwater seepage only during dry weather conditions. When agricultural drains are sampled to provide proxy information for the hydrochemistry of aquifers, data in the non-irrigation season provide useful, unbiased collector data on groundwater salinity. Collecting data from drains is problematic when the drains receive return flows of irrigation project water (Figure 9).
While we acknowledge the importance of agricultural sources of salinity in the Fabens–Tornillo region of the Rio Grande Aquifer (e.g., for sulfate, Eastoe et al., 2022 [60]), we respectfully disagree with the assertion of Szynkiewicz et al. (2015) [40] that there is no evidence of upwelling of saline groundwater from deeper formations. In our view, this disagreement stems from a potential bias in their interpretation of temporal drain data in the Fabens–Tornillo area. Our paper extends beyond a scientific debate because Szynkiewicz et al. (2015) [40] recommended that remedial measures for mitigating contaminated water resources should solely focus on managing agricultural practices. Contrary to this, our study indicates a significant geological source of salinity when combining Szynkiewicz et al. (2015) [40] data with our earlier findings. These combined data reveal a regional imprint of the geological source near Fabens, Texas. If our interpretations regarding bias are accurate, addressing agricultural sources of salinity alone may not be sufficient for effective remediation. The geological source of salinity must also be taken into consideration. The foundation of our conclusions lies in data and interpretations that seem to be influenced by biases.

3.7. Recommendations

Most studies of groundwater chemistry depend on existing water supply wells to assess the suitability of aquifers for meeting agricultural, industrial, and domestic water demands. Rarely are sufficient budgets available for regional test hole drilling programs that would provide adequate well control for testing unbiased ranges of aquifer salinity. Sampling bias can potentially be avoided by including inactive or abandoned wells in addition to operational water wells. Inactive or abandoned wells should be adequately purged and assessed to determine if casing screens and perforations are still in contact with water-bearing formations. Well owners should be queried about the historical use of their wells to help determine if well screens have been partially sealed off from more saline strata or if wells have been abandoned or remain unused due to poor-quality groundwater.
To further mitigate bias, other sampling methods should be included when assessing the overall hydrochemistry of variably saline aquifers. Where lithologic conditions are suitable, hand-auger test holes and observation wells can be installed. This is usually possible to achieve, with the installation and sampling of 1 to 3 such wells in a single day. These methods are most practical if the depth to the water table is less than 20 feet (6.1 m) and can significantly contribute to sampling coverage where conventional water wells are not available. While river cobbles, if present, may make hand installations impossible, river sands, silts, and clays are easily penetrated by hand augers. Sampling bias in the study area can be reduced by collecting hand-auger samples across a broader portion of the Rio Grande alluvial floodplain, and in many other floodplain aquifer systems. Agricultural drainage channels can also serve as valuable sources of unbiased information for understanding the hydrochemistry of aquifers. However, it is crucial that data collection not occur during the irrigation season to ensure accurate representation. Problems arise when collecting data from drains that receive surface return flows or leakage from irrigation projects (Figure 9).

4. Conclusions

This study uncovers a case of groundwater bias encountered during the initial water well sampling program in the El Paso/Juárez Valley in 2003. The 2003 study revealed that groundwater salinity in available water wells during the first round of sampling was more dilute than observed in historical and subsequent studies. Subsequent rounds of groundwater sampling from late 2003 to 2022, including drain samples, spring samples, wells, and test hole samples, showed higher salinity than in the initial round in 2003.
We interpret these differences as a result of the selective use of water wells that provided better groundwater quality in the first round of sampling in 2003. Our contention is that, in alluvial basins where groundwater salinity varies widely, bias emerges due to the tendency of landowners to discontinue or suspend the use of water wells that yield increasingly saline groundwater, whether for irrigation, livestock, or domestic purposes. This sampling bias may lead to an inaccurate representation of the regional hydrochemistry of aquifers, particularly in areas with significant variations in groundwater salinity. This is exacerbated by the limited availability of water supply wells producing poor-quality groundwater.
For the most reliable analysis of aquifer hydrochemistry, especially in variably saline aquifers like the Rio Grande Aquifer, depth-dependent testing in boreholes fitted with permanent casings proves most beneficial for future assessments of hydrochemistry and salinity. In cases where budgets are constrained, alternative methods can complement conventional well control data. These may include drain sampling, spring sampling, and, if practicable, the simple hand-auger installation of well points in strategic areas. These methods can be employed at any time and are particularly useful when most water wells are inactive during wet years in systems reliant on project water stored in large-capacity reservoirs. When utilizing drain data as a proxy for groundwater salinity, it is crucial to supplement it, whenever possible, with data from nearby water wells to enhance the accuracy and reliability of the assessment.
In the course of our investigation, a significant geological source of salinity was identified using major anion concentrations in the Rio Grande Aquifer within the El Paso Valley. Particularly, a chloride-dominated salinity source in the Fabens area influences the hydrochemistry of the Rio Grande Aquifer and channels extending beyond Fort Quitman. This natural salinity source must be taken into account in any attempts to mitigate salinity in the study area.

Supplementary Materials

The following supporting information can be downloaded at: https://www.mdpi.com/article/10.3390/geosciences14030066/s1, 1. Collation of Historical Data: 2. Study Area Geology: 3. Broader Details on Water Development, Irrigation, Groundwater Use, and Salinity in the Study Aquifer: 4. Hydrochemical Information from Hibbs Nested Well in the Fabens Artesian Zone: Figure S1. Geologic and electrical log collected during drilling of State Well 49-39-207: Figure S2. Reservoir storage at Elephant Butte, New Mexico: Table S1: Groundwater data collected from the upper confining unit of the artesian aquifer near Fabens, Texas. References [1,2,3,4,5,6,7,8,9,10,11,12,13,14,15,16,17,18,19] are cited in the Supplementary Materials.

Author Contributions

Conceptualization, B.J.H. and C.J.E.; methodology, B.J.H., C.J.E. and M.M.; formal analysis, B.J.H. and C.J.E.; and M.M.; investigation, B.J.H., C.J.E. and M.M.; resources, B.J.H.; writing—original draft preparation, B.J.H.; writing—review and editing, B.J.H., C.J.E. and M.M.; visualization, B.J.H.; project administration, B.J.H.; funding acquisition, B.J.H. All authors have read and agreed to the published version of the manuscript.

Funding

Research supported by grants from the National Science Foundation, US Department of Agriculture-National Institute for Food and Agriculture, CEA-CREST Center at California State University Los Angeles, and SAHRA Center at the University of Arizona.

Data Availability Statement

Data used in this paper are available in Alvarez and Buckner, 1980; Dadakis, 2004; Merino, 2006; Eastoe et al., 2022; Hibbs and Merino, 2022; Texas Water Development Board Public Groundwater Data Base, published IBWC Water Bulletins, and unpublished data collected by the authors. The unpublished data will be included in a forthcoming research paper focused on the salinity of the groundwater system discussed in this paper on groundwater bias.

Acknowledgments

The authors appreciate thoughtful reviews of the manuscript by John Sharp, John Hawley, Bruce Darling, and three anonymous reviewers. Field data collection and assistance by Jason Dadakis and Kirstie Rascon is recognized. We are grateful to landowners in the study area for providing access to their private water wells and private property.

Conflicts of Interest

The authors declare no conflict of interest.

References

  1. Butler, J., Jr. The Design, Performance, and Analysis of Slug Tests; Lewis Publishers: New York, NY, USA, 1998; p. 252. [Google Scholar]
  2. McElwee, C. Improving the analysis of slug tests. J. Hydrol. 2002, 269, 122–133. [Google Scholar] [CrossRef]
  3. Gillham, R.; Robin, M.; Barker, J.; Cherry, J. Groundwater Monitoring and Sample Bias; API Publication No. 4367; American Petroleum Institute: Washington, DC, USA, 1983; 200p. [Google Scholar]
  4. Imbrigiotta, T.; Gibs, J.; Fusillo, T.; Kish, G.; Hochreiter, J. Field evaluation of seven sampling devices for purgeable organic compounds in ground water. In Ground Water Contamination, Field Methods, ASTM STP 963; Collins, A., Johnson, A., Eds.; American Society for Testing and Material Standards: West Conshohocken, PA, USA, 1988; pp. 258–273. [Google Scholar]
  5. Reilly, T.; Franke, O.; Bennett, D. Bias in groundwater samples caused by wellbore flow. J. Hydraul. Eng. 1989, 115, 270–276. [Google Scholar] [CrossRef]
  6. Puls, R.; Barcelona, M. Filtration of groundwater samples for metals analysis. Hazard. Waste Hazard. Mater. 1989, 6, 385–393. [Google Scholar] [CrossRef]
  7. Puls, R.; Barcelona, M. Groundwater sampling for metals analyses; U.S. EPA Superfund Groundwater Issue, EPA/504/4-89/001; U.S. EPA: Washington, DC, USA, 1989; 6p. [Google Scholar]
  8. Puls, R.; Barcelona, M. Low-Flow (Minimal Drawdown) Groundwater Sampling Procedures; U.S. EPA Superfund Groundwater Issue, EPA/504/S-95/504; U.S. EPA: Washington, DC, USA, 1996. [Google Scholar]
  9. Puls, R.; Eychaner, J. Sampling of groundwater for inorganics—Pumping rate, filtration, and oxidation effects. In Fourth National Outdoor Action Conference on Aquifer Restoration, Groundwater Monitoring, and Geophysical Methods; Association of Groundwater Scientists and Engineers; National Water Well Association: Westerville, OH, USA, 1990; pp. 313–327. [Google Scholar]
  10. California Environmental Protection Agency. Guidelines for Hydrogeologic Characterization for Hazardous Substance Release Sites, Volume 1, Field Investigation Manual; State of California Environmental Protection Agency: San Francisco, CA, USA, 1995.
  11. California Environmental Protection Agency. Monitoring Well Design and Construction for Hydrogeologic Characterization, Guidance Manual for Ground Water Investigations; State of California Environmental Protection Agency: San Francisco, CA, USA, 1995.
  12. California Environmental Protection Agency. Representative Sampling of Ground Water for Hazardous Substances, Guidance Manual for Ground Water Investigations; State of California Environmental Protection Agency: San Francisco, CA, USA, 1995.
  13. California Environmental Protection Agency. Representative Sampling of Groundwater for Hazardous Substances, Guidance Manual for Groundwater Investigations; California Environmental Protection Agency, Department of Toxic Substances Control: San Francisco, CA, USA, 2006; originally published in 1995, revised in 2006.
  14. Hutchins, S.; Acree, S. Ground-water sampling bias observed in shallow conventional wells. Groundw. Monit. Remediat. 2000, 20, 86–93. [Google Scholar] [CrossRef]
  15. Vroblesky, D. (Ed.) User’s Guide for Polyethylene-Based Passive Diffusion Bag Samplers to Obtain Volatile Organic Compound Concentrations in Wells, Part 2, Field Tests; Report 01-4061; U.S. Geological Survey Water-Resources Investigations: Reston, VA, USA, 2001. [Google Scholar]
  16. Church, P.; Vroblesky, D.; Lyford, F.; Willey, R. Guidance on the Use of Passive Vapor-Diffusion Samplers to Detect Volatile Organic Compounds in Groundwater-Discharge Areas, and Example Applications in New England; Report 02-4186; U.S. Geological Survey Water-Resources Investigations: Reston, VA, USA, 2002; 79p. [Google Scholar]
  17. Kim, K. Long-term disturbance of ground water chemistry following well installation. Ground Water 2003, 41, 780–789. [Google Scholar] [CrossRef] [PubMed]
  18. Nielsen, D.; Nielsen, G. Ground-water sampling, In Practical Handbook of Environmental Site Characterization and Ground-Water Monitoring; Nielsen, D., Ed.; Taylor & Francis Group, CRC Press: Boca Raton, FL, USA, 2006; pp. 959–1112. [Google Scholar]
  19. Striggow, B.; Quinones, A.; Ackerman, L. Design and Installation of Monitoring Wells, U.S. EPA Region 4; Science and Ecosystems Support Division: Athens, GA, USA, 2008; 43p. [Google Scholar]
  20. Striggow, B.; Deatrick, J.; Johnson, H. Groundwater Sampling, Operating Procedure, U.S. EPA Region 4; Science and Ecosystems Support Division: Athens, GA, USA, 2017; 34p. [Google Scholar]
  21. U.S. EPA. Region 3. Sample Submission Procedures for OASQA Laboratory Branch; OASQA sample submission procedures Rev. 13; Office of Analytical Services and Quality Assurance Laboratory Branch: Washington, DC, USA, 2014; 41p.
  22. Herzog, B.; Chou, L.; Valkenburg, J.; Griffin, R. Changes in volatile organic chemical concentrations after purging slowly recovering wells. Ground Water Monit. Rev. 1988, 8, 93–99. [Google Scholar] [CrossRef]
  23. Barcelona, M.; Wehrman, H.; Varljen, M.D. Reproducible well-purging procedures and VOC stabilization criteria for ground-water sampling. Ground Water 1994, 32, 12–22. [Google Scholar] [CrossRef]
  24. American Petroleum Institute. No-Purge Groundwater Sampling, an Approach for Long-Term Monitoring, a Summary of Research Results from Api’s Soil & Groundwater Technical Task Force; Bulletin No. 12; American Petroleum Institute: Washington, DC, USA, 2000. [Google Scholar]
  25. U.S. EPA. Example standard operating procedure, standard operating procedure for low-stress (low flow)/minimal drawdown ground-water sample collection, attachment 3. In Groundwater Sampling Guidelines for Superfund and RCRA Project Managers, Guidance Manual for Groundwater Investigations 24; U.S. EPA: Washington, DC, USA, 2002; pp. 27–38. [Google Scholar]
  26. U.S. EPA. Example standard operating procedure, standard operating procedure for the standard/well-volume method for collecting a ground-water sample, attachment 4. In Groundwater Sampling Guidelines for Superfund and RCRA Project Managers, Guidance Manual for Groundwater Investigations 24; U.S. EPA: Washington, DC, USA, 2002; pp. 39–53. [Google Scholar]
  27. Varljen, M.; Barcelona, M.; Obereiner, J.; Kaminski, D. Numerical simulations to assess the monitoring zone achieved during low-flow purging and sampling. Ground Water Monit. Remediat. 2006, 26, 44–52. [Google Scholar] [CrossRef]
  28. Reinhart, R.; Smaldone, J. Low Stress (Low Flow) Purging and Sampling Procedure for the Collection of Groundwater Samples from Monitoring Wells, U.S. EPA Region 1; Quality Assurance Unit: North Chelmsford, MA, USA, 2017; 30p. [Google Scholar]
  29. Barcelona, M.; Gibb, J.; Helfrich, J.; Garske, E. Practical Guide for Ground-Water Sampling; Contract Report 374; Illinois State Water Survey: Champaign, IL, USA, 1985. [Google Scholar]
  30. Zhang, Y.; Miao, C.; Zhu, J.; Gao, T.; Sun, Y.; Zhang, J.; Xu, S.; Yang, K. The impact of landslides on chemical and microbial properties of soil in a temperate secondary forest ecosystem. J. For. Res. 2022, 33, 1913–1923. [Google Scholar] [CrossRef]
  31. Sun, J.; Zhao, X.; Fang, Y.; Gao, F.; Wu, C.; Xia, J. Effects of water and salt for groundwater-soil systems on root growth and architecture of Tamarix chinensis in the Yellow River Delta, China. J. For. Res. 2022, 34, 441–452. [Google Scholar] [CrossRef]
  32. Slichter, C. Observations on Ground Water of the Rio Grande Valley; Water-Supply Paper 141; U.S. Geological Survey: Reston, VA, USA, 1905; 83p. [Google Scholar]
  33. Lee, W. Water Resources of the Rio Grande Valley in New Mexico; Water-Supply Paper 188; U.S. Geological Survey: Reston, VA, USA, 1907; 59p. [Google Scholar]
  34. Meinzer, O. Hare. R. Geology and Water Resources of Tularosa Basin, New Mexico; Water-Supply Paper 343; U.S. Geological Survey: Reston, VA, USA, 1915; 317p. [Google Scholar]
  35. Darton, N. Geology and Underground Water of Luna County, New Mexico; Bulletin 618; U.S. Geological Survey: Reston, VA, USA, 1916; 188p. [Google Scholar]
  36. Bryan, K. Geology and groundwater conditions of the Rio Grande depression in Colorado and New Mexico. In [U.S.] Natural Resources Committee, Regional Planning Part VI—The Rio Grande Joint Investigations in the Upper Rio Grande Basin in Colorado, New Mexico, and Texas, 1936–1937; Government Printing Office: Washington, DC, USA, 1938; Volume 1, part 2, pp. 197–225. [Google Scholar]
  37. de la O Carreno, A. Preliminary geohydrological study of the Juárez Valley and surrounding areas; State of Chihuahua: Mexico City, Mexico, 1957; 101p. [Google Scholar]
  38. Alvarez, H.; Buckner, A. Ground-Water Development in the El Paso Region, Texas, with Emphasis on the Resources of the Lower El Paso Valley; Report 246; Texas Department of Water Resources: Austin, TX, USA, 1980; 346p. [Google Scholar]
  39. Hibbs, B.J.; Boghici, R. On the Rio Grande Aquifer; flow relationships, salinization, and environmental problems from El Paso to Fort Quitman, Texas. Env. and Eng. Geos. 1998, 5, 51–59. [Google Scholar] [CrossRef]
  40. Szynkiewicz, A.; Borok, D.M.; Ganjegunte, G.K.; Skrzypek, G.; Ma, L.; Rearick, M.S.; Perkins, G.B. Isotopic studies of the Upper and Middle Rio Grande. Part 2, Salt loads and human impacts in south New Mexico and west Texas. Chem. Geol. 2015, 14, 336–350. [Google Scholar] [CrossRef]
  41. Hibbs, B.; Merino, M. A geologic source of salinity in the Rio Grande Aquifer. New Mex. J. Sci. 2006, 44, 165–181. [Google Scholar]
  42. U.S. Bureau of Reclamation. Water resources of El Paso County, Texas. In Rio Grande Project; New Mexico-Texas Project Office: El Paso, TX, USA, 1973; 97p. [Google Scholar]
  43. U.S. Bureau of Reclamation. Status Report, Elephant Butte Reservoir, Fort Quitman Project, New Mexico-Texas; Rio Grande Regional Environmental Project; U.S. Bureau of Reclamation: Washington, DC, USA, 1976; 25p.
  44. Bluntzer, R. Water supply problems in the El Paso Area, Texas. In Proceedings of the American Society of Civil Engineers Irrigation and Drainage Specialty Conference, Logan, UT, USA, 13–15 August 1975. 29p. [Google Scholar]
  45. Hawley, J.; New Mexico Bureau of Mines and Mineral Resources, Socorro, NM, USA. Personal communication, 21 September 2021.
  46. Gates, J.; Stanley, W. Hydrologic Interpretations of Geophysical Data from the Southeastern Hueco Bolson, El Paso and Hudspeth Counties, Texas; Open-File Report 76-650; U.S. Geological Survey: Reston, VA, USA, 1976; 137p. [Google Scholar]
  47. Strain, W.S. Blancan Mammalian Fauna and Pleistocene Formations, Hudspeth County, Texas; Bulletin 10; University of Texas at Austin, Memorial Museum: Austin, TX, USA, 1966; 55p. [Google Scholar]
  48. Hibbs, B. Water quality and hydrogeologic issues along the City of El Paso-Ciudad Juárez corridor, international case study. Environ. Eng. Geosci. 1998, 5, 27–39. [Google Scholar]
  49. Heywood, C.E.; Yager, R.M. Simulated Ground-Water Flow in the Hueco Bolson, an Alluvial-Basin Aquifer System near El Paso, Texas; Water-Resources Investigations Report 02–4108; U.S. Geological Survey: Reston, VA, USA, 2003; 73p. [Google Scholar] [CrossRef]
  50. Hutchison, B.; Hibbs, B. Groundwater budget and isotopic analysis of cross formational flow in an arid basin. Ground Water J. 2008, 46, 384–395. [Google Scholar] [CrossRef] [PubMed]
  51. Eastoe, C.; Hutchison, W.; Hibbs, B.; Hawley, J.; Hogan, J. Interaction of a river with an alluvial basin aquifer, stable isotopes, salinity, and water budgets. J. Hydrol. 2010, 395, 67–78. [Google Scholar] [CrossRef]
  52. Audsley, G. Records of Wells and Results of Exploratory Drilling in the El Paso Valley and Hueco Bolson Southeast of El Paso, Texas; Open-File Rept.; U.S. Geol. Survey: Reston, VA, USA, 1959; 144p. [Google Scholar]
  53. Holser, W.T. Trace elements and isotopes in evaporites. In Marine Minerals; Burns, R.G., Ed.; Mineralogical Society of America: Washington, DC, USA, 1979; pp. 295–346. [Google Scholar]
  54. Davis, S.N.; Whittemore, D.O.; Martin, J.F. Use of Chloride/Bromide Ratios in Studies of Potable Water. Groundwater 1998, 36, 338–350. [Google Scholar] [CrossRef]
  55. Alcalá, F.J.; Custodio, E. Using the Cl/Br ratio as a natural tracer to identify the origin of salinity in aquifers in Spain and Portugal. J. Hydrol. 2008, 359, 198–207. [Google Scholar] [CrossRef]
  56. Mills, S.K. Quantifying Salinization of the Rio Grande Using Environmental Tracers: Socorro, N. Mex. Master’s Thesis, New Mexico Institute of Mining and Technology, Socorro, NM, USA, 2003; 397p. [Google Scholar]
  57. Dadakis, J. Isotopic and Geochemical Characterization of Recharge and Salinity Is a Shallow Floodplain Aquifer Near El Paso Texas; The University of Arizona: Tucson, AZ, USA, 2004. [Google Scholar]
  58. Merino, M. Source Determination of Groundwater Salinity in the Rio Grande Alluvial Aquifer, El Paso Valley, Texas. Master’s Thesis, California State University, Los Angeles, CA, USA, 2006, (unpublished). [Google Scholar]
  59. Hibbs, B.; Merino, M. Reinterpreting models of slope front recharge in a desert basin. Geosci. J. 2020, 10, 297. [Google Scholar] [CrossRef]
  60. Eastoe, C.; Hibbs, B.; Merino, M.; Dadakis, J. Origins of salinity in groundwater and surface water of the agricultural Rio Grande floodplain, Texas, USA and Chihuahua, Mexico, the case of sulfate. Hydrol. J. 2022, 9, 95. [Google Scholar] [CrossRef]
  61. Pfaff, J.; Hautman, D.; Munch, D. Method 300.1, Determination of Inorganic Anions in Drinking Water by Ion Chromatography, Revision 1.0; National Exposure Research Laboratory, Office of Research and Development, U.S. Environmental Protection Agency: Cincinnati, OH, USA, 1997; 40p. [Google Scholar]
  62. Hibbs, B.; Boghici, R.; Hayes, M.; Ashworth, J.; Hanson, A.; Samani, Z.; Kennedy, J.; Creel, B. Transboundary Aquifers of the El Paso/Ciudad Juarez/Las Cruces Region; Technical contract report prepared for the U.S. Environmental Protection Agency; Texas Water Development Board and New Mexico Water Resources Research Institute: Austin, TX, USA, 1997; 148p. [Google Scholar]
  63. CIEPS. Engineers, Consultants, and Planners, Mexico City, D.F. Study of the Technical, Economic, Social, and Financial Feasibility of Rehabilitation of the Irrigation District, Juárez Valley, Chihuahua; Texas Water Development Board: Austin, TX, USA, 1970. [Google Scholar]
  64. Deverel, S.J.; Fio, J.L. Groundwater flow and solute movement to drain lateral, western San Joaquin Valley, California, 1, Geochemical assessment. Water Resour. Res. 1991, 279, 2233–2246. [Google Scholar] [CrossRef]
  65. Fio, J.L. Calculation of a Water Budget and Delineation of Contributing Sources to Drainflow in the Western San Joaquin Valley, California; Open File Rep94-45; U.S. Geological Survey: Reston, VA, USA, 1994; Volume 39. [Google Scholar]
  66. Fio, J.L.; Leighton, D.A. Effects of Groundwater Chemistry and Flow on Quality of Drainflow in the Western San Joaquin Valley, California; Open File Rep. 94-72; U.S. Geological Survey: Reston, VA, USA, 1994; Volume 28. [Google Scholar]
  67. Phillips, F.; Hogan, J.; Mills, S.; Hendrickx, J. Environmental tracers applied to quantifying causes of salinity in arid-region rivers, preliminary results from the Río Bravo, southwestern USA. In Water Resources Perspectives, Evaluation, Management and Policy; Alsharhan, A., Wood, W., Eds.; Elsevier Science: Amsterdam, The Netherlands, 2003; pp. 327–334. [Google Scholar]
  68. Hogan, J.; Phillips, F.M.; Mills, S.K.; Hendrickx, J.M.H.; Ruiz, J.; Chesley, J.T.; Asmerom, Y. Geologic origins of salinization in a semi-arid river: The role of sedimentary basin brines. Geology 2007, 35, 1063–1066. [Google Scholar] [CrossRef]
  69. Deverel, S.J.; Fio, J.L. Ground-Water Flow and Solute Movement to Drain Laterals, Western San Joaquin Valley, California. I. Geochemical Assessment; Open-File Report 90-136; U.S. Geological Survey: Reston, VA, USA, 1990; 23p. [Google Scholar]
  70. Cortez, B.; The El Paso County Water Improvement District, Clint, TX, USA. Personal communication, 16 September 2021.
Figure 1. Study area location map depicting the investigated areas within the Rio Grande floodplain of the El Paso Valley, from the City of Socorro to Fort Quitman.
Geosciences 14 00066 g001
Figure 2. Saline evaporite playa conditions prevail in the Fabens Artesian Zone (panel (a), and marked as 2 in the location map (b)). The groundwater salinity in the Rio Grande Aquifer within the study area follows two distinct Rio Grande project water enrichment lines, represented by red lines (c). In areas where cross-formational leakage occurs from the Hueco Bolson Aquifer, such as in the Fabens Artesian Zone (a,b), the groundwater in the Rio Grande Aquifer undergoes an upward shift on the Cl vs. SO4 plot (c), indicated by blue arrows, relative to the Rio Grande project water enrichment (red) lines. This shift is attributed to the predominance of chloride over sulfate in salt leached from playa evaporite deposits beneath the Rio Grande Aquifer (d). These deposits create highly saline, chloride-dominated groundwater, as illustrated by blue squares (d) [40]. This source of salinity leads to a significant shift in many groundwater samples above the Rio Grande project water enrichment line (c,d) [41]. The trend lines in c are vital for understanding the bias addressed in this paper. Key for map b: 1 is the area irrigated by Project Water from EPCWID1; 2 is an artesian area where saline groundwater upwells from the Hueco Bolson strata; 3 is the HCCRD1 area.
Geosciences 14 00066 g002
Figure 3. Data from 1960 to 1975 in the TWDB database were plotted for the Rio Grande Aquifer both above and below the Fabens Artesian area. In this dataset, most data points above the Fabens Artesian area align closely with the project water enrichment lines (Figure 2). The enrichment line transitions to a chloride-dominated trend from Fabens Artesian Zone to Fort Quitman. More than half of the 1960–1975 data below Fabens Artesian area (red symbols) exhibit chloride and sulfate concentrations exceeding 1000 mg/L.
Geosciences 14 00066 g003
Figure 4. Trends in the 2003 data collected by Dadakis (2004) [57]. In this dataset, most data points above the Fabens Artesian Zone align closely with the project water enrichment lines (Figure 2). Below the Fabens Artesian Zone, a distinct contrast is evident between the 1960–1975 and 2003 datasets (compare data graphs in Figure 3 and Figure 4). More than half of the 1960–1975 data below the Fabens Artesian Zone exhibit chloride and sulfate concentrations exceeding 1000 mg/L, whereas only two such samples were identified in 2003.
Geosciences 14 00066 g004
Figure 5. The data depicted in this plot, collected from agricultural drains, springs, and hand-auger wells between late 2003 and 2006, reveal significantly higher salinities compared to the 2003 water well data (Figure 4). About 60% of these samples exhibit concentrations exceeding 1000 mg/L for both chloride (Cl) and sulfate (SO4), with nearly all surpassing 500 mg/L for both anions. In contrast, more than half of the groundwater well samples from the 2003 dataset are below 500 mg/L, and almost all are below 1000 mg/L for Cl and SO4 (Figure 4). Analysis of groundwater data collected for hand-auger wells indicates that all groundwater samples exhibit chloride and sulfate concentrations well above 1000 mg/L, along with Cl/SO4 weight ratios exceeding 1.0.
Geosciences 14 00066 g005
Figure 6. Sampling results for the Rio Grande Aquifer, April 2018 and February 2022, focusing on the artesian area around Fabens and Tornillo, and extending into Hudspeth County. The majority of samples were collected from drains, except for Well IDP, a large-diameter well casing reaching a depth of 50 ft (15.2 m). Bromide was included in the analysis dataset to differentiate the halite dissolution signature from agricultural salinity. Halite dissolution sources were identified when Cl/Br weight ratios in water samples exceeded 950. Samples with lower Cl/Br ratios under 900 (represented by black dots) primarily aligned with or were close to the Rio Grande Project Water Enrichment lines (Figure 2). The samples with black dots exhibited concentrations below 1000 mg/L for Cl and SO4 and were located furthest from the Fabens Artesian Zone where Hibbs Well Nest is situated. Samples with Cl/Br weight ratios above 960 are generally plotted above the 1:1 Cl/SO4 weight ratio line, with concentrations usually exceeding 1000 mg/L for both Cl and SO4. Some drain samples in the lower part of Hudspeth County displayed extremely high salinity, with one sample reaching 12,546 mg/L Cl and 8744 mg/L SO4. Overall, these samples indicate higher salinity in groundwater samples than what was found in the 2003 dataset [57].
Geosciences 14 00066 g006
Figure 7. Location map depicting drains 53 and 54, as investigated by Szynkiewicz et al. (2015) [40] between Fabens and Tornillo. The map also highlights the sampling sites identified by Hibbs and Merino (2006) [41] at a well nest and Island Drain. The geologic origin of salinity at drain stations 1 to 5 is linked to a source identified at the shallowest well (150 to 250 ft; 45.7 to 76.2 m) within the well nest, where an artesian flow system is present (Figure 1 and Figure 2). Notably, in 2004 and 2022, there was a significant increase in salinity parameters along the Island Drain, attributed to saline groundwater inflow from a geologic source. It is imperative to consider spatial variations in salinity along drains when analyzing groundwater salinity, especially when drains are utilized to supplement groundwater salinity data.
Geosciences 14 00066 g007
Figure 8. Sulfate vs. chloride data from drain stations 53 and 54, as reported by Szynkiewicz et al. (2015) [40] in the Fabens–Tornillo area, are compared. Additionally, irrigation project water data from IBWC (1996 to 2006) is included in the plot. At drain 53, two dilute samples are identified as mostly overflows of project water into the drain (a). These outlier samples are excluded when calculating the 5-sample average for drain 53. The trend lines representing the 5-sample and 7-sample averages from drain 53 to drain 54 illustrate chloride enrichment relative to sulfate between these drain stations (b). The chloride enrichment comes from upwelling of saline artesian water (Figure 2).
Geosciences 14 00066 g008
Figure 9. During the irrigation season, tailwater from irrigated fields can flow directly into agricultural drains as surface runoff, while project water at the end of canal laterals is consistently diverted into drains once agricultural demands are met. In non-irrigation seasons, drain flows primarily consist of groundwater baseflows, offering more accurate estimates of groundwater input. The graphs present time-series data for sulfate and chloride, sourced from Szynkiewicz et al. (2015) [40], focusing on two drain stations located between Fabens and Tornillo. Mean sulfate and chloride concentrations for irrigation water (IBWC, https://ibwc.gov/Water_Data/water_bulletins.html; accessed on 21 June 2022) are highlighted by dashed red lines. Notably, dilute waters @ drain 53 (Figure 8) closely align with the dashed red lines during the irrigation season. While sulfate remains relatively stable between drain stations 53 and 54 in the absence of irrigation, the increase in chloride concentration is more pronounced. These data reflect the chloride-enriched geological source from the Fabens Artesian Zone identified by Hibbs and Merino (2006) [41] and Merino (2006) [58].
Geosciences 14 00066 g009
Disclaimer/Publisher’s Note: The statements, opinions and data contained in all publications are solely those of the individual author(s) and contributor(s) and not of MDPI and/or the editor(s). MDPI and/or the editor(s) disclaim responsibility for any injury to people or property resulting from any ideas, methods, instructions or products referred to in the content.

