

Features of Soil Organic Carbon Transformations in the Southern Area of the East European Plain

 ,
,  , and
, and
Abstract
:1. Introduction
- Mathematical simulation of humus formation processes and loss in the context of the dynamics of the hydrothermal regime;
- A study of the dependencies between carbon flows in the atmosphere–soil body system and the initial carbon content;
- Mathematical simulation of the process of the humic content change in ploughed soils with consideration of the soil/landscape parameters;
- In addition to the focused studies of the formation of humic substances ensuring stabilization of organic matter in the soil, evaluation of other mechanisms providing SOM with integrity, stability, and protection against decay;
- A quantitative assessment of the contribution of the granulometric potential and colloid-mineral fraction in soil mineralogy to humus accumulation;
- Assessment of the role of different levels of the structural soil organization (macroaggregate and microaggregate) in the rate of carbon fixation.
2. Materials and Methods
2.1. GIS Mapping of Energy Costs for Soil Formation
2.2. Physical and Chemical Analyzes of Soils
2.3. Physical and Chemical Analyzes of Soils Sampling
2.4. Statistical Processing of Data on the Corg Content
3. Results and Discussion
3.1. Territorial Features of the Formation of SOM in the Chernozem Belt (According to the Reference Historical Database)
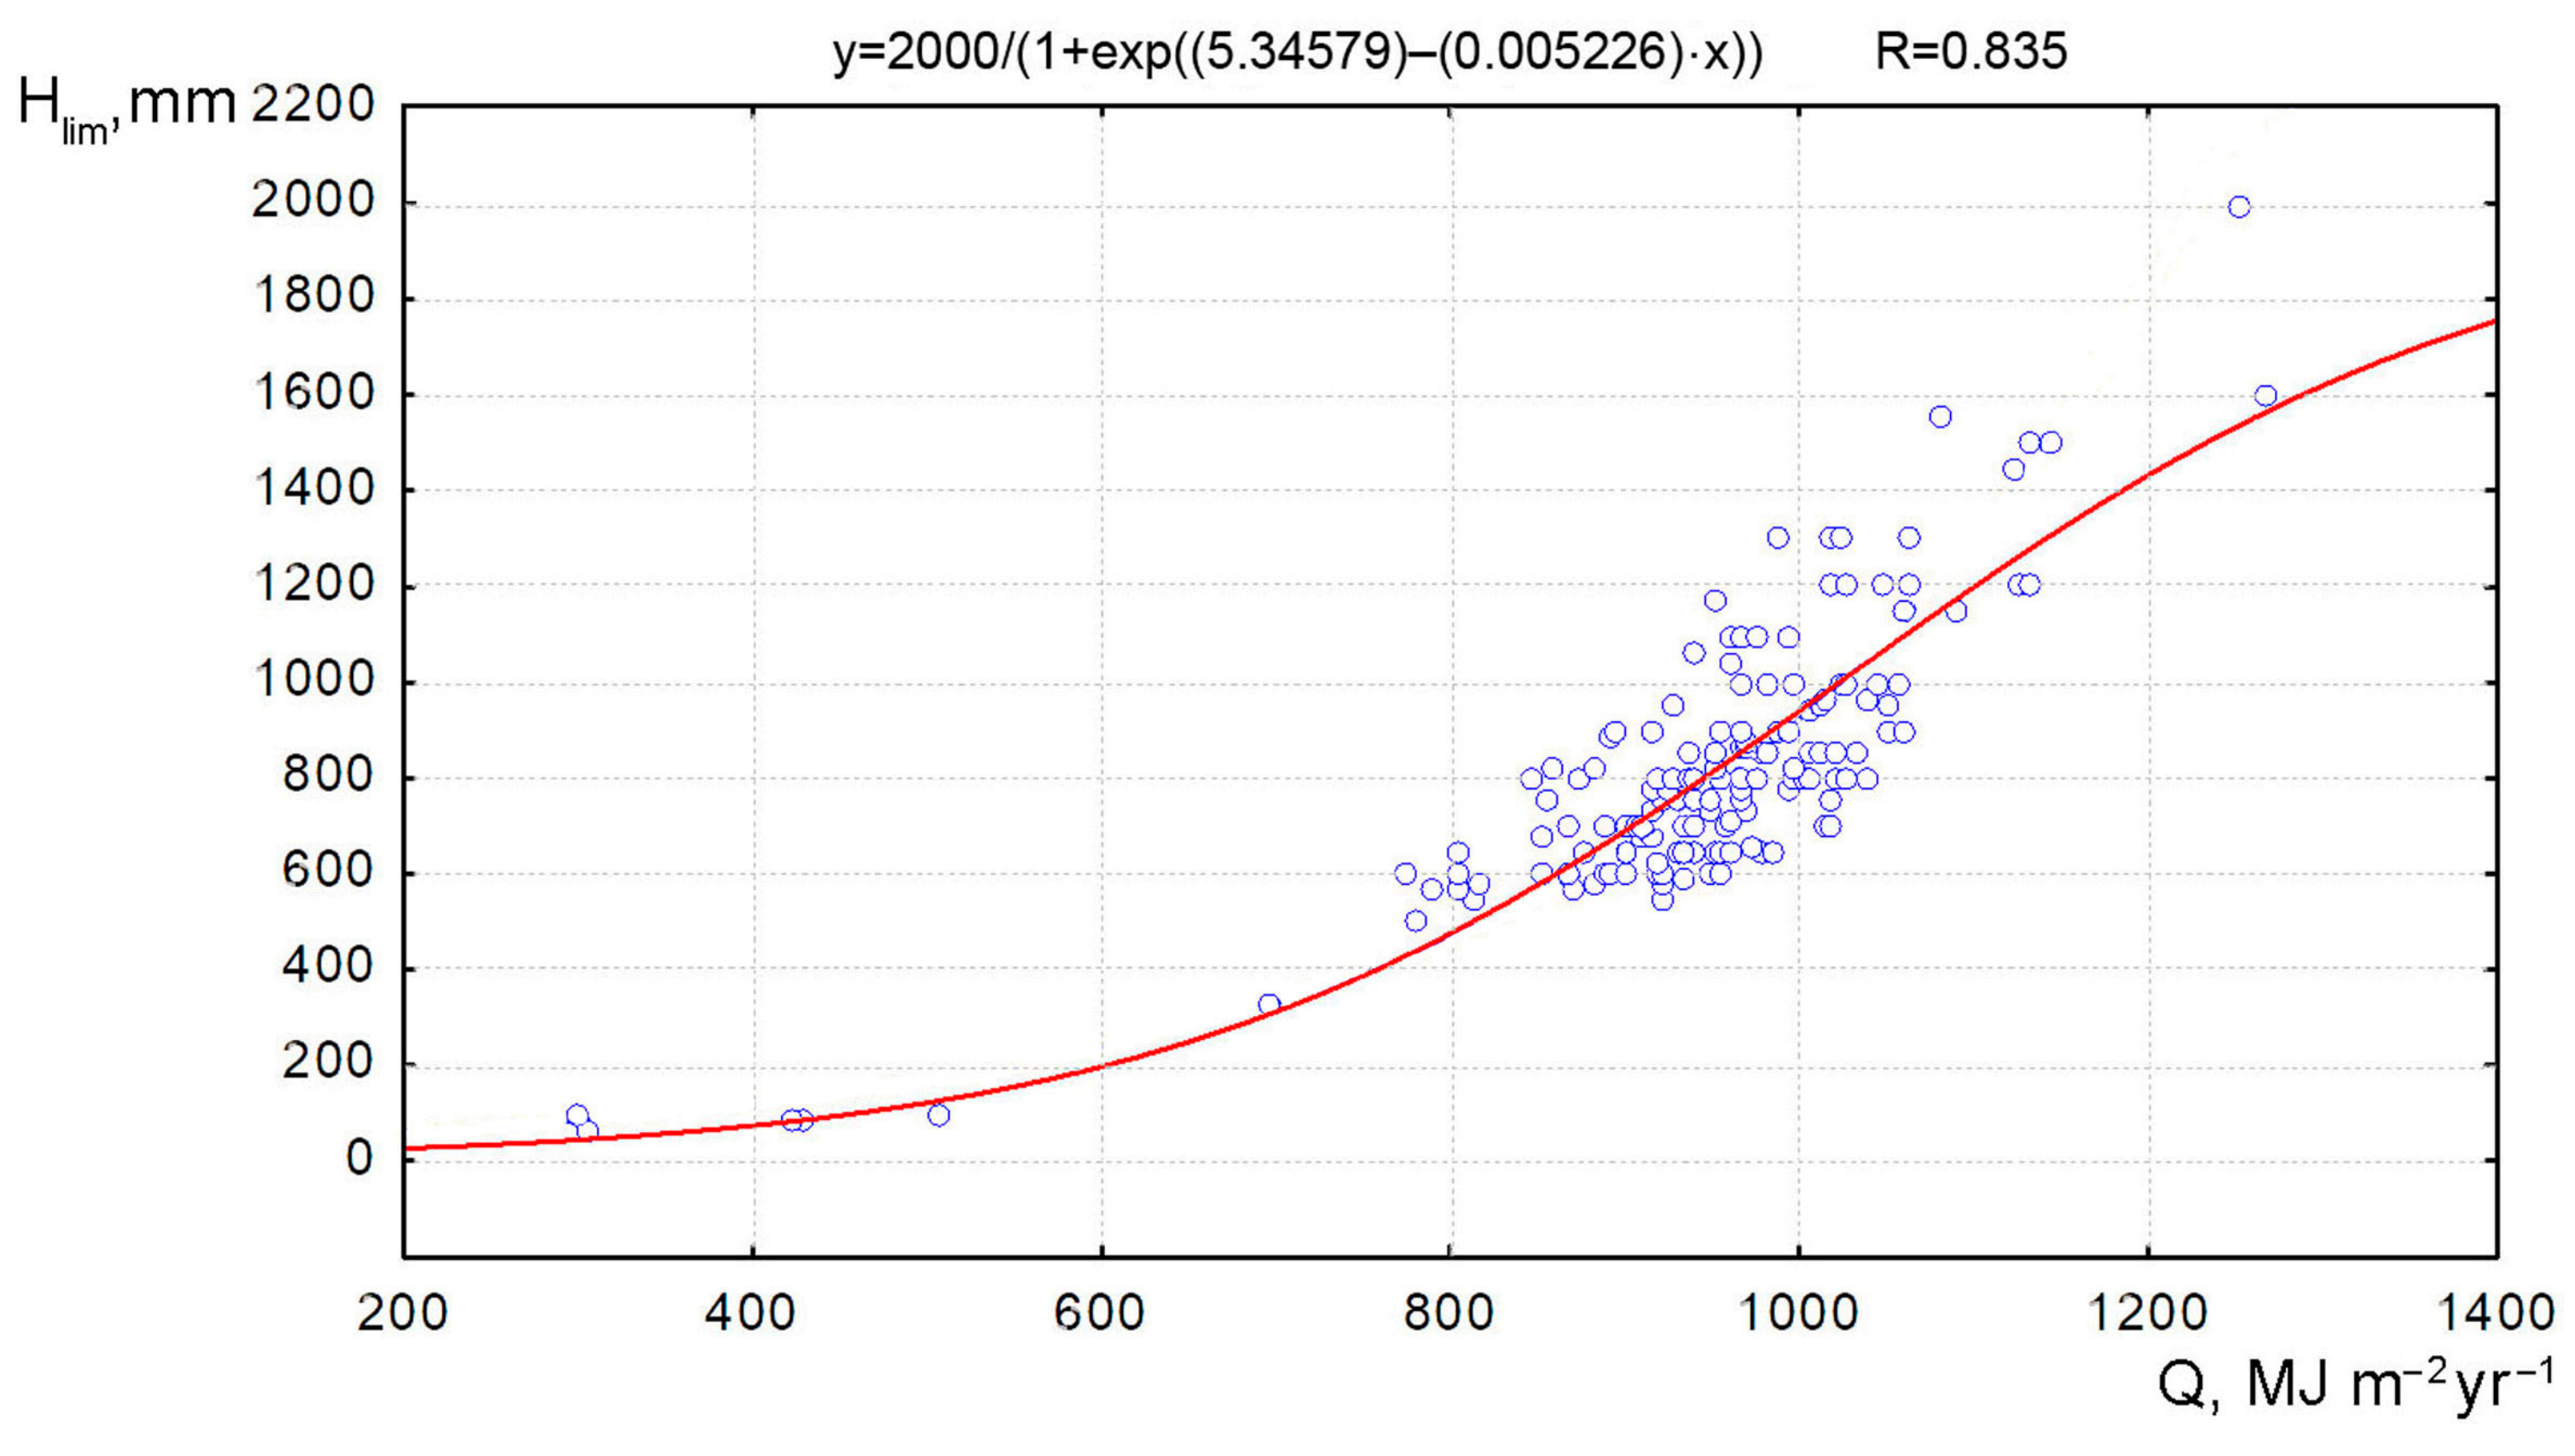
3.2. Climatic Prerequisites for Pedogenesis and the Formation of Humus Profiles in Chernozems
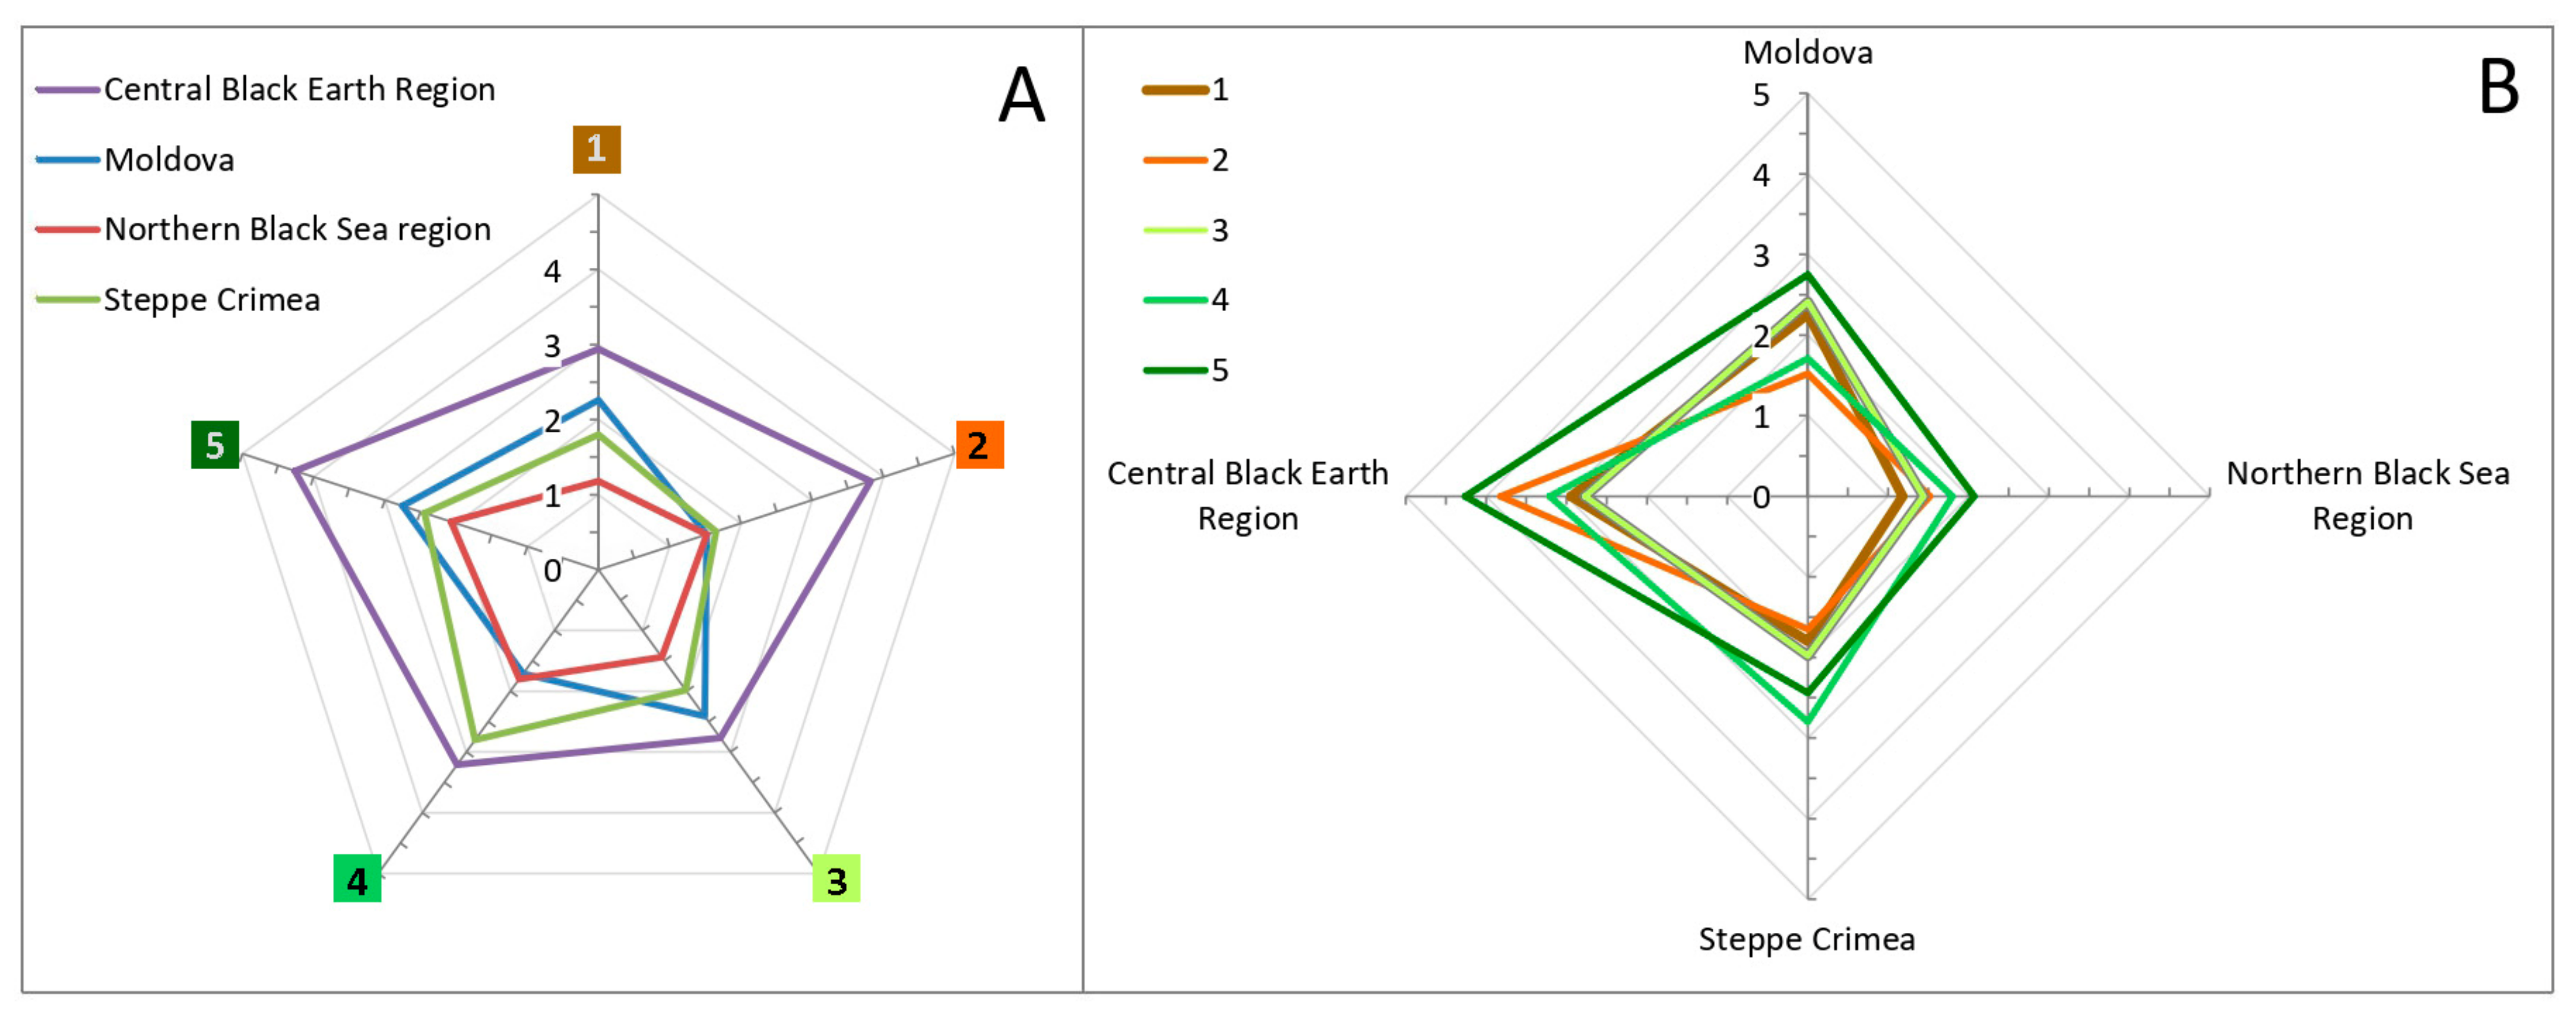
3.3. Statistical Assessment of Differences in the SOC Content in the Regions of the Chernozem Belt and Types of Land Use
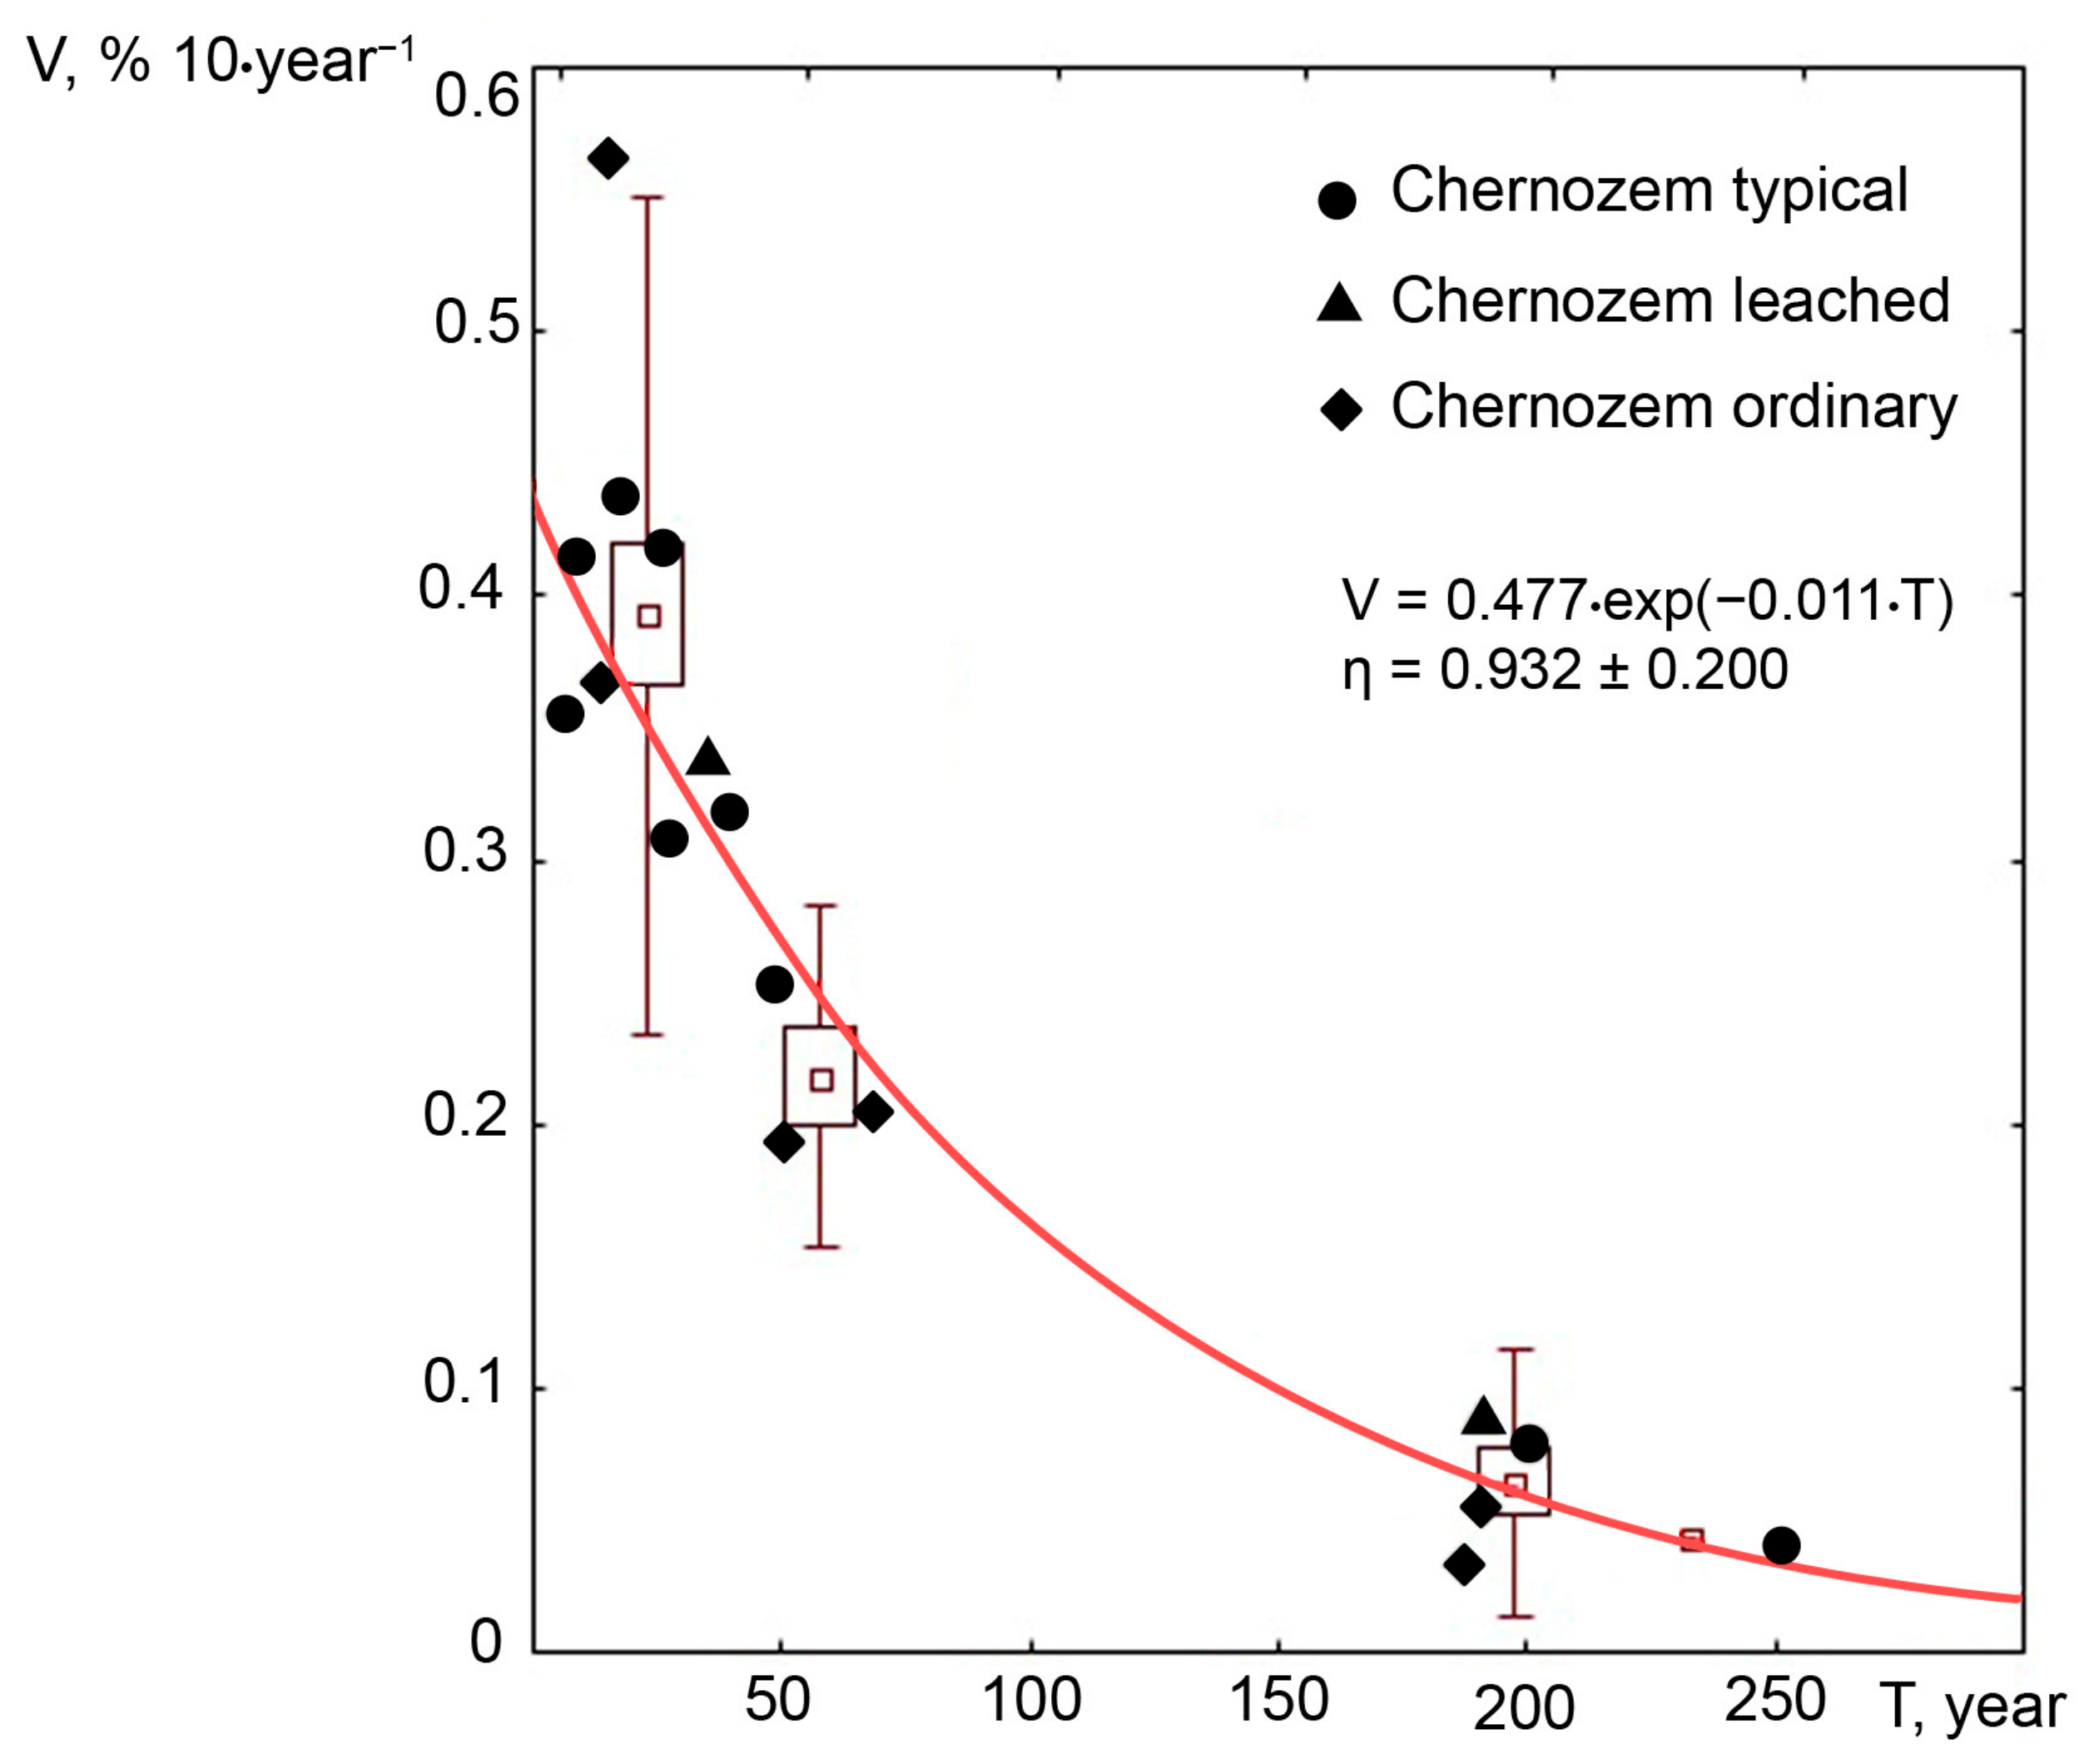
3.4. Key Features of the SOM Degradation Process as a Result of Plowing
3.5. Soil Carbon Sequestration
3.6. Evaluation of the Aggregating Efficiency of Corg for Different Types of Land Use
3.7. Reproduction of SOM with Different Reserves of Plant Matter
3.8. Comparative Analysis of the Agrogenic Series of Chernozems with Different Times of Arable and Fallow Regimes
4. Conclusions
Author Contributions
Funding
Data Availability Statement
Conflicts of Interest
References
- Batjes, N.H. Total carbon and nitrogen in the soils of the world. Eur. J. Soil Sci. 2014, 65, 10–21. [Google Scholar] [CrossRef]
- Lal, R. Digging deeper: A holistic perspective of factors affecting soil organic carbon sequestration in agroecosystems. Glob. Chang. Biol. 2018, 24, 3285–3301. [Google Scholar] [CrossRef] [PubMed]
- Jungkunst, H.F.; Göpel, J.; Horvath, T.; Ott, S.; Brunn, M. Global soil organic carbon–climate interactions: Why scales matter. WIREs Clim. Chang. 2022, 13, e780. [Google Scholar] [CrossRef]
- Lal, R.; Monger, C.; Nave, L.; Smith, P. The role of soil in regulation of climate. Phil. Trans. R. Soc. B 2021, 376, 20210084. [Google Scholar] [CrossRef]
- Lal, R. Accelerated soil erosion as a source of atmospheric CO2. Soil Tillage Res. 2019, 188, 35–40. [Google Scholar] [CrossRef]
- Prăvălie, R.; Nita, I.A.; Patriche, C.; Niculiță, M.; Birsan, M.V.; Roșca, B.; Bandoc, G. Global changes in soil organic carbon and implications for land degradation neutrality and climate stability. Environ. Res. 2021, 201, 111580. [Google Scholar] [CrossRef]
- Wiesmeier, M.; Urbanski, L.; Hobley, E.; Lang, B.; von Lützow, M.; Marin-Spiotta, E.; van Wesemael, B.; Rabot, E.; Ließ, M.; Garcia-Franco, N.; et al. Soil organic carbon storage as a key function of soils—A review of drivers and indicators at various scales. Geoderma 2019, 333, 149–162. [Google Scholar] [CrossRef]
- Nayak, N.; Mehrotra, R.; Mehrotra, S. Carbon biosequestration strategies: A review. Carbon Capture Sci. Technol. 2022, 4, 100065. [Google Scholar] [CrossRef]
- The International “4 per 1000” Initiative. Soils for Food Security and Climate. Available online: https://4p1000.org/ (accessed on 27 July 2023).
- Demenois, J.; Torquebiau, E.; Arnoult, M.H.; Eglin, T.; Masse, D.; Assouma, M.H.; Blanfort, V.; Chenu, C.; Chapuis-Lardy, L.; Medoc, J.M.; et al. Barriers and strategies to boost soil carbon sequestration in agriculture. Front. Sustain. Food Syst. 2020, 4, 37. [Google Scholar] [CrossRef]
- Rumpel, C.; Amiraslani, F.; Chenu, C.; Cardenas, M.G.; Kaonga, M.; Koutika, L.S.; Ladha, J.; Madari, B.; Shirato, Y.; Smith, P.; et al. The 4p1000 initiative: Opportunities, limitations and challenges for implementing soil organic carbon sequestration as a sustainable development strategy. Ambio 2020, 49, 350–360. [Google Scholar] [CrossRef]
- Baiamonte, G.; Gristina, L.; Orlando, S.; Palermo, S.S.; Minacapilli, M. No-till soil organic carbon sequestration patterns as affected by climate and soil erosion in the arable land of Mediterranean Europe. Remote Sens. 2022, 14, 4064. [Google Scholar] [CrossRef]
- Post, W.M.; Kwon, K.C. Soil carbon sequestration and land-use change: Processes and potential. Glob. Chang. Biol. 2000, 6, 317–327. [Google Scholar] [CrossRef]
- Hussain, S.; Hussain, S.; Guo, R.; Sarwar, M.; Ren, X.; Krstic, D.; Aslam, Z.; Zulifqar, U.; Rauf, A.; Hano, C.; et al. Carbon sequestration to avoid soil degradation: A review on the role of conservation tillage. Plants 2021, 10, 2001. [Google Scholar] [CrossRef] [PubMed]
- Tiefenbacher, A.; Sandén, T.; Haslmayr, H.P.; Miloczki, J.; Wenzel, W.; Spiegel, H. Optimizing carbon sequestration in croplands: A synthesis. Agronomy 2021, 11, 882. [Google Scholar] [CrossRef]
- Jiang, P.; Xiao, L.Q.; Wan, X.; Yu, T.; Liu, Y.F.; Liu, M.X. Research progress on microbial carbon sequestration in soil: A review. Eurasian Soil Sci. 2022, 55, 1395–1404. [Google Scholar] [CrossRef]
- Semenov, V.M.; Tulina, A.S.; Semenova, N.; Ivannikova, L.A. Humification and nonhumification pathways of the organic matter stabilization in soil: A review. Eurasian Soil Sci. 2013, 46, 355–368. [Google Scholar] [CrossRef]
- Semenov, V.M.; Kogut, B.M. Soil Organic Matter; GEOS: Moscow, Russia, 2015; ISBN 978-5-89118-702-3. (In Russian) [Google Scholar]
- Kogut, B.M.; Semenov, V.M. Estimation of soil saturation with organic carbon. Dokuchaev Soil Bull. 2020, 102, 103–124. [Google Scholar] [CrossRef]
- Kogut, B.M.; Semenov, V.M.; Artemyeva, Z.S.; Danchenko, N.N. Humus depletion and soil carbon sequestration. Agrohimia 2021, 5, 3–13. (In Russian) [Google Scholar] [CrossRef]
- Ivanov, A.L.; Savin, I.Y.; Stolbovoy, V.S.; Dukhanin, A.Y.; Kozlov, D.N.; Bamatov, I.M. Global climate and soil cover–implications for land use in Russia. Dokuchaev Soil Bull. 2021, 107, 5–32. [Google Scholar] [CrossRef]
- Abakumov, E.; Polyakov, V. Carbon polygons and carbon offsets: Current state, key challenges and pedological aspects. Agronomy 2021, 11, 2013. [Google Scholar] [CrossRef]
- Volobuev, V.R. Introduction to the Energetics of Soil Formation; Nauka: Moscow, Russia, 1974. (In Russian) [Google Scholar]
- Goleusov, P.V.; Lisetskii, F.N. Regeneration of Soils in Anthropogenically Disturbed Landscapes of Forest-Steppe Zone; GEOS: Moscow, Russia, 2009; ISBN 978-5-89118-495-4. (In Russian) [Google Scholar]
- Munsell, A.H. Munsell Soil Color Charts; Gretag Macbeth: New Windsor, NY, USA, 2000. [Google Scholar]
- Lisetskii, F.N.; Goleusov, P.V.; Chepelev, O.A. The development of Chernozems on the Dniester–Prut interfluve in the Holocene. Eurasian Soil Sci. 2013, 46, 491–504. [Google Scholar] [CrossRef]
- Lisetskii, F.N. Agrogenic transformation of soils in the dry steppe zone under the impact of antique and recent land management practices. Eurasian Soil Sci. 2008, 41, 805–817. [Google Scholar] [CrossRef]
- Lisetskii, F.N.; Rodionova, M.E. Transformation of dry-steppe soils under long-term agrogenic impacts in the area of ancient Olbia. Eurasian Soil Sci. 2015, 48, 347–358. [Google Scholar] [CrossRef]
- Lisetskii, F.N.; Stolba, V.F.; Goleusov, P.V. Modeling of the evolution of steppe Chernozems and development of the method of pedogenetic chronology. Eurasian Soil Sci. 2016, 49, 846–858. [Google Scholar] [CrossRef]
- Goleusov, P.V.; Lisetskii, F.N. Soil development in anthropogenically disturbed forest-steppe landscapes. Eurasian Soil Sci. 2008, 41, 1480–1486. [Google Scholar] [CrossRef]
- Krupenikov, I.A.; Makhlin, T.B.; Polyak, Z.I.; Shilikhina, I.I.; Entenzon, M.M. Statistical Parameters of the Composition and Properties of Soils in Moldova; Part 1; Shtiintsa: Kishinev, Moldova, 1978. (In Russian) [Google Scholar]
- Smekalova, T.N. Farmsteads of distant choir of Chersonese in north-western Taurica. In History & Archaeology of the Crimea; Mayko, V.V., Ed.; Crimean Branch of the Institute of Archeology: Simferopol, Russia, 2014; Volume 1, pp. 309–322. (In Russian) [Google Scholar]
- Kutaisov, V.A.; Smekalova, T.N. Coastal geoarchaeology of Kerkinitis (N orthwestern Crimea). Mediterranee 2016, 126, 79–89. [Google Scholar] [CrossRef]
- Stolba, V.F.; Andresen, J. Archaeological surveys and replicability of their results: A case study from West Crimea. In Environment and Habitation around the Ancient Black Sea; Braund, D., Stolba, V.F., Ulrike, P., Eds.; De Gruyter: Berlin, Germany; Boston, MA, USA, 2021; pp. 235–254. [Google Scholar] [CrossRef]
- Maslennikov, A. King’s chora of the Bosporus in late 5th–early 4th c. BC (On the localization). Vestnik Drevnei Istorii 2001, 236, 178–190. (In Russian) [Google Scholar]
- Garbuzov, G.P. Quantification of arable land in the Bosphorus region during antiquity. Mediterranee 2016, 126, 101–109. [Google Scholar] [CrossRef]
- Kryžickiy, S.D. The rural environs of Olbia: Some problems of current importance. In Surveying the Greek Chora: The Black Sea Region in a Comparative Perspective (Black Sea Studies); Bilde, P.G., Stolba, V.F., Eds.; Aarhus University Press: Aarhus, Denmark, 2006; pp. 99–114. [Google Scholar]
- IUSS Working Group WRB. World reference base for soil resources 2006: A framework for international classification, correlation and communication. In World Soil Resources Reports; FAO: Rome, Italy, 2006; Volume 103. [Google Scholar]
- Liu, X.; Lee Burras, C.; Kravchenko, Y.S.; Duran, A.; Huffman, T.; Morras, H.; Studdert, G.; Zhang, X.; Cruse, R.M.; Yuan, X. Overview of Mollisols in the world: Distribution, land use and management. Canadian J. Soil Sci. 2012, 92, 383–402. [Google Scholar] [CrossRef]
- Orlov, D.S.; Sadovnikova, L.K.; Sukhanova, N.I. Soil chemistry; Vysshaya Shkola: Moscow, Russia, 2005; ISBN 5-06-004428-5. (In Russian) [Google Scholar]
- Kogut, B.M. The organic matter of Chernozem. Dokuchaev Soil Bull. 2017, 90, 39–55. [Google Scholar] [CrossRef]
- Global Map of Black Soils. Available online: https://www.fao.org/global-soil-partnership/gbsmap/en/ (accessed on 27 July 2023).
- Dokuchaev, V.V. Schematic Map of the Chernozem Zone of European Russia. 1883. Available online: https://eurasian-soil-portal.info/maps/ru/chernozyomy-rossii/ (accessed on 27 July 2023). (In Russian).
- Kovda, V.A.; Samoilova, E.M. (Eds.) Russian Chernozem: 100 Years after Dokuchaev; Nauka: Moscow, Russia, 1983. (In Russian) [Google Scholar]
- Mordkovich, V.G. Zoological diagnostics of soils: Imperatives, purposes, and place within soil zoology and pedology. Biol. Bull. Rev. 2014, 4, 404–411. [Google Scholar] [CrossRef]
- Lisetskii, F.; Chepelev, O. Quantitative substantiation of pedogenesis model key components. Adv. Environ. Biol. 2014, 8, 996–1000. [Google Scholar]
- Makhlin, T.B.; Polyak, Z.I.; Shilikhina, I.I.; Entenson, M.M. Mathematical model of the profile distribution of humus in the soil. Soviet Soil Sci. 1981, 6, 27–37. (In Russian) [Google Scholar]
- Klenov, B.M.; Chimitdorzhieva, G.D. Effect of climate continentality on humus formation and elemental composition of humic acids of automorphic soils of Siberia. Contemp. Probl. Ecol. 2011, 4, 492–496. [Google Scholar] [CrossRef]
- Chendev, Y.G.; Smirnova, L.G.; Petin, A.N.; Kukharuk, N.S.; Novykh, L.L. Prolonged changes in humus content for arable Chernozems of Eastern European Plain center. Achievements Sci. Technol. AICis 2011, 8, 6–9. (In Russian) [Google Scholar]
- Biryukova, O.N.; Orlov, D.S.; Biryukov, M.V. Expected carbon doxide emission owing to mineralization of stable groups of humic substances from soils of Russia. Vestn. Mosk. Universiteta. Seriya 17 Pochvovedenie 2005, 3, 48–49. (In Russian) [Google Scholar]
- Krupenikov, I.A. Chernozems. In Emergence, Perfection, Tragedy of Degradation, Ways of Protection and Revival; Pontos: Chişinău, Moldova, 2008; ISBN 978-9975-102-66-7. (In Russian) [Google Scholar]
- Kudeyarov, V.N.; Khakimov, F.I.; Deeva, N.F.; Ilina, A.A.; Kuznetsova, T.V.; Timchenko, A.V. Evaluation of respiration of Russian soils. Eurasian Soil Sci. 1995, 1, 33–42. [Google Scholar]
- Giniyatullin, K.G.; Valeeva, A.A.; Smirnova, E.V.; Okunev, R.V.; Latipova, L.I. The organic matter of the different ages fallow Luvisols. In IOP Conference Series: Earth and Environmental Science; IOP Publishing: Bristol, UK, 2018; Volume 107, p. 012114. [Google Scholar] [CrossRef]
- Pichura, V.; Potravka, L.; Stratichuk, N.; Drobitko, A. Space-time modeling and forecasting steppe soil fertility using geo-information systems and neuro-technologies. Bulg. J. Agric. Sci. 2023, 29, 182–197. [Google Scholar]
- Artemyeva, Z.S.; Danchenko, N.N.; Kolyagin, Y.G.; Varlamov, E.B.; Zasukhina, E.S.; Tsomaeva, E.V.; Kogut, B.M. Chemical structure of organic matter of agrochernozems in different slope positions. Eurasian Soil Sci. 2023, 56, 705–714. [Google Scholar] [CrossRef]
- Sollins, P.; Homann, P.; Caldwell, B.A. Stabilization and destabilization of soil organic matter: Mechanisms and controls. Geoderma 1996, 74, 65–105. [Google Scholar] [CrossRef]
- Sollins, P.; Swanston, C.; Kleber, M.; Filley, T.; Kramer, M.; Crow, S.; Caldwell, B.A.; Lajtha, K.; Bowden, R. Organic C and N stabilization in a forest soil: Evidence from sequential density fractionation. Soil Biol. Biochem. 2006, 38, 3313–3324. [Google Scholar] [CrossRef]
- Pramod, J.; Biswas, A.K.; Subba, R.A. Carbon sequestration in agricultural soils: Evolving concepts, issues and strategies. In Carbon Management in Agriculture for Mitigating Greenhouse Effect; Singh, A.K., Ngachan, S.V., Munda, G.C., Mohapatra, K.P., Choudhury, B.U., Das Anup, R.S., Patel, D.P., et al., Eds.; ICAR Research Complex for NEH Region: Umiam, India, 2012; pp. 17–26. [Google Scholar]
- Kryshchenko, V.S.; Rybianets, T.V.; Kravtsova, N.Y.; Biriukova, O.A.; Zamulina, I.V. Monitoring changes in soil dispersity and humus content under increasingly arid climate conditions. Arid Ecosys. 2014, 4, 220–227. [Google Scholar] [CrossRef]
- Kaushal, S.; Sharma, N.; Singh, I.; Singh, H. Soil carbon sequestration: A step towards sustainability. Int. J. Plant Soil Sci. 2023, 35, 160–171. [Google Scholar] [CrossRef]
- Fokin, A.D. The role of plants in redistribution of substances along the soil profile. Eurasian Soil Sci. 1999, 32, 109–116. [Google Scholar]
- Snakin, V.V.; Kovach-Lang, E.; Bystritskaya, T.L.; Messaros-Draskovic, R.; Kalapos, T.; Kertes, M.; Prisyazhnaya, A.A.; Ena, M.; Smagin, A.V. Dynamics of Plant Matter and Modern Soil Processes in Herbaceous Ecosystems; Pushchino Science Center RAS: Pushchino, Russia, 1991. [Google Scholar]
- Kullman, A. Synthetische Bodenverbesserungsmittel; DLV: Berlin, Germany, 1972. (In German) [Google Scholar]
- Panova, I.G.; Ilyasov, L.O.; Khaidapova, D.D.; Ogawa, K.; Adachi, Y.; Yaroslavov, A.A. Polyelectrolytic gels for stabilizing sand soil against wind erosion. Polym. Sci. Ser. B 2020, 62, 491–498. [Google Scholar] [CrossRef]
- Sorochkin, V.M.; Orlova, L.P.; Kucheryaeva, E.V. Mechanism of aggregation of cultivated steppe-forest soils. Soviet Soil Sci. 1990, 6, 51–58. (In Russian) [Google Scholar]
- Kuznetsova, I.V. The content and composition of organic matter in Chernozems and its role in the formation of a water-stable structure. Eurasian Soil Sci. 1998, 31, 36–44. [Google Scholar]
- Dignac, M.F.; Derrien, D.; Barré, P.; Barot, S.; Cécillon, L.; Chenu, C.; Chevallier, T.; Freschet, G.T.; Garnier, P.; Guenet, B.; et al. Increasing soil carbon storage: Mechanisms, effects of agricultural practices and proxies: A review. Agron. Sustain. Dev. 2017, 37, 14–18. [Google Scholar] [CrossRef]
- Kavya, S.R.; Rani, B.; Banu, M.R.; Jabin, P.P. Carbon sequestration and stabilisation mechanisms in the agricultural soils: A review. Int. J. Plant Soil Sci. 2023, 35, 79–94. [Google Scholar] [CrossRef]
- Prakash, T.; Shimrah, T. A review on soil carbon sequestration in different land use and land cover. Ecol. Environ. Cons. 2023, 29, S332–S340. [Google Scholar] [CrossRef]
- Ilyin, V.S. About some plant communities of the reserve of the Steppe Biological Station named after Countess S.V. Panina. Proc. Imperial Petrograd Soc. Naturalists 1916, 46, 25–45. (In Russian) [Google Scholar]
- Poluyanov, A.V.; Zolotukhin, N.I.; Zolotukhina, I.B.; Filatova, T.D. The feather-grass steppes of the Veidelevka district of the Belgorod region. Bull. Bryansk Dep. Russ. Botanical Soc. 2015, 1, 55–62. (In Russian) [Google Scholar]
- Mengel, K.; Kirkby, E.A.; Kosegarten, H.; Appel, T. Principles of Plant Nutrition, 4th ed.; Springer: Dordrecht, The Netherlands, 2001. [Google Scholar] [CrossRef]
- McKee, M.; Brye, K.R.; Wood, L. Soil carbon sequestration across a chronosequence of tallgrass prairie restorations in the Ozark Highlands region of northwest Arkansas. AIMS Geosciences 2019, 5, 1–24. [Google Scholar] [CrossRef]
- Ivanov, M.M.; Gurinov, A.L.; Ivanova, N.N.; Konoplev, A.V.; Konstantinov, E.A.; Kuzmenkova, N.V.; Terskaya, E.V.; Golosov, V.N. Dynamics of 137Cs accumulation in the bottom sediments of the Sheckino Reservoir during post-Chernobyl period. Radiats. Biol. Radioekol. 2019, 59, 651–663. [Google Scholar] [CrossRef]
- Shumakov, A.N. Methodology for assessing the silting of ponds and reservoirs, taking into account the erosion-accumulation activity in their watersheds (on the example of the CCR). Vestn. Mosk. Univ. Seriya Geogr. 2007, 2, 76. (In Russian) [Google Scholar]
- Hassink, J. The capacity of soils to preserve organic C and N by their association with clay and silt particles. Plant Soil 1997, 191, 77–87. [Google Scholar] [CrossRef]
- Six, J.; Conant, R.T.; Paul, E.A.; Paustian, K. Stabilization mechanisms of soil organic matter: Implications for C-saturation of soils. Plant Soil 2002, 241, 155–176. [Google Scholar] [CrossRef]
- Terekhov, V.I.; Tarankov, V.I. Influence of slope exposure on carbon and oxygen balance in gully oak forests of the Kursk Oblast. Newsl. North-Cauc. Fed. Univ. 2011, 1, 100–104. (In Russian) [Google Scholar]


| No. | Region | Area (%) of SOC (%) Gradation | ||
|---|---|---|---|---|
| 0.5–2 | 2–4 | 4–7 | ||
| 1 | Central Black Earth Region | 15 | 41 | 44 |
| 2 | Moldova | 31 | 61 | 7 |
| 3 | Northern Black Sea Region | 58 | 42 | 0 |
| 4 | Steppe Crimea | 100 | 0 | 0 |
| No. | Region | P, mm | T, °C | RB, MJ m−2 yr−1 | Q, MJ m−2 yr−1 |
|---|---|---|---|---|---|
| 1 | Central Black Earth Region | 571 ± 23 | 8.1 ± 0.6 | 1920 ± 68 | 1120 ± 30 |
| 2 | Moldova | 512 ± 46 | 10.3 ± 0.8 | 2188 ± 97 | 1130 ± 45 |
| 3 | Northern Black Sea Region | 435 ± 17 | 10.6 ± 0.3 | 2222 ± 33 | 1014 ± 25 |
| 4 | Steppe Crimea | 426 ± 27 | 11.7 ± 0.3 | 2362 ± 41 | 1017 ± 51 |
| Land Use | Kruskal–Wallis H Statistic | df | p-Value |
|---|---|---|---|
| Arable land, <100 years | 56.30 | 3 | 3.60 × 10⁻¹² |
| Arable land, >100 years | 94.50 | 3 | 2.36 × 10⁻²⁰ |
| Fallow land, n·10 years | 24.40 | 3 | 2.02 × 10⁻⁵ |
| Fallow land, >100 years | 56.10 | 3 | 3.92 × 10⁻¹² |
| Virgin land | 41.40 | 3 | 5.28 × 10⁻⁹ |
| Pairs of Region Comparisons | Land Use | ||||
|---|---|---|---|---|---|
| Arable Land, >100 yrs | Arable Land, <100 yrs | Fallow Land, n × 10 yrs | Fallow Land, >100 yrs | Virgin Land | |
| Moldova-CBER | 9.64 × 10⁻⁹ | 4.42 × 10⁻⁹ | 1.00 | 4.82 × 10⁻⁷ | 0.0004 |
| NBSR-CBER | 1.31 × 10⁻¹¹ | 3.12 × 10⁻⁷ | 0.0001 | 6.69 × 10⁻⁷ | 1.75 × 10⁻⁶ |
| SC-CBER | 2.19 × 10⁻⁸ | 7.55 × 10⁻⁸ | 0.03 | 0.08 | 4.52 × 10⁻⁶ |
| NBSR-Moldova | 1.03 × 10⁻⁸ | 1.00 | 0.004 | 1.00 | 0.16 |
| SC-Moldova | 4.77 × 10⁻⁵ | 0.81 | 0.49 | 2.20 × 10⁻⁶ | 1.00 |
| SC-NBSR | 1.49 × 10⁻⁵ | 1.00 | 0.12 | 1.46 × 10⁻⁵ | 0.11 |
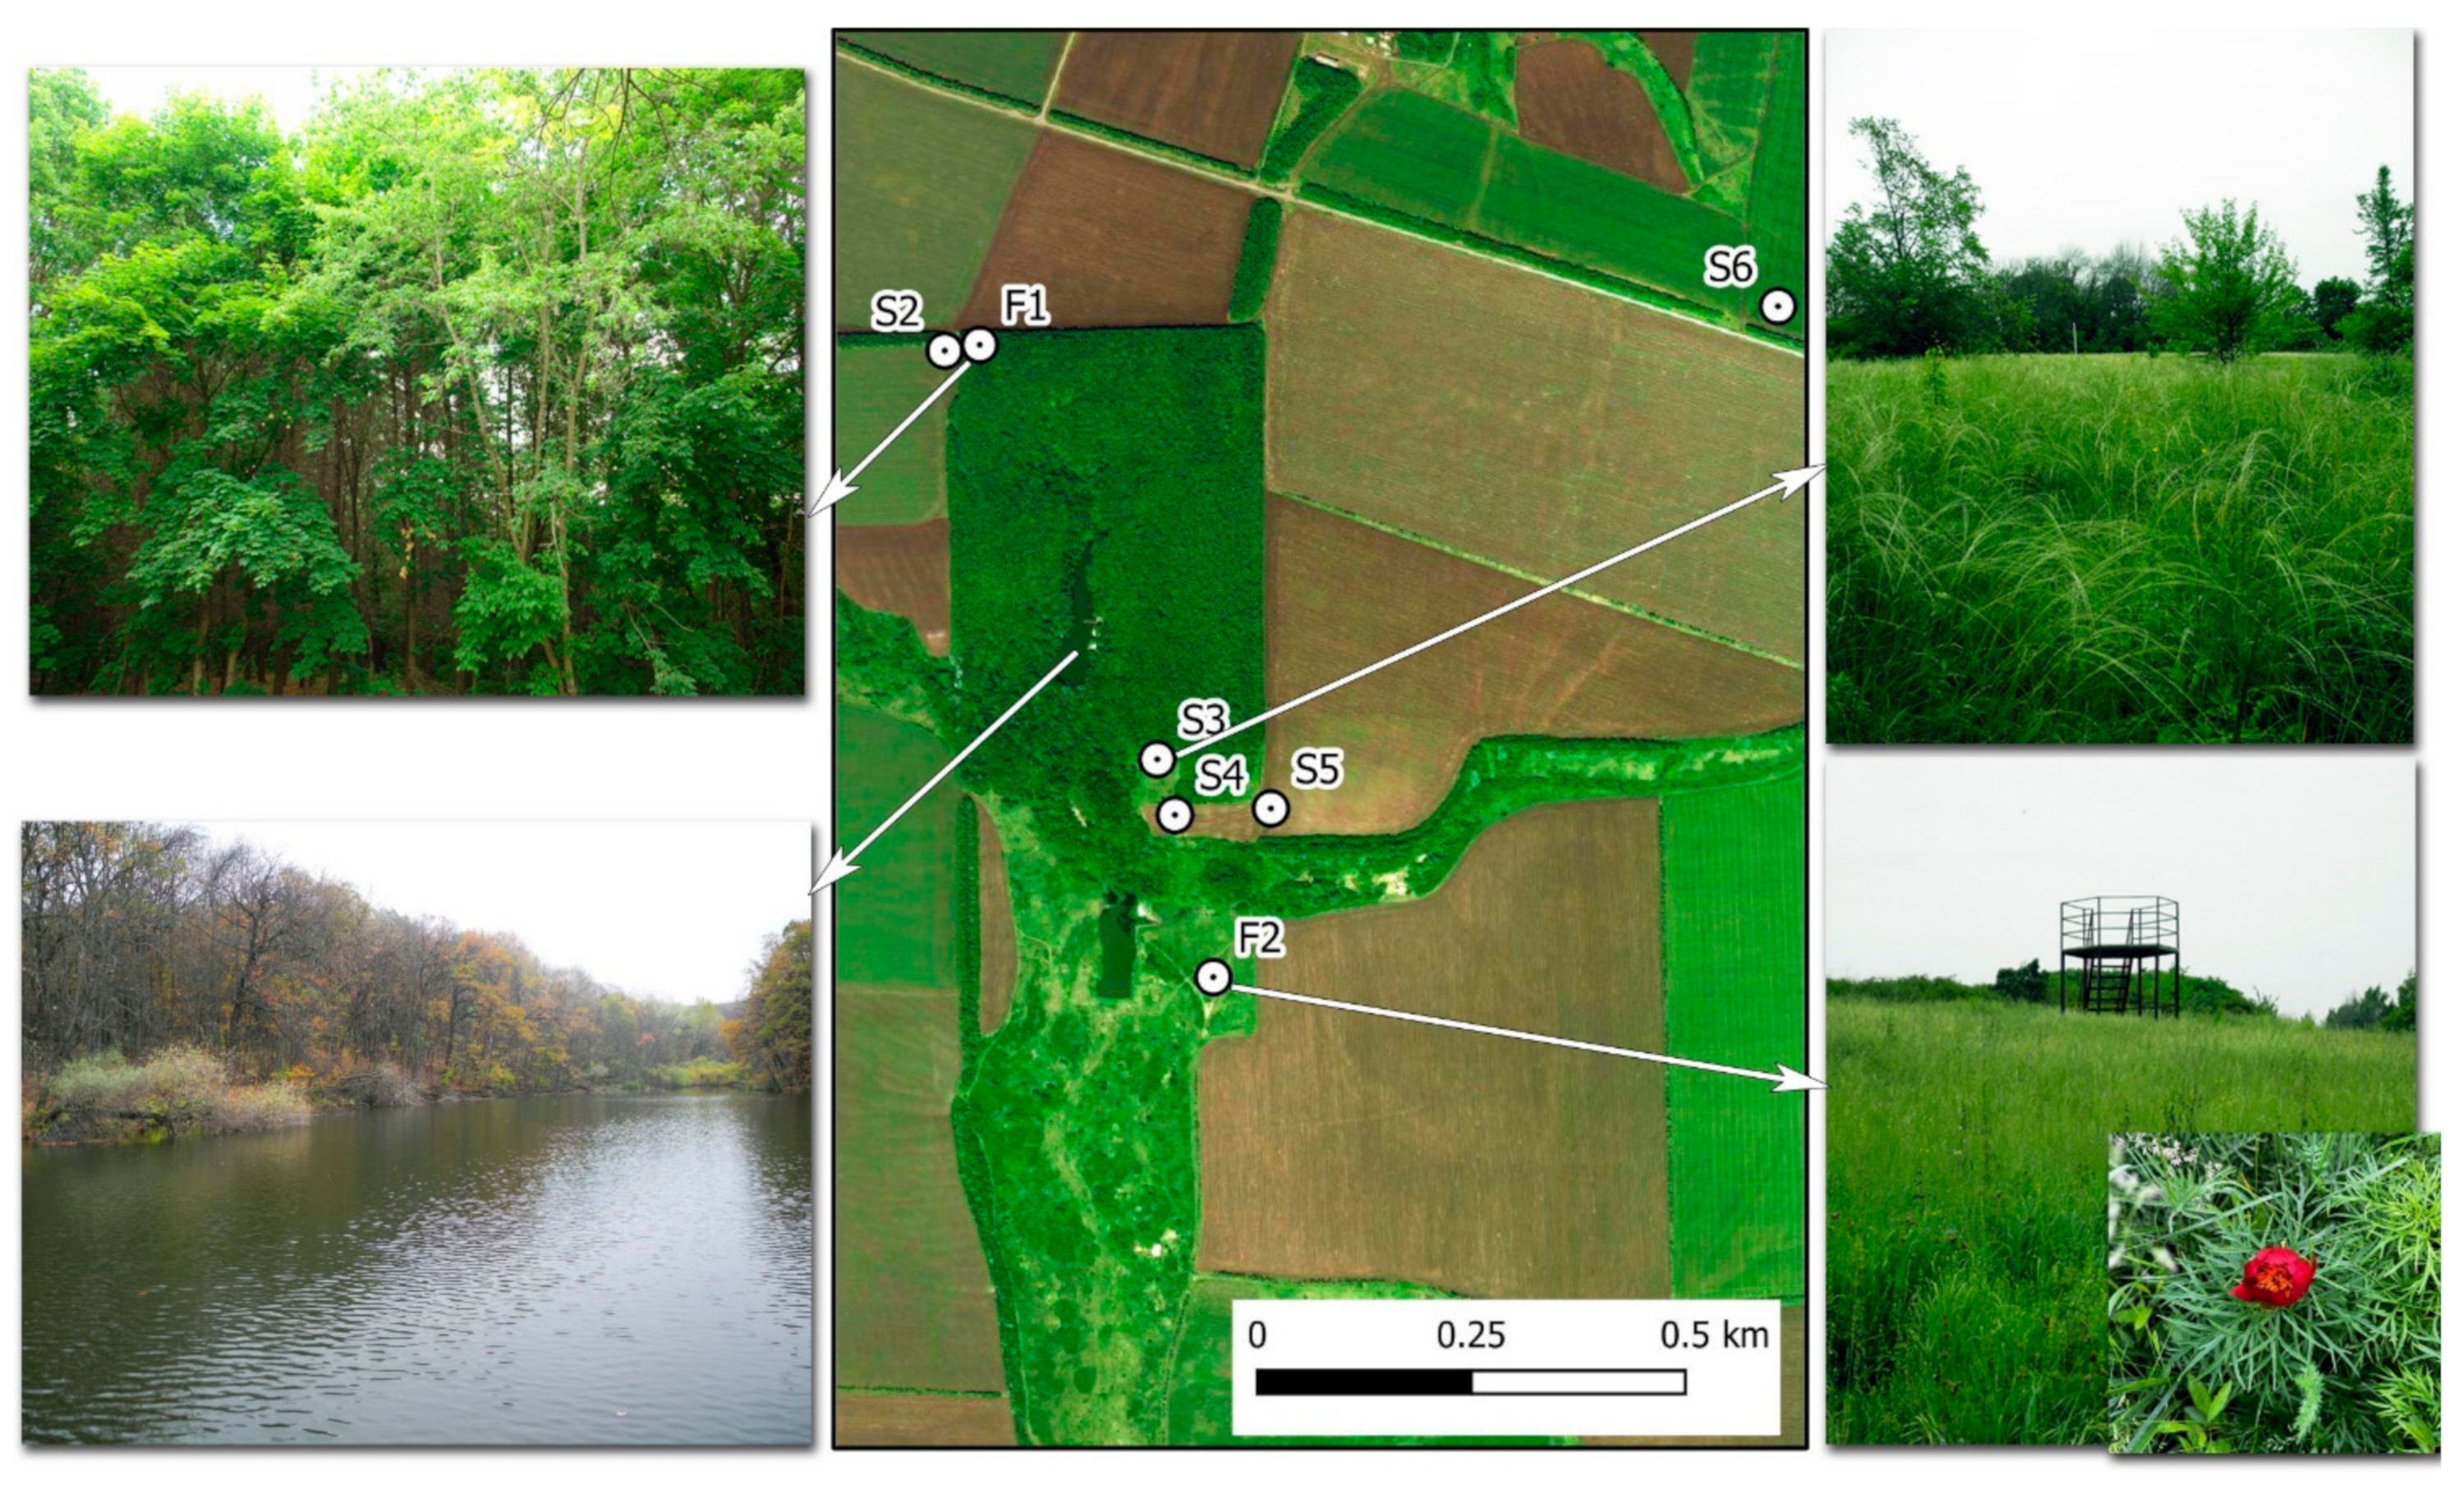
| Indices | Units | S2 | S3 | S4 | S5 | S6 |
|---|---|---|---|---|---|---|
| Layer | cm | 0–16 | 0–13 | 0–14 | 0–16 | 0–14 |
| Corg | % | 3.35 | 3.09 | 1.83 | 3.09 | 3.02 |
| N total | % | 0.33 | 0.28 | 0.17 | 0.29 | 0.36 |
| C:N | – | 10 | 11 | 11 | 11 | 8 |
| Labile humus | % | 0.90 | 0.33 | 0.33 | 0.15 | 0.21 |
| CHA | % | 47.4 | 44.4 | 54.3 | 54 | 66.7 |
| CFA | % | 17.5 | 23.2 | 22.9 | 12.5 | 17.6 |
| CEC | cmol(+)kg−1 | 39.7 | 23.0 | 15.0 | 32.8 | 38.6 |
| <0.05 mm | % | 51.24 | 53.15 | 48.94 | 63.74 | 97.52 |
| <0.01 mm | % | 50.82 | 32.96 | 29.56 | 58.24 | 62.75 |
| Cstr | – | 1.12 | 1.85 | 0.80 | 0.75 | 0.89 |
| d | mm | 0.42 | 1.95 | 0.45 | 0.44 | 0.51 |
| P2O5 | % | 0.16 | 0.09 | 0.12 | 0.14 | 0.16 |
| K2O | % | 1.94 | 0.96 | 1.62 | 1.76 | 1.99 |
| MgO | % | 0.83 | 0.22 | 0.38 | 0.86 | 0.87 |
| MnO | % | 0.09 | 0.05 | 0.07 | 0.08 | 0.09 |
| Fe2O3 | % | 4.83 | 2.41 | 3.08 | 4.38 | 4.99 |
| Zn | mg·kg−1 | 83.93 | 48.13 | 50.33 | 86.79 | 85.46 |
| Ni | mg·kg−1 | 55.09 | 26.41 | 34.83 | 50.94 | 56.25 |
| SQ | – | 3.6 | 2.6 | 2.4 | 2.9 | 3.4 |
| Land Cover (Plant Association) | Layer, cm | Color (Dry) | Mortmass Content, g * | Mortmass Carbon, % | |
|---|---|---|---|---|---|
| DW1 | DW2 | ||||
| Virgin land (herbs), S3 | 0–6 | 10 YR 3/2 | 10.71 | 12.52 | 18.08 |
| 6–12 | 10 YR 3/2.5 | 1.46 | 1.57 | 21.33 | |
| Fallow land (feather grass), F2 | 0–6 | 10 YR 3/1.5 | 5.58 | 5.97 | 23.51 |
| 6–12 | 10 YR 3/2 | 1.70 | 1.76 | 21.55 | |
Disclaimer/Publisher’s Note: The statements, opinions and data contained in all publications are solely those of the individual author(s) and contributor(s) and not of MDPI and/or the editor(s). MDPI and/or the editor(s) disclaim responsibility for any injury to people or property resulting from any ideas, methods, instructions or products referred to in the content. |
© 2023 by the authors. Licensee MDPI, Basel, Switzerland. This article is an open access article distributed under the terms and conditions of the Creative Commons Attribution (CC BY) license (https://creativecommons.org/licenses/by/4.0/).
Share and Cite
Lisetskii, F.N.; Buryak, Z.A.; Marinina, O.A.; Ukrainskiy, P.A.; Goleusov, P.V. Features of Soil Organic Carbon Transformations in the Southern Area of the East European Plain. Geosciences 2023, 13, 278. https://doi.org/10.3390/geosciences13090278
Lisetskii FN, Buryak ZA, Marinina OA, Ukrainskiy PA, Goleusov PV. Features of Soil Organic Carbon Transformations in the Southern Area of the East European Plain. Geosciences. 2023; 13(9):278. https://doi.org/10.3390/geosciences13090278
Chicago/Turabian StyleLisetskii, Fedor N., Zhanna A. Buryak, Olga A. Marinina, Pavel A. Ukrainskiy, and Pavel V. Goleusov. 2023. "Features of Soil Organic Carbon Transformations in the Southern Area of the East European Plain" Geosciences 13, no. 9: 278. https://doi.org/10.3390/geosciences13090278