

Study of the Mineralogical and Chemical Compositions of the Weakly Magnetic Fractions of the Egyptian Black Sand Altered Ilmenite
Abstract
:1. Introduction
2. Materials and Methods
- -
- The Reading cross-belt magnetic separator for magnetic separation where the raw sample is differentiated into three fractions: a ferromagnetic fraction, a bulk magnetic fraction, and a bulk non-magnetic fraction.
- -
- The full-size Wilfley shaking tables for wet-gravity concentration of the obtained bulk non-magnetic fraction.
- -
- The Carpco (HP 167) high-tension roll-type electrostatic separator for treating the obtained tabled concentrate to obtain a bulk conductor rutile fraction and a bulk non-conductor zircon fraction.
- -
- The Carpco (MIH 13-231-100) industrial high-intensity induced roll dry magnetic separator for magnetic separation of the obtained bulk rutile conductor fraction.
- -
- The Frantz isodynamic magnetic separator; the obtained three successive magnetic fractions of the last treatment stage were mixed together as a bulk magnetic fraction. It is composed of hematite, ilmeno–hematite, different varieties of magnetic primary rutile [33], various grades of altered ilmenite grains, in addition to a minor amount of Cr-bearing minerals and other magnetic minerals [5]. A relatively smaller representative sample was obtained from the bulk magnetic fraction and subjected to magnetic differentiation using the Frantz isodynamic magnetic separator where the used adjustment of operating conditions was a longitudinal slope of 20°, side slope of 5°, feeding rate of 30 g/h, and different successive ampere values of 0.1, 0.2, 0.25. 0.35, 0.5, and 1, where six magnetic fractions and only one non-magnetic fraction were obtained. The altered ilmenite grains obtained in the two individual magnetic fractions separated at 0.5 and 1 ampere values were investigated and included in this article.
- -
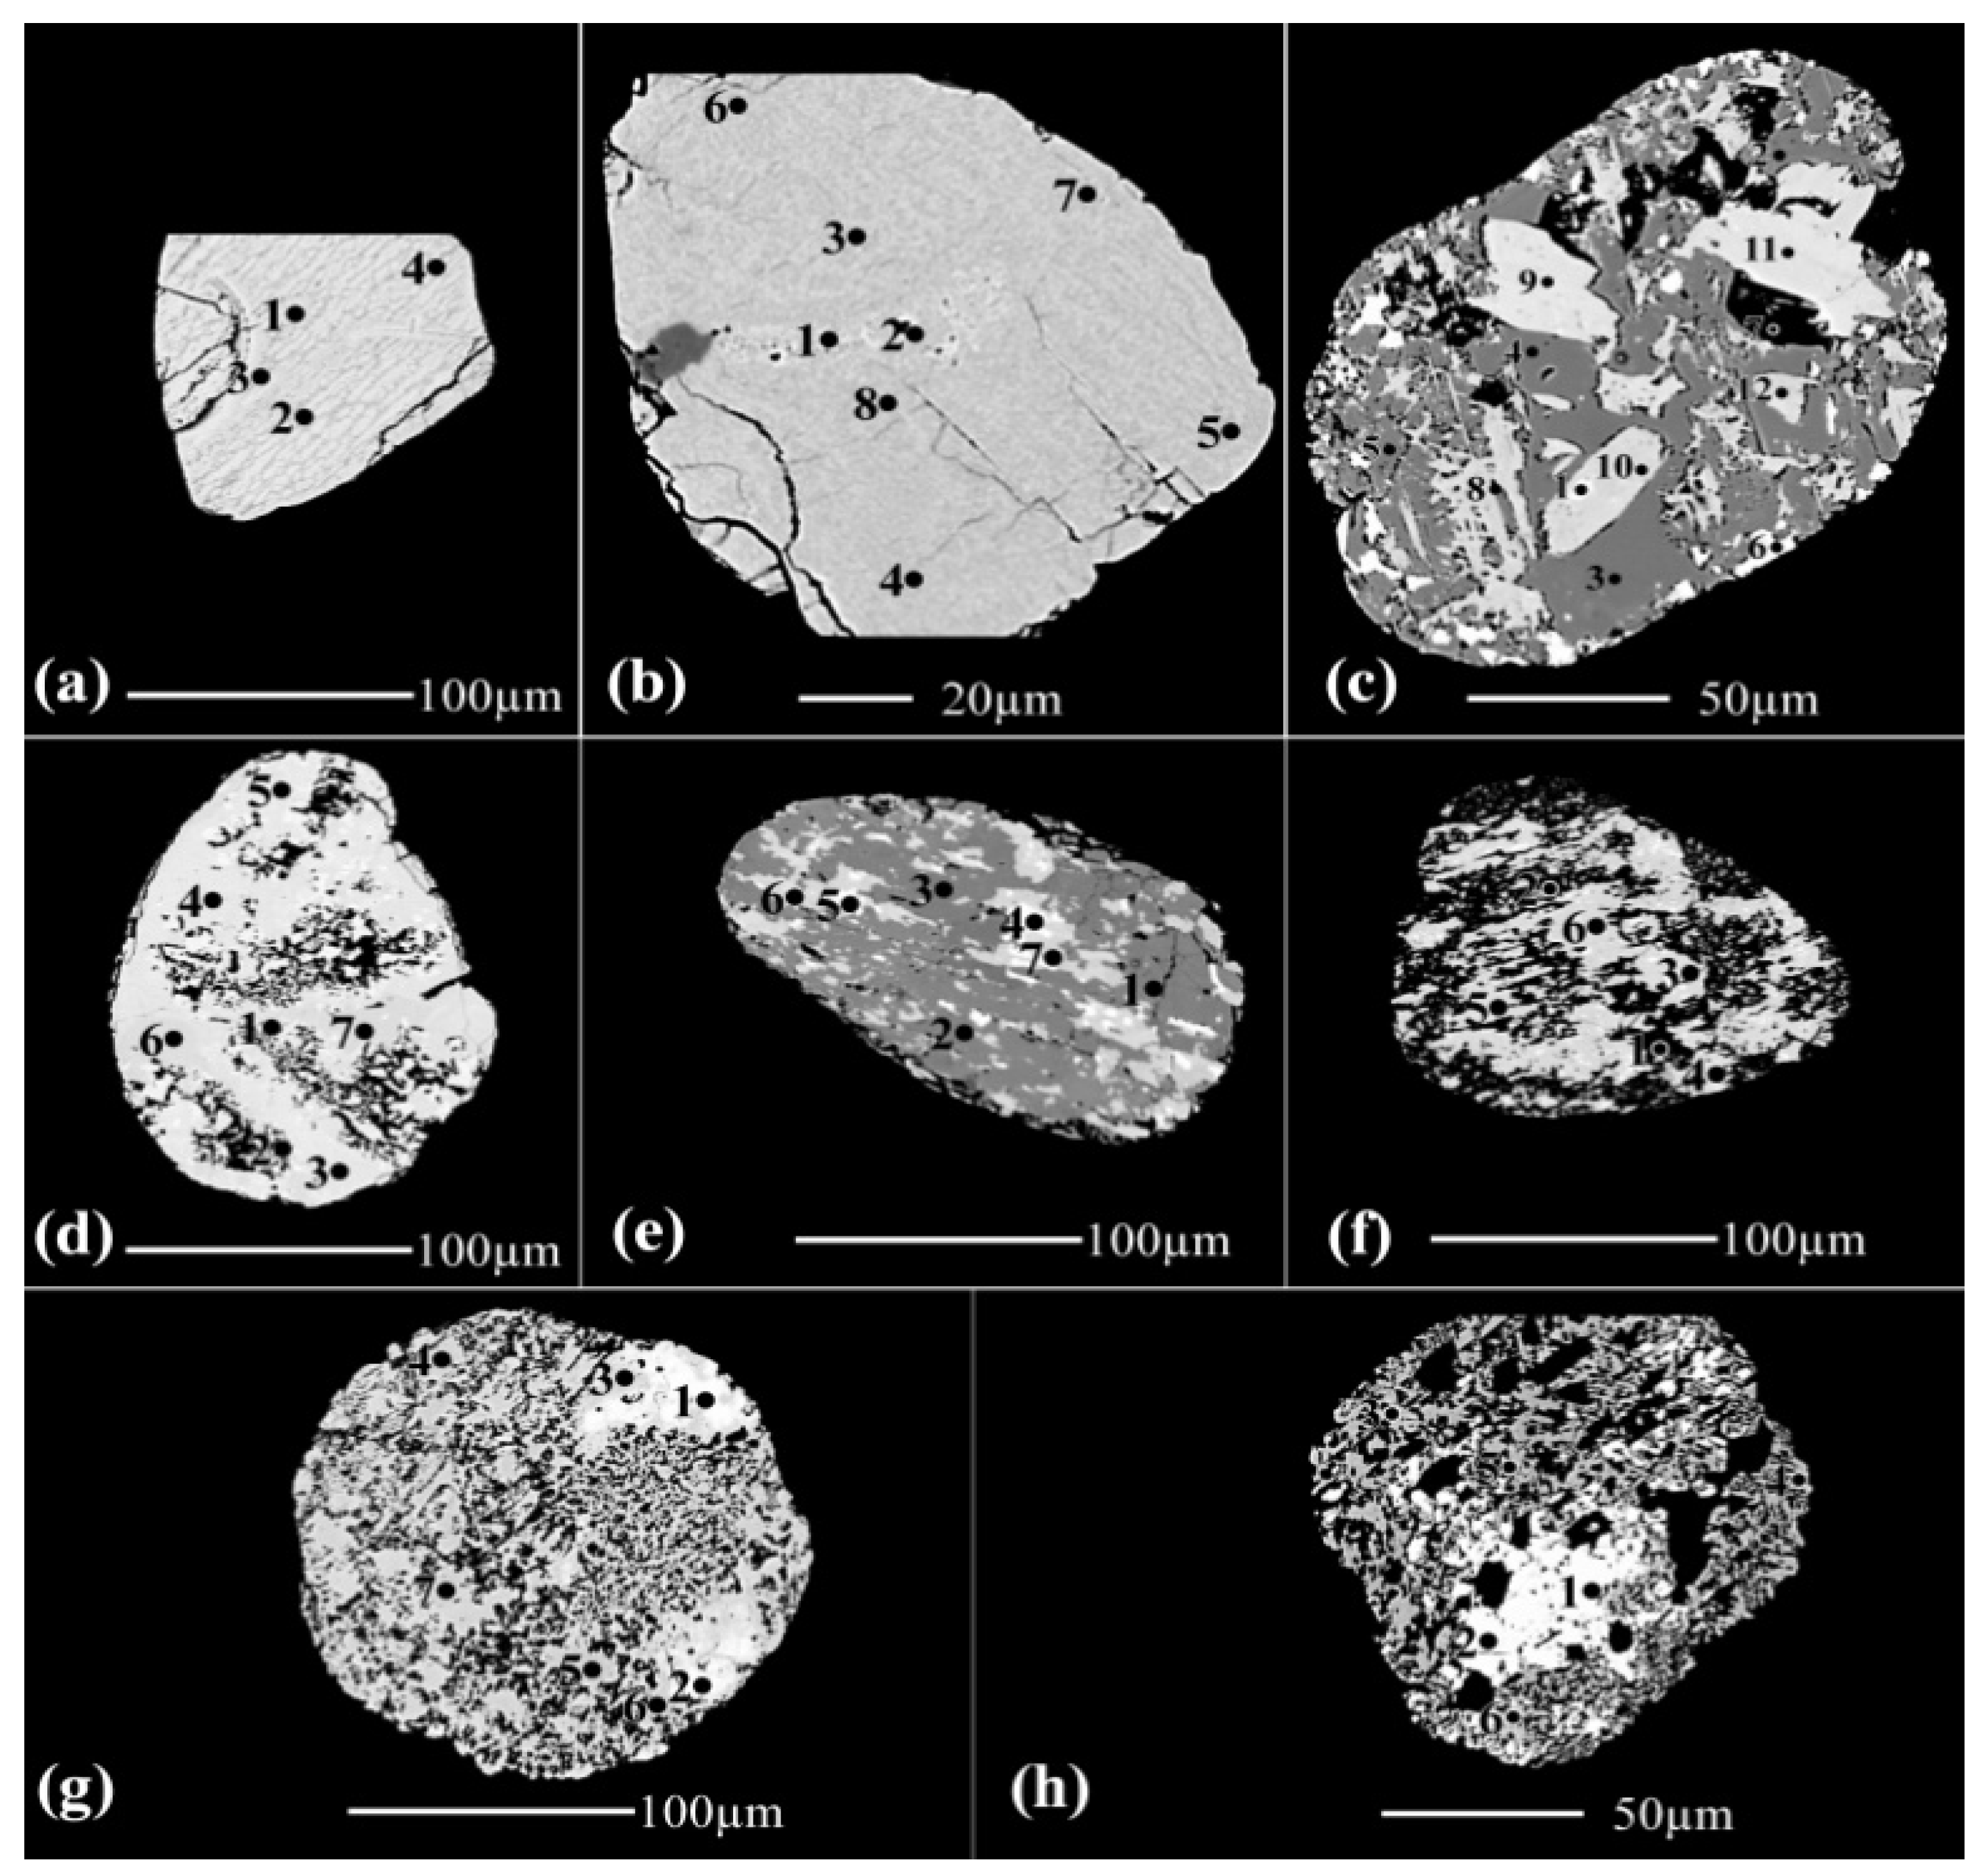
- The microscopic investigation. The altered ilmenite varieties obtained for these separated two individual magnetic fractions were investigated using the binocular and reflected microscopes.
- -
- The microprobe analysis. The investigation of the different altered ilmenite grains was carried out by a Cameca SX-100 electron microprobe analyzer (EMPA), Institute of Mineralogy and Crystal Chemistry, Stuttgart University, Germany. The microprobe instrument is equipped with three wavelength dispersive spectrometers (WDS) and an energy dispersive spectrometer (EDS). The whole surface of the polished sections was examined by backscattered electron (BSE) images, so that grain with, for example, a 10 µm size or even smaller, could be detected. The analytical conditions were 15 kV accelerating voltage; 15 nA electron current; a 180s counting time for each analyzed spot in the investigated grains and a focused electron beam diameter of 1 to 4 µm. The following standards were used: diopside for Mg and Ca, albite for Na, corundum for Al, orthoclase for Si and K, rutile for Ti, rhodonite for Mn, Fe2O3 for Fe, Cr2O3 for Cr, V for V, and sphalerite for Zn. Lines used for analysis were Kα for each of the analyzed elements. For each detected altered ilmenite variety, a definite number of grains were picked individually and polished for the investigation using the microprobe.
- -
- The dependance of chemical analyses to predict mineral composition and/or conclude a molecular formula for a definite mineral phase has been followed by many authors. Taking a definite mineral phase into consideration, there is not a definite type and number of the required analyzed oxides except that all the major oxides composing the mineral phase must be included. In the case of detecting the ilmenite alteration, the electron microprobe analyzer (EMPA) was used for a definite adjustment of operating conditions. Most of the analyzed oxides in the present study, except for Na2O and K2O, were included in two previous studies [29,30]. The study of [25] used the elemental composition by means of microprobe analysis and the calculation for the psr and lpsr formula on the basis of 3 Ti. They act with similar analyzed oxides of the present study except ZnO and K2O. However, NiO was included in some of their analyses. On the other hand [26], acting with 9 analyzed oxides, where both of P2O5 and ThO2 were among them, they are not included in the present study. ZrO2, V2O5, and P2O5 are included with the analyzed oxides of [24]. Only 7 analyzed oxides, namely TiO2, Fe2O3, MnO, MgO, SiO2, CaO, and Al2O3 were used to study the grains of hydroxylian psr [34]. On the other hand, 14 analyzed oxides were included in the studies of [19,35]; 5 out of them are not included in the present study which are NiO, Nb2O5, Ta2O5, V2O3, and SnO. However, both Na2O and K2O are not included with them [19,35].
- -
- The X-ray diffraction instrument (XRD). The Philips X-ray generator (PW 3710/31) with automatic sample changer (PW 1775; 21 position) using a scintillation counter, Cu-target tube, and Ni filter at 40 kV and 30 mA was used. This instrument is connected to a computer system using an X-40 diffraction program and ASTM cards for mineral identification.
3. Results and Discussion
3.1. The Separated Magnetic Fraction at 0.5 Ampere
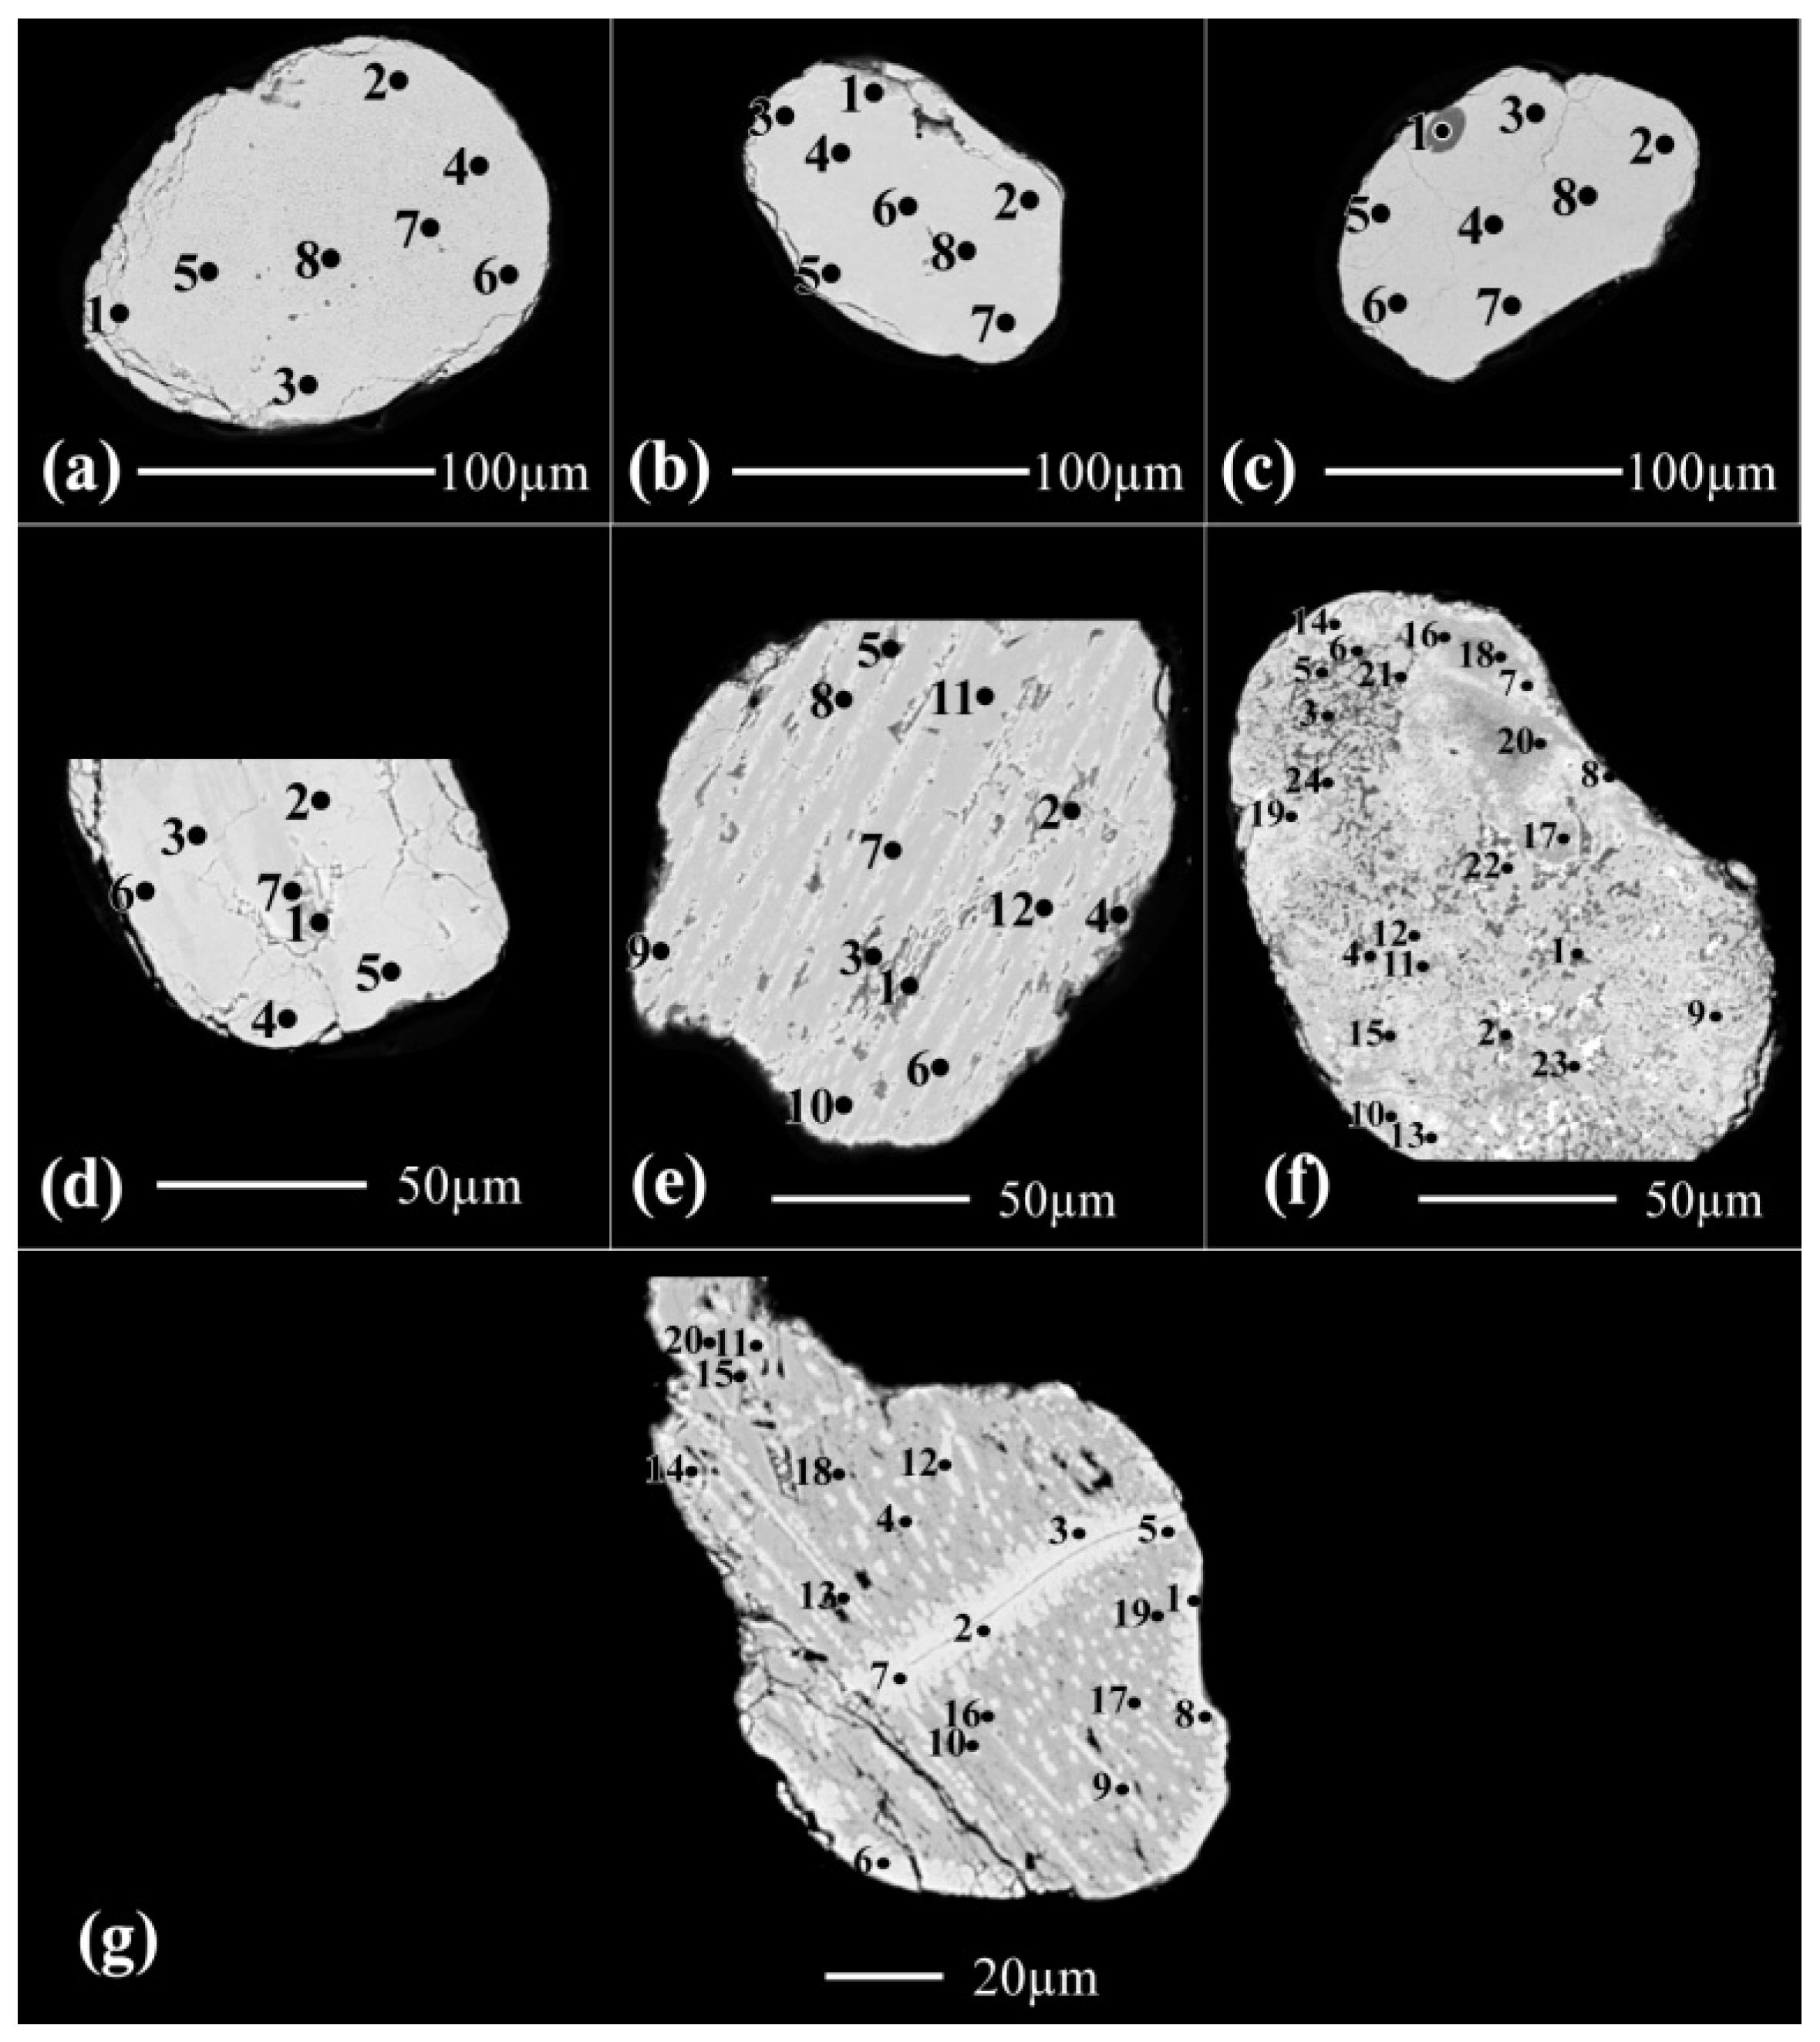
3.1.1. The Detected Dark Brown Grains at 0.5 Ampere

3.1.2. The Detected Brown and Yellowish Brown Grains at 0.5 Ampere


| Grains | Spots | Wt% | Molecular Formula | Lost Fe | Ti/(Ti + Fe) | Mineral Phase | |||||||||||||||||
|---|---|---|---|---|---|---|---|---|---|---|---|---|---|---|---|---|---|---|---|---|---|---|---|
| SiO2 | MgO | MnO | CaO | ZnO | Fe2O3 | Al2O3 | Cr2O3 | Na2O | K2O | TiO2 | O Total | OH% | H2O% | N Total | Fe2 | Ti3 | Ox | OHy | |||||
| 1a | 1 | 0.62 | 0.26 | 0.57 | 0.46 | 0.00 | 20.70 | 0.63 | 0.11 | 0.02 | 0.01 | 68.81 | 92.19 | 13.94 | 7.38 | 99.58 | 1.07 | 3 | 6.16 | 2.84 | 0.93 | 0.74 | psr/lpsr |
| 4 | 0.68 | 0.25 | 0.51 | 0.51 | 0.08 | 19.42 | 0.61 | 0.12 | 0.00 | 0.01 | 70.50 | 92.69 | 15.22 | 8.06 | 100.75 | 0.99 | 3 | 5.93 | 3.07 | 1.01 | 0.75 | psr/lpsr | |
| 7 | 0.75 | 0.26 | 0.59 | 0.39 | 0.16 | 18.60 | 0.67 | 0.11 | 0.00 | 0.01 | 71.42 | 92.98 | 15.87 | 8.40 | 101.38 | 0.95 | 3 | 5.82 | 3.18 | 1.05 | 0.76 | psr/lpsr | |
| 8 | 0.74 | 0.25 | 0.51 | 0.37 | 0.03 | 18.51 | 0.64 | 0.14 | 0.01 | 0.03 | 72.15 | 93.37 | 16.26 | 8.61 | 101.99 | 0.93 | 3 | 5.75 | 3.25 | 1.07 | 0.76 | psr/lpsr | |
| 1b | 1 | 0.70 | 0.11 | 0.29 | 0.29 | 0.00 | 15.79 | 0.75 | 0.35 | 0.01 | 0.01 | 76.62 | 94.89 | 19.26 | 10.20 | 105.09 | 0.75 | 3 | 5.26 | 3.74 | 1.25 | 0.80 | psr/lpsr |
| 2 | 0.74 | 0.12 | 0.20 | 0.32 | 0.00 | 14.22 | 1.01 | 0.30 | 0.00 | 0.01 | 76.88 | 93.80 | 20.17 | 10.68 | 104.49 | 0.70 | 3 | 5.11 | 3.89 | 1.30 | 0.81 | psr/lpsr | |
| 4 | 0.76 | 0.07 | 0.19 | 0.32 | 0.00 | 14.13 | 1.09 | 0.39 | 0.01 | 0.00 | 77.81 | 94.78 | 20.27 | 10.74 | 105.51 | 0.70 | 3 | 5.10 | 3.90 | 1.30 | 0.81 | psr/lpsr | |
| 8 | 0.90 | 0.11 | 0.11 | 0.32 | 0.06 | 12.72 | 1.13 | 0.45 | 0.04 | 0.04 | 79.01 | 94.89 | 21.20 | 11.23 | 106.11 | 0.65 | 3 | 4.96 | 4.04 | 1.35 | 0.82 | psr/lpsr | |
| 1c | 1 | 48.27 | 0.70 | 0.01 | 0.20 | 0.04 | 3.49 | 36.23 | 0.03 | 0.04 | 0.25 | 1.82 | 91.07 | Silicate mineral | |||||||||
| 2 | 0.92 | 0.17 | 0.09 | 0.39 | 0.03 | 7.78 | 1.62 | 0.63 | 0.05 | 0.03 | 82.15 | 93.83 | 24.53 | 12.99 | 106.82 | 0.49 | 3 | 4.46 | 4.54 | 1.51 | 0.86 | psr/lpsr | |
| 4 | 1.07 | 0.26 | 0.03 | 0.41 | 0.07 | 7.25 | 1.53 | 0.79 | 0.03 | 0.05 | 82.43 | 93.91 | 24.66 | 13.06 | 106.97 | 0.48 | 3 | 4.44 | 4.56 | 1.52 | 0.86 | psr/lpsr | |
| 8 | 0.87 | 0.24 | 0.06 | 0.37 | 0.14 | 6.68 | 1.40 | 0.70 | 0.03 | 0.04 | 84.11 | 94.65 | 25.67 | 13.60 | 108.24 | 0.43 | 3 | 4.29 | 4.71 | 1.57 | 0.87 | psr/lpsr | |
| 1d | 1 | 5.85 | 0.93 | 0.15 | 0.50 | 0.02 | 16.57 | 2.68 | 0.46 | 0.05 | 0.29 | 67.89 | 95.38 | 7.46 | 3.95 | 99.34 | 1.43 | 3 | 7.46 | 1.54 | 0.57 | 0.68 | psr/lpsr |
| 2 | 1.71 | 0.51 | 0.41 | 0.37 | 0.01 | 23.28 | 1.12 | 0.25 | 0.01 | 0.03 | 68.66 | 96.34 | 10.09 | 5.34 | 101.68 | 1.30 | 3 | 6.89 | 2.11 | 0.70 | 0.70 | psr/lpsr | |
| 3 | 0.83 | 0.40 | 0.20 | 0.36 | 0.00 | 22.93 | 0.82 | 0.32 | 0.02 | 0.05 | 69.50 | 95.43 | 12.05 | 6.38 | 101.81 | 1.18 | 3 | 6.51 | 2.49 | 0.82 | 0.72 | psr/lpsr | |
| 4 | 1.08 | 0.50 | 0.29 | 0.40 | 0.03 | 21.81 | 0.97 | 0.35 | 0.05 | 0.04 | 70.60 | 96.10 | 12.48 | 6.61 | 102.71 | 1.16 | 3 | 6.43 | 2.57 | 0.84 | 0.72 | psr/lpsr | |
| 7 | 1.49 | 0.21 | 0.01 | 0.54 | 0.02 | 9.70 | 1.22 | 0.60 | 0.00 | 0.06 | 81.86 | 95.69 | 22.79 | 12.07 | 107.76 | 0.57 | 3 | 4.73 | 4.27 | 1.43 | 0.84 | psr/lpsr | |
| 1e | 1 | 46.02 | 6.23 | 0.09 | 0.62 | 0.10 | 16.12 | 10.21 | 0.03 | 0.10 | 3.82 | 7.53 | 90.85 | Silicate mineral | |||||||||
| 5 | 35.55 | 6.48 | 0.17 | 0.44 | 0.01 | 18.82 | 8.20 | 0.03 | 0.06 | 2.18 | 22.43 | 94.38 | Silicate mineral | ||||||||||
| 6 | 1.60 | 0.87 | 0.43 | 0.14 | 0.07 | 27.95 | 0.55 | 0.10 | 0.03 | 0.11 | 64.32 | 96.15 | 6.04 | 3.20 | 99.35 | 1.58 | 3 | 7.69 | 1.31 | 0.42 | 0.66 | psr/lpsr | |
| 8 | 0.59 | 0.40 | 0.24 | 0.24 | 0.08 | 14.51 | 0.66 | 0.08 | 0.06 | 0.06 | 79.76 | 96.66 | 20.82 | 11.03 | 107.69 | 0.68 | 3 | 5.00 | 4.00 | 1.32 | 0.81 | psr/lpsr | |
| 9 | 0.16 | 0.13 | 0.10 | 0.23 | 0.03 | 3.18 | 0.93 | 0.04 | 0.06 | 0.01 | 91.11 | 95.97 | 30.76 | 16.29 | 112.26 | 0.19 | 3 | 3.54 | 5.46 | 1.81 | TiO2 and Fe2O3 | ||
| 12 | 0.03 | 0.03 | 0.07 | 0.18 | 0.01 | 1.25 | 1.12 | 0.12 | 0.06 | 0.02 | 94.13 | 97.01 | 32.31 | 17.11 | 114.12 | 0.12 | 3 | 3.34 | 5.66 | 1.88 | TiO2 and Fe2O3 | ||
| 1f | 1 | 36.56 | 1.09 | 0.12 | 1.10 | 0.00 | 3.76 | 25.65 | 0.06 | 0.04 | 0.14 | 6.68 | 75.20 | Silicate mineral | |||||||||
| 6 | 12.21 | 0.46 | 0.09 | 0.32 | 0.00 | 2.20 | 9.13 | 0.04 | 0.00 | 0.06 | 72.26 | 96.76 | Silicate mineral | ||||||||||
| 9 | 0.37 | 0.13 | 1.04 | 0.28 | 0.02 | 28.06 | 0.22 | 0.00 | 0.04 | 0.00 | 65.85 | 96.00 | 8.61 | 4.56 | 100.56 | 1.40 | 3 | 7.15 | 1.85 | 0.60 | 0.68 | psr/lpsr | |
| 13 | 0.42 | 0.08 | 0.94 | 0.32 | 0.08 | 26.55 | 0.16 | 0.05 | 0.02 | 0.00 | 67.53 | 96.14 | 10.20 | 5.40 | 101.54 | 1.30 | 3 | 6.84 | 2.16 | 0.70 | 0.70 | psr/lpsr | |
| 17 | 0.85 | 0.18 | 0.35 | 0.52 | 0.00 | 14.09 | 0.35 | 0.06 | 0.03 | 0.00 | 68.42 | 84.85 | 19.19 | 10.16 | 95.01 | 0.76 | 3 | 5.27 | 3.73 | 1.24 | 0.80 | psr/lpsr | |
| 21 | 0.01 | 0.01 | 0.25 | 0.04 | 0.01 | 13.60 | 0.00 | 0.03 | 0.00 | 0.01 | 86.56 | 100.49 | 24.26 | 12.85 | 113.34 | 0.49 | 3 | 4.44 | 4.56 | 1.51 | 0.86 | psr/lpsr | |
| 22 | 0.01 | 0.00 | 0.02 | 0.06 | 0.00 | 2.53 | 0.00 | 0.10 | 0.00 | 0.00 | 96.17 | 98.89 | 32.75 | 17.35 | 116.24 | 0.09 | 3 | 3.25 | 5.75 | 1.91 | TiO2 and Fe2O3 | ||
| 24 | 0.28 | 0.00 | 0.01 | 0.04 | 0.01 | 0.44 | 0.17 | 0.10 | 0.02 | 0.01 | 98.97 | 100.04 | 33.83 | 17.92 | 117.96 | 0.04 | 3 | 3.13 | 5.87 | 1.96 | Mainly TiO2 | ||
| 1g | 1 | 0.20 | 0.09 | 0.67 | 0.13 | 0.00 | 28.69 | 0.22 | 0.02 | 0.01 | 0.01 | 65.75 | 95.78 | 8.69 | 4.60 | 100.38 | 1.39 | 3 | 7.13 | 1.87 | 0.61 | 0.68 | psr/lpsr |
| 10 | 0.40 | 0.13 | 0.53 | 0.31 | 0.00 | 24.98 | 0.40 | 0.08 | 0.03 | 0.03 | 68.71 | 95.59 | 11.60 | 6.14 | 101.73 | 1.21 | 3 | 6.58 | 2.42 | 0.79 | 0.71 | psr/lpsr | |
| 11 | 0.41 | 0.10 | 0.53 | 0.32 | 0.03 | 23.78 | 0.38 | 0.05 | 0.02 | 0.01 | 69.93 | 95.56 | 12.81 | 6.79 | 102.34 | 1.13 | 3 | 6.35 | 2.65 | 0.87 | 0.73 | psr/lpsr | |
| 12 | 0.54 | 0.16 | 0.39 | 0.38 | 0.07 | 22.09 | 0.46 | 0.04 | 0.01 | 0.01 | 70.46 | 94.60 | 13.90 | 7.36 | 101.96 | 1.06 | 3 | 6.16 | 2.84 | 0.94 | 0.74 | psr/lpsr | |
| 13 | 0.69 | 0.16 | 0.32 | 0.36 | 0.00 | 21.75 | 0.71 | 0.13 | 0.03 | 0.02 | 70.65 | 94.82 | 13.76 | 7.29 | 102.11 | 1.07 | 3 | 6.19 | 2.81 | 0.93 | 0.74 | psr/lpsr | |
| 15 | 1.04 | 0.21 | 0.13 | 0.45 | 0.14 | 13.40 | 1.12 | 0.12 | 0.05 | 0.03 | 75.04 | 91.71 | 19.90 | 10.54 | 102.25 | 0.73 | 3 | 5.17 | 3.83 | 1.27 | 0.81 | psr/lpsr | |
| 17 | 1.08 | 0.22 | 0.15 | 0.52 | 0.07 | 11.13 | 1.09 | 0.04 | 0.10 | 0.02 | 78.27 | 92.68 | 22.11 | 11.71 | 104.38 | 0.61 | 3 | 4.82 | 4.18 | 1.39 | 0.83 | psr/lpsr | |
| 19 | 1.20 | 0.21 | 0.13 | 0.57 | 0.10 | 9.14 | 1.17 | 0.02 | 0.07 | 0.00 | 79.66 | 92.24 | 23.59 | 12.50 | 104.74 | 0.54 | 3 | 4.60 | 4.40 | 1.46 | 0.85 | psr/lpsr | |
| 20 | 0.08 | 0.08 | 0.01 | 0.12 | 0.09 | 0.79 | 1.07 | 0.03 | 0.08 | 0.04 | 93.80 | 96.19 | 32.66 | 17.30 | 113.49 | 0.11 | 3 | 3.29 | 5.71 | 1.89 | Mainly TiO2 | ||
| 2a | 1 | 1.03 | 0.72 | 0.34 | 0.31 | 0.07 | 20.14 | 0.97 | 0.18 | 0.01 | 0.03 | 72.24 | 96.04 | 14.09 | 7.46 | 103.50 | 1.06 | 3 | 6.15 | 2.85 | 0.94 | 0.74 | psr/lpsr |
| 4 | 1.02 | 0.75 | 0.40 | 0.34 | 0.03 | 19.66 | 1.01 | 0.27 | 0.05 | 0.04 | 73.30 | 96.86 | 14.51 | 7.68 | 104.54 | 1.04 | 3 | 6.07 | 2.93 | 0.96 | 0.74 | psr/lpsr | |
| 7 | 2.32 | 0.47 | 0.17 | 0.46 | 0.10 | 11.24 | 1.50 | 0.30 | 0.03 | 0.11 | 79.70 | 96.37 | 20.01 | 10.60 | 106.97 | 0.72 | 3 | 5.18 | 3.82 | 1.28 | 0.81 | psr/lpsr | |
| 2b | 1 | 0.90 | 0.42 | 0.52 | 0.21 | 0.00 | 24.15 | 1.18 | 0.38 | 0.00 | 0.03 | 68.83 | 96.61 | 10.44 | 5.53 | 102.14 | 1.28 | 3 | 6.81 | 2.19 | 0.72 | 0.70 | psr/lpsr |
| 2 | 0.73 | 0.25 | 0.20 | 0.27 | 0.02 | 17.42 | 1.76 | 0.62 | 0.00 | 0.02 | 72.10 | 93.38 | 15.78 | 8.36 | 101.74 | 0.95 | 3 | 5.86 | 3.14 | 1.05 | 0.76 | psr/lpsr | |
| 3 | 0.75 | 0.22 | 0.03 | 0.29 | 0.00 | 6.15 | 3.17 | 0.77 | 0.02 | 0.02 | 72.84 | 84.25 | 23.07 | 12.22 | 96.47 | 0.57 | 3 | 4.71 | 4.29 | 1.43 | TiO2 and Fe2O3 | ||
| 7 | 0.65 | 0.20 | 0.17 | 0.23 | 0.00 | 13.49 | 1.51 | 0.60 | 0.01 | 0.01 | 75.40 | 92.28 | 19.81 | 10.49 | 102.77 | 0.73 | 3 | 5.18 | 3.82 | 1.27 | 0.80 | psr/lpsr | |
| 8 | 1.14 | 0.27 | 0.05 | 0.30 | 0.00 | 8.29 | 5.29 | 0.67 | 0.17 | 0.01 | 76.40 | 92.60 | 19.08 | 10.11 | 102.70 | 0.80 | 3 | 5.37 | 3.63 | 1.20 | TiO2 and Fe2O3 | ||
| 9 | 0.81 | 0.23 | 0.08 | 0.30 | 0.00 | 10.92 | 1.78 | 0.80 | 0.00 | 0.01 | 78.87 | 93.79 | 21.66 | 11.47 | 105.26 | 0.63 | 3 | 4.90 | 4.10 | 1.37 | TiO2 and Fe2O3 | ||
| 13 | 0.78 | 0.17 | 0.08 | 0.35 | 0.00 | 4.37 | 1.02 | 0.92 | 0.01 | 0.01 | 84.68 | 92.39 | 27.96 | 14.81 | 107.20 | 0.32 | 3 | 3.95 | 5.05 | 1.68 | TiO2 and Fe2O3 | ||
| 2c | 2 | 0.59 | 0.13 | 1.01 | 0.28 | 0.06 | 25.11 | 0.57 | 0.46 | 0.00 | 0.01 | 68.25 | 96.45 | 10.46 | 5.54 | 101.99 | 1.28 | 3 | 6.79 | 2.21 | 0.72 | 0.70 | psr/lpsr |
| 4 | 0.39 | 0.17 | 1.13 | 0.22 | 0.08 | 25.00 | 0.38 | 0.32 | 0.00 | 0.01 | 69.34 | 97.04 | 11.29 | 5.98 | 103.02 | 1.23 | 3 | 6.63 | 2.37 | 0.77 | 0.71 | psr/lpsr | |
| 6 | 1.14 | 0.19 | 0.23 | 0.50 | 0.00 | 13.05 | 1.01 | 1.04 | 0.00 | 0.01 | 74.97 | 92.13 | 19.47 | 10.31 | 102.44 | 0.74 | 3 | 5.24 | 3.76 | 1.26 | 0.80 | psr/lpsr | |
| 8 | 1.15 | 0.16 | 0.20 | 0.51 | 0.05 | 13.89 | 0.96 | 0.93 | 0.05 | 0.02 | 77.16 | 95.08 | 19.34 | 10.24 | 105.32 | 0.75 | 3 | 5.26 | 3.74 | 1.25 | 0.80 | psr/lpsr | |
| 2d | 1 | 29.91 | 13.50 | 0.84 | 0.35 | 0.00 | 25.04 | 17.44 | 0.00 | 0.10 | 0.51 | 0.97 | 88.65 | Silicate mineral | |||||||||
| 3 | 22.18 | 0.02 | 0.03 | 20.69 | 0.00 | 0.49 | 0.49 | 0.01 | 0.00 | 0.01 | 56.16 | 100.08 | Sphene | ||||||||||
| 6 | 1.72 | 0.23 | 0.92 | 1.70 | 0.00 | 2.52 | 3.73 | 0.09 | 0.19 | 0.11 | 74.06 | 85.27 | 23.03 | 12.20 | 97.47 | 0.62 | 3 | 4.74 | 4.26 | 1.38 | TiO2 and Fe2O3 | ||
| 7 | 6.94 | 0.10 | 0.16 | 6.76 | 0.00 | 1.43 | 1.10 | 0.04 | 0.08 | 0.04 | 82.06 | 98.69 | Sphene and TiO2 | ||||||||||
| 8 | 1.28 | 0.32 | 0.67 | 1.26 | 0.00 | 3.40 | 3.16 | 0.09 | 0.18 | 0.04 | 85.32 | 95.70 | 25.34 | 13.42 | 109.13 | 0.49 | 3 | 4.37 | 4.63 | 1.51 | TiO2 and Fe2O3 | ||
| 12 | 1.19 | 0.12 | 0.27 | 1.02 | 0.00 | 1.21 | 1.71 | 0.06 | 0.14 | 0.06 | 91.73 | 97.52 | 29.59 | 15.67 | 113.19 | 0.26 | 3 | 3.74 | 5.26 | 1.74 | TiO2 and Fe2O3 | ||
| 2e | 1 | 0.34 | 0.57 | 0.43 | 0.15 | 0.00 | 17.35 | 0.71 | 0.14 | 0.07 | 0.03 | 74.75 | 94.53 | 17.93 | 9.50 | 104.02 | 0.85 | 3 | 5.47 | 3.53 | 1.15 | 0.78 | psr/lpsr |
| 2 | 0.20 | 0.41 | 0.12 | 0.08 | 0.00 | 11.62 | 0.33 | 0.10 | 0.05 | 0.02 | 83.14 | 96.07 | 24.35 | 12.90 | 108.96 | 0.50 | 3 | 4.45 | 4.55 | 1.50 | 0.86 | psr/lpsr | |
| 3 | 1.04 | 0.09 | 0.03 | 0.10 | 0.00 | 2.87 | 2.04 | 0.10 | 0.06 | 0.04 | 84.43 | 90.78 | 28.62 | 15.16 | 105.94 | 0.29 | 3 | 3.89 | 5.11 | 1.71 | TiO2 and Fe2O3 | ||
| 4 | 0.04 | 0.22 | 0.04 | 0.01 | 0.00 | 7.77 | 0.11 | 0.05 | 0.01 | 0.00 | 89.72 | 97.96 | 28.46 | 15.07 | 113.03 | 0.29 | 3 | 3.84 | 5.16 | 1.71 | TiO2 and Fe2O3 | ||
| 2f | 1 | 0.72 | 0.32 | 0.21 | 0.24 | 0.00 | 18.73 | 1.43 | 0.43 | 0.08 | 0.07 | 73.63 | 95.85 | 15.56 | 8.24 | 104.10 | 0.97 | 3 | 5.89 | 3.11 | 1.03 | 0.75 | psr/lpsr |
| 2 | 0.91 | 0.26 | 0.08 | 0.37 | 0.00 | 13.60 | 1.70 | 0.44 | 0.07 | 0.02 | 73.64 | 91.09 | 18.87 | 9.99 | 101.08 | 0.79 | 3 | 5.34 | 3.66 | 1.21 | 0.79 | psr/lpsr | |
| 3 | 0.72 | 0.31 | 0.16 | 0.23 | 0.00 | 17.99 | 1.30 | 0.41 | 0.02 | 0.03 | 74.07 | 95.25 | 16.43 | 8.70 | 103.95 | 0.92 | 3 | 5.74 | 3.26 | 1.08 | 0.77 | psr/lpsr | |
| 4 | 0.68 | 0.31 | 0.18 | 0.30 | 0.00 | 15.91 | 1.21 | 0.39 | 0.05 | 0.02 | 74.11 | 93.15 | 18.04 | 9.55 | 102.71 | 0.83 | 3 | 5.47 | 3.53 | 1.17 | 0.78 | psr/lpsr | |
| 5 | 1.01 | 0.25 | 0.08 | 0.44 | 0.00 | 12.30 | 1.73 | 0.52 | 0.08 | 0.03 | 74.47 | 90.89 | 19.76 | 10.46 | 101.35 | 0.74 | 3 | 5.20 | 3.80 | 1.26 | 0.80 | psr/lpsr | |
| 2g | 1 | 13.38 | 1.22 | 0.03 | 0.43 | 0.00 | 8.71 | 4.02 | 0.10 | 0.14 | 0.72 | 68.87 | 97.62 | 2.91 | 1.54 | 99.16 | 1.64 | 3 | 8.41 | 0.59 | 0.36 | TiO2 + Silicate mineral | |
| 2 | 5.45 | 0.44 | 0.01 | 0.39 | 0.00 | 6.55 | 1.44 | 0.09 | 0.19 | 0.28 | 82.75 | 97.59 | 20.59 | 10.90 | 108.50 | 0.67 | 3 | 5.16 | 3.84 | 1.33 | TiO2 + Silicate mineral | ||
| 2h | 2 | 1.26 | 0.23 | 0.17 | 0.29 | 0.00 | 6.64 | 1.56 | 1.08 | 0.06 | 0.03 | 85.63 | 96.95 | 25.05 | 13.27 | 110.21 | 0.46 | 3 | 4.39 | 4.61 | 1.54 | TiO2 and Fe2O3 | |
| 2i | 1 | 0.99 | 0.19 | 0.17 | 0.41 | 0.00 | 5.56 | 1.03 | 1.51 | 0.05 | 0.00 | 84.84 | 94.74 | 26.25 | 13.90 | 108.64 | 0.40 | 3 | 4.20 | 4.80 | 1.60 | TiO2 and Fe2O3 | |
| 3 | 1.01 | 0.16 | 0.08 | 0.37 | 0.00 | 5.55 | 1.04 | 1.62 | 0.10 | 0.05 | 87.32 | 97.28 | 26.42 | 13.99 | 111.27 | 0.39 | 3 | 4.17 | 4.83 | 1.61 | TiO2 and Fe2O3 | ||
| 2j | 2 | 0.94 | 0.54 | 0.09 | 0.46 | 0.00 | 13.33 | 0.74 | 0.91 | 0.02 | 0.05 | 79.56 | 96.64 | 20.42 | 10.82 | 107.45 | 0.70 | 3 | 5.08 | 3.92 | 1.30 | 0.81 | psr/lpsr |
| 4 | 0.94 | 0.16 | 0.03 | 0.37 | 0.00 | 5.30 | 0.62 | 1.37 | 0.08 | 0.04 | 88.36 | 97.27 | 27.41 | 14.51 | 111.78 | 0.34 | 3 | 4.02 | 4.98 | 1.66 | TiO2 and Fe2O3 | ||
| 2k | 1 | 0.61 | 0.17 | 0.03 | 0.42 | 0.00 | 3.75 | 0.72 | 0.90 | 0.05 | 0.03 | 87.49 | 94.16 | 29.09 | 15.40 | 109.57 | 0.27 | 3 | 3.78 | 5.22 | 1.73 | TiO2 and Fe2O3 | |
| 2 | 0.62 | 0.15 | 0.03 | 0.32 | 0.00 | 4.12 | 0.67 | 0.73 | 0.05 | 0.05 | 87.88 | 94.63 | 29.07 | 15.40 | 110.02 | 0.27 | 3 | 3.78 | 5.22 | 1.73 | TiO2 and Fe2O3 | ||
| 3 | 0.65 | 0.12 | 0.02 | 0.33 | 0.00 | 4.02 | 0.67 | 0.80 | 0.02 | 0.06 | 88.98 | 95.68 | 29.17 | 15.45 | 111.13 | 0.26 | 3 | 3.77 | 5.23 | 1.74 | TiO2 and Fe2O3 | ||
| 4 | 0.86 | 0.15 | 0.00 | 0.42 | 0.00 | 2.98 | 0.73 | 1.38 | 0.07 | 0.05 | 91.48 | 98.12 | 29.25 | 15.49 | 113.61 | 0.26 | 3 | 3.77 | 5.23 | 1.74 | TiO2 and Fe2O3 | ||
| 5 | 0.77 | 0.17 | 0.02 | 0.41 | 0.00 | 2.74 | 0.67 | 1.41 | 0.00 | 0.03 | 91.72 | 97.93 | 29.60 | 15.68 | 113.61 | 0.24 | 3 | 3.71 | 5.29 | 1.76 | TiO2 and Fe2O3 | ||
| 2l | 1 | 1.05 | 0.20 | 0.03 | 0.42 | 0.00 | 3.39 | 2.06 | 1.06 | 0.04 | 0.05 | 88.22 | 96.52 | 27.40 | 14.51 | 111.03 | 0.35 | 3 | 4.06 | 4.94 | 1.65 | TiO2 and Fe2O3 | |
| 4 | 1.03 | 0.21 | 0.08 | 0.37 | 0.00 | 2.79 | 1.82 | 1.10 | 0.07 | 0.05 | 89.26 | 96.77 | 28.13 | 14.90 | 111.67 | 0.32 | 3 | 3.95 | 5.05 | 1.68 | TiO2 and Fe2O3 | ||
| 2m | 2 | 0.78 | 0.19 | 0.09 | 0.20 | 0.00 | 11.07 | 2.64 | 0.18 | 0.08 | 0.03 | 81.63 | 96.89 | 21.62 | 11.45 | 108.33 | 0.64 | 3 | 4.92 | 4.08 | 1.36 | 0.82 | psr/lpsr |
| 3 | 0.73 | 0.17 | 0.02 | 0.25 | 0.00 | 9.12 | 2.21 | 0.19 | 0.06 | 0.04 | 83.17 | 95.95 | 23.74 | 12.57 | 108.52 | 0.53 | 3 | 4.58 | 4.42 | 1.47 | 0.85 | psr/lpsr | |
| 5 | 0.75 | 0.15 | 0.07 | 0.27 | 0.00 | 5.23 | 1.61 | 0.24 | 0.06 | 0.01 | 85.39 | 93.77 | 27.37 | 14.50 | 108.27 | 0.35 | 3 | 4.04 | 4.96 | 1.65 | TiO2 and Fe2O3 | ||
| 9 | 0.67 | 0.14 | 0.06 | 0.26 | 0.00 | 5.01 | 1.55 | 0.24 | 0.05 | 0.02 | 87.35 | 95.36 | 27.86 | 14.76 | 110.11 | 0.33 | 3 | 3.97 | 5.03 | 1.67 | TiO2 and Fe2O3 | ||
| 2n | 1 | 0.90 | 0.17 | 0.05 | 0.41 | 0.00 | 4.62 | 1.05 | 0.59 | 0.03 | 0.02 | 85.82 | 93.66 | 27.90 | 14.78 | 108.44 | 0.32 | 3 | 3.96 | 5.04 | 1.68 | TiO2 and Fe2O3 | |
| 5 | 0.88 | 0.15 | 0.03 | 0.29 | 0.00 | 3.83 | 0.99 | 0.69 | 0.08 | 0.04 | 90.05 | 97.02 | 28.87 | 15.29 | 112.31 | 0.28 | 3 | 3.82 | 5.18 | 1.72 | TiO2 and Fe2O3 | ||
| 3a | 2 | 1.03 | 0.24 | 0.08 | 0.53 | 0.00 | 9.89 | 3.14 | 0.60 | 0.09 | 0.02 | 78.37 | 93.98 | 20.59 | 10.90 | 104.89 | 0.70 | 3 | 5.09 | 3.91 | 1.30 | 0.81 | psr/lpsr |
| 3 | 1.00 | 0.22 | 0.06 | 0.51 | 0.00 | 9.18 | 2.98 | 0.60 | 0.07 | 0.02 | 79.27 | 93.91 | 21.50 | 11.39 | 105.30 | 0.65 | 3 | 4.95 | 4.05 | 1.35 | 0.82 | psr/lpsr | |
| 5 | 0.98 | 0.24 | 0.04 | 0.40 | 0.00 | 10.39 | 2.90 | 0.81 | 0.12 | 0.05 | 80.73 | 96.66 | 20.83 | 11.03 | 107.69 | 0.69 | 3 | 5.05 | 3.95 | 1.31 | 0.81 | psr/lpsr | |
| 6 | 0.96 | 0.25 | 0.03 | 0.36 | 0.00 | 10.51 | 2.62 | 0.90 | 0.10 | 0.07 | 81.31 | 97.09 | 21.11 | 11.18 | 108.27 | 0.67 | 3 | 5.00 | 4.00 | 1.33 | 0.82 | psr/lpsr | |
| 3b | 1 | 1.87 | 0.48 | 0.09 | 0.50 | 0.00 | 4.19 | 2.30 | 0.82 | 0.06 | 0.05 | 82.13 | 92.49 | 24.89 | 13.18 | 105.67 | 0.48 | 3 | 4.45 | 4.55 | 1.52 | TiO2 and Fe2O3 | |
| 3 | 1.23 | 0.31 | 0.11 | 0.41 | 0.00 | 4.36 | 2.11 | 0.65 | 0.12 | 0.09 | 84.15 | 93.54 | 26.18 | 13.87 | 107.40 | 0.42 | 3 | 4.24 | 4.76 | 1.58 | TiO2 and Fe2O3 | ||
| 5 | 1.70 | 0.39 | 0.03 | 0.39 | 0.00 | 3.83 | 2.17 | 0.97 | 0.12 | 0.08 | 86.61 | 96.28 | 25.98 | 13.76 | 110.04 | 0.43 | 3 | 4.28 | 4.72 | 1.57 | TiO2 and Fe2O3 | ||
| 3c | 1 | 97.64 | 0.00 | 0.00 | 0.01 | 0.00 | 0.02 | 0.01 | 0.03 | 0.00 | 0.01 | 1.14 | 98.86 | Silica | |||||||||
| 2 | 0.73 | 0.13 | 0.05 | 0.31 | 0.00 | 3.22 | 1.16 | 1.75 | 0.07 | 0.01 | 88.11 | 95.54 | 28.38 | 15.03 | 110.57 | 0.30 | 3 | 3.89 | 5.11 | 1.70 | TiO2 and Fe2O3 | ||
| 6 | 0.79 | 0.14 | 0.05 | 0.30 | 0.00 | 3.35 | 1.23 | 1.64 | 0.08 | 0.02 | 89.49 | 97.08 | 28.33 | 15.00 | 112.08 | 0.30 | 3 | 3.90 | 5.10 | 1.70 | TiO2 and Fe2O3 | ||
| 3d | 1 | 10.89 | 4.09 | 0.13 | 0.17 | 0.00 | 8.40 | 4.86 | 0.10 | 0.03 | 0.82 | 67.82 | 97.32 | Silicate mineral + TiO2 | |||||||||
| 2 | 9.28 | 3.73 | 0.07 | 0.28 | 0.00 | 7.78 | 4.79 | 0.11 | 0.08 | 0.61 | 70.15 | 96.87 | Silicate mineral + TiO2 | ||||||||||
| 4 | 7.54 | 3.32 | 0.07 | 0.14 | 0.00 | 6.33 | 3.81 | 0.11 | 0.04 | 0.19 | 75.80 | 97.35 | Silicate mineral + TiO2 | ||||||||||
| 7 | 10.33 | 0.51 | 0.05 | 0.16 | 0.00 | 3.47 | 0.77 | 0.10 | 0.06 | 0.27 | 83.36 | 99.09 | Silicate mineral + TiO2 | ||||||||||
| 3e | 1 | 3.48 | 0.30 | 0.01 | 0.30 | 0.00 | 4.49 | 5.10 | 0.43 | 0.09 | 0.08 | 83.47 | 97.76 | 20.76 | 11.00 | 108.76 | 0.68 | 3 | 5.15 | 3.85 | 1.32 | TiO2 and Fe2O3 | |
| 4 | 2.77 | 0.26 | 0.02 | 0.28 | 0.00 | 4.00 | 4.44 | 0.44 | 0.06 | 0.05 | 85.30 | 97.62 | 22.89 | 12.12 | 109.74 | 0.57 | 3 | 4.80 | 4.20 | 1.43 | TiO2 and Fe2O3 | ||
| 6 | 1.78 | 0.20 | 0.00 | 0.30 | 0.00 | 4.40 | 3.82 | 0.42 | 0.02 | 0.03 | 86.42 | 97.41 | 24.54 | 12.99 | 110.40 | 0.49 | 3 | 4.52 | 4.48 | 1.51 | TiO2 and Fe2O3 | ||
| 3f | 2 | 19.68 | 1.66 | 0.04 | 0.39 | 0.00 | 5.88 | 12.99 | 0.11 | 0.09 | 0.18 | 54.08 | 95.09 | Silicate mineral | |||||||||
| 3 | 14.47 | 0.92 | 0.05 | 0.36 | 0.00 | 5.97 | 10.83 | 0.11 | 0.12 | 0.08 | 63.31 | 96.21 | Silicate mineral | ||||||||||
| 5 | 4.67 | 0.35 | 0.03 | 0.45 | 0.00 | 7.81 | 3.00 | 0.11 | 0.11 | 0.04 | 80.91 | 97.48 | 18.86 | 9.99 | 107.47 | 0.76 | 3 | 5.44 | 3.56 | 1.24 | TiO2 and Fe2O3 | ||
| 7 | 1.49 | 0.04 | 0.03 | 0.36 | 0.00 | 7.45 | 0.74 | 0.08 | 0.11 | 0.02 | 87.33 | 97.65 | 26.11 | 13.83 | 111.48 | 0.40 | 3 | 4.22 | 4.78 | 1.60 | TiO2 and Fe2O3 | ||
| 3g | 1 | 46.65 | 1.49 | 0.03 | 0.44 | 0.00 | 5.27 | 29.01 | 0.04 | 1.29 | 2.73 | 3.11 | 90.06 | Silicate mineral | |||||||||
| 3 | 30.48 | 0.00 | 0.00 | 28.84 | 0.00 | 0.14 | 0.56 | 0.01 | 0.02 | 0.00 | 41.06 | 101.11 | Sphene | ||||||||||
| 5 | 30.06 | 0.00 | 0.03 | 28.43 | 0.00 | 0.21 | 0.78 | 0.03 | 0.01 | 0.01 | 41.21 | 100.76 | Sphene | ||||||||||
| 6 | 5.10 | 0.00 | 0.00 | 0.46 | 0.00 | 0.18 | 0.09 | 0.06 | 0.00 | 0.03 | 84.87 | 90.80 | 27.97 | 14.81 | 105.61 | 0.28 | 3 | 4.05 | 4.95 | 1.72 | TiO2 and Fe2O3 | ||
| 9 | 0.05 | 0.02 | 0.00 | 0.32 | 0.00 | 0.27 | 0.00 | 0.05 | 0.01 | 0.03 | 100.31 | 101.05 | 34.20 | 18.11 | 119.16 | 0.03 | 3 | 3.07 | 5.93 | 1.97 | TiO2 and Fe2O3 | ||
| 3h | 3 | 28.34 | 0.01 | 0.00 | 26.51 | 0.00 | 1.11 | 2.44 | 0.01 | 0.00 | 0.01 | 41.92 | 100.33 | Sphene | |||||||||
| 4 | 27.51 | 0.02 | 0.00 | 25.23 | 0.00 | 2.31 | 1.18 | 0.00 | 0.00 | 0.00 | 43.76 | 100.00 | Sphene | ||||||||||
| 5 | 2.04 | 0.38 | 0.11 | 0.99 | 0.00 | 3.33 | 8.81 | 0.02 | 0.18 | 0.06 | 72.12 | 88.04 | 16.90 | 8.95 | 96.99 | 0.94 | 3 | 5.81 | 3.19 | 1.06 | TiO2 and Fe2O3 | ||
| 6 | 0.20 | 0.02 | 0.00 | 0.71 | 0.00 | 2.33 | 0.44 | 0.00 | 0.00 | 0.02 | 96.97 | 100.68 | 31.91 | 16.90 | 117.58 | 0.13 | 3 | 3.38 | 5.62 | 1.87 | TiO2 and Fe2O3 | ||
| 10 | 0.01 | 0.01 | 0.00 | 0.56 | 0.00 | 0.35 | 0.00 | 0.01 | 0.02 | 0.01 | 100.07 | 101.02 | 34.07 | 18.04 | 119.06 | 0.04 | 3 | 3.08 | 5.92 | 1.96 | TiO2 and Fe2O3 | ||
| 3i | 1 | 0.51 | 0.10 | 0.03 | 0.24 | 0.00 | 5.97 | 0.87 | 0.78 | 0.05 | 0.00 | 84.72 | 93.27 | 27.49 | 14.56 | 107.83 | 0.34 | 3 | 4.01 | 4.99 | 1.66 | TiO2 and Fe2O3 | |
| 4 | 0.48 | 0.09 | 0.00 | 0.22 | 0.00 | 5.97 | 0.88 | 0.79 | 0.04 | 0.01 | 86.01 | 94.49 | 27.64 | 14.64 | 109.13 | 0.33 | 3 | 3.98 | 5.02 | 1.67 | TiO2 and Fe2O3 | ||
| 8 | 0.51 | 0.08 | 0.00 | 0.21 | 0.00 | 5.59 | 0.81 | 0.79 | 0.11 | 0.03 | 89.22 | 97.36 | 28.16 | 14.91 | 112.27 | 0.31 | 3 | 3.91 | 5.09 | 1.69 | TiO2 and Fe2O3 | ||
| 10 | 0.60 | 0.10 | 0.01 | 0.10 | 0.00 | 4.91 | 0.82 | 0.83 | 0.11 | 0.03 | 90.30 | 97.80 | 28.64 | 15.17 | 112.97 | 0.28 | 3 | 3.84 | 5.16 | 1.72 | TiO2 and Fe2O3 | ||
3.1.3. The Detected Pale Brown-, Yellow-, and Cream-Coloured Grains at 0.5 Ampere
3.1.4. The Detected Black Coloured Grains at 0.5 Ampere


| Grains | Spots | Wt% | Molecular Formula | Lost Fe | Ti/(Ti + Fe) | Mineral Phase | |||||||||||||||||
|---|---|---|---|---|---|---|---|---|---|---|---|---|---|---|---|---|---|---|---|---|---|---|---|
| SiO2 | MgO | MnO | CaO | ZnO | Fe2O3 | Al2O3 | Cr2O3 | Na2O | K2O | TiO2 | O Total | OH% | H2O% | N Total | Fe2 | Ti3 | Ox | OHy | |||||
| 4a | 1 | 0.44 | 0.18 | 0.93 | 0.20 | 0.00 | 29.35 | 0.26 | 0.19 | 0.04 | 0.03 | 64.15 | 95.76 | 6.97 | 3.69 | 99.45 | 1.51 | 3 | 7.48 | 1.52 | 0.49 | 0.66 | psr/lpsr |
| 2 | 0.46 | 0.20 | 0.93 | 0.21 | 0.00 | 26.59 | 0.29 | 0.15 | 0.01 | 0.02 | 67.01 | 95.87 | 9.77 | 5.17 | 101.04 | 1.33 | 3 | 6.92 | 2.08 | 0.67 | 0.69 | psr/lpsr | |
| 3 | 0.58 | 0.22 | 0.80 | 0.24 | 0.00 | 24.25 | 0.35 | 0.23 | 0.09 | 0.04 | 68.44 | 95.23 | 11.54 | 6.11 | 101.35 | 1.22 | 3 | 6.59 | 2.41 | 0.78 | 0.71 | psr/lpsr | |
| 4 | 0.67 | 0.27 | 0.77 | 0.27 | 0.00 | 23.46 | 0.44 | 0.19 | 0.08 | 0.03 | 69.43 | 95.60 | 12.17 | 6.44 | 102.04 | 1.18 | 3 | 6.48 | 2.52 | 0.82 | 0.72 | psr/lpsr | |
| 4b | 1 | 0.74 | 0.25 | 0.95 | 0.18 | 0.00 | 36.16 | 0.28 | 0.09 | 0.01 | 0.03 | 59.16 | 97.83 | 0.13 | 0.07 | 97.90 | 2.01 | 3 | 8.97 | 0.03 | -0.01 | 0.60 | psr/lpsr |
| 2 | 0.27 | 0.14 | 0.86 | 0.14 | 0.00 | 32.45 | 0.18 | 0.10 | 0.00 | 0.00 | 63.08 | 97.22 | 4.96 | 2.63 | 99.85 | 1.65 | 3 | 7.89 | 1.11 | 0.35 | 0.65 | psr/lpsr | |
| 3 | 0.27 | 0.08 | 0.71 | 0.16 | 0.00 | 30.98 | 0.16 | 0.08 | 0.01 | 0.02 | 63.76 | 96.22 | 6.34 | 3.36 | 99.58 | 1.55 | 3 | 7.60 | 1.40 | 0.45 | 0.66 | psr/lpsr | |
| 4 | 0.61 | 0.19 | 0.44 | 0.25 | 0.00 | 25.14 | 0.36 | 0.14 | 0.04 | 0.03 | 68.88 | 96.07 | 11.32 | 6.00 | 102.06 | 1.22 | 3 | 6.63 | 2.37 | 0.78 | 0.71 | psr/lpsr | |
| 4c | 1 | 0.12 | 0.07 | 1.50 | 0.08 | 0.00 | 34.40 | 0.11 | 0.02 | 0.03 | 0.00 | 62.68 | 99.01 | 3.57 | 1.89 | 100.90 | 1.76 | 3 | 8.19 | 0.81 | 0.24 | 0.63 | psr/lpsr |
| 2 | 0.12 | 0.12 | 1.48 | 0.08 | 0.00 | 33.86 | 0.11 | 0.02 | 0.01 | 0.02 | 63.10 | 98.92 | 4.06 | 2.15 | 101.07 | 1.73 | 3 | 8.08 | 0.92 | 0.27 | 0.63 | psr/lpsr | |
| 3 | 0.17 | 0.11 | 1.62 | 0.11 | 0.00 | 33.97 | 0.12 | 0.03 | 0.02 | 0.01 | 63.68 | 99.83 | 4.05 | 2.15 | 101.97 | 1.73 | 3 | 8.09 | 0.91 | 0.27 | 0.63 | psr/lpsr | |
| 4d | 1 | 0.20 | 0.30 | 0.93 | 0.07 | 0.00 | 31.97 | 0.15 | 0.05 | 0.00 | 0.01 | 63.75 | 97.43 | 5.54 | 2.93 | 100.36 | 1.61 | 3 | 7.77 | 1.23 | 0.39 | 0.65 | psr/lpsr |
| 2 | 0.28 | 0.39 | 1.51 | 0.10 | 0.00 | 30.44 | 0.15 | 0.04 | 0.02 | 0.02 | 64.02 | 96.96 | 6.17 | 3.27 | 100.23 | 1.58 | 3 | 7.64 | 1.36 | 0.42 | 0.65 | psr/lpsr | |
| 3 | 0.35 | 0.32 | 0.43 | 0.12 | 0.00 | 29.03 | 0.20 | 0.05 | 0.08 | 0.01 | 66.45 | 97.07 | 8.37 | 4.43 | 101.50 | 1.42 | 3 | 7.20 | 1.80 | 0.58 | 0.68 | psr/lpsr | |
| 4e | 1 | 0.20 | 0.21 | 1.40 | 0.12 | 0.00 | 31.33 | 0.14 | 0.04 | 0.06 | 0.02 | 65.10 | 98.63 | 6.22 | 3.29 | 101.92 | 1.58 | 3 | 7.63 | 1.37 | 0.42 | 0.66 | psr/lpsr |
| 2 | 0.57 | 0.32 | 0.99 | 0.31 | 0.00 | 20.69 | 0.41 | 0.15 | 0.05 | 0.02 | 71.12 | 94.64 | 14.56 | 7.71 | 102.35 | 1.04 | 3 | 6.04 | 2.96 | 0.96 | 0.74 | psr/lpsr | |
| 3 | 0.61 | 0.29 | 1.10 | 0.28 | 0.00 | 20.31 | 0.47 | 0.16 | 0.08 | 0.03 | 71.48 | 94.81 | 14.76 | 7.82 | 102.63 | 1.03 | 3 | 6.01 | 2.99 | 0.97 | 0.74 | psr/lpsr | |
| 4 | 0.51 | 0.26 | 1.21 | 0.29 | 0.00 | 20.74 | 0.36 | 0.14 | 0.07 | 0.03 | 72.51 | 96.12 | 14.91 | 7.90 | 104.02 | 1.02 | 3 | 5.97 | 3.03 | 0.98 | 0.75 | psr/lpsr | |
| 4f | 1 | 0.34 | 0.29 | 0.32 | 0.13 | 0.00 | 24.03 | 1.32 | 0.31 | 0.04 | 0.02 | 71.62 | 98.41 | 12.10 | 6.41 | 104.82 | 1.18 | 3 | 6.50 | 2.50 | 0.82 | 0.72 | psr/lpsr |
| 2 | 0.47 | 0.25 | 0.21 | 0.16 | 0.00 | 21.62 | 1.46 | 0.45 | 0.04 | 0.01 | 74.70 | 99.38 | 14.20 | 7.52 | 106.89 | 1.05 | 3 | 6.12 | 2.88 | 0.95 | 0.74 | psr/lpsr | |
| 3 | 0.97 | 0.16 | 0.03 | 0.35 | 0.00 | 7.45 | 1.72 | 0.95 | 0.08 | 0.06 | 85.65 | 97.42 | 24.80 | 13.14 | 110.55 | 0.48 | 3 | 4.42 | 4.58 | 1.52 | 0.86 | psr/lpsr | |
| 4g | 1 | 0.42 | 0.25 | 0.42 | 0.14 | 0.00 | 31.32 | 0.25 | 0.16 | 0.04 | 0.01 | 64.26 | 97.25 | 5.98 | 3.17 | 100.42 | 1.57 | 3 | 7.68 | 1.32 | 0.43 | 0.66 | psr/lpsr |
| 2 | 0.65 | 0.23 | 0.25 | 0.22 | 0.00 | 27.76 | 0.42 | 0.27 | 0.05 | 0.03 | 67.82 | 97.69 | 9.08 | 4.81 | 102.50 | 1.36 | 3 | 7.06 | 1.94 | 0.64 | 0.69 | psr/lpsr | |
| 3 | 0.66 | 0.16 | 0.34 | 0.27 | 0.00 | 25.37 | 0.50 | 0.29 | 0.05 | 0.05 | 69.50 | 97.18 | 11.07 | 5.86 | 103.05 | 1.24 | 3 | 6.68 | 2.32 | 0.76 | 0.71 | psr/lpsr | |
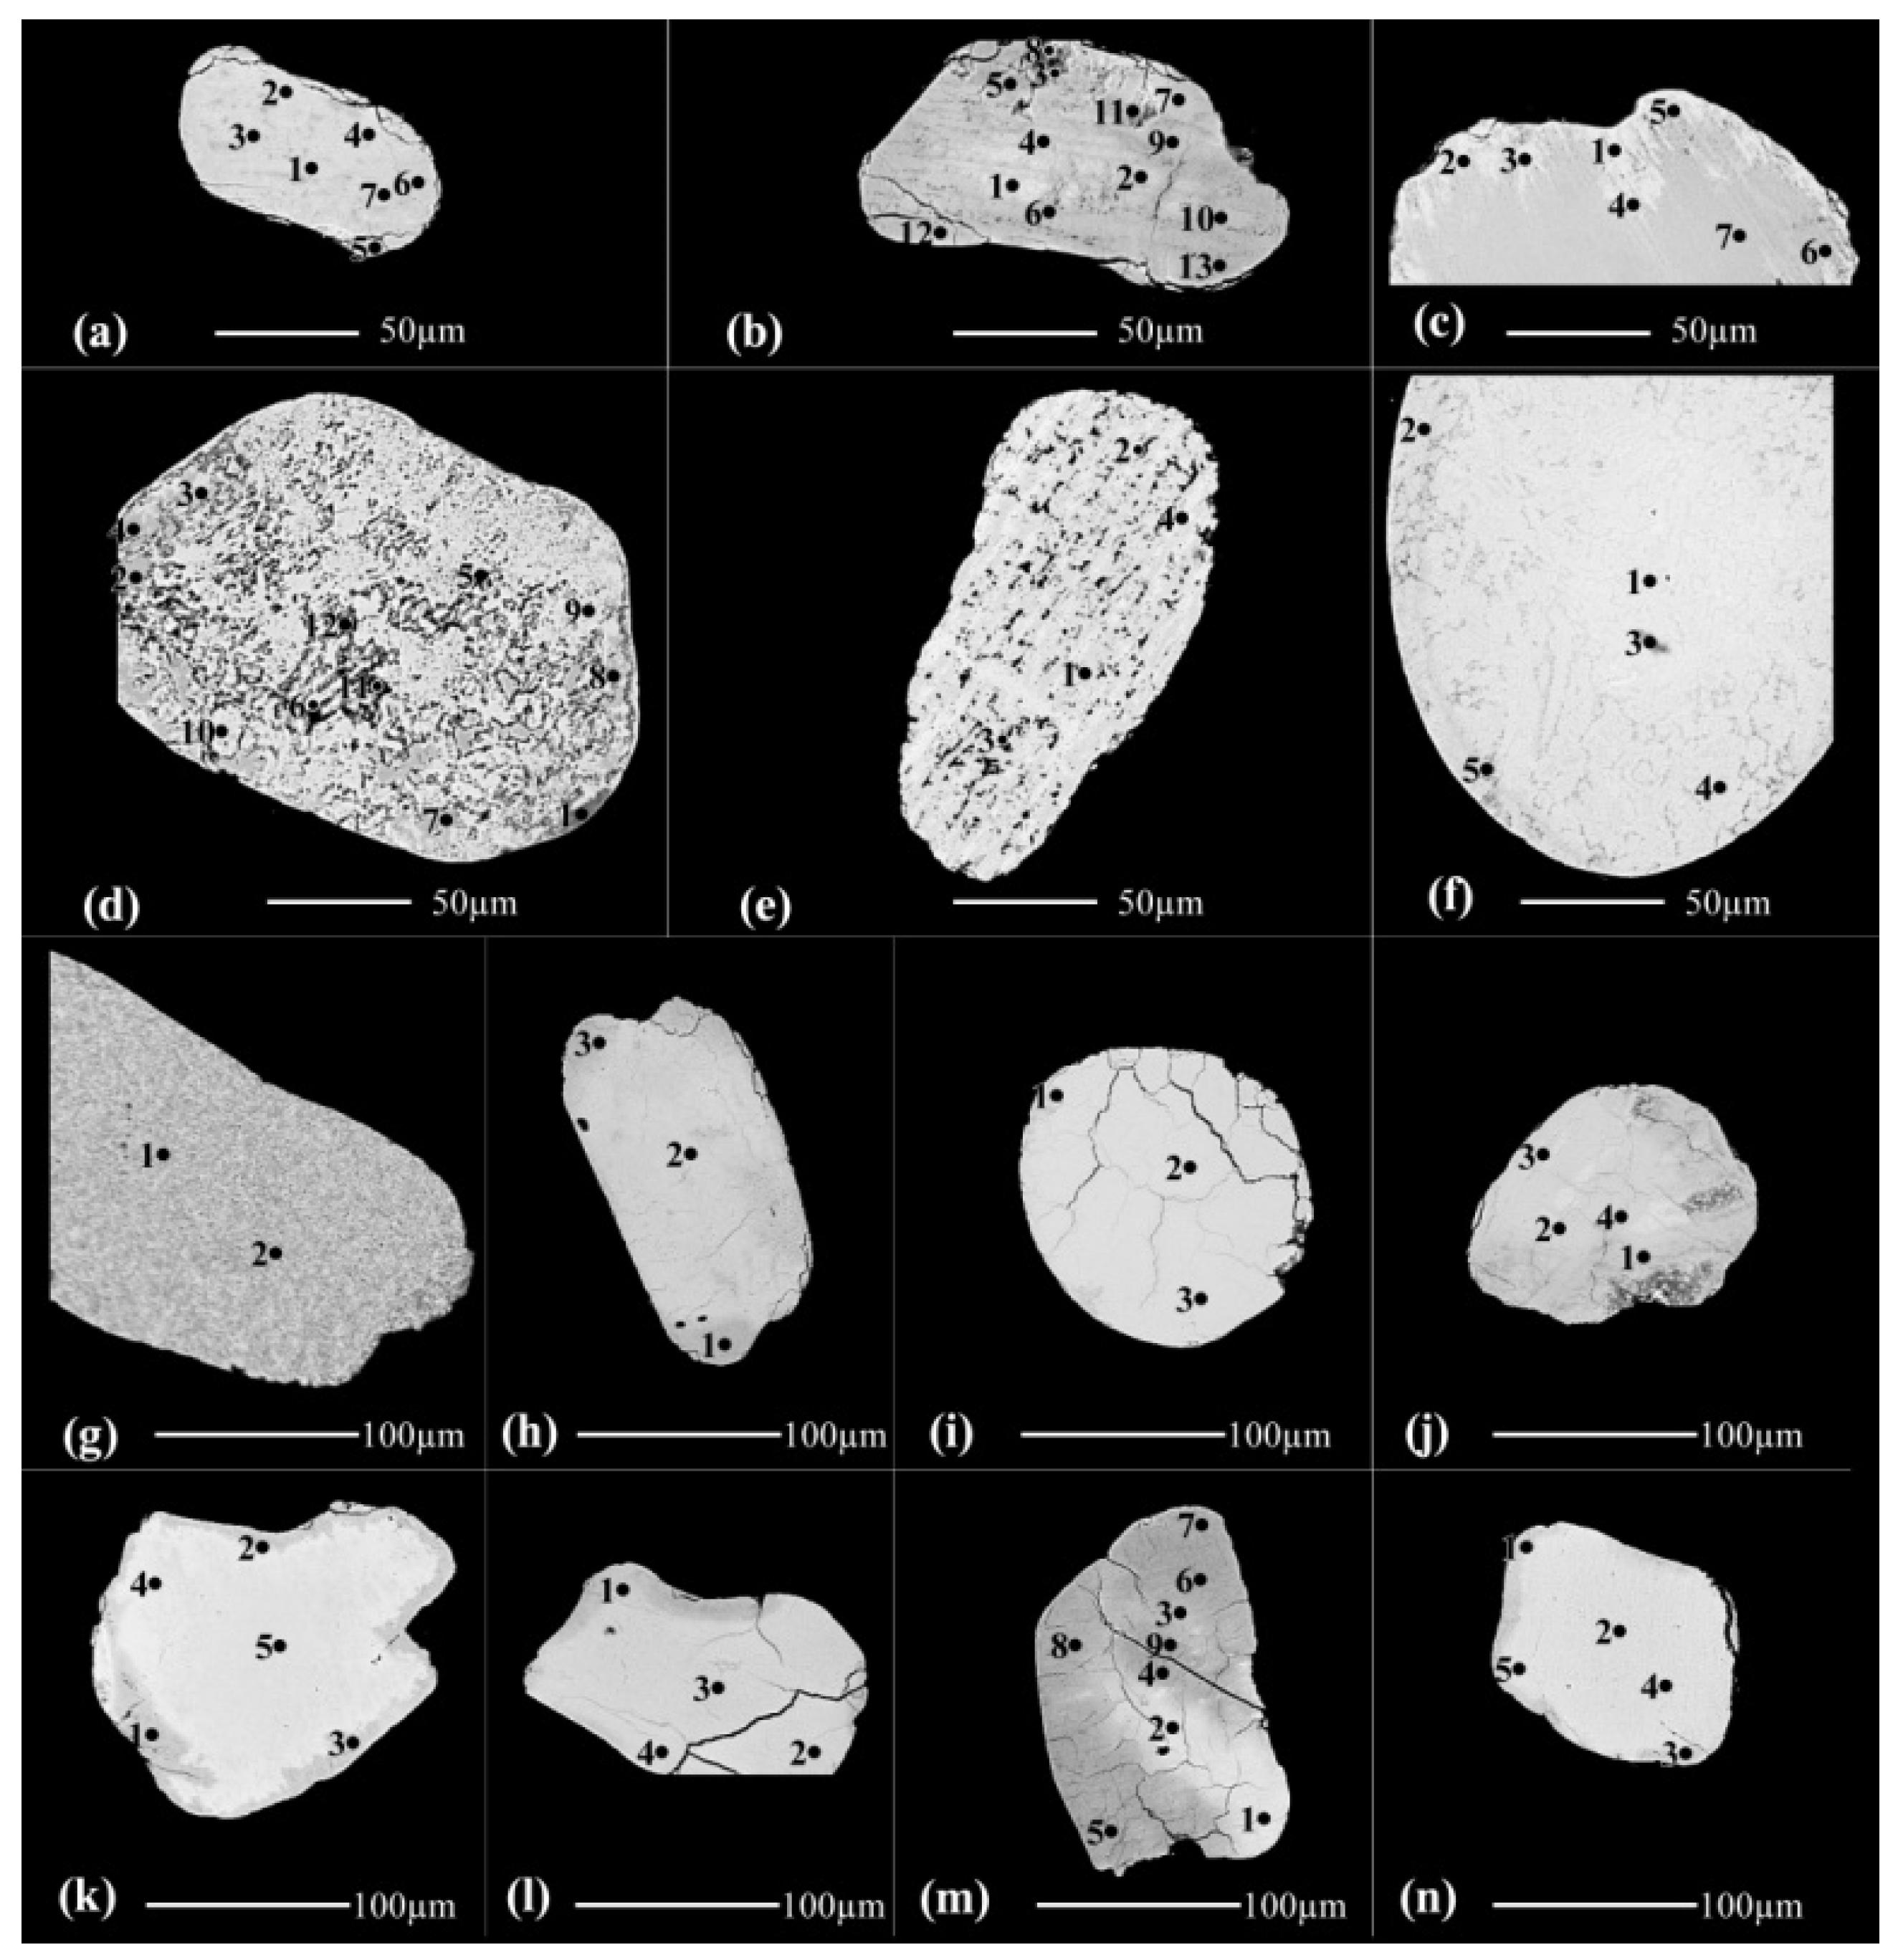
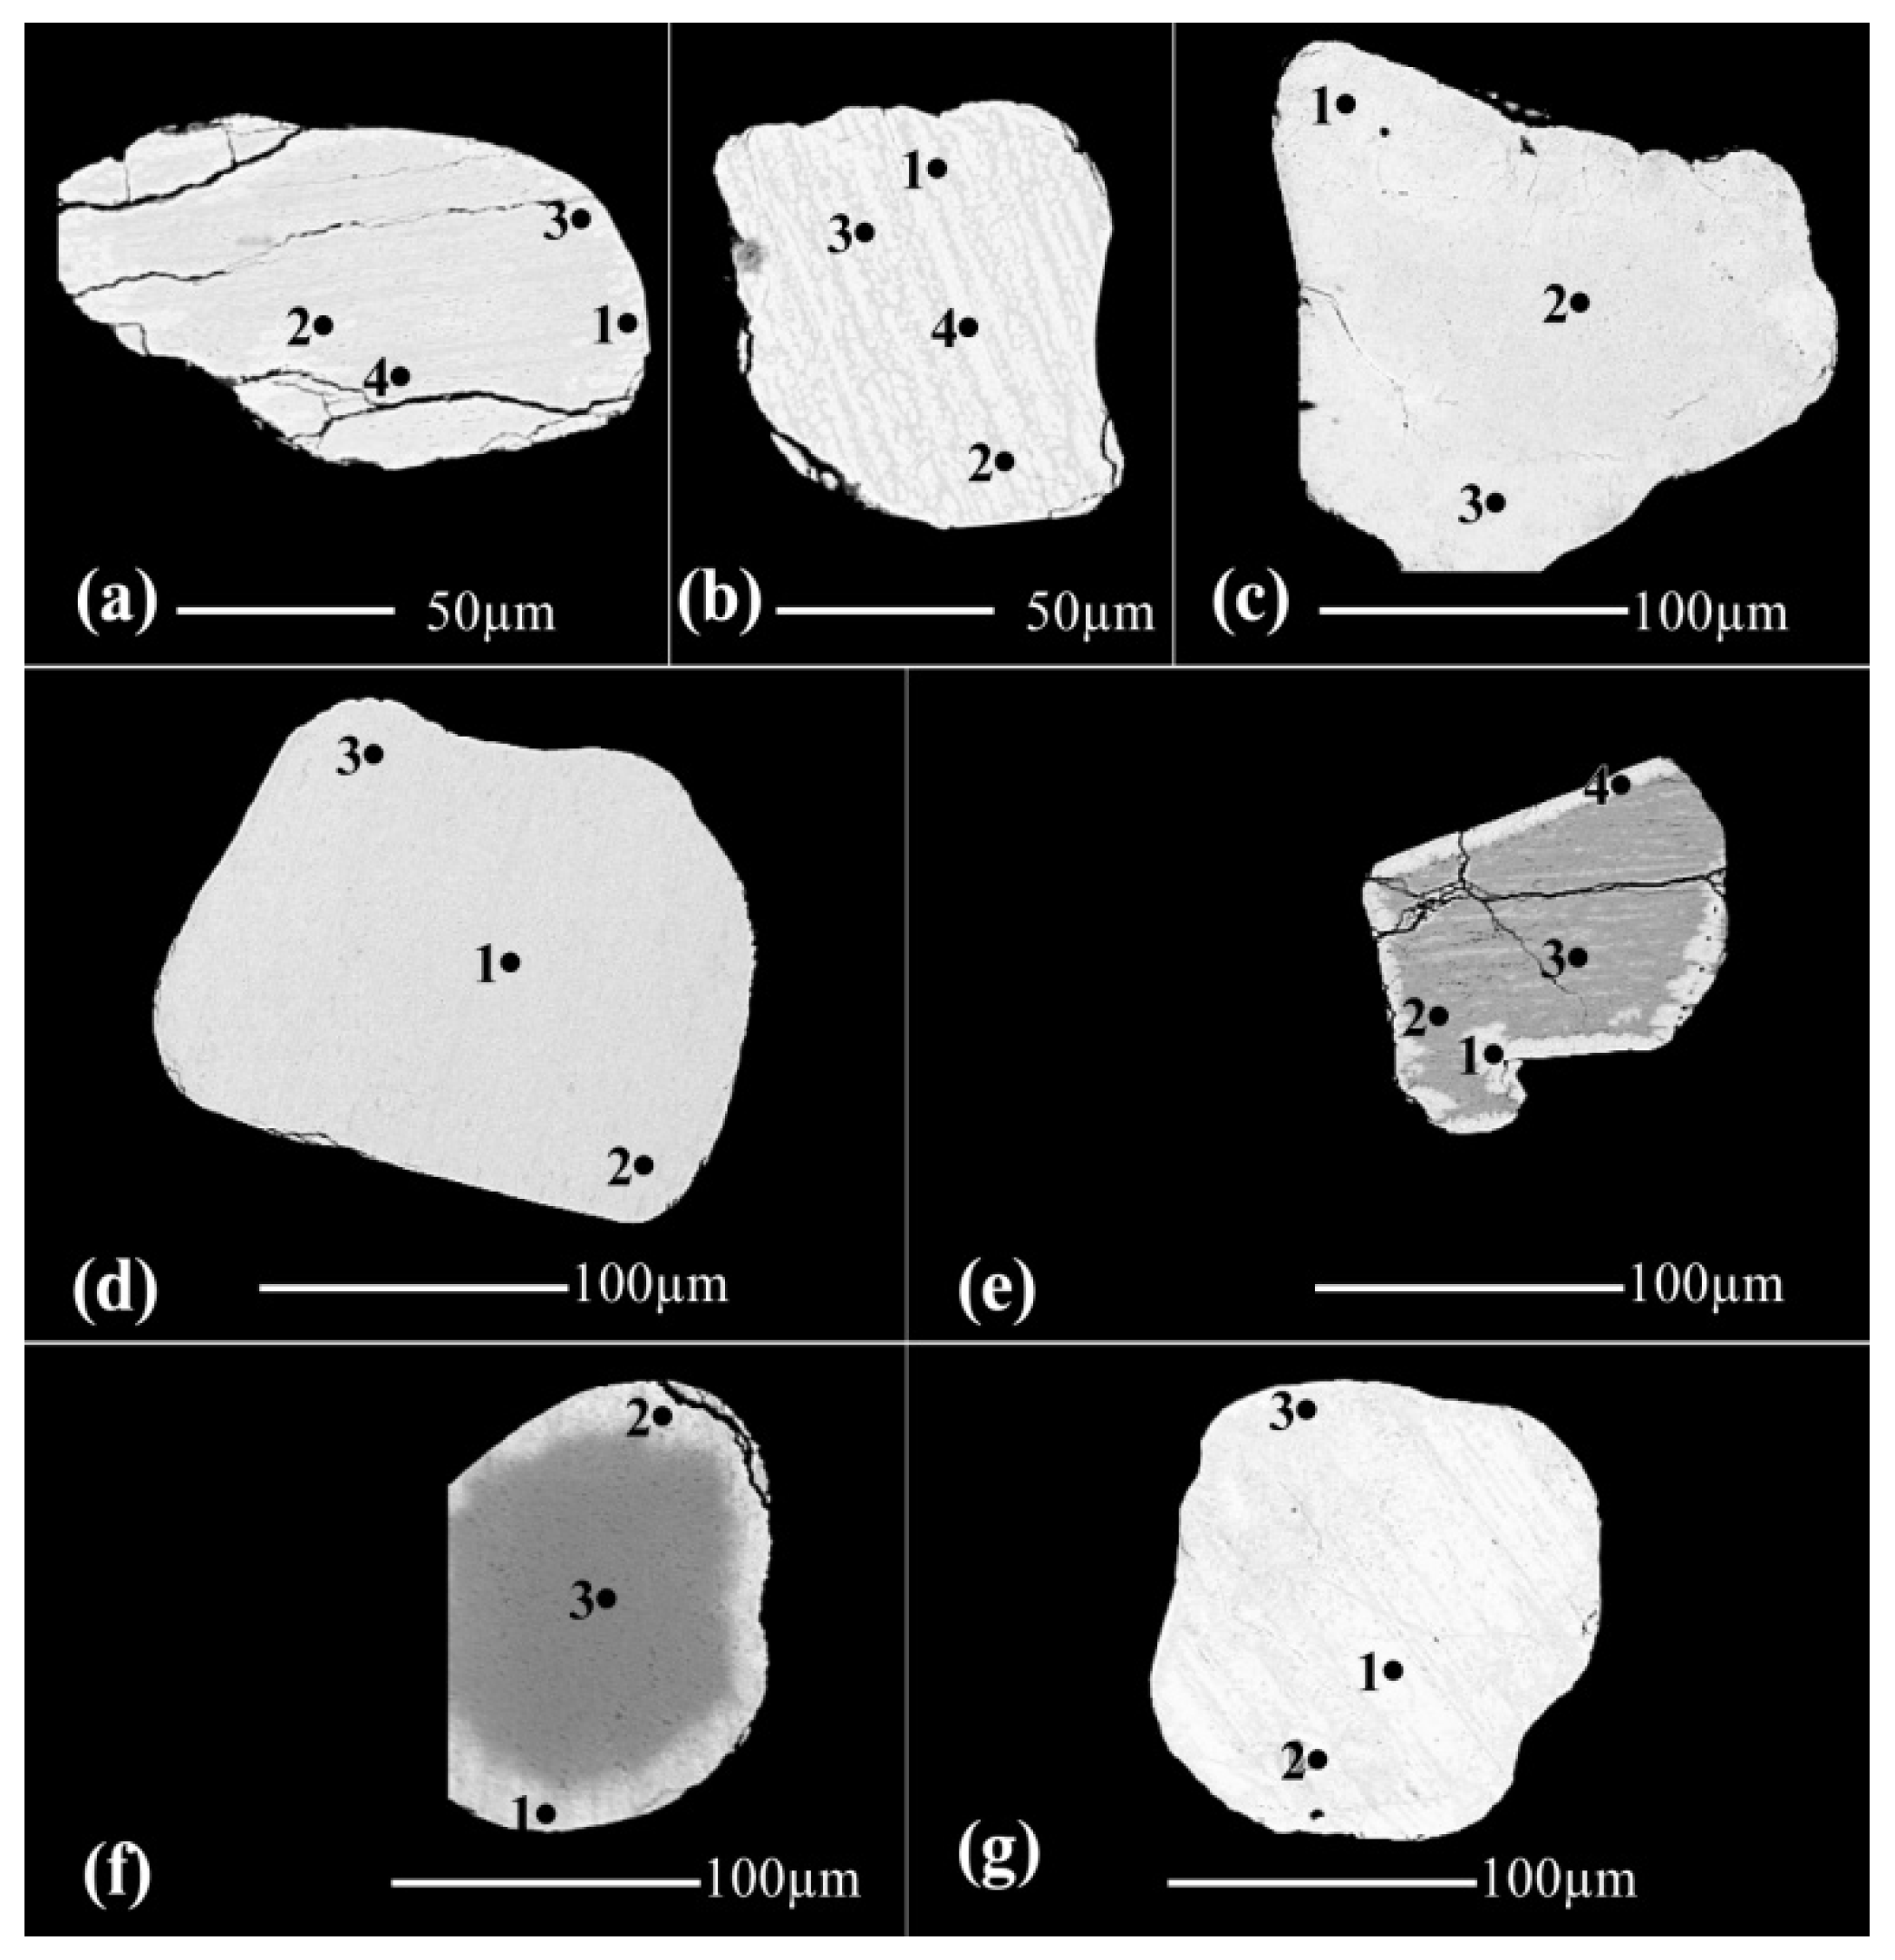
3.2. The Separated Magnetic Fraction at 1 Ampere

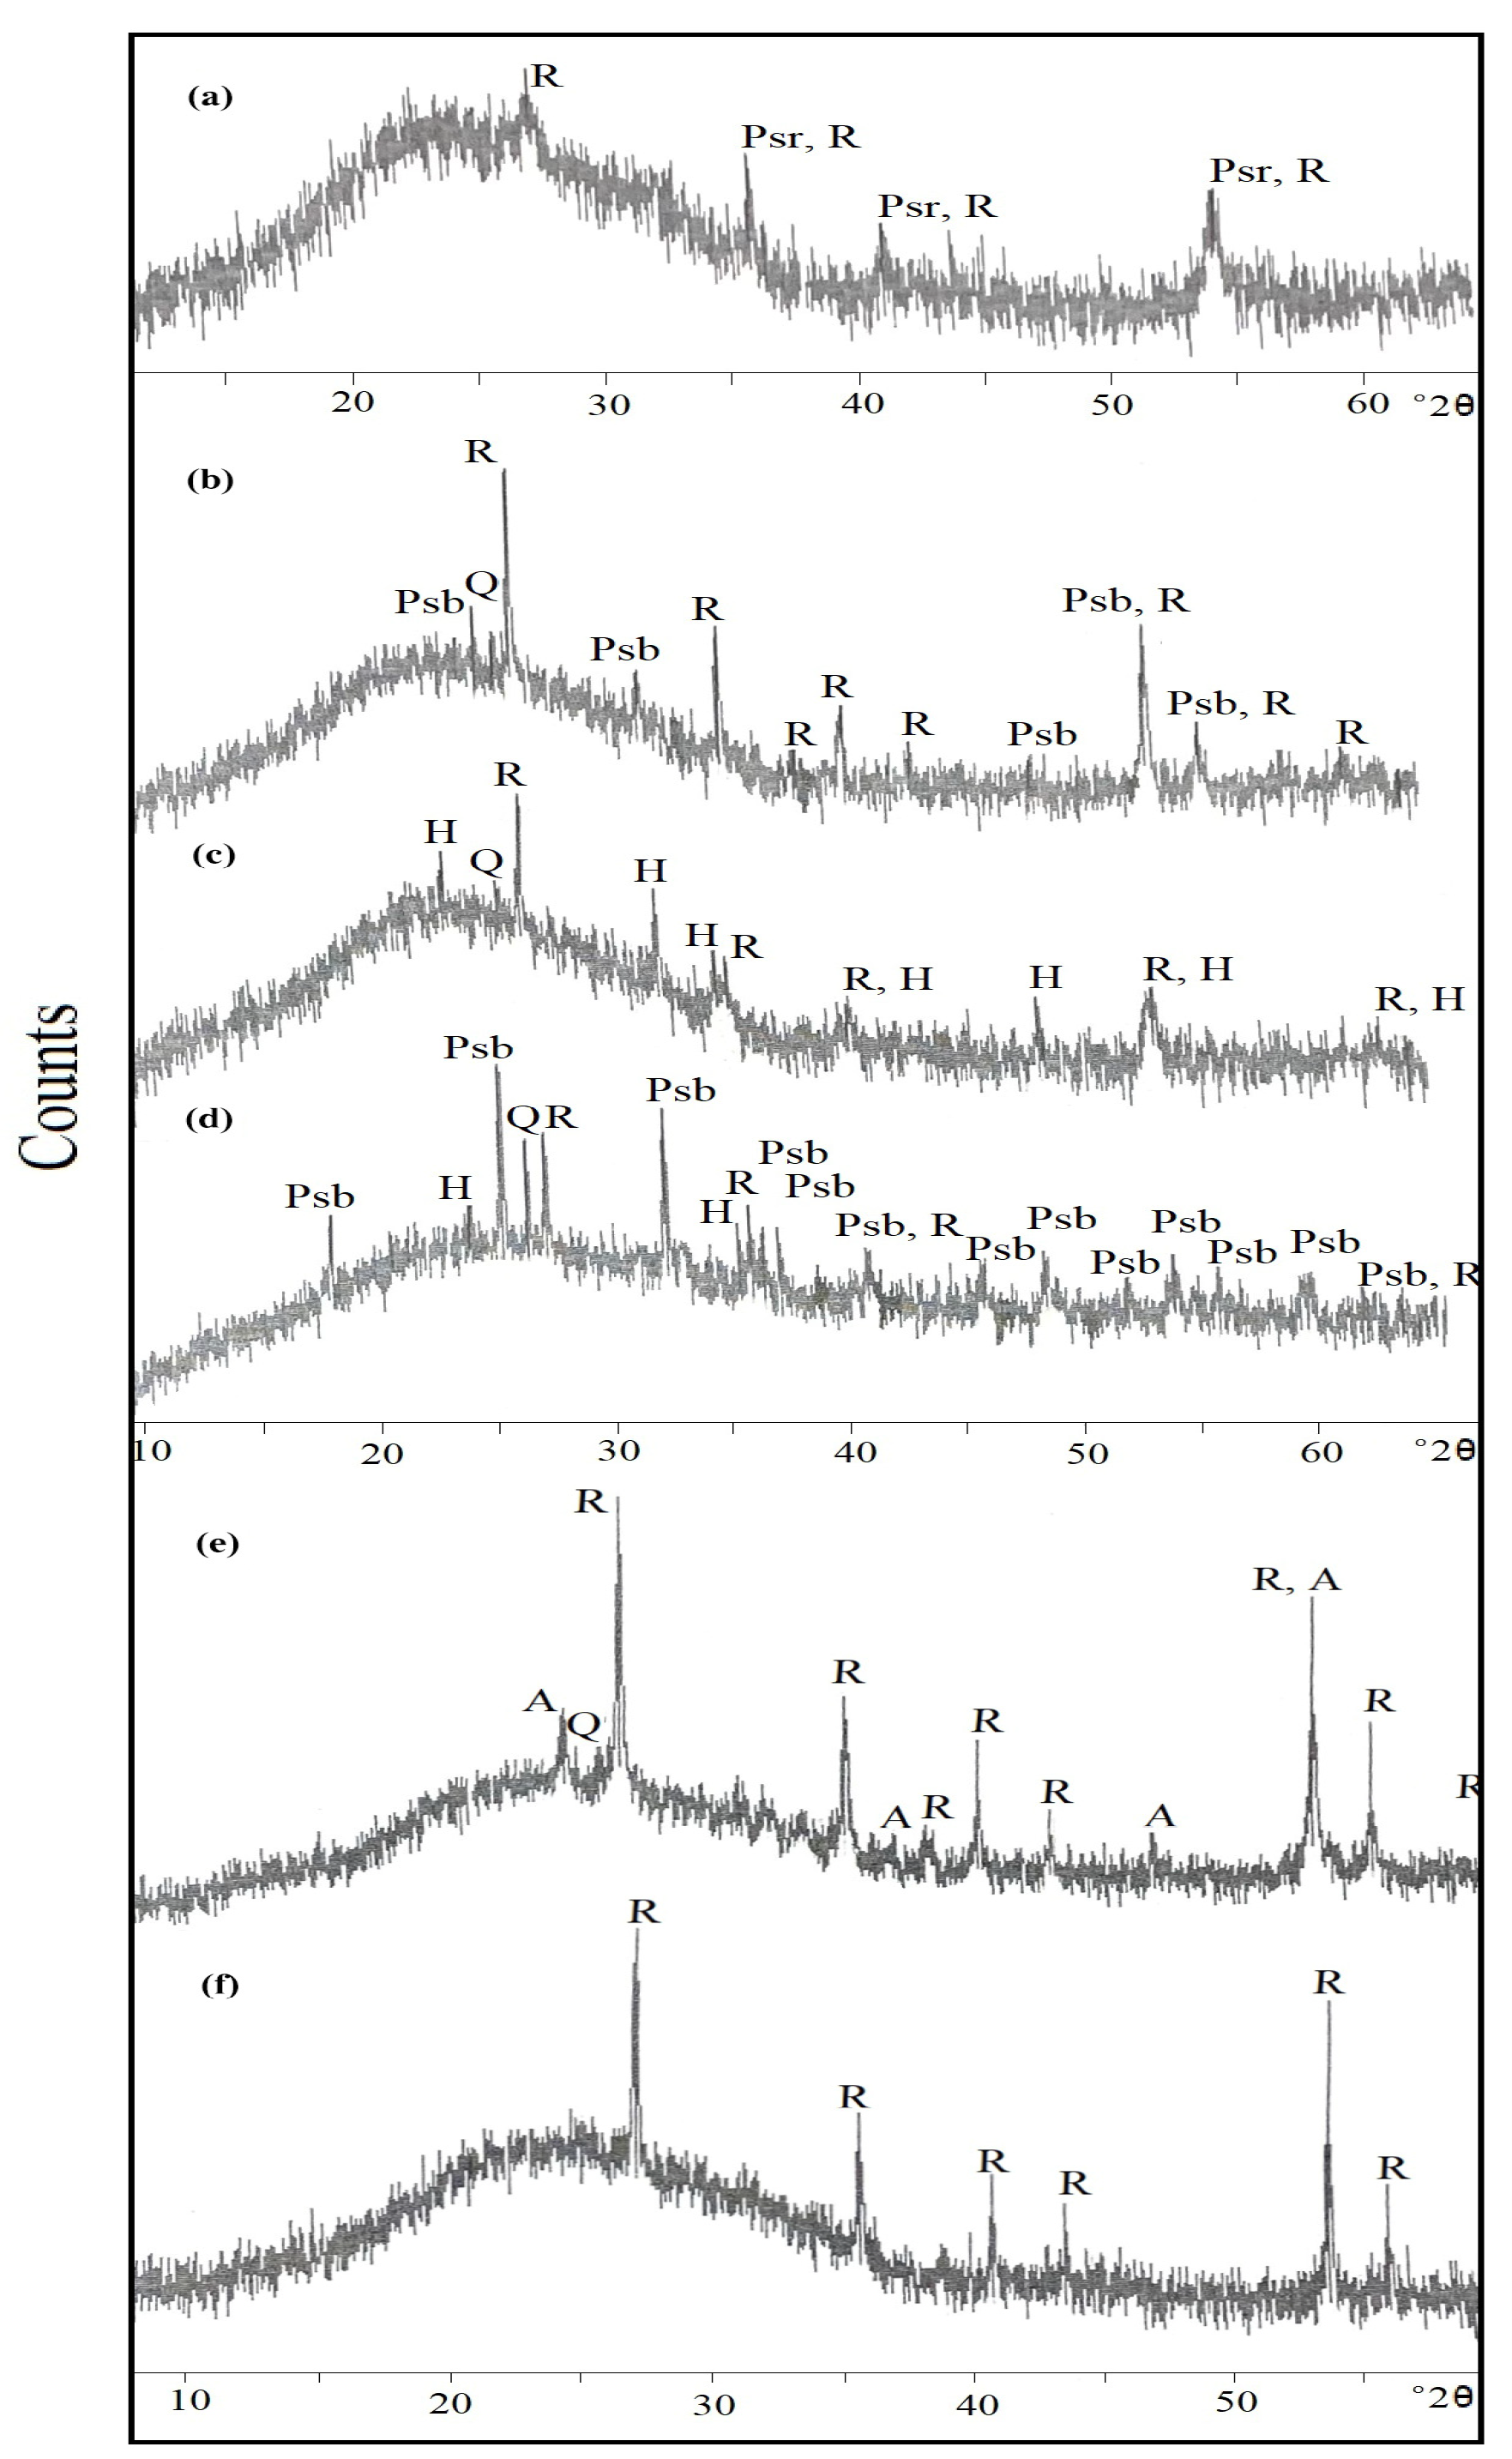
3.3. The XRD Results
| Grains | Spots | Wt% | Molecular Formula | Losed Fe | Ti/(Ti + Fe) | Mineral Phase | |||||||||||||||||
|---|---|---|---|---|---|---|---|---|---|---|---|---|---|---|---|---|---|---|---|---|---|---|---|
| SiO2 | MgO | MnO | CaO | ZnO | Fe2O3 | Al2O3 | Cr2O3 | Na2O | K2O | TiO2 | O Total | OH% | H2O% | N Total | Fe2 | Ti3 | Ox | OHy | |||||
| 5a | 1 | 0.40 | 0.17 | 0.30 | 0.18 | 0.00 | 27.57 | 0.65 | 0.25 | 0.04 | 0.01 | 69.35 | 98.92 | 9.79 | 5.19 | 104.11 | 1.32 | 3 | 6.92 | 2.08 | 0.68 | 0.69 | psr/lpsr |
| 3 | 0.71 | 0.25 | 0.21 | 0.42 | 0.00 | 13.63 | 1.14 | 0.47 | 0.05 | 0.05 | 78.89 | 95.81 | 20.48 | 10.84 | 106.65 | 0.70 | 3 | 5.07 | 3.93 | 1.30 | 0.81 | psr/lpsr | |
| 5b | 1 | 0.13 | 0.06 | 0.47 | 0.05 | 0.00 | 39.18 | 0.06 | 0.03 | 0.07 | 0.02 | 59.87 | 99.96 | Leached ilmenite | |||||||||
| 2 | 0.06 | 0.05 | 0.44 | 0.08 | 0.00 | 37.30 | 0.01 | 0.01 | 0.03 | 0.02 | 61.74 | 99.74 | 2.03 | 1.08 | 100.81 | 1.86 | 3 | 8.53 | 0.47 | 0.14 | 0.62 | psr/lpsr | |
| 8 | 0.23 | 0.06 | 0.60 | 0.11 | 0.00 | 29.71 | 0.24 | 0.07 | 0.03 | 0.03 | 66.31 | 97.39 | 8.13 | 4.30 | 101.69 | 1.43 | 3 | 7.24 | 1.76 | 0.57 | 0.68 | psr/lpsr | |
| 5c | 1 | 0.00 | 0.00 | 0.00 | 0.22 | 0.00 | 98.84 | 0.00 | 0.04 | 0.01 | 0.00 | 4.34 | 103.45 | Titanomagnetite | |||||||||
| 2 | 30.38 | 0.00 | 0.00 | 28.61 | 0.00 | 3.99 | 0.83 | 0.02 | 0.03 | 0.02 | 36.11 | 99.99 | Sphene | ||||||||||
| 5 | 28.26 | 0.02 | 0.16 | 26.60 | 0.00 | 1.62 | 0.31 | 0.03 | 0.02 | 0.04 | 43.84 | 100.90 | Sphene | ||||||||||
| 6 | 0.48 | 0.15 | 0.68 | 0.87 | 0.00 | 23.18 | 0.33 | 0.04 | 0.05 | 0.04 | 70.46 | 96.29 | 12.84 | 6.80 | 103.09 | 1.14 | 3 | 6.35 | 2.65 | 0.86 | TiO2 and Fe2O3 | ||
| 7 | 1.91 | 0.28 | 0.10 | 1.53 | 0.00 | 4.04 | 1.28 | 0.11 | 0.25 | 0.21 | 81.81 | 91.51 | 25.77 | 13.65 | 105.15 | 0.46 | 3 | 4.29 | 4.71 | 1.54 | TiO2 and Fe2O3 | ||
| 8 | 0.04 | 0.00 | 0.54 | 0.72 | 0.00 | 7.19 | 0.00 | 0.04 | 0.00 | 0.00 | 92.28 | 100.81 | Ferriferous rutile | ||||||||||
| 10 | 0.02 | 0.03 | 0.00 | 0.69 | 0.00 | 3.03 | 0.00 | 0.09 | 0.00 | 0.01 | 96.39 | 100.26 | Ferriferous rutile | ||||||||||
| 12 | 0.14 | 0.00 | 0.01 | 0.81 | 0.00 | 0.92 | 0.00 | 0.06 | 0.05 | 0.02 | 98.45 | 100.47 | Ferriferous rutile | ||||||||||
| 5d | 3 | 0.03 | 0.03 | 0.00 | 0.01 | 0.00 | 1.35 | 0.00 | 0.02 | 0.01 | 0.02 | 98.09 | 99.55 | 33.68 | 17.84 | 117.38 | 0.05 | 3 | 3.14 | 5.86 | 1.95 | TiO2 and Fe2O3 | |
| 5 | 0.00 | 0.00 | 0.03 | 0.04 | 0.00 | 0.68 | 0.00 | 0.00 | 0.02 | 0.01 | 98.44 | 99.22 | 34.18 | 18.10 | 117.32 | 0.03 | 3 | 3.07 | 5.93 | 1.97 | TiO2 and Fe2O3 | ||
| 7 | 0.11 | 0.00 | 0.00 | 0.05 | 0.00 | 0.40 | 0.00 | 0.00 | 0.04 | 0.02 | 99.68 | 100.30 | 34.26 | 18.14 | 118.44 | 0.02 | 3 | 3.06 | 5.94 | 1.98 | TiO2 and Fe2O3 | ||
| 5e | 1 | 30.09 | 0.00 | 0.02 | 28.55 | 0.00 | 0.88 | 1.18 | 0.07 | 0.03 | 0.03 | 38.02 | 98.86 | Sphene | |||||||||
| 2 | 29.85 | 0.01 | 0.00 | 28.05 | 0.00 | 0.23 | 0.49 | 0.09 | 0.02 | 0.02 | 39.24 | 97.99 | Sphene | ||||||||||
| 3 | 30.06 | 0.00 | 0.00 | 28.13 | 0.00 | 0.32 | 0.28 | 0.08 | 0.04 | 0.03 | 40.95 | 99.89 | Sphene | ||||||||||
| 4 | 0.41 | 0.20 | 1.07 | 0.53 | 0.00 | 38.71 | 0.05 | 0.13 | 0.01 | 0.05 | 57.37 | 98.54 | Leached ilmenite | ||||||||||
| 5 | 0.00 | 0.16 | 2.26 | 0.42 | 0.00 | 43.24 | 0.00 | 0.12 | 0.01 | 0.01 | 57.48 | 103.71 | Leached ilmenite | ||||||||||
| 6 | 0.02 | 0.00 | 0.02 | 0.90 | 0.00 | 0.07 | 0.00 | 0.47 | 0.01 | 0.00 | 98.15 | 99.63 | 33.67 | 17.83 | 117.46 | 0.06 | 3 | 3.14 | 5.86 | 1.94 | TiO2 and Fe2O3 | ||
| 7 | 0.00 | 0.00 | 0.00 | 0.62 | 0.00 | 0.18 | 0.00 | 0.44 | 0.00 | 0.00 | 98.36 | 99.61 | 33.84 | 17.92 | 117.53 | 0.05 | 3 | 3.11 | 5.89 | 1.95 | TiO2 and Fe2O3 | ||
| 5f | 1 | 43.69 | 4.87 | 0.05 | 0.42 | 0.00 | 15.28 | 11.64 | 0.05 | 0.15 | 3.26 | 9.04 | 88.45 | Silicate mineral | |||||||||
| 2 | 78.87 | 0.95 | 0.00 | 0.16 | 0.00 | 2.19 | 2.07 | 0.03 | 0.10 | 0.59 | 10.83 | 95.79 | Silica + TiO2 | ||||||||||
| 3 | 0.07 | 0.03 | 4.03 | 0.05 | 0.00 | 39.32 | 0.00 | 0.00 | 0.02 | 0.02 | 62.79 | 106.33 | Ilmenite + TiO2 | ||||||||||
| 5g | 1 | 0.95 | 0.37 | 0.72 | 0.33 | 0.00 | 31.19 | 0.82 | 0.30 | 0.10 | 0.02 | 60.75 | 95.54 | 3.01 | 1.60 | 97.14 | 1.80 | 3 | 8.32 | 0.68 | 0.20 | 0.63 | psr/lpsr |
| 3 | 0.45 | 0.15 | 0.00 | 0.20 | 0.00 | 7.54 | 0.29 | 0.27 | 0.02 | 0.04 | 88.13 | 97.08 | 27.64 | 14.64 | 111.72 | 0.33 | 3 | 3.97 | 5.03 | 1.67 | TiO2 and Fe2O3 | ||
| 4 | 0.40 | 0.05 | 0.00 | 0.07 | 0.00 | 1.64 | 0.13 | 0.04 | 0.00 | 0.01 | 97.41 | 99.76 | 32.88 | 17.41 | 117.17 | 0.08 | 3 | 3.25 | 5.75 | 1.92 | TiO2 and Fe2O3 | ||
| 7 | 0.00 | 0.01 | 0.00 | 0.03 | 0.00 | 0.50 | 0.00 | 0.04 | 0.02 | 0.02 | 99.64 | 100.27 | 34.29 | 18.16 | 118.43 | 0.02 | 3 | 3.06 | 5.94 | 1.98 | TiO2 and Fe2O3 | ||
| 5h | 3 | 1.58 | 0.26 | 0.00 | 0.20 | 0.00 | 1.47 | 0.82 | 0.00 | 0.05 | 0.05 | 95.32 | 99.76 | 30.74 | 16.28 | 116.04 | 0.19 | 3 | 3.58 | 5.42 | 1.81 | TiO2 and Fe2O3 | |
| 6 | 0.52 | 0.01 | 0.02 | 0.13 | 0.00 | 0.85 | 0.40 | 0.02 | 0.01 | 0.01 | 97.26 | 99.24 | 33.04 | 17.50 | 116.73 | 0.08 | 3 | 3.24 | 5.76 | 1.92 | TiO2 and Fe2O3 | ||

3.4. The Role of SiO2 and Al2O3 in Ilmenite Alteration Process
The Nature of SiO2 and Al2O3 Contents within psr and lpsr Analyzed Spots
- Both SiO2 and Al2O3, the two major impurity oxides of the analyzed five impurity oxides, can be present as individual oxides inside the fissures and cracks of the altered ilmenite grains. Then, by neglecting them and recalculation the percentages of the remaining oxides of each spot, the spots should give an accepted result upon applying the constructed Excel psr program. This case was not achieved with the majority of the analyzed spots in this study.
- One or more of these impurity oxides are associated with some or all of the analyzed Fe2O3 in addition to others which may be remnants due to alteration of a preexisting definite silicate mineral containing minor amounts of TiO2. At definite geological conditions, considerable amounts of SiO2, Al2O3, CaO, and Fe2O3 present in the silicate mineral composition are removed and an enrichment of the contained TiO2 content occurred. There are several spots of several grains which have such circumstances.
- In other cases, SiO2 and/or Al2O3 are a replacement for an individual phase of Fe2O3. In such cases, both Fe2O3 and TiO2 are two individual phases after ilmenite or follow the breakdown of psr or lpsr in the final alteration stages of ilmenite. Geothites and hematites can incorporate quite large amounts of Al in their structures [40].
- The fourth assumption is that, in several other cases, both SiO2 and Al2O3 are not present as impurities, they play an important role in the late stages of ilmenite alteration. They act as donors or acceptors of H2O/OH− in the alteration mechanisms of lpsr. In fact, the Al-OH bond is greater than the Fe-OH bond [41]. However, the enrichments of these oxides are noticed in the alteration mechanisms in which either the oxygen is replaced with OH− or during the enrichment of the individual TiO2 phase during the losing of most of the str and/or mol water from the altered lpsr formula structure. Several authors studied the conversion of Fe(OH)3 gel to β-FeOOH and α-Fe2O3 in the presence and absence of silicate ions [42,43]. At 60 °C, the effect of silicate ions resembles that of phosphate, and completely suppresses these two conversions, while it is in contrast to the influence of sulphate ions which accelerate the conversion of the Fe(OH)3 gel to β-FeOOH and delay the conversion from β-FeOOH to α-Fe2O3 [43]. Then, SiO2 and/or Al2O3 may play a definite roles in some conversions of Fe- or Ti-oxyhydroxides of some suggested alteration scenarios by the present author (under publication).
4. Conclusions
Supplementary Materials
Funding
Data Availability Statement
Acknowledgments
Conflicts of Interest
References
- Boctor, N.Z. Mineralogical Study of the Opaque Minerals in Rosetta-Damietta Black Sands. Master’s Thesis, Faculty of Science, Cairo University, Cairo, Egypt, 1966. [Google Scholar]
- Mikhail, M.A. Distribution and Sedimentation of Ilmenite in Black Sands, West of Rosetta. Master’s Thesis, Faculty of Science, Cairo University, Cairo, Egypt, 1971. [Google Scholar]
- Hammoud, N.M. Concentration of Monazite from Egyptian Black Sands, Employing Industrial Techniques. Master’s Thesis, Faculty of Science, Cairo University, Cairo, Egypt, 1966. [Google Scholar]
- Hammoud, N.M. Physical and Chemical Properties of some Egyptian Beach Economic Minerals in Relation to Their Concentration Problems. Ph.D. Thesis, Faculty of Science, Cairo University, Cairo, Egypt, 1973. [Google Scholar]
- Moustafa, M.I. Mineralogy and Beneficiation of some Economic Minerals in the Egyptian Black Sands. Ph.D. Thesis, Faculty of Science, Cairo University, Cairo, Egypt, 1999. [Google Scholar]
- Palmer, C. Arizonite, Ferric metatitanate. Am. J. Sci. 1909, 28, 353–356. [Google Scholar] [CrossRef]
- Overholt, J.L.; Vaux, G.; Rodda, J.L. The nature of “Arizonite”. Am. Mineral. 1950, 35, 117–119. [Google Scholar]
- Tayler, S.A.; Marsden, R.W. The naure of leucoxene. J. Sed. Petr. 1938, 8, 55–58. [Google Scholar]
- Allen, V.T. Is leucoxene always finely crystalline rutile? Econ. Geol. 1956, 51, 830–833. [Google Scholar] [CrossRef]
- Bailey, S.W.; Cameron, E.N.; Spedden, H.R.; Weege, R.J. The alteration of ilmenite in beach sands. Econ. Geol. 1956, 51, 263–279. [Google Scholar] [CrossRef]
- Bailey, S.W.; Cameron, E.N. Is leucoxene always finely crystalline rutile? Econ. Geol. 1957, 52, 716–720. [Google Scholar] [CrossRef]
- Flinter, B.H. The alteration of Malayan ilmenite grains and the question of “arizonite”. Econ. Geol. 1959, 54, 720–729. [Google Scholar] [CrossRef]
- Hartman, J.A. The titanium mineralogy of certain bauxites and their parent materials. Econ. Geol. 1959, 54, 1380–1405. [Google Scholar] [CrossRef]
- Austin, S.R. Ilmenite, magnetite, and feldspar alteration under reducing conditions. Econ. Geol. 1960, 55, 1758–1759. [Google Scholar] [CrossRef]
- Lynd, L.E. Alteration of ilmenite. Econ. Geol. 1960, 55, 1064–1068. [Google Scholar] [CrossRef]
- Bykov, A.D. Proarizonite as a secondary mineral due to supergene alteration of ilmenite. Dokl. Akad. Nauk SSSR 1964, 156, 567–570. [Google Scholar]
- Subrahmanyam, N.P.; Rao, N.K.; Narasimhan, D.; Rao, G.V.U.; Jaggi, N.K.; Rao, K.R.P.M. Alteration of beach sand ilmenite from Manavalakurichi: Tamil Nadu, India. J. Geol. Soc. India 1982, 23, 168–174. [Google Scholar]
- Anand, R.R.; Gilkes, R.J. Some alumina and silica in weathered ilmenite grains are present in clay minerals-a response to Frost et al. (1983). Mineral. Mag. 1985, 49, 141–145. [Google Scholar] [CrossRef]
- Chernet, T.; Pakkanen, L. Estimation of ferric iron, crystal water and calculation of chemical formulae for altered ilmenite from electron microprobe analyses, based on stoichiometric criteria. Geol. Surv. Finl. 2003, 36, 23–28. [Google Scholar]
- Temple, A.K. Alteration of ilmenite. Econ. Geol. 1966, 61, 695–714. [Google Scholar] [CrossRef]
- Lynd, L.E.; Sigurdson, H.; North, C.H.; Anderson, W.W. Characteristics of titaniferous concentrates. Mining Eng. 1954, 6, 817–824. [Google Scholar]
- Karkhanavala, M.D.; Momin, A.C.; Rege, S.G. An X-ray study of leucoxene from Quilon, India. Econ. Geol. 1959, 54, 913–918. [Google Scholar] [CrossRef]
- Flinter, B.H. Malayan ilmenite vs. Arizonite. Econ. Geol. 1960, 55, 1068–1070. [Google Scholar] [CrossRef]
- Frost, M.T.; Grey, I.E.; Harrowfield, I.R.; Mason, K. The dependence of alumina and silica contents on the extent of the alteration of weathered ilmenites from Western Australia. Mineral. Mag. 1983, 47, 201–208. [Google Scholar] [CrossRef] [Green Version]
- Mucke, A.; Chaudhuri, J.N.B. The continuous alteration of ilmenite through pseudorutile to leucoxene. Ore Geol. Rev. 1991, 6, 25–44. [Google Scholar] [CrossRef]
- Pownceby, M.I. Alteration and associated impurity element enrichment in detrital ilmenites from the Murray Basin, southeast Australia: A product of multistage alteration. Aust. J. Earth Sci. 2010, 57, 243–258. [Google Scholar] [CrossRef]
- Grey, I.E.; Li, C. Hydroxylian pseudorutile derived from picroilmenite in the Murray Basin, southeastern Australia. Mineral. Mag. 2003, 67, 733–747. [Google Scholar] [CrossRef]
- Mandour, M.A.; Chernet, T.; Moustafa, M.I. Applied mineralogical studies on Egyptian sand ilmenite concentrates. In The Seventh Biennial SGS Meeting on Mineral Exploration and Sustainable Development; Millpress: Rotterdam, The Netherlands; Athens, Greece, 2003. [Google Scholar]
- Moustafa, M.I. Some Mineralogical Characteristics of the Egyptian Black Sand Beach Ilmenite Part I: Homogeneous Ilmenite and Titanhematite-Ferriilmenite Grains. Eng. Tech. Appl. Sci. Res. 2022, 12, 9614–9631. [Google Scholar] [CrossRef]
- Moustafa, M.I. Some Mineralogical Characteristics of the Egyptian Black Sand Beach Ilmenite Part II: Rutile-Ilmenite and the Various Titanhematite Grains. Eng. Tech. Appl. Sci. Res. 2022, 12, 9640–9653. [Google Scholar] [CrossRef]
- Abdel-karim, A.M.; Moustafa, M.I.; El-Afandy, A.H.; Barakat, M.G. Mineralogy, chemical characteristics and upgrading of beach Ilmenite of the top meter of black sand deposits of the Kafr Al-Sheikh Governorate, Northern Egypt. Acta Geol. Sin. 2017, 91, 801–813. [Google Scholar] [CrossRef]
- Moustafa, M.I. Alteration Processes of the Strongly Magnetic Egyptian Black Sand Altered Ilmenite. ETASR, 2023; submitted. [Google Scholar]
- Moustafa, M.I. Mineralogical characteristics of the separated magnetic rutile of the Egyptian black sands. Resour. Geol. 2010, 60, 300–312. [Google Scholar] [CrossRef]
- Tetsopgang, S.; Koyanagi, J.; Enami, M.; Kihara, K. Hydroxylian pseudorutile in an adamellite from the Nkambe area, Cameroon. Mineral. Mag. 2003, 67, 509–516. [Google Scholar] [CrossRef]
- Chernet, T. Applied mineralogical studies on Australian sand ilmenite concentrate with special reference to its behavior in the sulphate process. Miner. Eng. 1999, 12, 485–495. [Google Scholar] [CrossRef]
- Gevorkyan, V.; Tananayev, N.V. Some data on the initial stages of leucoxenization of ilmenite from the sedimentary deposits of the northern Azov area. Dopovidi Akad. Nauk. Ukr. Koi RSR 1964, 10, 1366–1369. [Google Scholar]
- Pe-Piper, G.; Piper, D.J.W.; Dolansky, L. Alteration of ilmenite in the Cretaceous sandstones of Nova Scotia, Canada Georgia. Clays Clay Miner. 2005, 53, 490–510. [Google Scholar] [CrossRef]
- Frost, M.T.; Grey, I.E.; Harrowfield, I.R.; Li, C. Alteration profiles and impurity element distributions in magnetic fractions of weathered ilmenite. Am. Mineral. 1986, 71, 167–175. [Google Scholar]
- Morey, G.W.; Fournter, R.O.; Rowe, J.J. The solubility of quartz in water in the temperature interval from 25 °C to 300°C. Geochim. Cosmochim. Acta 1962, 26, 1029–1043. [Google Scholar] [CrossRef]
- Tardy, Y.; Nahon, D. Geochemistry of laterites, stability of Al-goethite, Al-hematite, and Fe3+-kaolinite in bauxites and ferricretes: An approach to the mechanism of concretion formation. Am. J. Sci. 1985, 285, 865–903. [Google Scholar] [CrossRef]
- Friedlander, L.R.; Glotch, T.D.; Bish, D.L.; Dyar, M.D.; Sharp, T.G.; Sklute, E.C.; Michalski, J.R. Structural and spectroscopic changes to natural nontronite induced by experimental impacts between 10 and 40GPa. J. Geophys. Res. Planets 2015, 10, 888–912. [Google Scholar] [CrossRef]
- Kown, S.K.; Kimijima, K.; Kanie, K.; Muramatsu, A. Inhibition of conversion process from Fe(OH)3 to β-FeOOH and α-Fe2O3by the addition of silicate ions. ISIJ Int. 2005, 45, 77–81. [Google Scholar] [CrossRef] [Green Version]
- Kown, S.K.; Kimijima, K.; Kanie, K.; Muramatsu, A.; Suzuki, S.; Matsubara, E.; Waseda, Y. Effect of silicate ions on conversion of ferric hydroxide to β-FeOOH and α-Fe2O3. Mater. Trans. 2005, 46, 155–158. [Google Scholar] [CrossRef] [Green Version]
Disclaimer/Publisher’s Note: The statements, opinions and data contained in all publications are solely those of the individual author(s) and contributor(s) and not of MDPI and/or the editor(s). MDPI and/or the editor(s) disclaim responsibility for any injury to people or property resulting from any ideas, methods, instructions or products referred to in the content. |
© 2023 by the author. Licensee MDPI, Basel, Switzerland. This article is an open access article distributed under the terms and conditions of the Creative Commons Attribution (CC BY) license (https://creativecommons.org/licenses/by/4.0/).
Share and Cite
Moustafa, M.I. Study of the Mineralogical and Chemical Compositions of the Weakly Magnetic Fractions of the Egyptian Black Sand Altered Ilmenite. Geosciences 2023, 13, 170. https://doi.org/10.3390/geosciences13060170
Moustafa MI. Study of the Mineralogical and Chemical Compositions of the Weakly Magnetic Fractions of the Egyptian Black Sand Altered Ilmenite. Geosciences. 2023; 13(6):170. https://doi.org/10.3390/geosciences13060170
Chicago/Turabian StyleMoustafa, Mohamed Ismail. 2023. "Study of the Mineralogical and Chemical Compositions of the Weakly Magnetic Fractions of the Egyptian Black Sand Altered Ilmenite" Geosciences 13, no. 6: 170. https://doi.org/10.3390/geosciences13060170