

Copper, Uranium and REE Mineralisation in an Exhumed Oil Reservoir, Southwest Orkney, Scotland

 , and
, and
Abstract
:1. Introduction
- (i)
- The spatial relationships between mineralisation and hydrocarbons,
- (ii)
- The paragenetic relationships between mineralisation and hydrocarbons,
- (iii)
- The timing of mineralisation and hydrocarbon emplacement within the burial/uplift history.
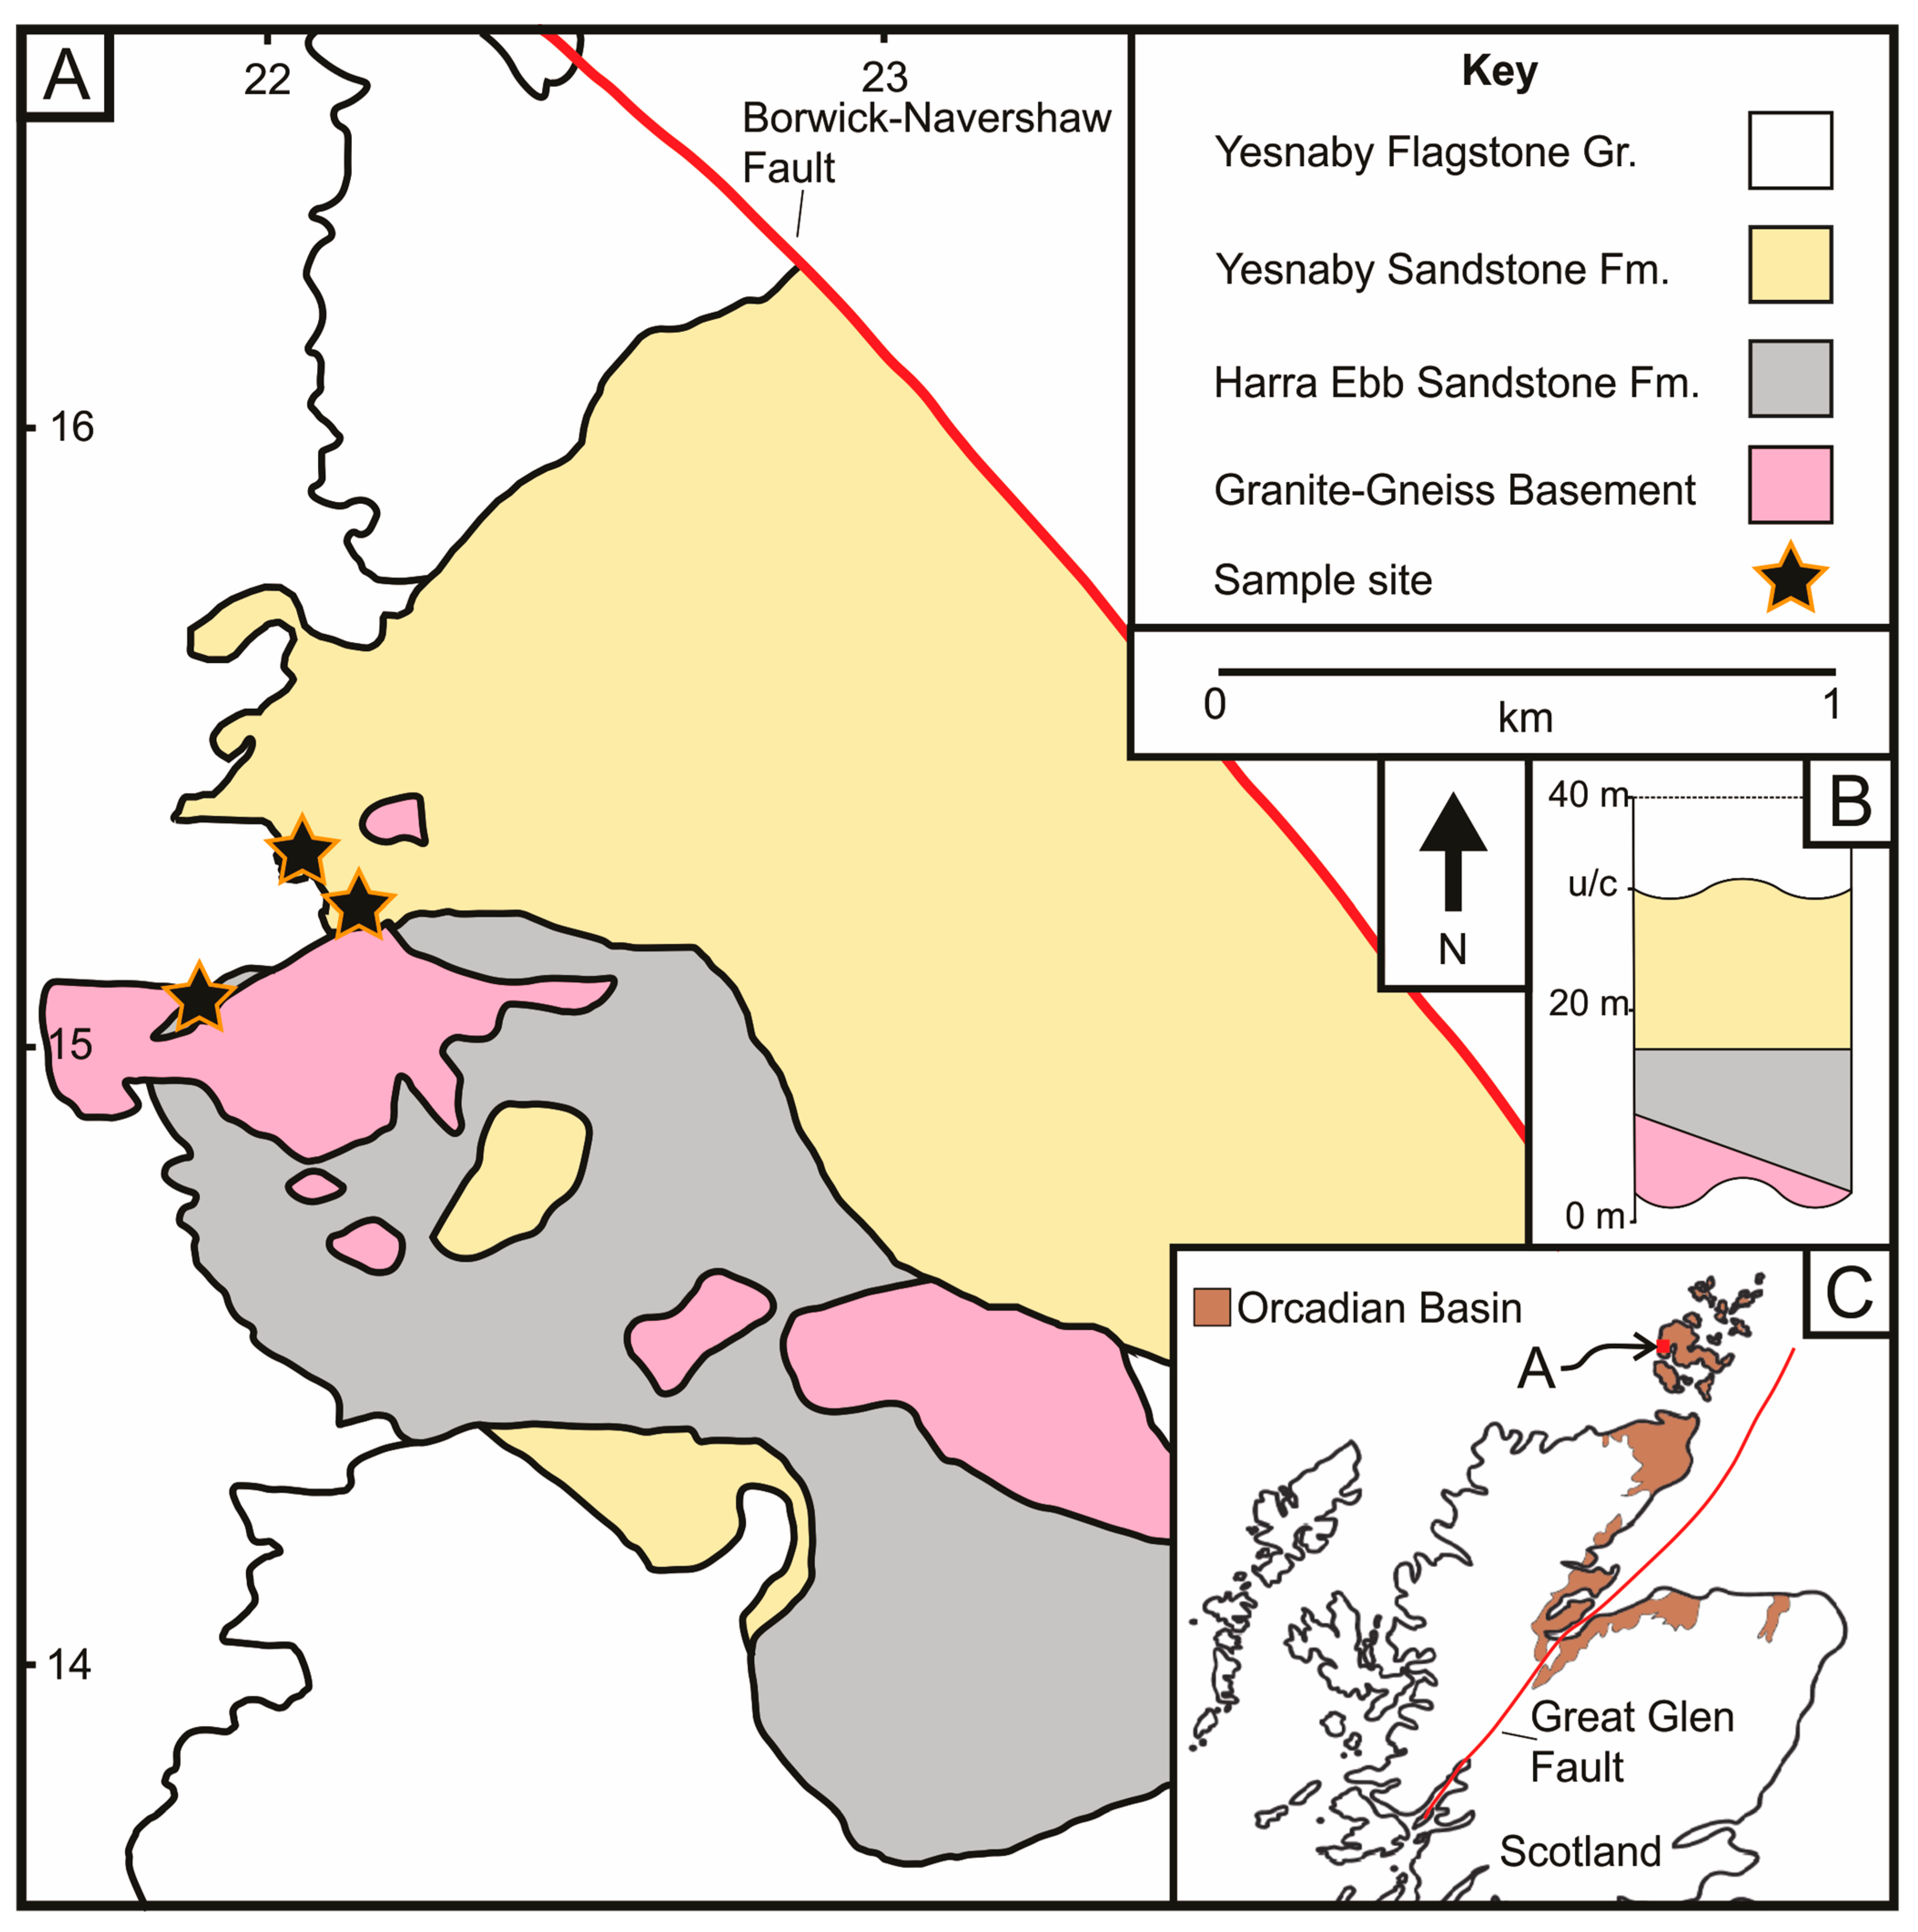
2. Geological Setting
3. Materials and Methods
4. Results
4.1. Sandstone Petrology
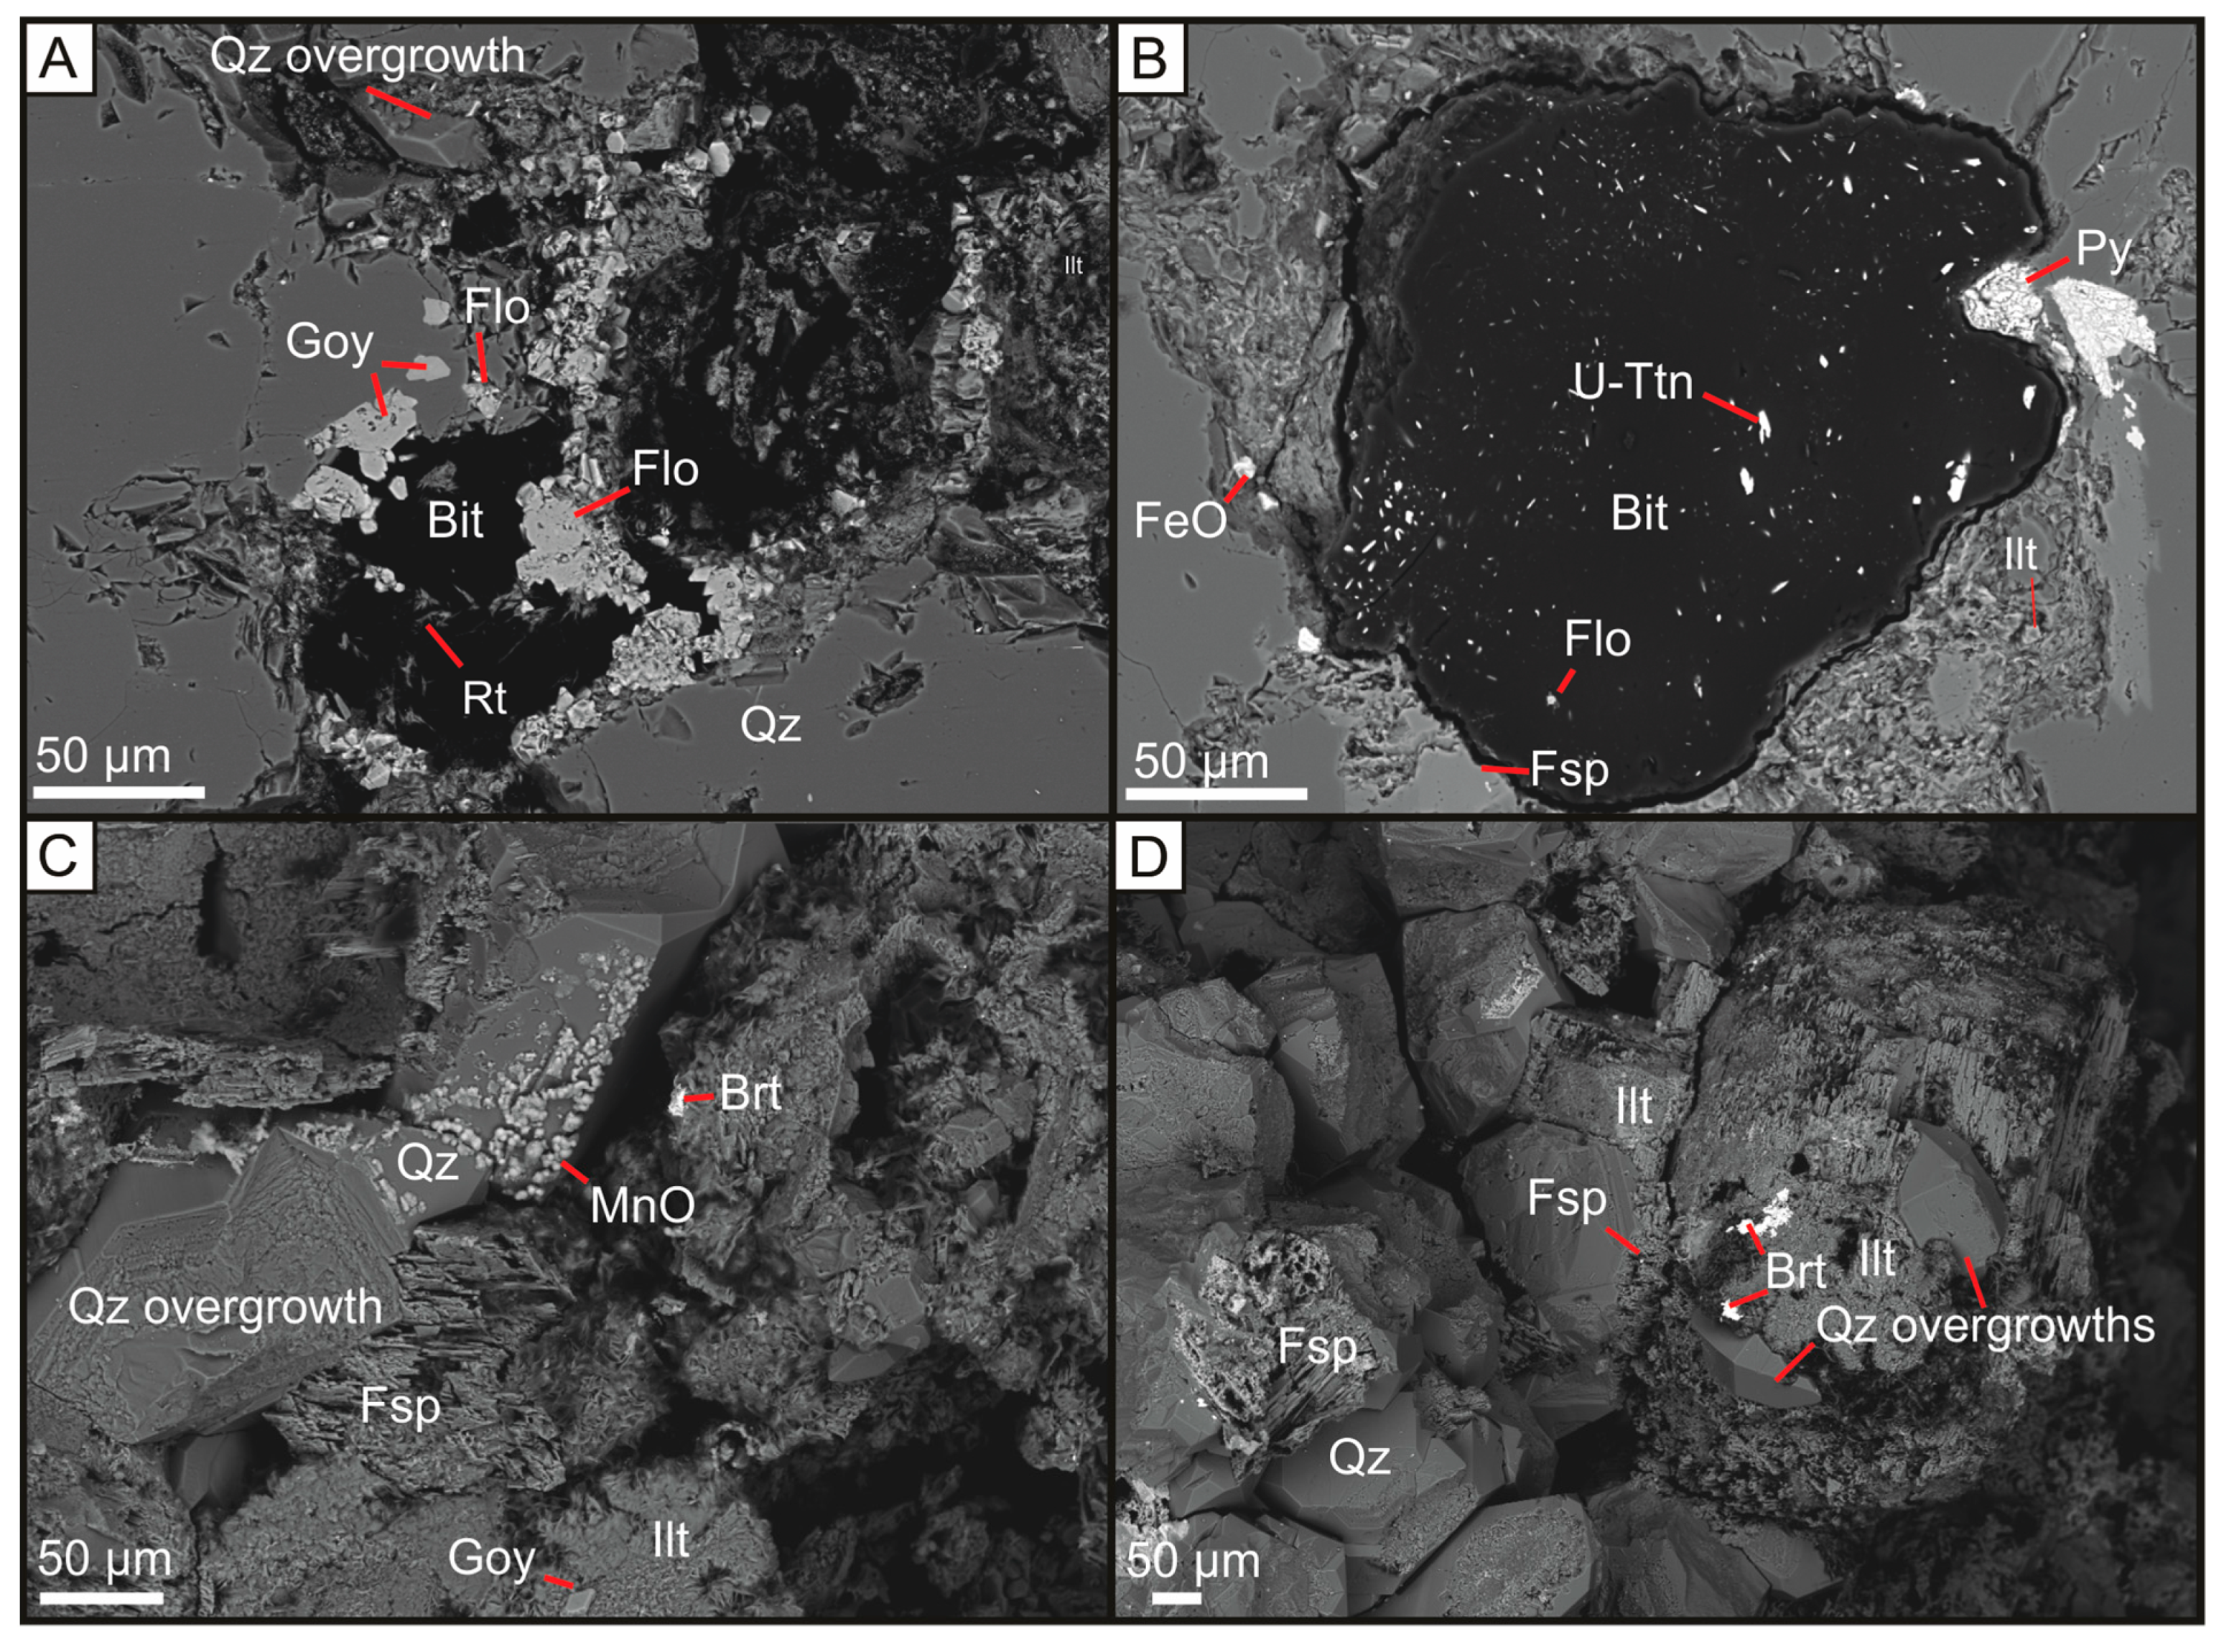
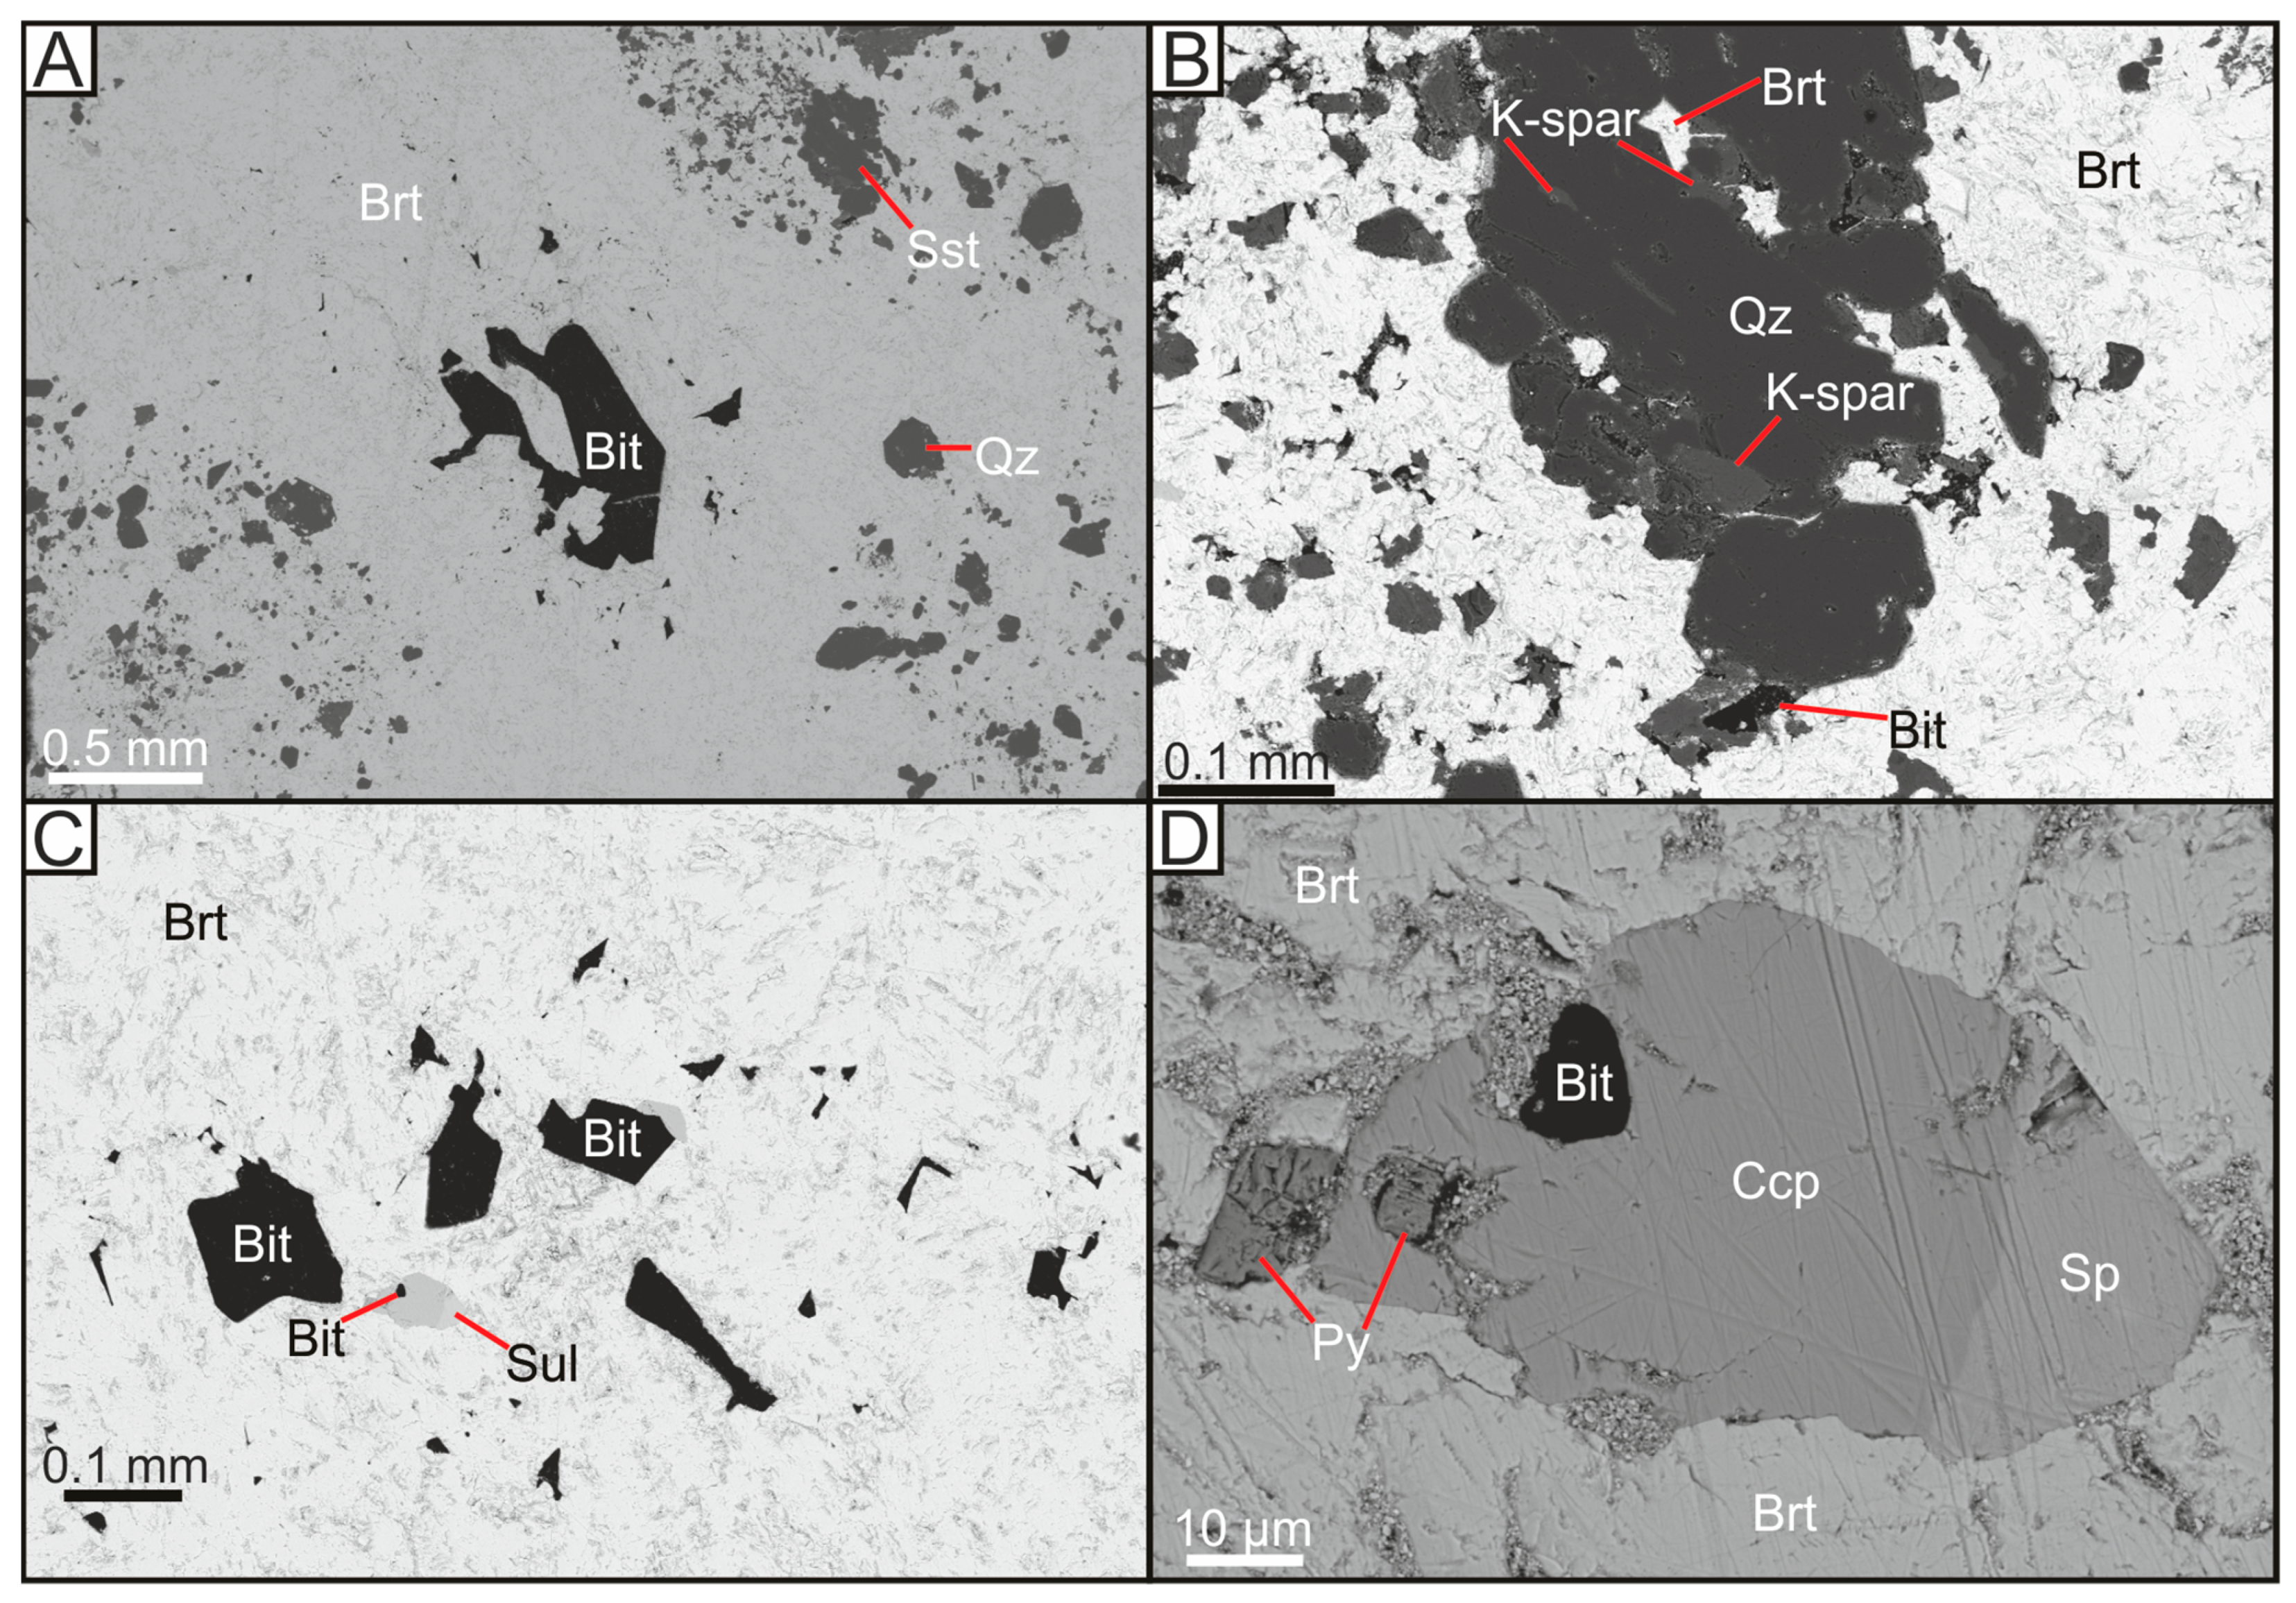
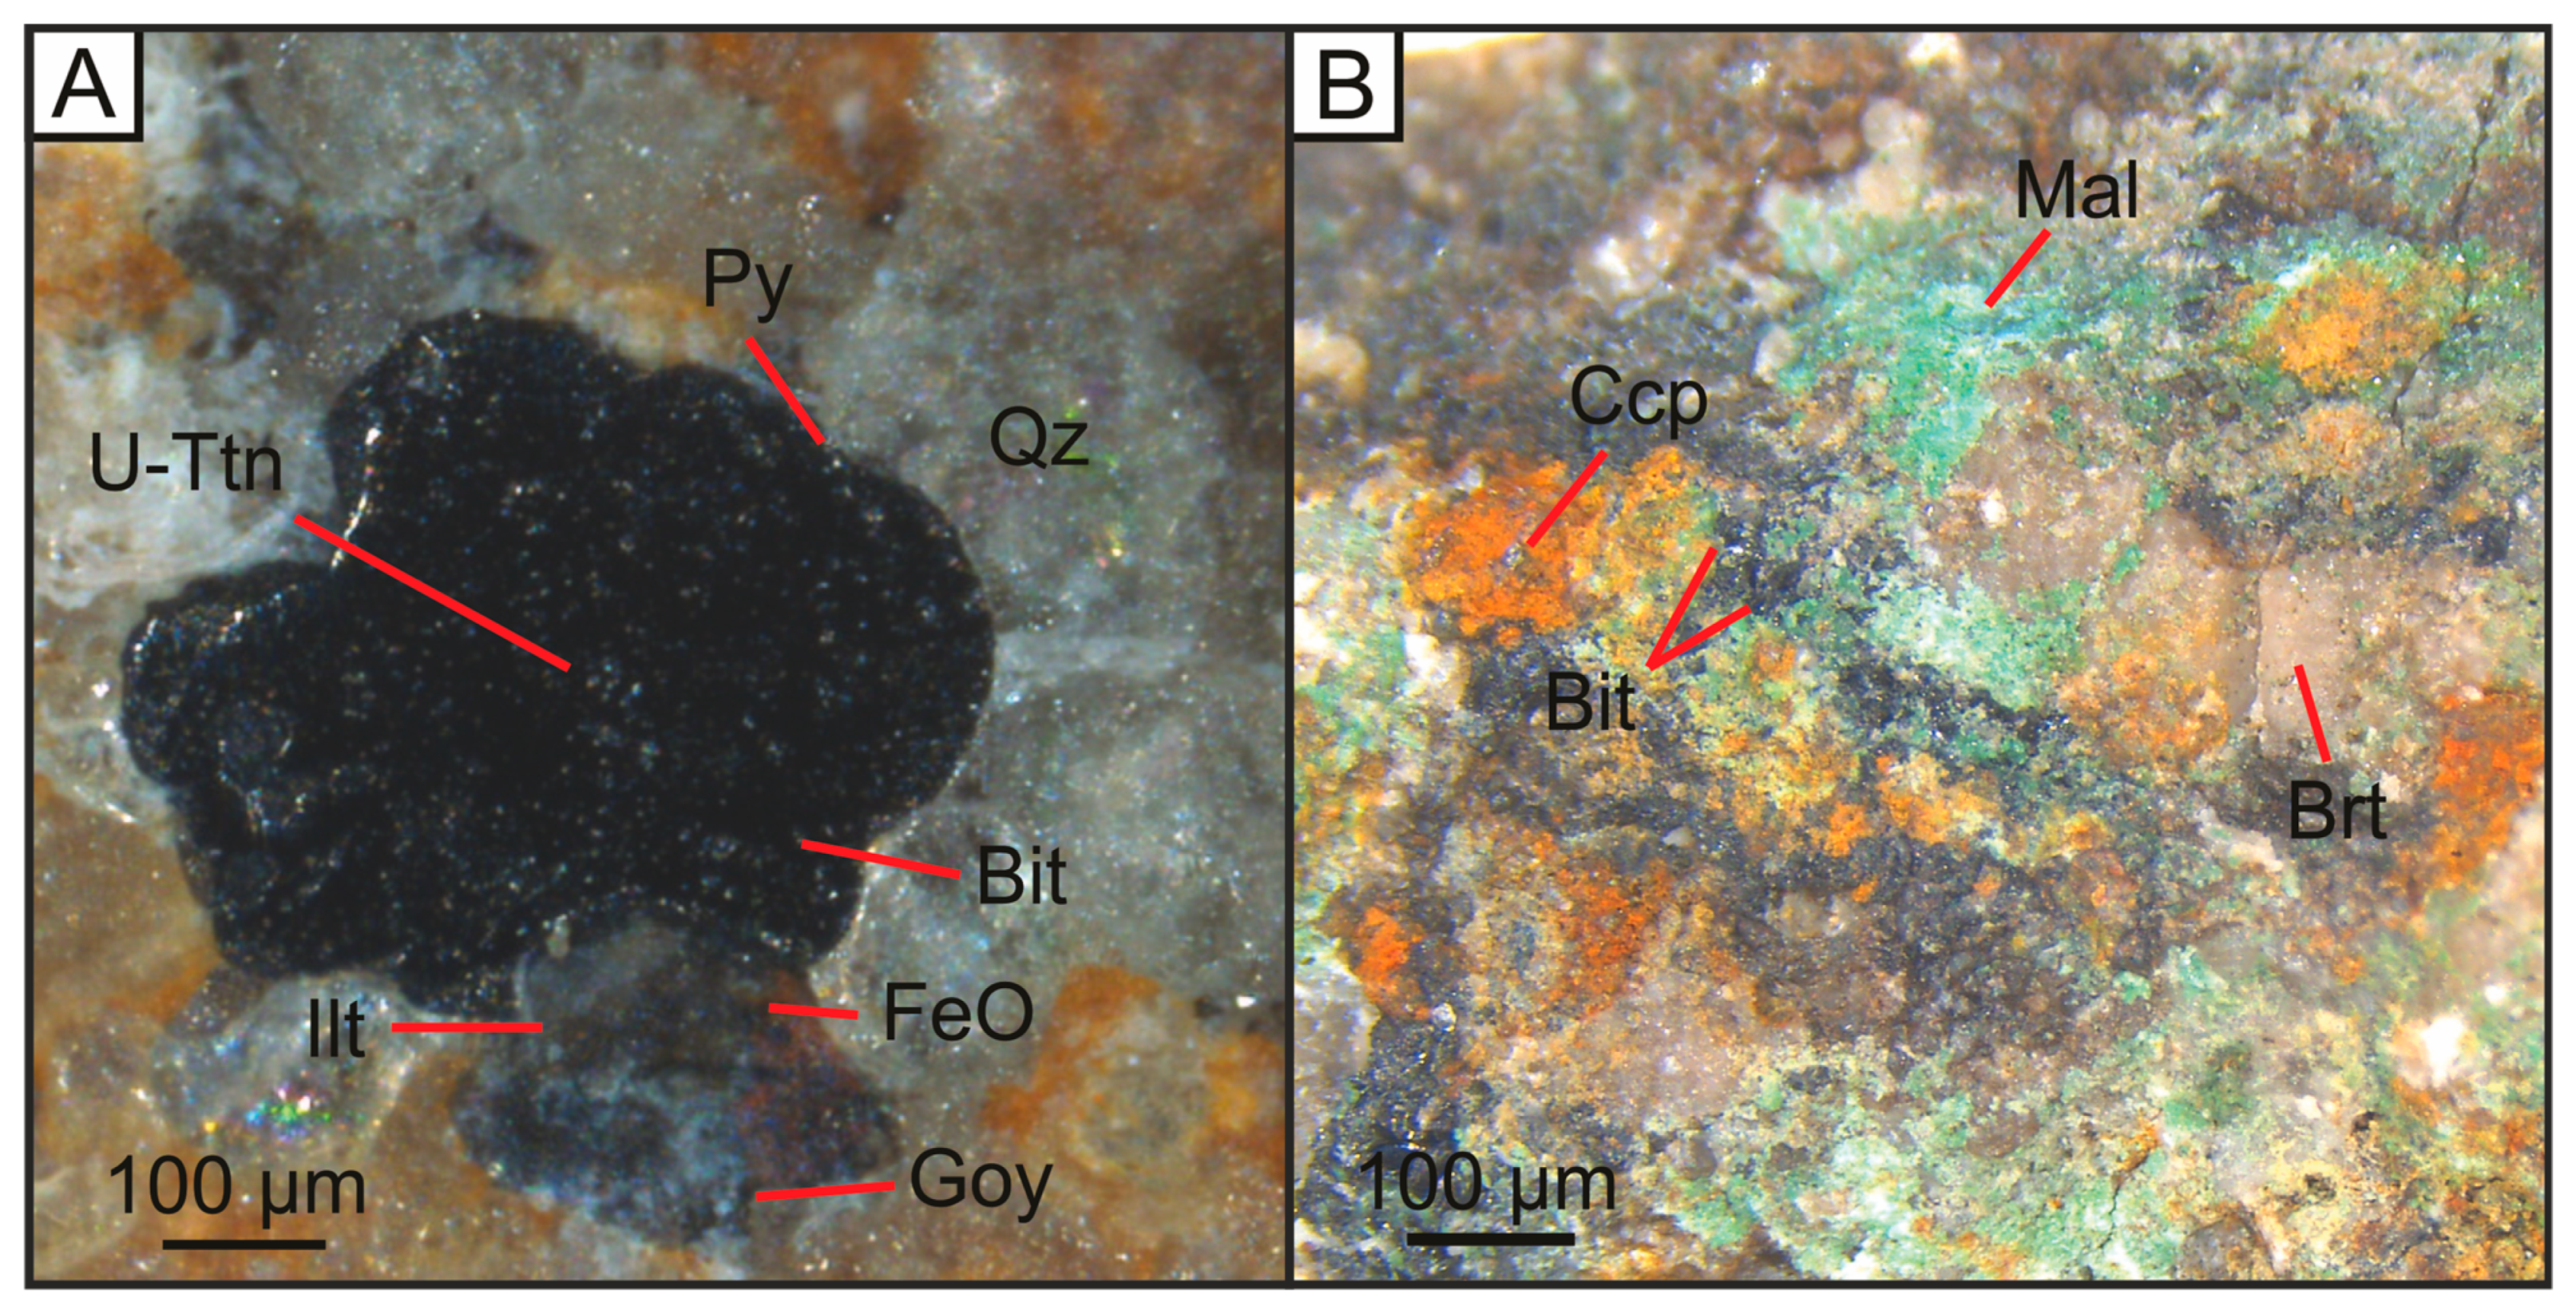
4.2. Mineralisation
4.3. Fluid Inclusions
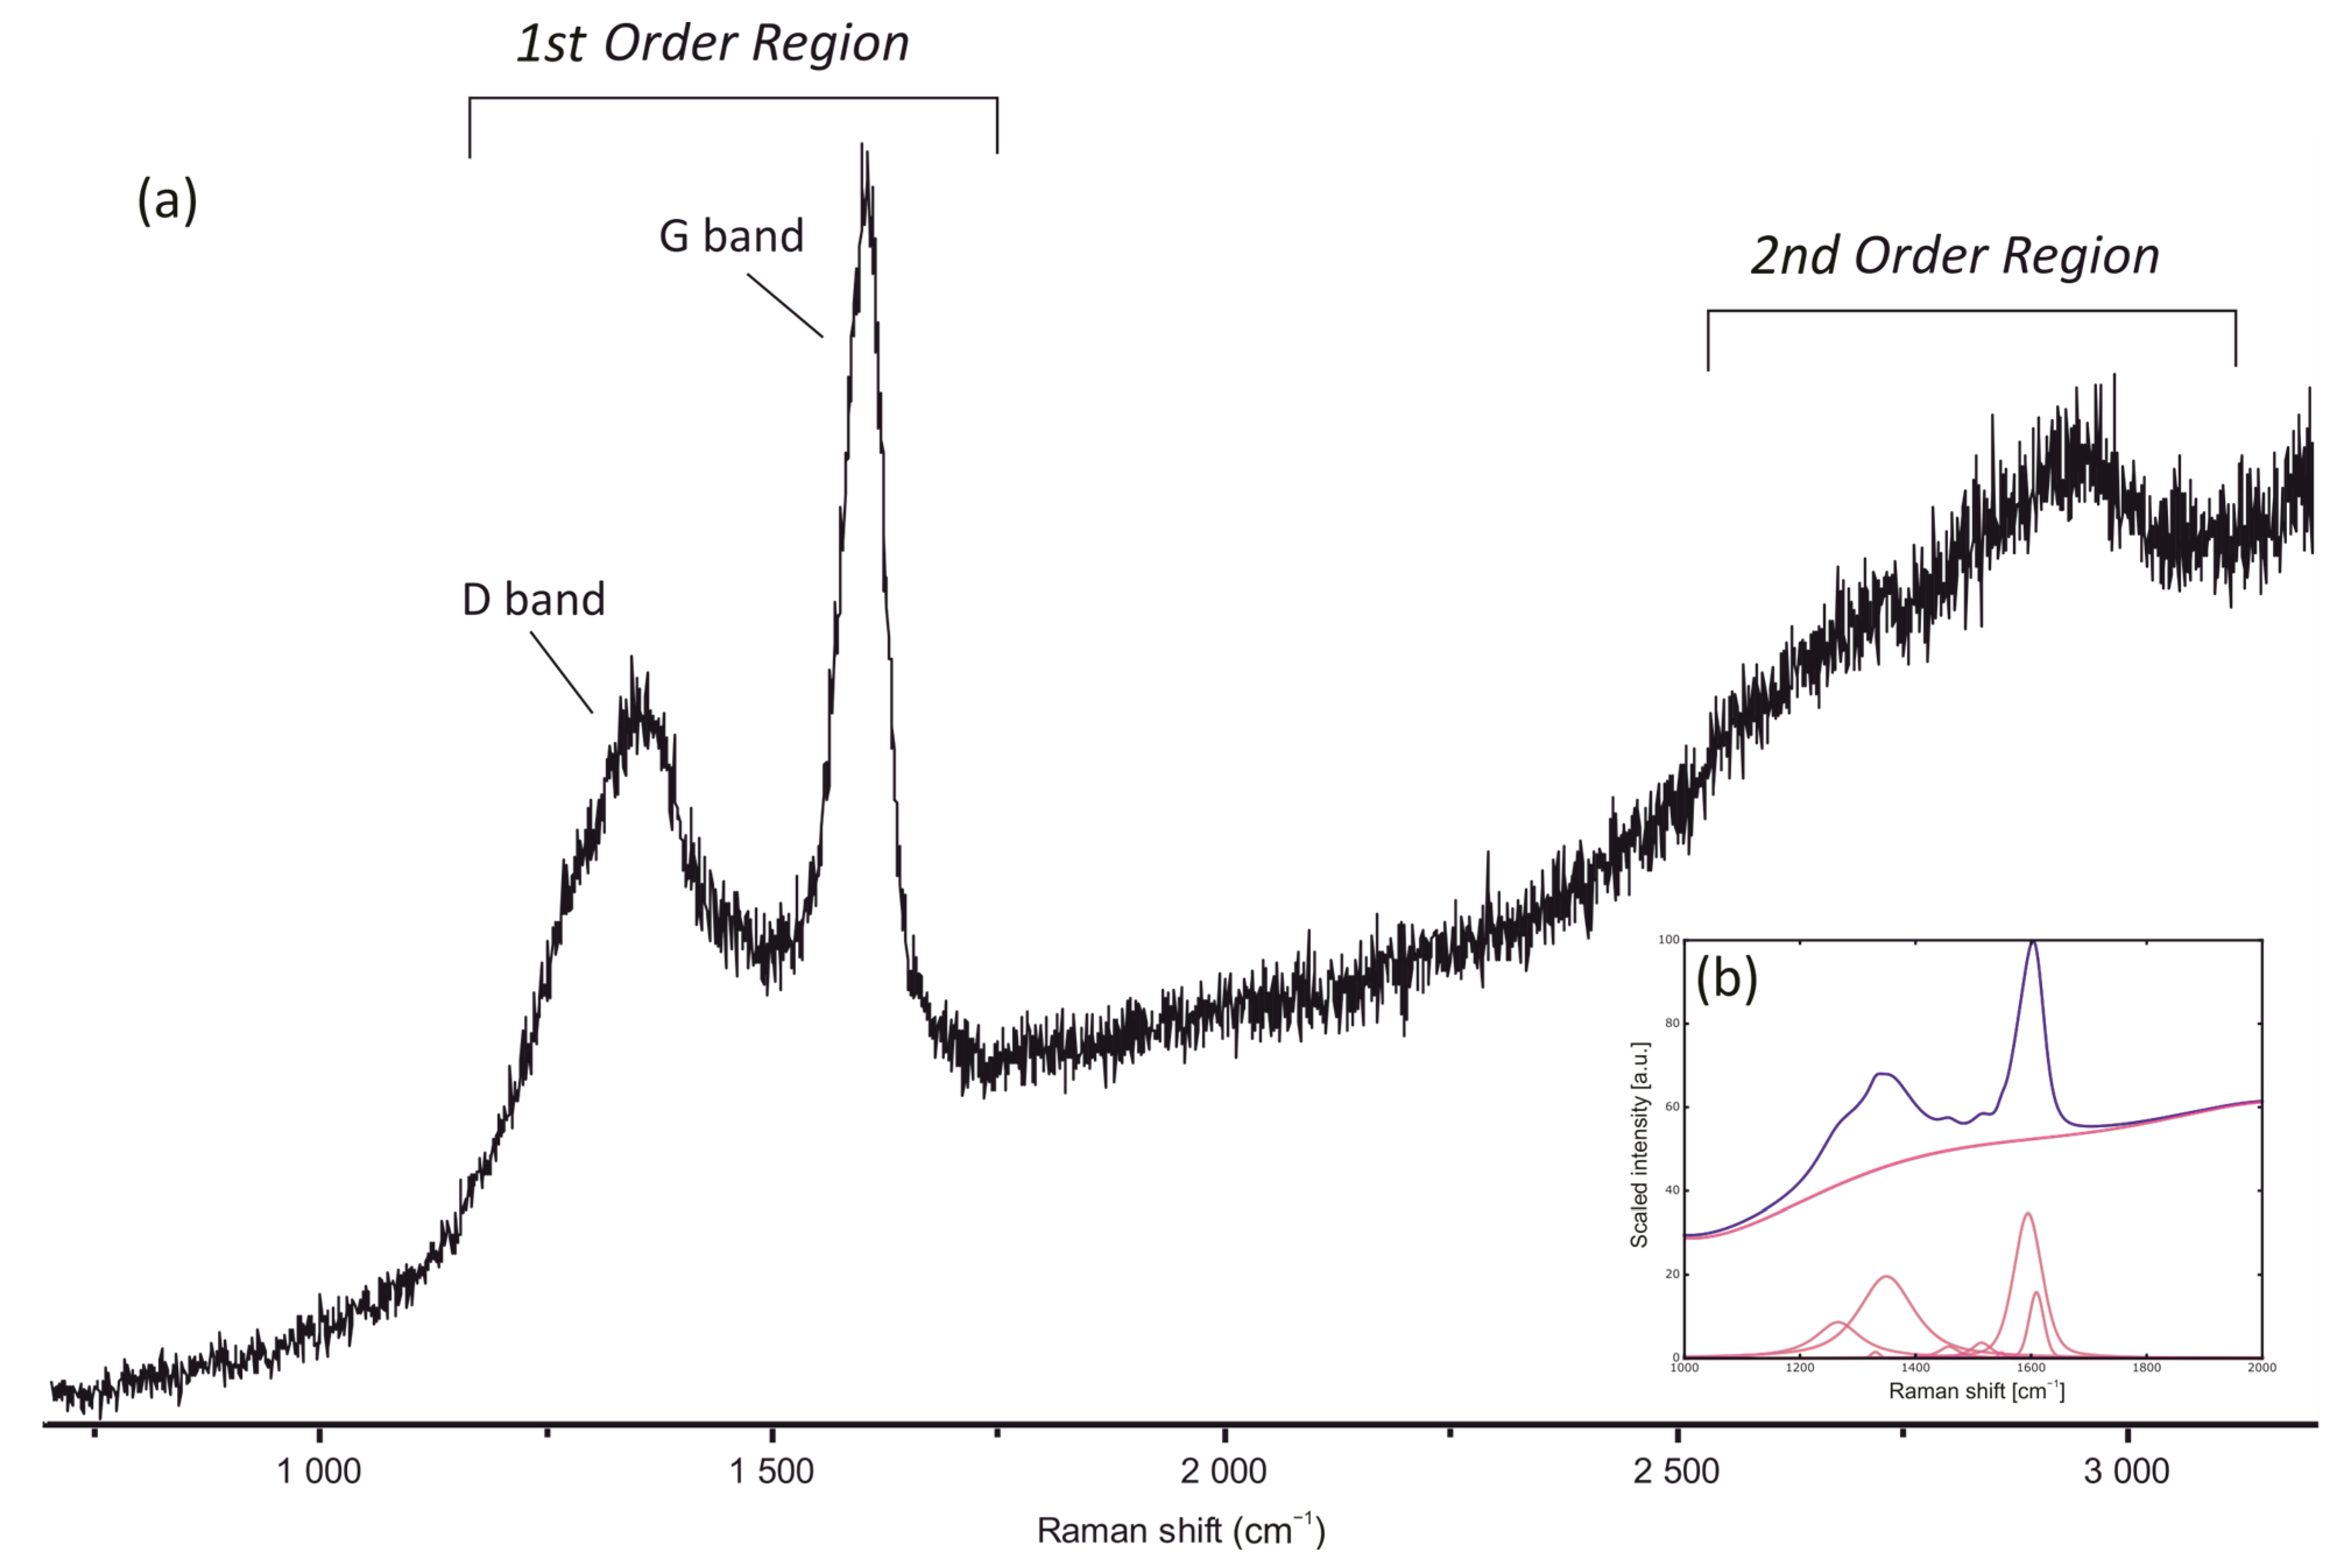
4.4. Raman Spectroscopy
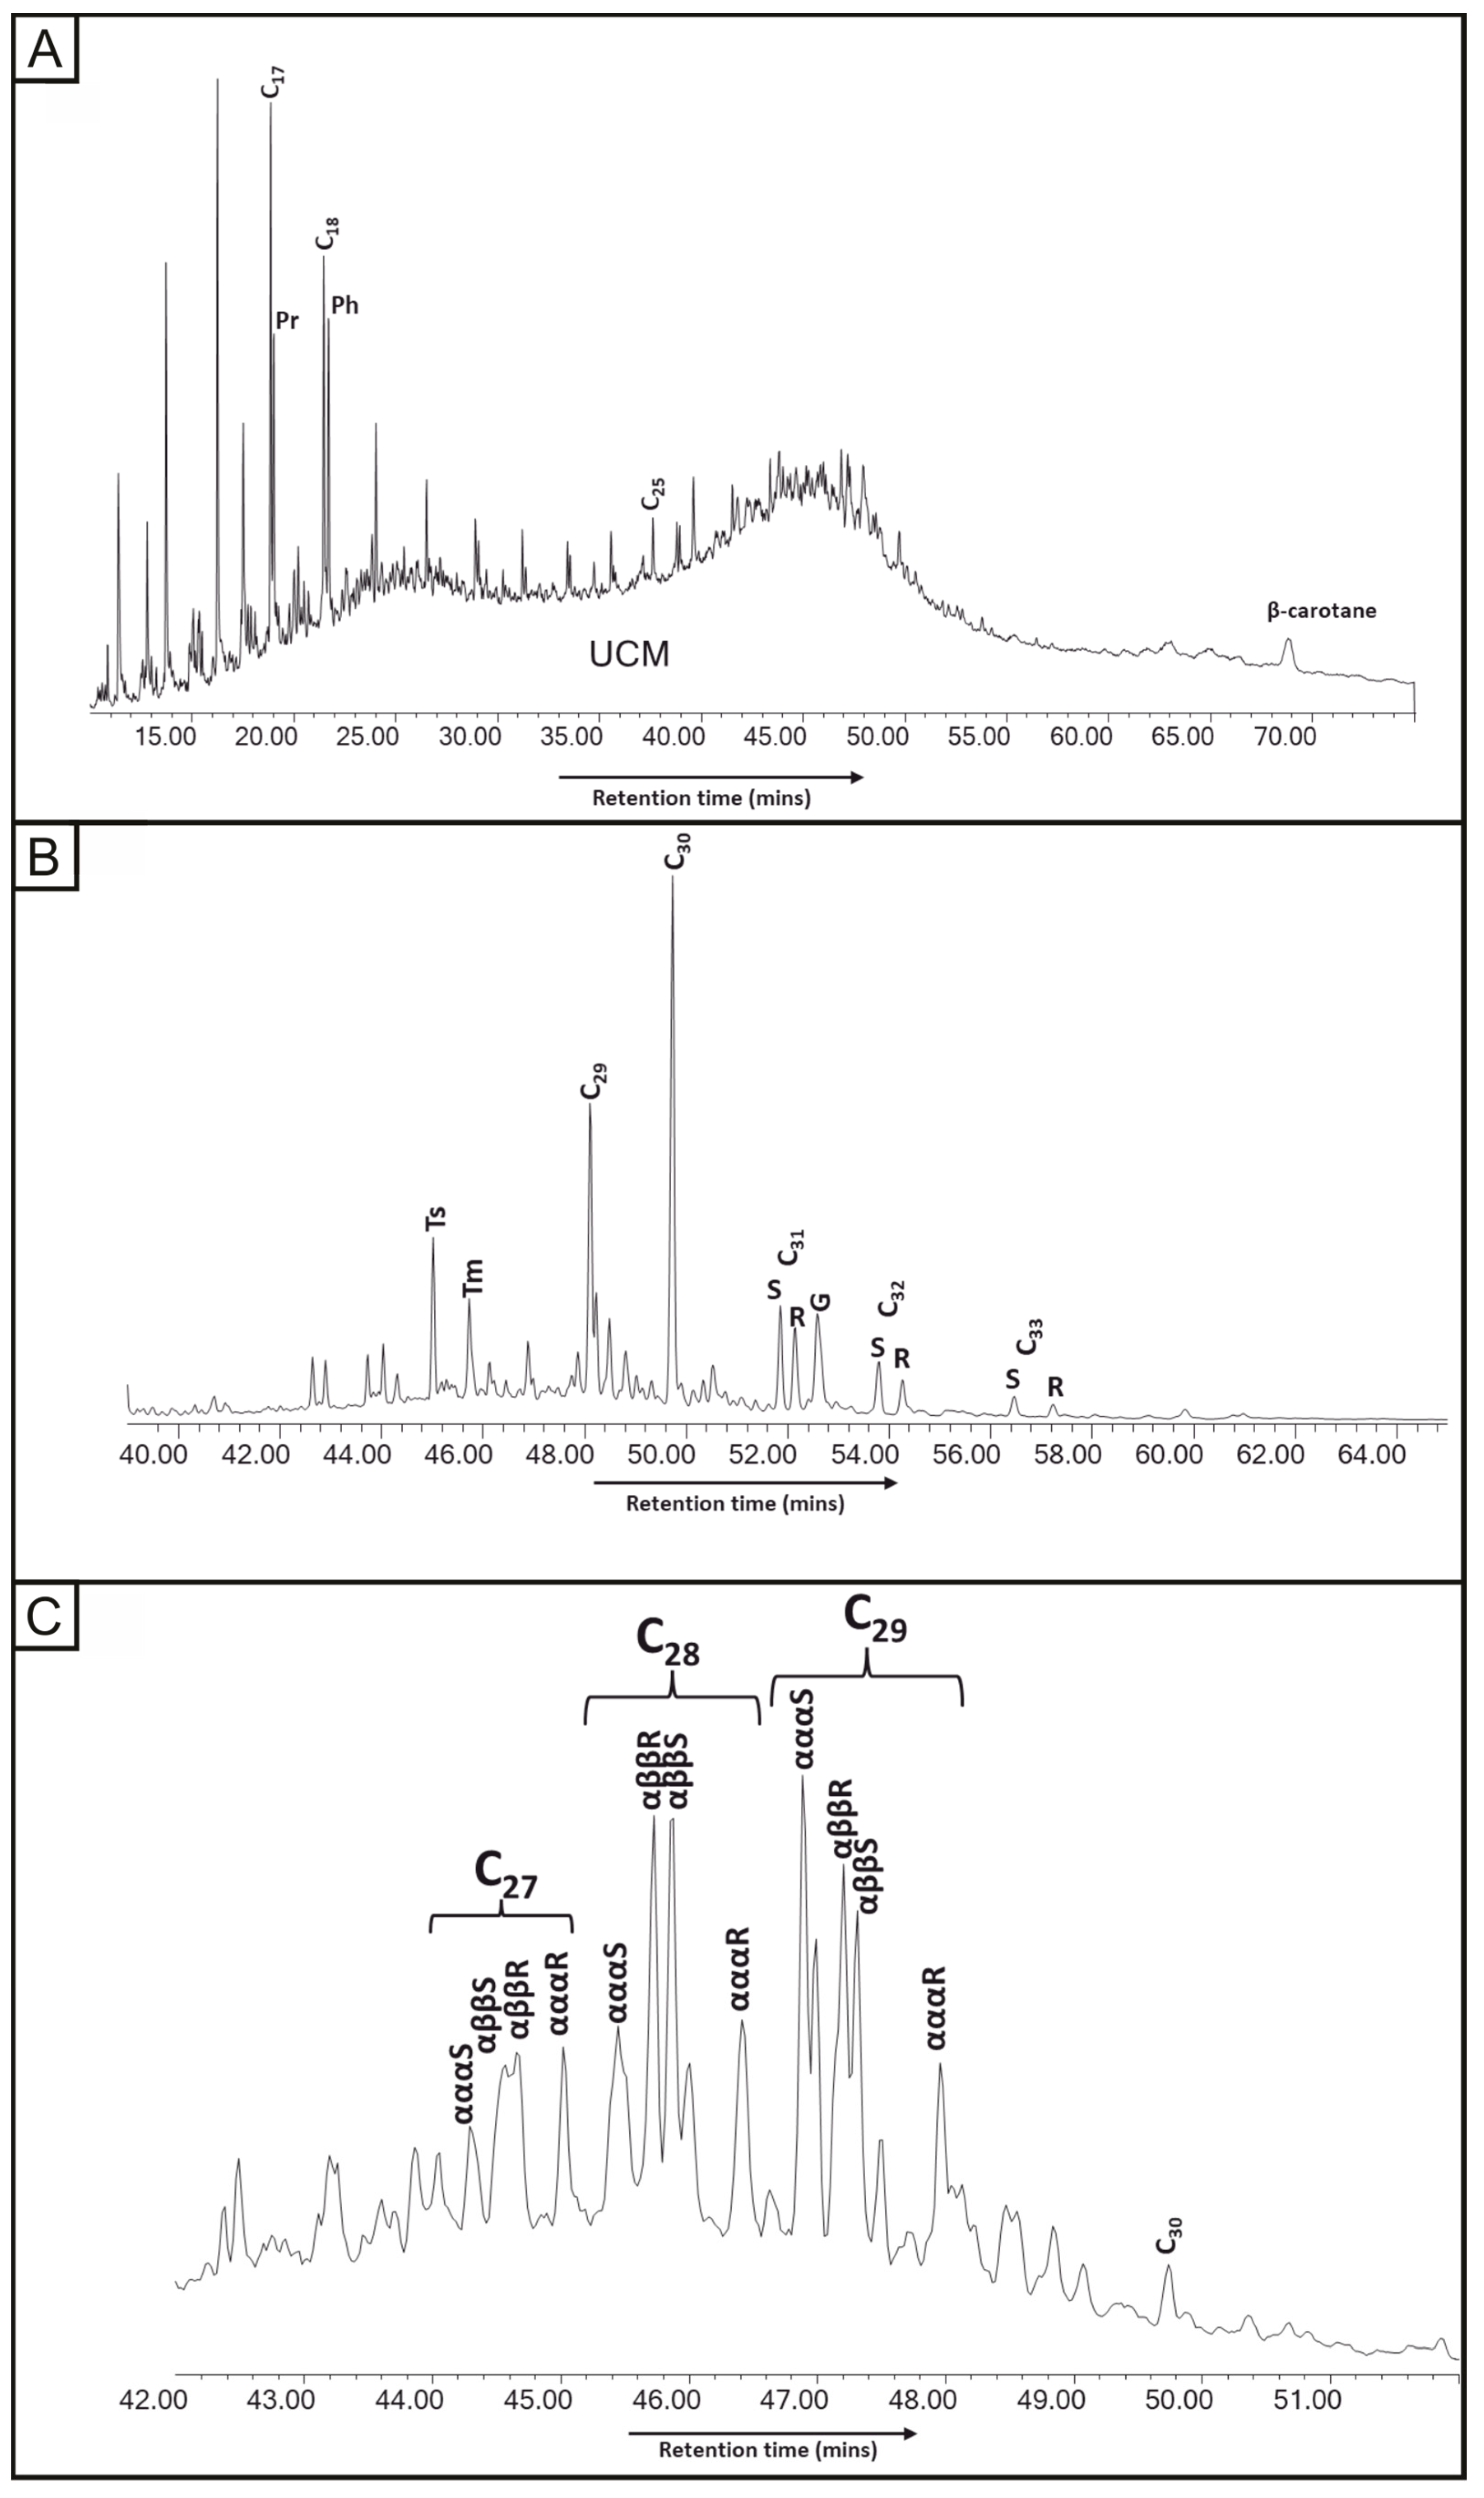
4.5. Gas Chromatography/Mass Spectrometry (GC-MS)
5. Discussion
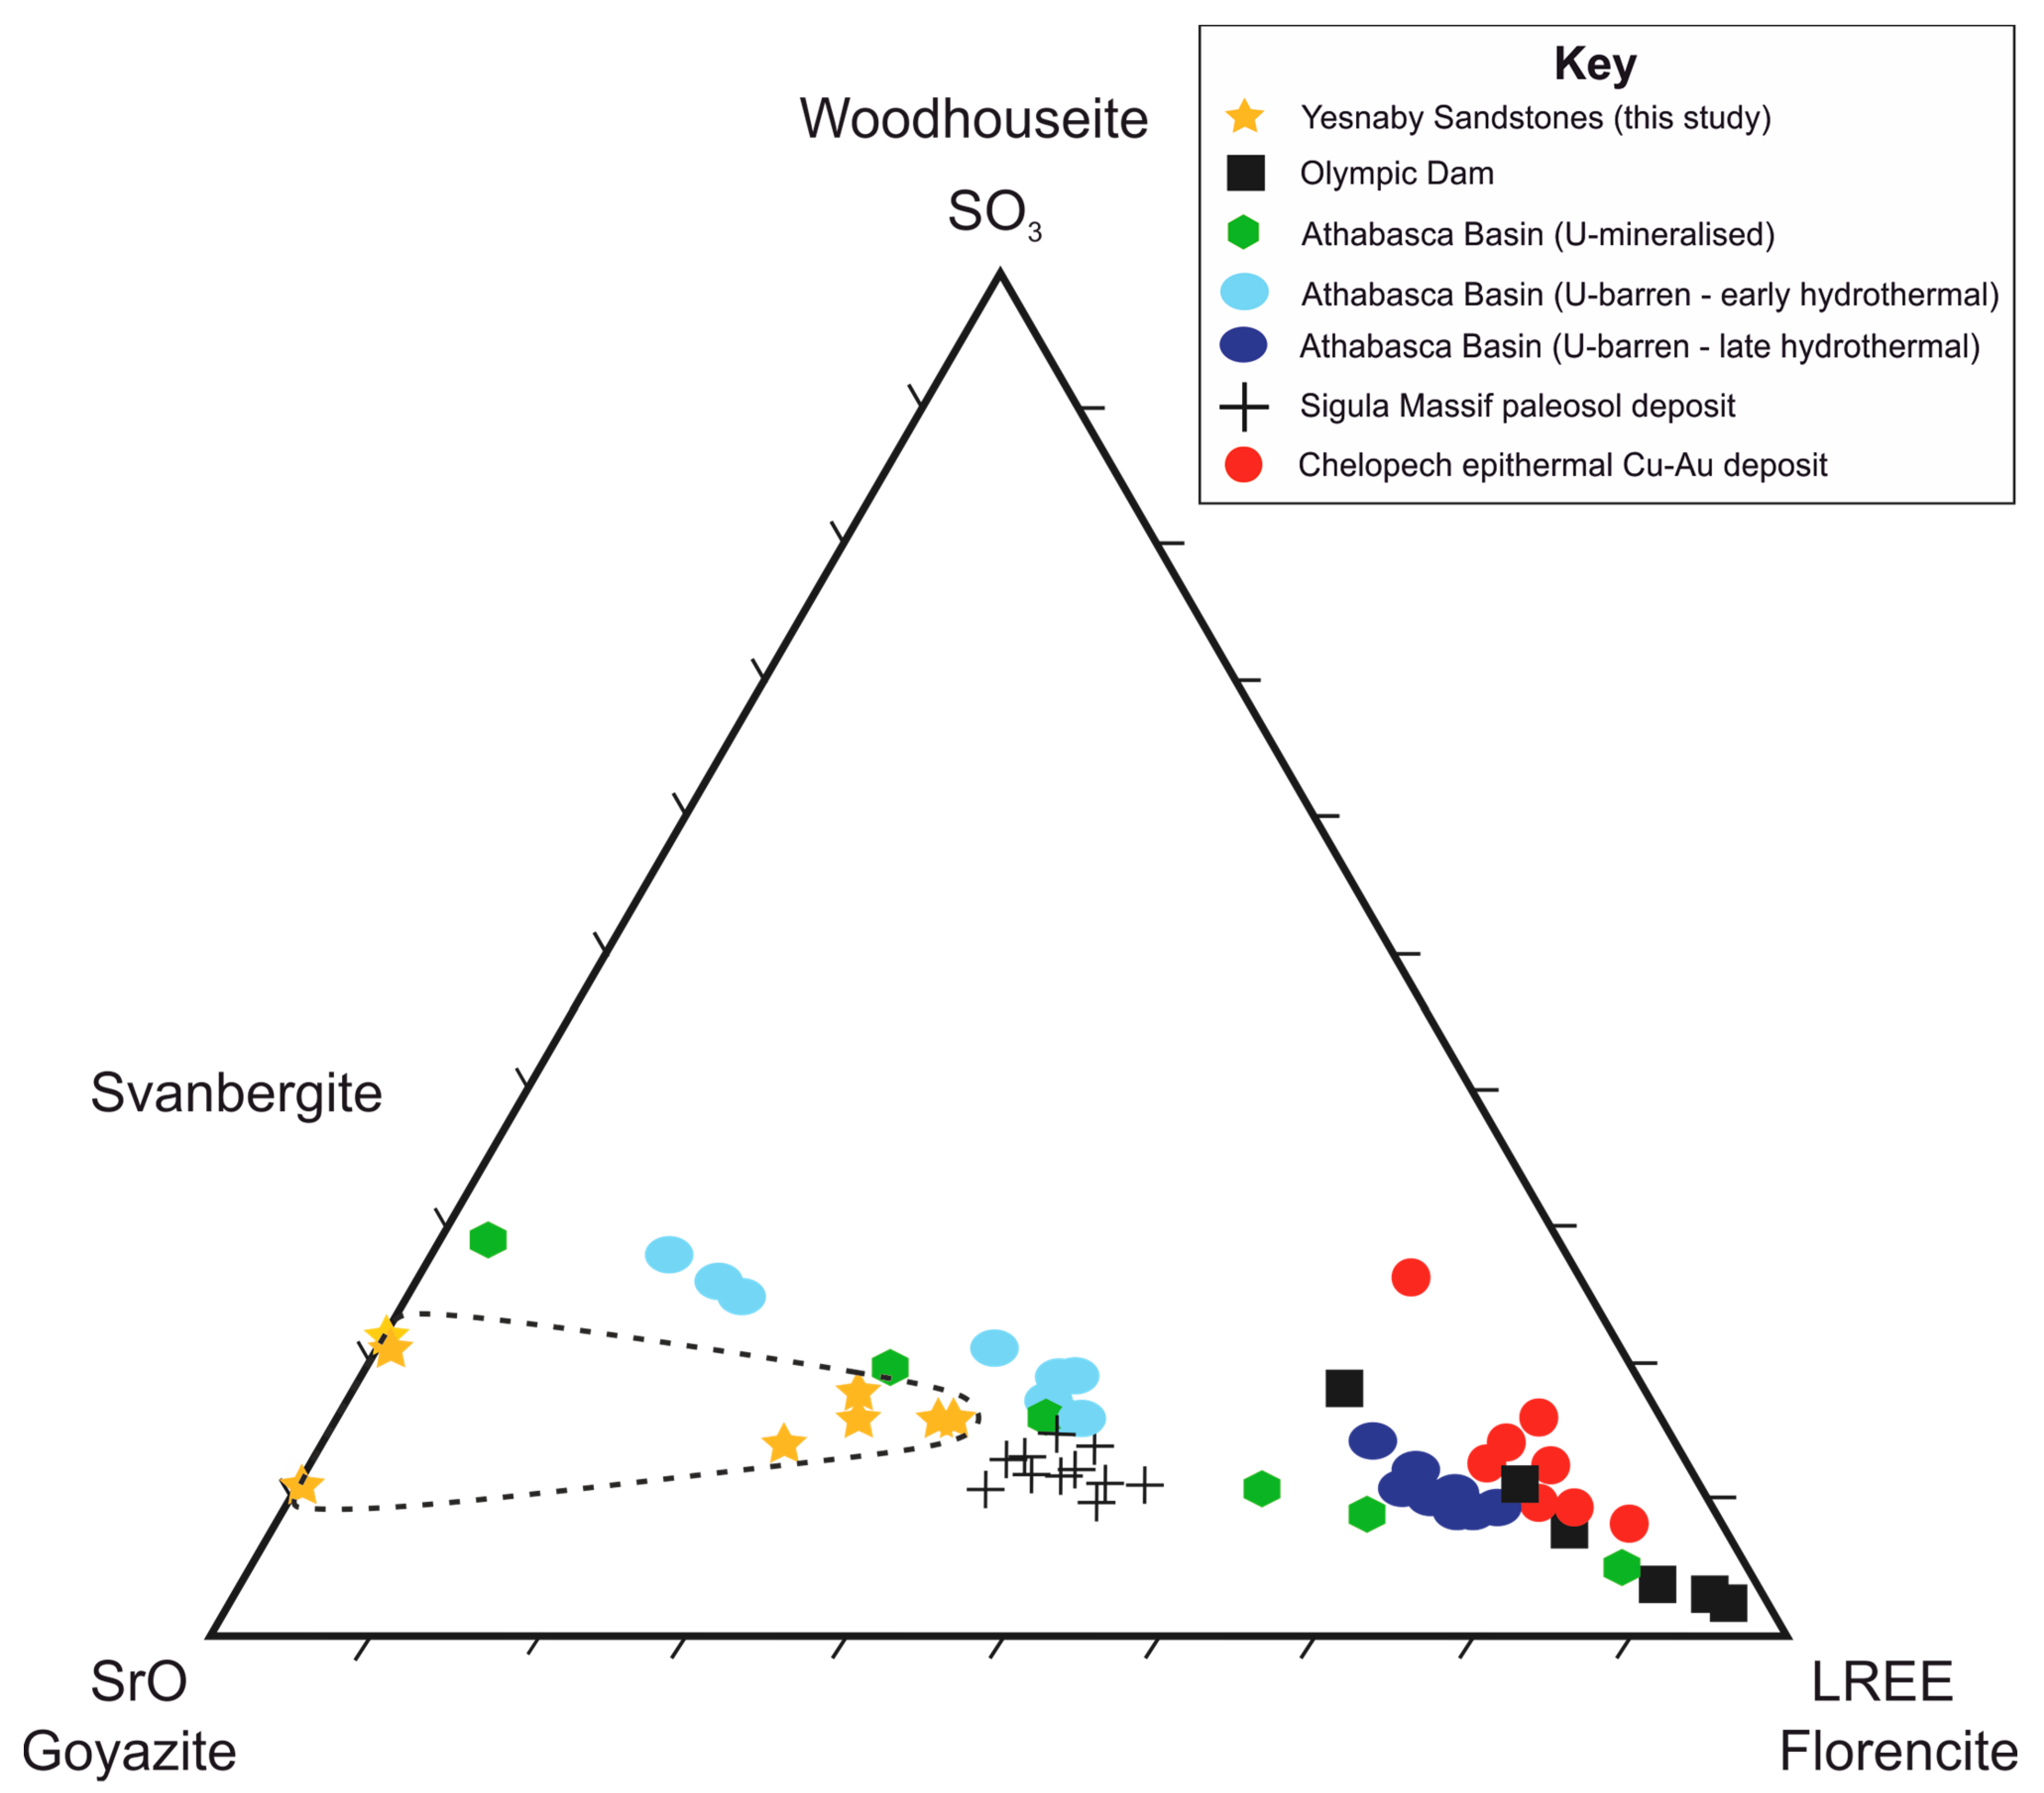
5.1. APS Minerals
5.2. Copper-Barite-Sphalerite Minerals
5.3. The Role of Oil Residues in Mineralisation
5.4. Relationship between Basement and Mineralisation
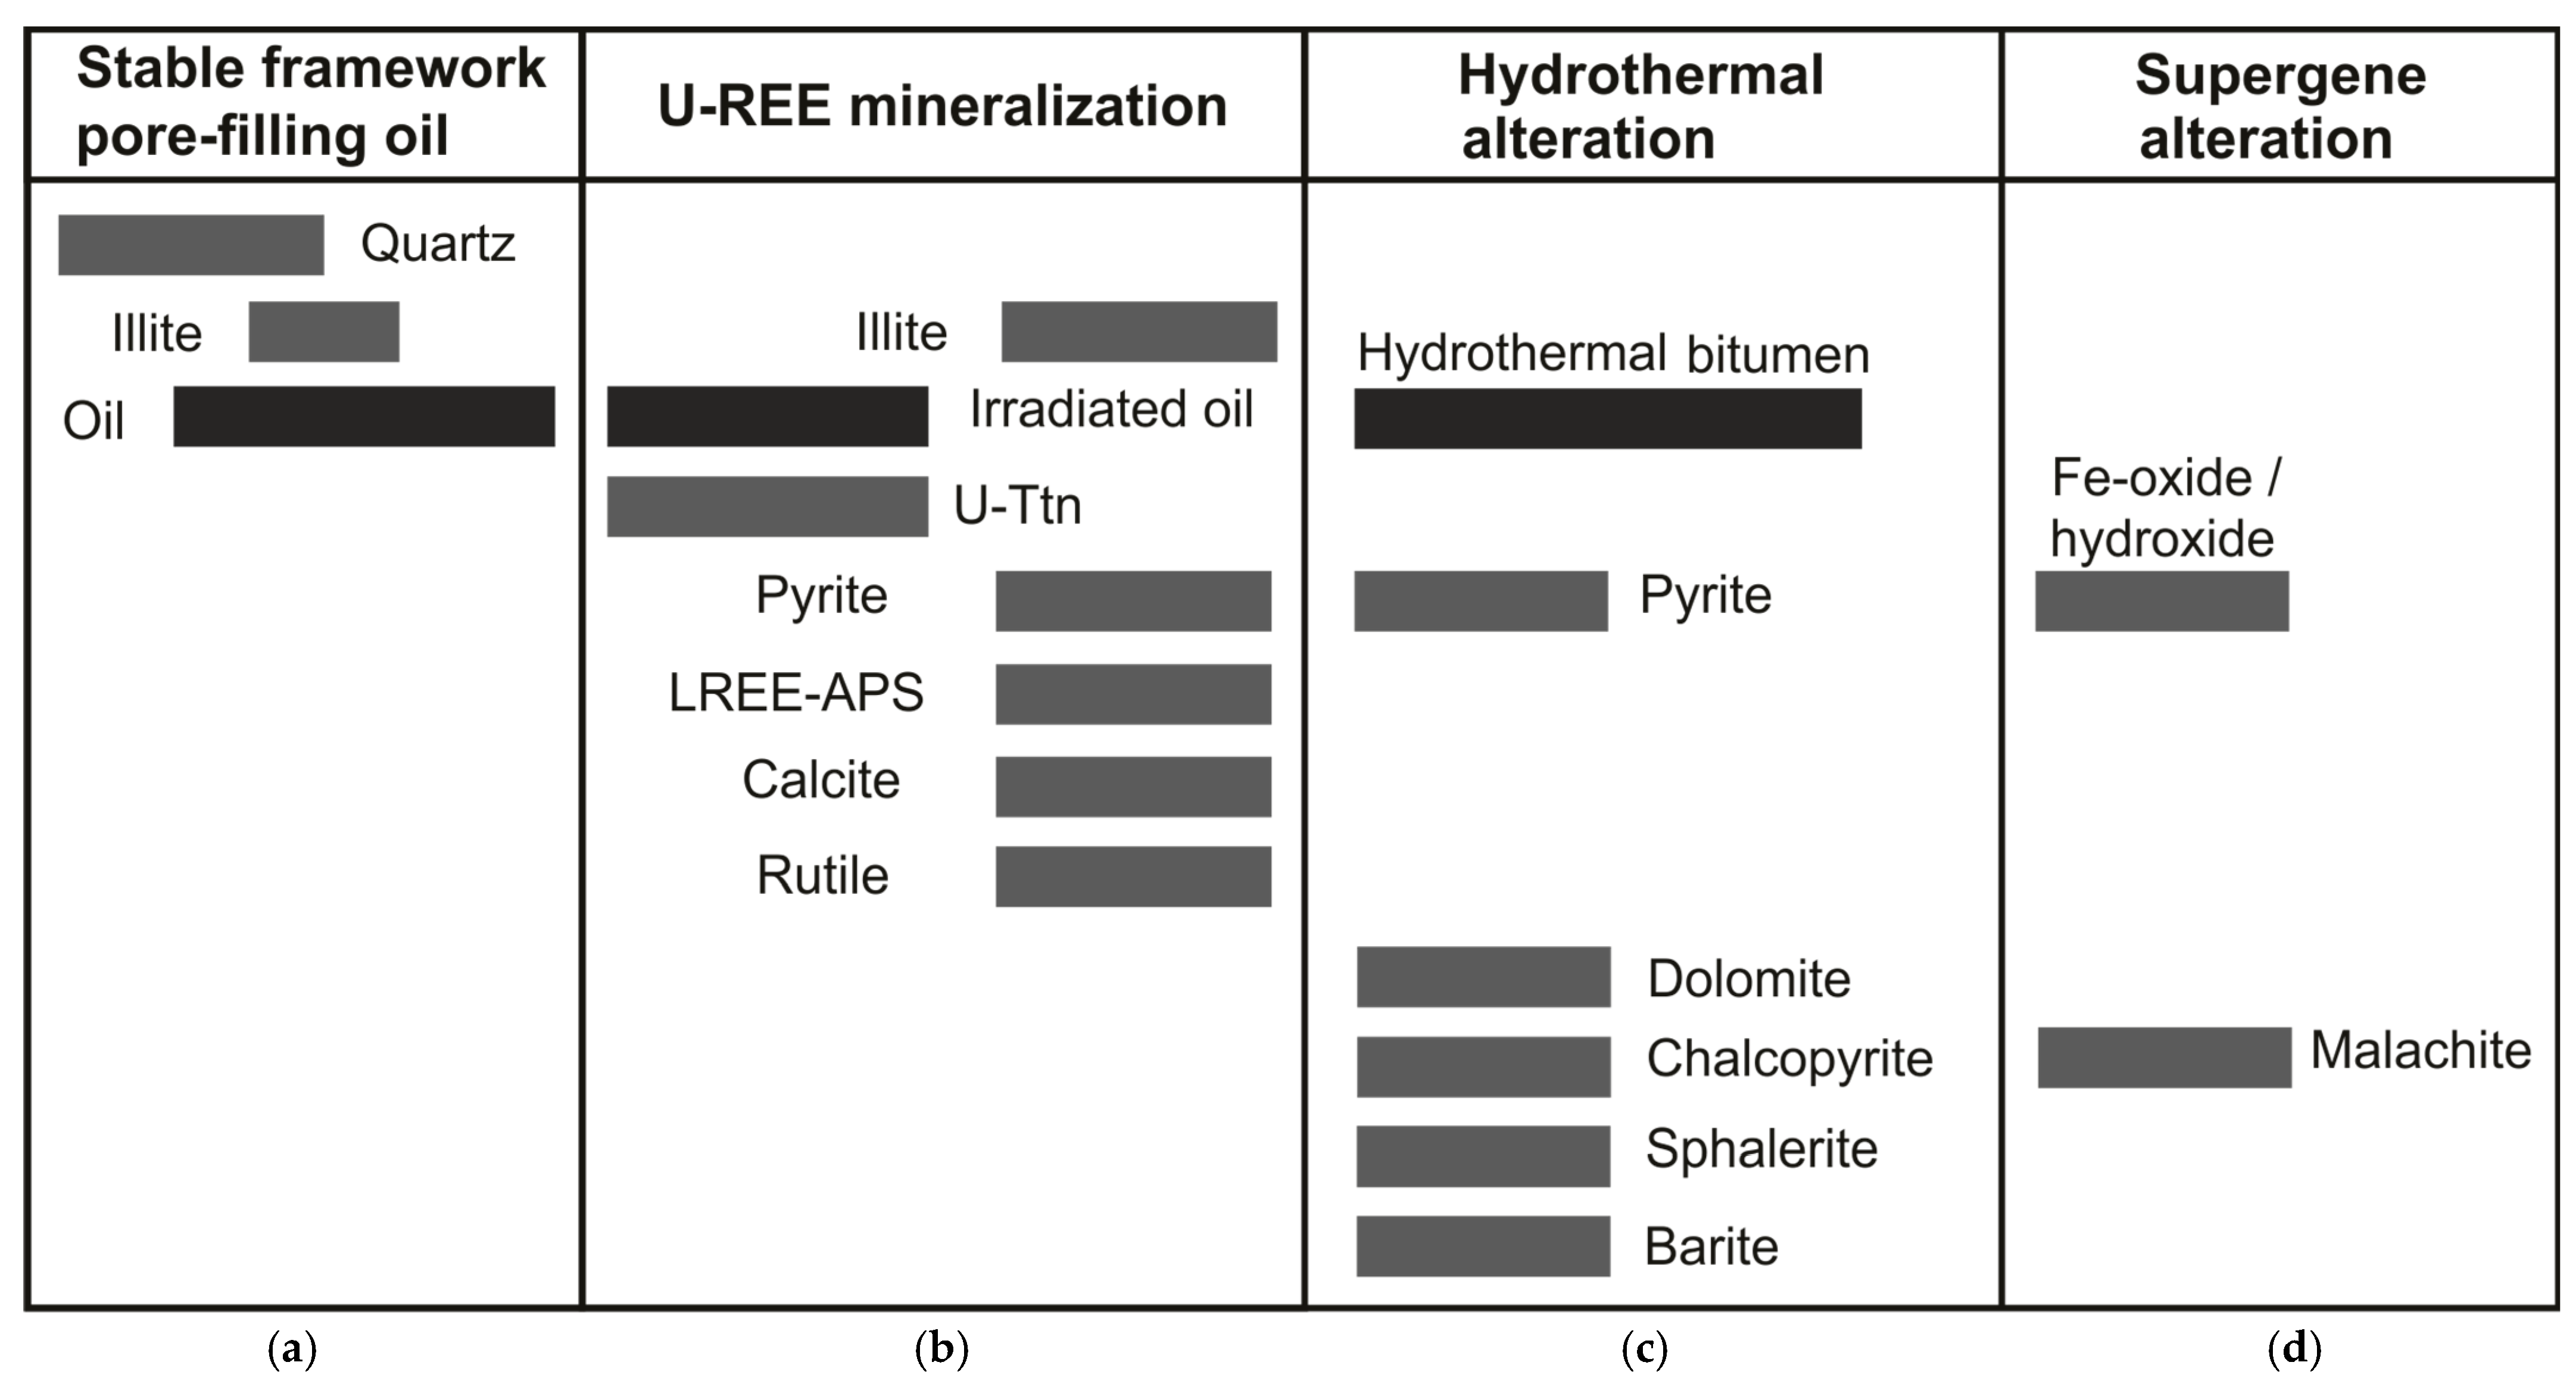
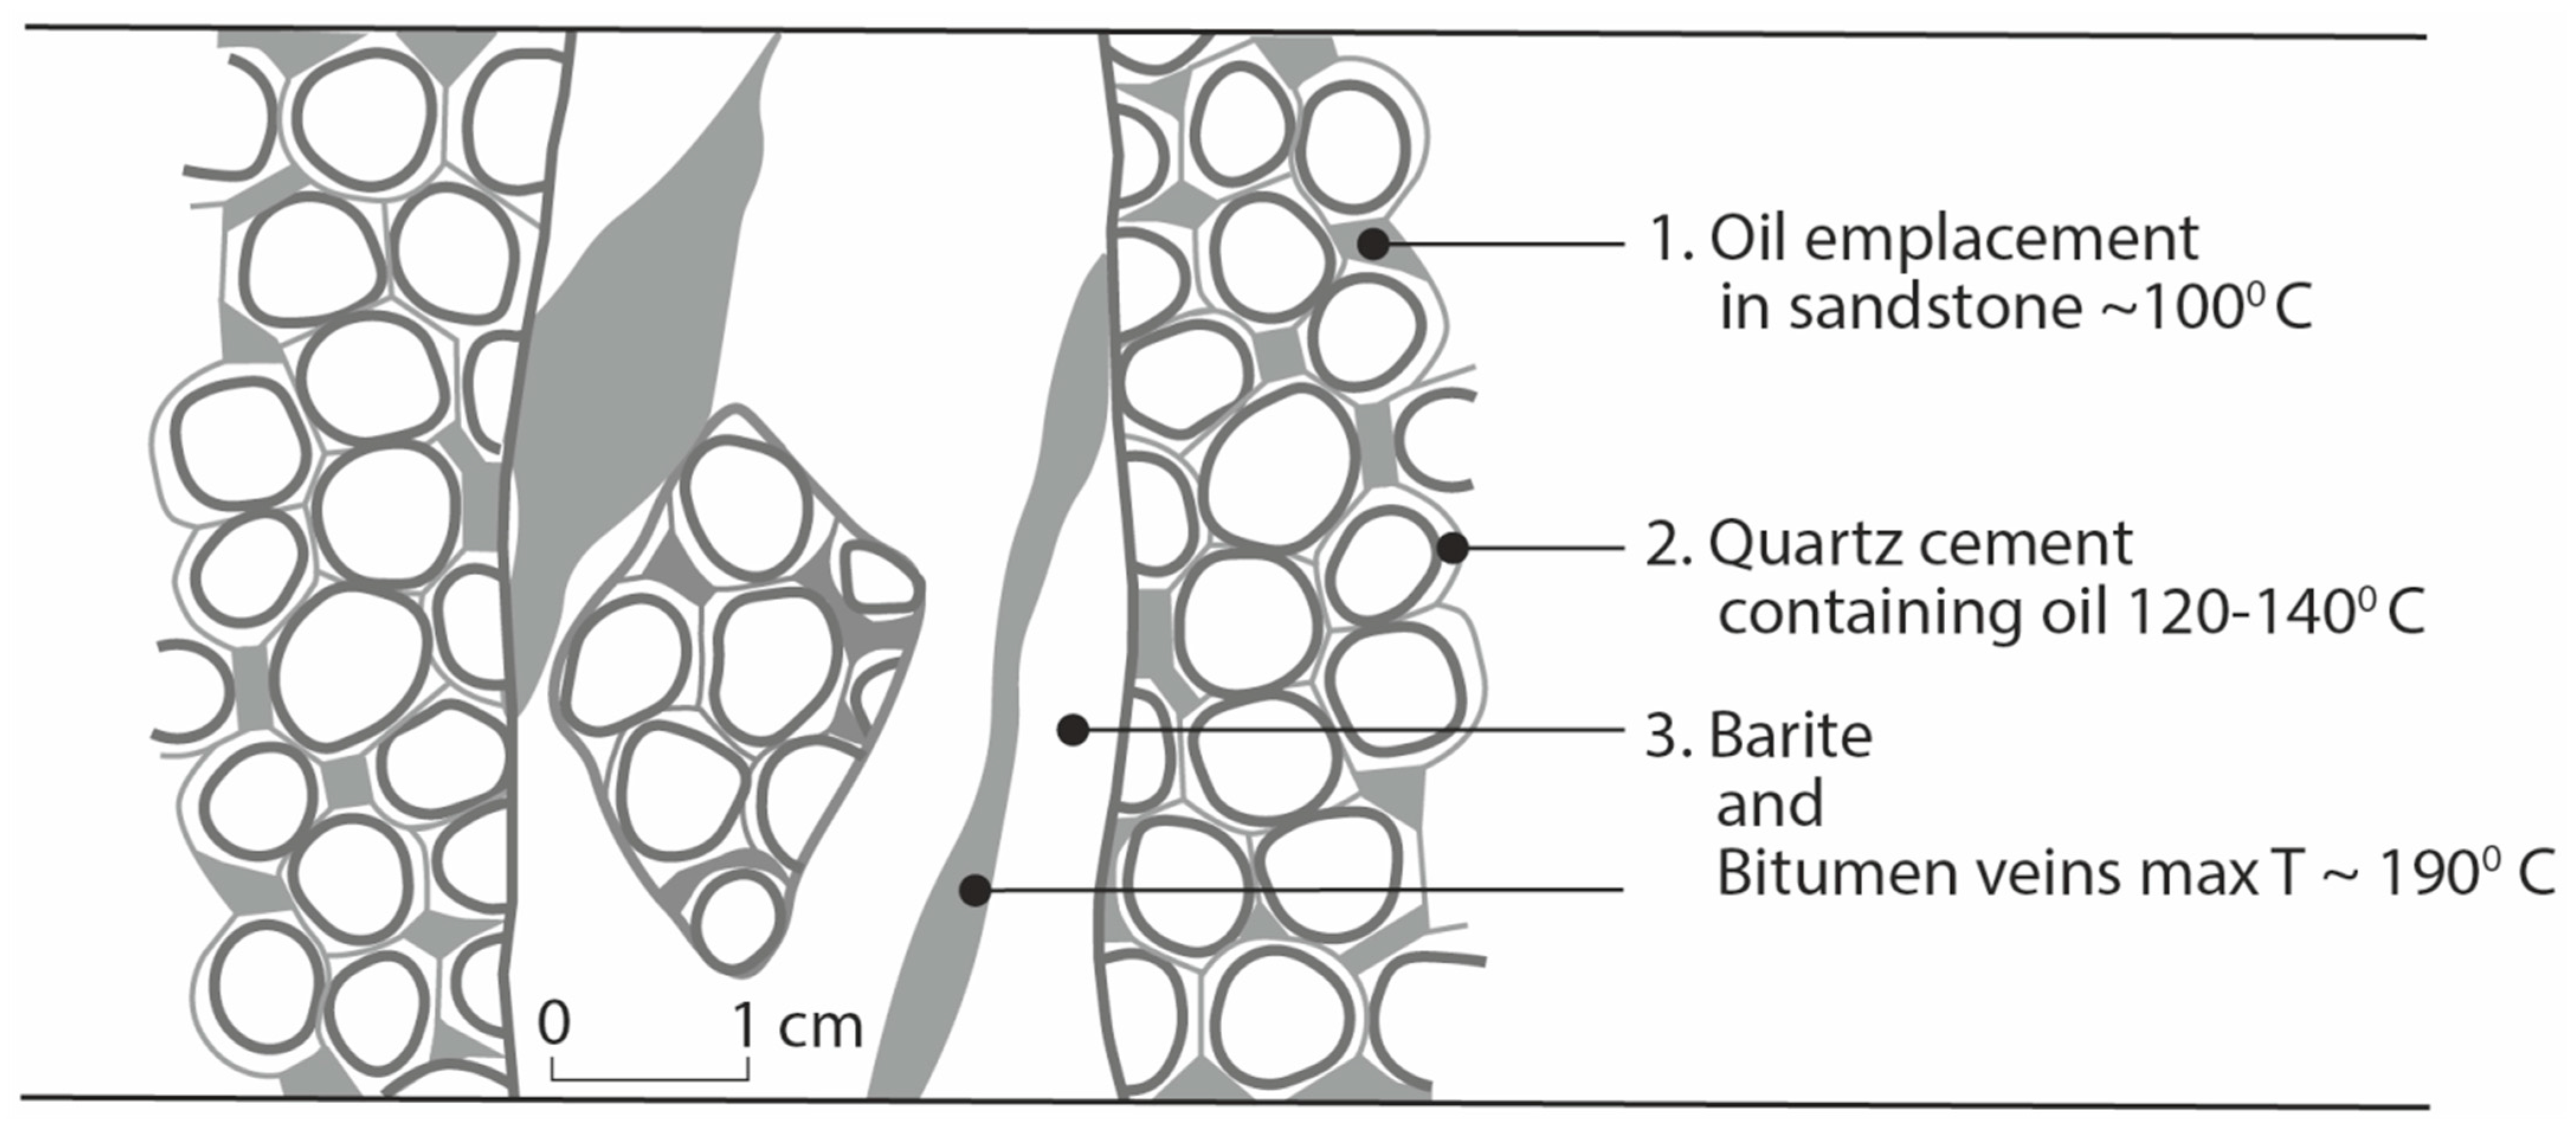
5.5. Paragenetic Sequence and Temperature History
- (i)
- Primary quartz overgrowths contain oil fluid inclusions, indicating oil was present during their formation.
- (ii)
- (iii)
- The brannerite arrays have only been observed within the bitumen nodules.
6. Conclusions
- (i)
- All mineralisation is spatially associated with bitumen in the sandstone.
- (ii)
- All mineralisation postdated oil charging of the reservoir, i.e., oil emplacement occurred first.
- (iii)
- The mineralisation all occurred in the temperature range of 100 to ~190 °C
- (iv)
- Mineralisation occurred prior to biodegradation, which may have occurred during uplift. The role of exhumation, in this case is, therefore, the disposition of the deposit at the present surface rather than a genetic role in mineralisation.
Author Contributions
Funding
Data Availability Statement
Acknowledgments
Conflicts of Interest
References
- Michie, U.M.L.; Cooper, D.C. Uranium in the Old Red Sandstone of Orkney. Rep. Inst. Geol. Sci. 1979, 78, 16. [Google Scholar]
- Trewin, N.H. The petroleum potential of the Old Red Sandstone of northern Scotland. Scott. J. Geol. 1989, 25, 201–225. [Google Scholar] [CrossRef]
- Brown, J.F.; Astin, T.R.; Marshall, J.E.A. The Paleozoic petroleum system in the north of Scotland—outcrop analogues. Geol. Soc. Lond. Spec. Publ. 2018, 471, 253–280. [Google Scholar] [CrossRef]
- Mykura, W. Orkney and Shetland. In British Regional Geology; Her Majesty’s Stationery Office: Edinburgh, UK, 1976. [Google Scholar]
- Watson, J.V.; Plant, J. Regional geochemistry of uranium as a guide to deposit formation. Philos. Trans. R. Soc. Lond. Ser. A 1979, 291, 321–338. [Google Scholar]
- McCready, A.J.; Parnell, J. A Phanerozoic analogue for Witwatersrand-type uranium mineralization: Uranium-titanium-bitumen nodules in Devonian conglomerates/sandstones, Orkney, Scotland. Trans IMM (Sect. B Appl. Earth Sci.) 1998, 107, 889–897. [Google Scholar]
- Mauk, J.L.; Hieshima, G.B. Organic matter and copper mineralization at White Pine, Michigan, U.S.A. Chem. Geol. 1992, 99, 189–211. [Google Scholar] [CrossRef]
- Cisternas, M.E.; Hermosilla, J. The role of bitumen in strata-bound copper deposit formation in the Copiapo area, Northern Chile. Miner. Depos. 2006, 41, 339–355. [Google Scholar] [CrossRef]
- Wilson, N.S.F.; Zentilli, M. Association of pyrobitumen with copper mineralization from the Uchumi and Talcuna districts, central Chile. Int. J. Coal Geol. 2006, 65, 158–169. [Google Scholar] [CrossRef]
- Box, S.E.; Syusyura, B.; Hayes, T.S.; Taylor, C.D.; Zientek, M.L.; Hitzman, M.W.; Seltmann, R.; Chechetkin, V.; Dolgopolova, A.; Cossette, P.M.; et al. Sandstone Copper Assessment of the Chu-Sarysu Basin, Central Kazakhstan. In U.S. Department of the Interior, U.S. Geological Survey, Scientific Investigations Report 2010-5090-E; U.S. Department of the Interior: Washington, DC, USA, 2012. [Google Scholar]
- Pons, M.J.; Franchini, M.; Giusiano, A.; Patrier, P.; Beaufort, D.; Impiccini, A.; Rainoldi, A.L.; Meinert, L. Alteration halos in the Tordillos sediment-hosted copper deposit of the Neuquen Basin, Argentina. Ore Geol. Rev. 2017, 80, 691–715. [Google Scholar] [CrossRef]
- Barton, I.F.; Barton, M.D.; Thorson, J.P. Characteristics of Cu and U-V Deposits in the Paradox Basin (Colorado Plateau) and associated alteration. Soc. Econ. Geol. Inc. Guideb. Ser. 2018, 59, 73–102. [Google Scholar]
- Dill, H.G. The geology of aluminium phosphates and sulphates of the alunite group minerals: A review. Earth-Sci. Rev. 2001, 53, 35–93. [Google Scholar] [CrossRef]
- Xu, X.-W.; Mao, Q.; Li, X.-H.; Pirajno, F.M.; Qu, X.; Deng, G.; Chen, D.-Z.; Zhang, B.-L.; Dong, L.-H. Copper-Zinc albite porphyry in the Hersai porphyry copper deposit, East Junggar, China: A transition between late magmatic and hydrothermal porphyry copper deposit. Ore Geol. Rev. 2014, 61, 141–156. [Google Scholar] [CrossRef]
- Kovács, I.; Németh, T.; Kiss, G.B.; Kis, V.K.; Tóth, Á.; Benkó, Z. Rare aluminium phosphates and sulphates (APS) and clay mineral assemblages in silicified hydraulic breccia hosted by a Permian granite (Velence Mts., Hungary) as indicators of a high sulfidation type epithermal system. Mineral. Petrol. 2019, 113, 217–228. [Google Scholar] [CrossRef]
- Martínez, J.C.; Dristas, J.A.; Massonne, H.J.; Theye, T. Alunite and REE rich APS minerals associated to the hydrothermal clay deposits in the Barker area, Tandilia, Argentina. Clay Sci. 2006, 12 (Suppl. 2), 15–20. [Google Scholar]
- Cloutier, J.; Kyser, K.; Olivo, G.R.; Alexandre, P. Contrasting patterns of alteration at the Wheeler River area, Athabasca Basin, Saskatchewan, Canada: Insights into the apparently Uranium-barren zone K alteration system. Econ. Geol. 2010, 105, 303–324. [Google Scholar] [CrossRef]
- Gaboreau, S.; Cuney, M.; Quirt, D.; Beaufort, D.; Patrier, P.; Matthew, R. Significance of aluminium phosphate-sulfate minerals associated with Unconformity-type deposits: The Athabasca Basin, Canada. Am. Mineral. 2007, 92, 267–280. [Google Scholar] [CrossRef]
- Riegler, T.; Quirt, D.; Beaufort, D. Spatial distribution and compositional variation of APS minerals related to uranium deposits in the Kiggavik-Andrew Lake structural trend, Nunavut, Canada. Miner. Depos. 2016, 51, 219–236. [Google Scholar] [CrossRef]
- Rojkovič, I.; Konečny, P.; Novotný, Ľ.; Puškelová, L.; Streško, V. Quartz-Apatite-REE vein mineralization in early paleozoic rocks of the Gemeric Superunit, Slovenia. Geol. Carpathica 1999, 50, 215–227. [Google Scholar]
- Hikov, A. First find of florencite-(Ce,La,Nd) in advanced argillic altered rocks from the Asarel porphyry copper deposit, Central Srednogori. Rev. Bulg. Geol. Soc. 2017, 80, 33–35. [Google Scholar]
- Georgieva, S.; Velinova, N. Florencite-(Ce, La, Nd) and crandallite from the advanced argillic alteration in the Chelopech high-sulphidation epithermal Cu-Au deposit, Bulgaria. Comptes Rendus L’académie Bulg. Des Sci. 2014, 67, 1669–1678. [Google Scholar]
- Lefebvre, J.J.; Patterson, L.E. Hydrothermal assemblages of aluminian serpentine, florencite and kyanite in the Zairian Copperbelt. Ann. Société Géologique Belg. 1982, 105, 51–71. [Google Scholar]
- Chakraborty, M.; Biswas, S.; Sengupta, N.; Sengupta, P. First report of florencite from the Singhbhum Shear Zone of the East Indian Craton. Int. J. Mineral. 2014, 2014, 978793. [Google Scholar] [CrossRef]
- Davidson, G.J.; Paterson, H.; Meffre, S.; Berry, R.F. Characteristics and origin of the Oak Dam East breccia-hosted, iron oxide Cu-U-(Au) Deposit: Olympic Dam Region, Gawler Craton, South Australia. Econ. Geol. 2007, 102, 1471–1498. [Google Scholar] [CrossRef]
- Schmandt, D.S.; Cook, N.J.; Ciobanu, C.L.; Ehrig, K.; Wade, P.W.; Gilbert, S.; Kamenetsky, V.S. Rare earth element phosphate minerals from the Olympic Dam Cu-U-Au-Ag deposit, South Australia: Recognizing temporal-spatial controls on REE mineralogy in an evolved IOCG system. Can. Mineral. 2019, 57, 1–22. [Google Scholar] [CrossRef]
- Khashgerel, B.-E.; Kavalieris, I.; Hayashi, K.-I. Mineralogy, textures, and whole-rock geochemistry of advanced argillic alteration: Hugo Dummett porphyry Cu–Au deposit, Oyu Tolgoi mineral district, Mongolia. Miner. Depos. 2008, 43, 913–932. [Google Scholar] [CrossRef]
- Stoffregen, R.E.; Alpers, C.N. Woodhouseite and svanbergite in hydrothermal ore deposits: Products of apatite destruction during advanced argillic alteration. Can. Mineral. 1987, 25, 201–211. [Google Scholar]
- Soroka, E.I.; Leonova, L.V.; Pritchin, M.E. Brockite in wallrock metasomatites of the Safyanovskoe copper-sulphide deposit (Middle Urals). News Ural. State Min. Univ. 2020, 3, 35–40. [Google Scholar] [CrossRef]
- Voudouris, P.C.; Melfos, V. Aluminum-phosphate-sulfate (APS) minerals in the sericitic-advanced argillic alteration zone of the Melitena porphyry-epithermal Mo-Cu ± Au ± Re prospect, western Thrace, Greece. Neues Jahrb. Mineral. Abh. 2012, 190, 11–27. [Google Scholar] [CrossRef] [PubMed]
- Strachan, R.A. The metamorphic basement geology of Mainland Orkney and Graemsay. Scott. J. Geol. 2003, 39, 145–149. [Google Scholar] [CrossRef]
- Lundmark, A.M.; Augland, L.E.; Bjerga, A.D. Timing of strain partitioning and magmatism in the Scottish Scandian collision, evidence from the high Ba–Sr Orkney granite complex. Scott. J. Geol. 2019, 55, 21–34. [Google Scholar] [CrossRef]
- Parnell, J.; Carey, P.; Monson, B. Timing and temperature of décollement on hydrocarbon source rock beds in cyclic lacustrine successions. Palaeogeogr. Palaeoclimatol. Palaeoecol. 1998, 140, 121–134. [Google Scholar] [CrossRef]
- Dichiarante, A.M.; Holdsworth, R.E.; Dempsey, E.D.; Selby, D.; McCaffrey, K.J.W.; Michie, U.M.L.; Morgan, G.; Bonniface, J. New structural and Re-Os geochronological evidence constraining the age of faulting and associated mineralization in the Devonian Orcadian basin, Scotland. J. Geol. Soc. 2016, 173, 457–473. [Google Scholar] [CrossRef]
- Ghazwani, A.; Littke, R.; Sachse, V.; Fink, R.; Mahlstedt, N.; Hartkopf-Fröder, C. Organic geochemistry, petrology and palynofacies of Middle Devonian lacustrine flagstones in the Orcadian Basin, Scotland: Depositional environment, thermal history and petroleum generation potential. Geol. Mag. 2018, 155, 773–796. [Google Scholar] [CrossRef]
- Gallagher, M.J.; Michie, U.M.; Smith, R.T.; Haynes, L. New evidence of uranium and other mineralization in Scotland. Trans. Inst. Min. Metall. 1971, 80, 150–173. [Google Scholar]
- Plant, J.A.; Forrest, M.D.; Hodgson, J.F.; Smith, R.T.; Stevenson, A.G. Regional geochemistry in the detection and modelling of mineral deposits. In Applied Geochemistry in the 1980s; Thornton, I., Howarth, R.J., Eds.; Graham and Trotman: London, UK, 1986; pp. 103–139. [Google Scholar]
- Muir, R.O.; Ridgway, J.M. Sulphide mineralisation of the continental Devonian sediments of Orkney (Scotland). Miner. Depos. 1975, 10, 205–215. [Google Scholar] [CrossRef]
- Parnell, J. Mineralized Magadi-type cherts in the Devonian of Scotland: Support for a model of sulfide deposition in low-temperature alkaline conditions. Econ. Geol. 1987, 82, 1053–1056. [Google Scholar] [CrossRef]
- Parnell, J.; Janaway, T. Sulphide-mineralized algal breccias in a Devonian evaporitic lake system, Orkney, Scotland. Ore Geol. Rev. 1990, 4, 445–460. [Google Scholar] [CrossRef]
- Peters, K.E.; Walters, C.C.; Moldowan, J.M. The Biomarker Guide. In Biomarkers and Isotopes in Petroleum Exploration and Earth History; Cambridge University Press: Cambridge, UK, 2005. [Google Scholar]
- Lünsdorf, N.K.; Lünsdorf, J.O. Evaluating Raman spectra of carbonaceous matter by automated, iterative curve-fitting. Int. J. Coal Geol. 2016, 160, 51–62. [Google Scholar] [CrossRef]
- Lünsdorf, N.K.; Dunkl, I.; Schmidt, B.C.; Rantitsch, G.; Von Eynatten, H. Towards a higher comparability of geothermometric data obtained by Raman spectroscopy of carbonaceous material. Part 2: A revised geothermometer. Geostand. Geoanalytical Res. 2017, 41, 593–612. [Google Scholar] [CrossRef]
- Lecomte, A.; Michels, R.; Cathelineau, M.; Mortol, C.; Brousand, M.; Flotte, N. Uranium deposits of Franceville Basin (Gabon): Role of organic matter and oil cracking on uranium mineralization. Ore Geol. Rev. 2020, 123, 103579. [Google Scholar] [CrossRef]
- Fuchs, S.; Schumann, D.; Martin, R.F.; Couillard, N. The extensive hydrocarbon-mediated fixation of hydrothermal gold in the Witwatersrand Basin, South Africa. Ore Geol. Rev. 2021, 138, 104313. [Google Scholar] [CrossRef]
- Astin, T.R.; Rogers, D.A. Subaqueous shrinkage cracks in the Devonian of Scotland reinterpreted. Scott. J. Geol. 1991, 61, 850–859. [Google Scholar]
- Vircava, I.; Somelar, P.; Liivamägi, S.; Kirs, J.; Kirsimäe, K. Origin and paleoenvironmental interpretation of aluminium phosphate sulfate minerals in a Neoproterozoic Baltic paleosol. Sediment. Geol. 2015, 319, 114–123. [Google Scholar] [CrossRef]
- Baidya, A.S.; Pal, D.C. Geochemical evolution and timing of uranium mineralization in the Khetri Coppe Belt, western India. Ore Geol. Rev. 2020, 127, 193974. [Google Scholar] [CrossRef]
- Jørgensen, B.B.; Böttcher, M.E.; Lüschen, H.; Neretin, L.N.; Volkov, I.I. Anaerobic methane oxidation and a deep H2S sink generate isotopically heavy sulfides in Black Sea sediments. Geochim. Et Cosmochim. Acta 2004, 68, 2095–2118. [Google Scholar] [CrossRef]
- Lin, Z.; Sun, X.; Peckmann, J.; Lu, Y.; Xu, L.; Strauss, H.; Zhou, H.; Gong, J.; Lu, H.; Teichert, B.M.A. How sulfate-driven anaerobic oxidation of methane affects the sulfur isotopic composition of pyrite: A SIMS study from the South China Sea. Chem. Geol. 2016, 440, 26–41. [Google Scholar] [CrossRef]
- Kim, J.H.; Bailey, L.; Noyes, C.; Tyne, R.L.; Ballentine, C.J.; Ma, L.; Barton, M.; Barton, L.; Reiners, P.W.; Ferguson, G.; et al. Hydrogeochemical evolution of formation waters responsible for sandstone bleaching and ore mineralization in the Paradox Basin, Colorado Plateau, USA. Bull. Geol. Soc. Am. 2022, 134, 2589–2610. [Google Scholar] [CrossRef]
- Macintyre, T.J.; Hitzman, M.W.; Thorson, J.P. Hydrocarbon-induced bleaching and copper mineralization in the Wingate Sandstone, Paradox Valley, Colorado: Two episodes of fluid migration during the evolution of the Paradox Basin. AAPG Bull. 2022, 107, 169–189. [Google Scholar] [CrossRef]
- Rainoldi, A.L.; Franchini, M.B.; Boyce, A.J.; Giusiano, A.; Cesaretti, N.N.; Pons, J.; Ríos, F.J. Stable isotope and fluid inclusion study of sediment-hosted stratiform copper deposits from the Neuquén Basin, Argentina. Miner. Depos. 2019, 54, 415–436. [Google Scholar] [CrossRef]
- Pons, M.J.; Franchini, M.; Rainoldi, A.L.; Giusiano, A.; Cesaretti, N.N.; Montagna, A.O.; Herrington, R. Base metal mobility linked to brine and hydrocarbon migration at the Huincul High in the Neuquén Basin, Argentina: Implications for the formation of sediment-hosted base metal deposits. J. Geochem. Explor. 2021, 226, 106778. [Google Scholar] [CrossRef]
- Carrillo-Rosúa, J.; Boyce, A.J.; Morales-Ruano, S.; Morata, D.; Roberts, S.; Munizaga, F.; Moreno-Rodríguez, V. Extremely negative and inhomogeneous sulfur isotope signatures in Cretaceous Chilean manto-type Cu-(Ag) deposits, Coastal Range of central Chile. Ore Geol. Rev. 2014, 56, 13–24. [Google Scholar] [CrossRef]
- Burnie, S.W.; Schwarcz, H.P.; Crocket, J.H. A Sulfur Isotopic Study of the White Pine Mine, Michigan. Econ. Geol. 1972, 67, 895–914. [Google Scholar] [CrossRef]
- Ho, E.S.; Mauk, J.U. Relationship between organic matter and copper mineralization in the Proterozoic Nonesuch Formation, northern Michigan. Ore Geol. Rev. 1996, 11, 71–87. [Google Scholar] [CrossRef]
- Leventhal, J.S.; Daws, T.A.; Frye, J.S. Organic geochemical analysis of sedimentary organic matter associated with uranium. Appl. Geochem. 1986, 1, 241–247. [Google Scholar] [CrossRef]
- Kříbek, B.; Žák, K.; Spangenberg, J.E.; Jehlička, J.; Prokeš, S.; Komínek, J. Bitumens in the late Variscan hydrothermal vein-type uranium deposit of Příbram, Czech Republic: Sources, Radiation-Induced Alteration and Relation to Mineralization. Econ. Geol. 1999, 94, 1093–1114. [Google Scholar] [CrossRef]
- Alexandre, P.; Kyser, T.K. Geochemistry of uraniferous bitumen in the southwest Athabasca Basin, Saskatchewan, Canada. Econ. Geol. 2006, 101, 1605–1612. [Google Scholar] [CrossRef]
- Parnell, J.; Monson, B.; Tosswill, R.J. Petrography of thoriferous hydrocarbon nodules in sandstones, and their significance for petroleum exploration. J. Geol. Soc. Lond. 1990, 147, 837–842. [Google Scholar] [CrossRef]
- Pointer, C.M.; Ashworth, J.R.; Simpson, P.R. Genesis of coffinite and the U-Ti association in Lower Old Red sandstone sediments, Ousdale, Caithness, Scotland. Miner. Depos. 1989, 24, 117–123. [Google Scholar] [CrossRef]
- Tweedie, J.R. Origin of uranium and other metal enrichments in the Helmsdale Granite, eastern Sutherland, Scotland. Trans. Inst. Min. Metallurgy. Sect. B Appl. Earth Sci. 1979, 88, B145–B153. [Google Scholar]
- Parnell, J.; Eakin, P. The replacement of sandstones by uraniferous hydrocarbons: Significance for petroleum migration. Mineral. Mag. 1987, 51, 505–515. [Google Scholar] [CrossRef]
- Salas, J.; Bitzer, K.; Ayora, C. Origin and genesis of the Oklo uranium ore deposits (Gabon): Results from a basin scale fluid flow modelling. J. Geochem. Explor. 2000, 69–70, 165–171. [Google Scholar] [CrossRef]
- Jaireth, S.; McKay, A.; Lambert, I. Association of large sandstone uranium deposits with hydrocarbons. AUSGEO News 2008, 89, 1–6. [Google Scholar]
- Saintilan, N.J.; Spangenberg, J.E.; Chiaradia, M.; Chelle-Michou, C.; Stephens, M.B.; Fontboté, L. Petroleum as source and carrier of metals in epigenetic sediment-hosted mineralization. Sci. Rep. 2019, 9, 8283. [Google Scholar] [CrossRef]
- Parnell, J. Diagenesis and fluid flow in response to uplift and exhumation. Geol. Soc. Lond. Spec. Publ. 2002, 196, 433–446. [Google Scholar] [CrossRef]
- Warren, J.K. Evaporites, brines and base metals: Low-temperature ore emplacement controlled by evaporite diagenesis. Aust. J. Earth Sci. 2000, 47, 179–208. [Google Scholar] [CrossRef]
- Parnell, J.; Wang, X.; Raab, A.; Feldmann, J.; Brolly, C.; Michie, R.; Armstrong, J. Metal flux from dissolution of iron oxide grain coatings in sandstones. Geofluids 2021, 2021, 5513490. [Google Scholar] [CrossRef]
- Armstrong, J.G.T.; Parnell, J.; Boyce, A.J. Carbon in Mineralised Plutons. Geosciences 2022, 12, 202. [Google Scholar] [CrossRef]
- Miles, A.J.; Woodcock, N.H.; Hawkesworth, C.J. Tectonic controls on post-subduction granite genesis and emplacement: The late Caledonian suite of Britain and Ireland. Gondwana Res. 2016, 39, 250–260. [Google Scholar] [CrossRef]
- Gillespie, M.R.; Crane, E.J.; Barron, H.F. Deep Geothermal Energy Potential in Scotland. In British Geological Survey Commissioned Report; British Geological Survey: Keyworth, UK, 2013. [Google Scholar]
- Ashfaq, A.; Clochard, M.C.; Coqueret, X.; Dispenza, C.; Driscoll, M.S.; Ulański, P.; Al-Sheikhly, M. Polymerization reactions and modifications of polymers by ionizing radiation. Polymers 2020, 12, 2877. [Google Scholar] [CrossRef]
- Parnell, J.; Rahman, M. Source-rock evaluation of Devonian lacustrine carbonates, northern Scotland. AAPG Bull. 1990, 74, 345–351. [Google Scholar]
- Goldstein, R.H.; Reynolds, T.J. Systematics of fluid inclusions in diagenetic minerals. In SEPM Short Course No. 31; SEPM: Tulsa, OK, USA, 1994; p. 199. [Google Scholar]
- Bjørkum, P.A.; Nadeau, P.H. Temperature controlled porosity/permeability reduction, fluid migration, and petroleum exploration in sedimentary basins. APPEA J. 1998, 38, 453–464. [Google Scholar] [CrossRef]
- Hillier, S.; Marshall, J.E.A. Organic maturation, thermal history and hydrocarbon generation in the Orcadian Basin, Scotland. J. Geol. Soc. 1992, 149, 491–502. [Google Scholar] [CrossRef]
- Hippler, S.J. Deformation microstructures and diagenesis in sandstone adjacent to an extensional fault: Implications for the flow and entrapment of hydrocarbons. AAPG Bull. 1993, 77, 625–637. [Google Scholar]
- Baba, M.; Parnell, J.; Muirhead, D.; Bowden, S. Oil charge and biodegradation history in an exhumed fractured reservoir, Devonian, UK. Mar. Pet. Geol. 2019, 101, 281–289. [Google Scholar] [CrossRef]


| Locality | Age | Host Rock | Key Minerals | Temp. (°C) | References |
|---|---|---|---|---|---|
| Asarel, Bulgaria | Cretaceous | Porphyry | florencite, chalcopyrite | >394 | [21] |
| Chelopech, Bulgaria | Cretaceous | Metavolcanics | florencite, tennantite-chalcopyrite | 200–300 | [22] |
| Shituru, D. R. Congo | Neoproterozoic | Metasediment | florencite, chalcopyrite | ~430 | [23] |
| Singhbhum copper belt, India | Proterozoic | Metasediment | florencite, chalcopyrite | ~490 | [24] |
| Olympic Dam-Oak Dam, Australia | Proterozoic | Brecciated granite and metasediments | florencite, chalcopyrite-bornite | 150–400 | [25,26] |
| Oyu Tolgoi, Mongolia | Devonian | Porphyry | florencite, bornite | >260 | [27] |
| Summitville, Colorado, USA | Miocene | Epithermal/volcanics | Svanbergite, covellite-chalcopyrite | ~250 | [28] |
| La Granja, Peru | Miocene | Porphyry | woodhouseite, chalcopyrite | 260–350 | [28] |
| Safyanovskoe, Urals, Russia | Devonian-Carboniferous | Altered volcanics | goyazite, chalcopyrite | <250 | [29] |
| Melitena, Greece | Eocene-Miocene | Epithermal/porphyry | woodhouseite-svanbergite, chalcopyrite | ~300 | [30] |
| Athabasca, Canada | Palaeoproterozoic | Unconformity uranium deposit | florencite, chalcopyrite | 230–240 | [17] |
| Florencite | Goyazite | |||||||||
|---|---|---|---|---|---|---|---|---|---|---|
| Oxide (wt.%) | 1 | 2 | 3 | 4 | 5 | 6 | 7 | 8 | 9 | 10 |
| Na2O | bdl | 0.38 | bdl | bdl | bdl | bdl | bdl | bdl | bdl | bdl |
| FO | bdl | 0.38 | bdl | bdl | bdl | bdl | bdl | 2.57 | bdl | 1.93 |
| Al2O3 | 30.83 | 29.9 | 34.92 | 33.74 | 30.83 | 34.92 | 31.89 | 35.42 | 31.88 | 34.54 |
| SiO2 | 9.53 | 20.59 | bdl | bdl | 9.53 | bdl | 8.21 | bdl | 3.55 | bdl |
| P2O5 | 19.12 | 19.61 | 23.72 | 25.02 | 19.12 | 23.72 | 20.16 | 30.27 | 25.19 | 25.03 |
| SO3 | 4 | 4.53 | 4.83 | 4.05 | 4 | 4.83 | 4.11 | 2.62 | 5.6 | 5.93 |
| K2O | 0.63 | bdl | bdl | bdl | 0.63 | bdl | 0.49 | bdl | 0.24 | bdl |
| CaO | 1.68 | 1.54 | 1.02 | 0.19 | 1.68 | 1.02 | 1.61 | 0.28 | 0.45 | 0.41 |
| SrO | 11.65 | 12.57 | 15.54 | 16.06 | 11.65 | 15.54 | 11.37 | 21.96 | 20.66 | 21.09 |
| La2O3 | 3.35 | 2.53 | 3.41 | 2.48 | 3.35 | 3.41 | 3.35 | bdl | bdl | bdl |
| Ce2O3 | 5.14 | 4.24 | 5.47 | 4.74 | 5.14 | 5.47 | 5.6 | bdl | 0.38 | bdl |
| Pr2O3 | bdl | 0.57 | bdl | bdl | bdl | bdl | bdl | bdl | bdl | bdl |
| Nd2O3 | 1.01 | 0.73 | 1.06 | 1.09 | 1.01 | 1.06 | 0.9 | bdl | bdl | bdl |
| ThO2 | bdl | bdl | 0.67 | bdl | bdl | 0.67 | 0.63 | bdl | bdl | Bdl |
| Total (LREE)2O3 | 9.5 | 8.07 | 9.94 | 8.31 | 9.5 | 9.94 | 9.85 | bdl | 0.38 | bdl |
| Sum | 86.94 | 97.57 | 90.64 | 87.37 | 86.94 | 90.64 | 88.32 | 93.12 | 87.95 | 88.93 |
| Population | 1 | 2 |
|---|---|---|
| Composition | Aqueous | Hydrocarbon |
| No. analysed | 15 | 13 |
| Size (µm) | 4–8 | 5–15 |
| Degree of fill | 0.93 to 0.96 | 0.85 to 0.90 |
| Homogenisation temp. (°C) | 119.7 to 138.4 | 122.0 to 136.4 |
| Freezing temp. (°C) | −6.1 to −4.1 | - |
| Salinity (wt.% equiv. NaCl) | 7.6 to 9.3 | - |
| Fluorescence | None | Yellow |
| Measurement | Temperature (°C) | Average T (°C) | std T (°C) |
|---|---|---|---|
| 1 | 174 | 195.5 | 18.52582 |
| 2 | 199 | ||
| 3 | 216 | ||
| 4 | 164 | ||
| 5 | 223 | ||
| 6 | 209 | ||
| 7 | 187 | ||
| 8 | 167 | ||
| 9 | 211 | ||
| 10 | 205 | ||
| 11 | 203 | ||
| 12 | 194 | ||
| 13 | 204 | ||
| 14 | 168 | ||
| 15 | 194 | ||
| 16 | 177 | ||
| 17 | 215 | ||
| 18 | 209 |
| Locality | Host Rock Age | Cu (%) | Mineralisation Max T (°C) | Hydrocarbon Emplacement T (°C) | S-Isotopes (δ34S) | Mineralisation Paragenesis |
|---|---|---|---|---|---|---|
| Yesnaby, Orkney (This study) | Devonian Sandstone | >1% | 190 °C | 120–140 °C | +10.6‰ (py) | Hm → HC + Bar + Py → Cu + Zn |
| Paradox Basin, Colorado [12,51,52] | Permian to Cretaceous Sandstones | ~4% | >120 °C | 105–110 °C | −26.4 to +2.6‰ (py & ccp) | Hm → HC + Py → Cu ± U |
| Neuquen Basin, Argentina [11,53,54] | Jurassic to Cretaceous Sandstones | 0.3–1.86% | 170 °C | 100–185 °C | −60.2 to +18.2‰ (Cu & Fe-sulphides) | Hm → HC + Py + Cal → Cu (V-U) + Pb + Zn + Cal |
| Manto-type deposits, Chile [8,9,55] | Jurassic to Cretaceous Volcanics & Sandstones | ~1.5% | 180 °C | 134 °C | −50.4 to −0.6‰ (sulphides) | HC + Py + Cal → Cu (+Ag) |
| Chu-Sarysu Basin, Kazakhstan [10] | Upper Carboniferous Sandstones | 0.85–1.7% | 93 °C | 150 °C | −20.1 to −4.7‰ (sulphides) | Hm → HC ± Py → Cu + Pb + Zn |
| White Pine Region, Michigan [7,56,57] | Mid- Proterozoic Sandstones and Shales | 2.33–4.93% | 70–100 °C | 115–190 °C | −15.8 to +31.2‰ (sulphides) | HC → Cu + Cal (Py → Cu) |
| Relationship between Oil Residue and Mineralisation | Relative Timing of Mineralisation of Ore and Oil | Environment of Mineralisation | Reference |
|---|---|---|---|
| Reducing template on oil residue | Post-oil | Any | [53] |
| Evaporite sequences source oil and sulphides | Any | Any | [69] |
| Rift basin mixed volcanic copper and lacustrine oil | Any | Terrestrial | [57] |
| Oil charge strips metallic grain coatings | Post-oil | Terrestrial | [70] |
| Metal transport in low-pH organic fluids | Any | Any | [67] |
| Permeability enhanced in uplifted reservoir | Post-oil | Any | [68] |
| Assimilation organics in magmas to precipitate sulphides | Any | Any | [71] |
Disclaimer/Publisher’s Note: The statements, opinions and data contained in all publications are solely those of the individual author(s) and contributor(s) and not of MDPI and/or the editor(s). MDPI and/or the editor(s) disclaim responsibility for any injury to people or property resulting from any ideas, methods, instructions or products referred to in the content. |
© 2023 by the authors. Licensee MDPI, Basel, Switzerland. This article is an open access article distributed under the terms and conditions of the Creative Commons Attribution (CC BY) license (https://creativecommons.org/licenses/by/4.0/).
Share and Cite
Heptinstall, E.A.; Parnell, J.; Armstrong, J.G.T.; Schito, A.; Akinsanpe, T.O. Copper, Uranium and REE Mineralisation in an Exhumed Oil Reservoir, Southwest Orkney, Scotland. Geosciences 2023, 13, 151. https://doi.org/10.3390/geosciences13050151
Heptinstall EA, Parnell J, Armstrong JGT, Schito A, Akinsanpe TO. Copper, Uranium and REE Mineralisation in an Exhumed Oil Reservoir, Southwest Orkney, Scotland. Geosciences. 2023; 13(5):151. https://doi.org/10.3390/geosciences13050151
Chicago/Turabian StyleHeptinstall, Eleanor A., John Parnell, Joseph G. T. Armstrong, Andrea Schito, and Temitope O. Akinsanpe. 2023. "Copper, Uranium and REE Mineralisation in an Exhumed Oil Reservoir, Southwest Orkney, Scotland" Geosciences 13, no. 5: 151. https://doi.org/10.3390/geosciences13050151