1. Introduction
During the past few decades, synthetic aperture radar interferometry (InSAR) has been effectively applied for the study of natural phenomena such as landslides [
1,
2,
3,
4], subsidence [
5,
6,
7], volcanic activity [
8,
9,
10,
11] or earthquakes [
12,
13]. Advanced interferometric techniques (e.g., Small Baseline Subset (SBAS) [
14], Persistent Scatterers [
15]) exploiting long stacks of synthetic aperture radar (SAR) data have also proven to be useful tools for studying buildings and infrastructures affected by thermal effects [
16] or land subsidence [
17,
18], evaluating displacements that could compromise their stability [
19].
Our study area comprises Modena, Reggio Emilia, and Parma municipalities, located in the NW portion of the Emilia-Romagna alluvial plain, which occupied the southern portion of the Po Plain in northern Italy (
Figure 1).
The Emilia-Romagna plain is one of the areas in Italy where the greatest attention is paid to ground movements as it is a highly urbanized and industrialized zone, with important cultural heritages and intensive farming [
19]. Primary ground movements that have been recorded in this area over the years using different techniques (e.g., levelling [
22] and Global Positioning System (GPS) measurements [
23], InSAR analyses [
24,
25,
26]), are mainly directed in an up-down direction, therefore related to subsidence or uplift phenomena. Previous work [
24] correlated the occurrence of uplifts in the plain with the presence of buried tectonic structures considered active or potentially active: the Emilia folds, the Ferrara folds, and the Pede–Apennine thrust front (
Figure 1), as well as the reduction of water withdrawal from the subsoil for various purposes (drinking, industrial and irrigation use). Instead, subsidence phenomena recorded inside the Emilia-Romagna plain over the years have been attributed to both natural and anthropogenic causes, operating on different time scales [
27,
28]. Natural subsidence, acting in millions to thousands of years, is quantified in a few millimetres per year [
23] and could be related to tectonic/sediment loading, sediment compaction, and post-glacial rebound. Instead, anthropogenic subsidence takes place over hundreds to tens of years and is the result of human activities. Anthropogenic subsidence can exceed natural subsidence rates by more than one order of magnitude [
27]. The main cause of this type of movement has been attributed to groundwater extraction [
23,
28], but also hydrocarbons extraction [
24,
29], underground excavation for mining activities, construction of underground facilities, and carbonate rock solution can significantly create soil subsidence [
30].
In this contribution, we show ground displacement maps over the NW part of the Emilia-Romagna plain obtained using the SBAS multi-temporal InSAR method over a long-time-interval, from June 2012 to February 2022. The period was specifically chosen after the infamous earthquake occurred at the end of May 2012 [
31,
32] and before the recent shocks of Ml 4.0 and Ml 4.3 happened on 9 February 2022 (
Figure 1), in order to exclude the coseismic deformation signal from the long time series. It was thus possible to correctly study the displacements that occurred in the area during the last decade, focusing on the subsiding movements identified both in the results obtained with Cosmo-SkyMed and Sentinel-1 data, at many industrial areas and along a portion of the high-speed railway on the Milano–Bologna line as well (
Figure 1).
In the past, alongside the nearest section of the Milano—Bologna regional railway, running parallel and located about 1.5 km south of the high-speed line, railway embankment segments affected by instability phenomena were already identified. These phenomena were characterized by deformations and lowering of the ballast, causing dangerous level defects in the tracks [
33].
Therefore, the evaluation of displacements, which have been measured in this work through InSAR methods, is considered interesting and useful for the purposes of future in-depth assessment by the railway network managers on possible actions to be undertaken, given the great importance that the stability of the infrastructures has in guaranteeing people safety.
2. Study Area
The Po Plain is the biggest alluvial plain in Italy [
24] and is bounded by the Alps to the north and by the Apennines to the south [
34]. The floodplain, representing the foreland sedimentary basin system of the two fold-and-thrust belts [
35], covers an area extended about 40.000 km
2, spreading EW for approximately 650 km, from the western Alps to the Adriatic Sea [
30]. The Emilia-Romagna plain, in particular, lies on a series of fold-faulted Apenninic terrains dipping northward in a tectonic regime characterized by NE compression [
36]. The upper part of the stratigraphic succession of the Emilia-Romagna plain is made of recent (Middle Pleistocene–Holocene) alluvial fine and unconsolidated sediments, i.e., sands, silts, and clays, that are dropped off by the Po River and its tributaries [
24]. This sequence, which locally exceeds 500 m of thickness, hosts a complex multi-aquifer freshwater system [
30]. In particular, the subsoil of the investigated area is characterized by the Emiliano-Romagnolo super-synthema [
37,
38]. The latter includes the Lower Emiliano-Romagnolo synthema, with middle Pleistocene age, made by sediments deposited in an alluvial environment (alluvial plain, interfluvial basin, distal alluvial fan). Upward, the previous synthema passes to the Upper Emiliano-Romagnolo synthema, over 100 m thick with Upper Pleistocene–Holocene age [
37,
38]. This upper synthema includes coarse and fine-grained sediments in the upper valley and fine-grained deposits in the middle valley. In the investigated area the Upper Emiliano-Romagnolo is divided into the following (from the bottom) sub-synthemas: (i) Agazzano sub-synthema mainly made by gravelly alluvial fan deposits; (ii) Villa Verucchio sub-synthema consisting of a cyclic succession of gravel, sand, silt, and clay of alluvial environment; (iii) the Ravenna sub-synthema mainly includes silt, clayey silt, and sandy silt.
3. Materials and Methods
In order to detect potential deformation signals, SAR data acquired by the Cosmo-SkyMed (CSK) and Sentinel-1 (S1) satellite missions were collected. CSK images were requested from the Italian Space Agency (ASI) and downloaded from the ASI portal (
https://www.asi.it/en/earth-science/cosmo-skymed/ (accessed on 28 March 2023)). S1 data are freely distributed by the European Space Agency and were collected from the Alaska Satellite Facility catalogue (
https://asf.alaska.edu (accessed on 28 March 2023)).
All the exploited SAR datasets were processed adopting the SBAS advanced InSAR technique [
14] implemented into the SARscape software (5.6 version, sarmap SA). The SBAS technique adopted in this work combines a large amount of SAR differential interferograms formed according to user-defined spatio-temporal constraints, aiming at preserving SAR phase coherence and spatial coverage, and at the same time limiting the bias effects of the interferometric phase [
39]. Detailed information on the SBAS algorithm can also be found in [
40,
41]. This multi-temporal method permits the retrieval of ground displacement maps and deformation time series along the satellite’s Line Of Sight (LOS) over the study area in a very long temporal range, i.e., between 2012 and 2022.
Specifically, two stacks of X-band (wavelength equal to 3.1 cm) CSK data, acquired along both the descending and ascending tracks, were analysed from June 2012 to December 2016. In addition, two datasets of C-band (wavelength equal to 5.6 cm) S1 data, acquired along both acquisition geometries, were analysed during the January 2016–February 2022 temporal span.
Table 1 summarizes the main parameters of the considered dataset: name of the satellite mission, data acquisition mode, number of images used for each processing, number of interferograms evaluated as reliable for the results generation, processing time interval, ground resolution, and angle of incidence at the scene centre.
The CSK images were processed according to the following constraints: (i) maximum orbital separation of 830 m for reducing spatial decorrelation; (ii) maximum temporal distance between the two passes of 180 days to minimize temporal decorrelation. Therefore, 560 descending and 482 ascending interferograms have been generated. In order to improve the signal-to-noise ratio, a multilooking operation was applied equal to 7 and 6 for the range and azimuth direction respectively, to obtain a final ground resolution of 15 m.
Regarding S1 data processing, we found out that the best results, i.e., not affected by phase bias errors (according to [
39]), are obtained considering the minimum and maximum time interval between acquisitions equal to 36 and 180 days. It was considered a maximum orbital separation not exceeding 98 m for the ascending track and 113 m for the descending one. Such settings allowed us to obtain 766 and 777 interferograms for ascending and descending orbits, respectively. To get the 30 metres ground resolution the applied multilooking factors were equal to 7 and 2 for the range and azimuth direction respectively.
The ALOS 30 m DEM was adopted as the reference elevation data in all processing to remove the topographic phase component from the interferograms. Moreover, in order to minimize the interferometric noise the Goldstein method [
42] was used. The Delaunay MCF unwrapping method [
43] was applied and the atmosphere phase contribution was estimated and removed, applying double filtering in space and time, to correctly reconstruct the surface movement at each considered date. Pixels having coherence thresholds lower than 0.25 and 0.35, for the CSK and S1 processing respectively, were ignored during the final result generation.
In order to estimate the interferometric results errors, the precision associated with the ascending and descending displacement maps obtained during both CSK and S1 processing was calculated [
44]. The maximum precision values, which are derived from parameters such as coherence and wavelength, are equal to 1.3 mm/yr and 1.0 mm/yr, respectively for the CSK and S1 LOS results. Considering that the higher the precision value, the lower the measurement precision, these values testify to the high accuracy of the SBAS results.
Finally, the availability of ascending and descending tracks for both CSK and S1 data allowed the calculation also of the horizontal (East–West) and vertical components of the displacement during the common time period [
45].
We validated SBAS results using geodetic measurements [
20] from two Global Navigation Satellite System (GNSS) stations located inside Parma (PARM) and Reggio Emilia (REGG) municipalities (
Figure 1). Due to the different reference systems of the two measuring systems, it was necessary to calculate the measurements difference recorded at the two GNSS stations (e.g., GPS
PARM–GPS
REGG), and, likewise, at about 10 SAR measurement points located next to the two geodetic stations (e.g., SAR
PARM–SAR
REGG). Therefore, the comparison between the vertical components of SAR and GNSS displacement time series was correctly performed.
4. Results and Discussion
Firstly, we show the overall ground displacement maps performed using the SBAS InSAR technique within the Emilia-Romagna plain. Cosmo-SkyMed data allowed the signal recording over an area of about 40 km × 40 km comprising the Parma and Reggio Emilia municipalities and surroundings. Sentinel-1 data, instead, permit us to evaluate displacements also at Modena city centre and its nearby areas. Then, we focused the analysis on four distinct areas, characterized by peculiar displacements in the vertical direction. We computed the combined study between vertical displacement time series and piezometric level measurements. Finally, we focused on a specific Milano–Bologna high-speed railway section and we calculated the vertical consolidation related to the railway embankment load.
4.1. InSAR Displacement Maps
Following the convention, negative LOS velocities indicate ground movements away from the satellite sensor, while positive LOS velocities imply ground movements approaching the satellite sensor. Moreover, vertical displacement maps show negative values if the ground motion is downward, while positive values if surface uplift occurs. Moreover, maps showing displacements in the horizontal direction display negative values if the movement is oriented to the west, while positive values if the movement is oriented towards the east.
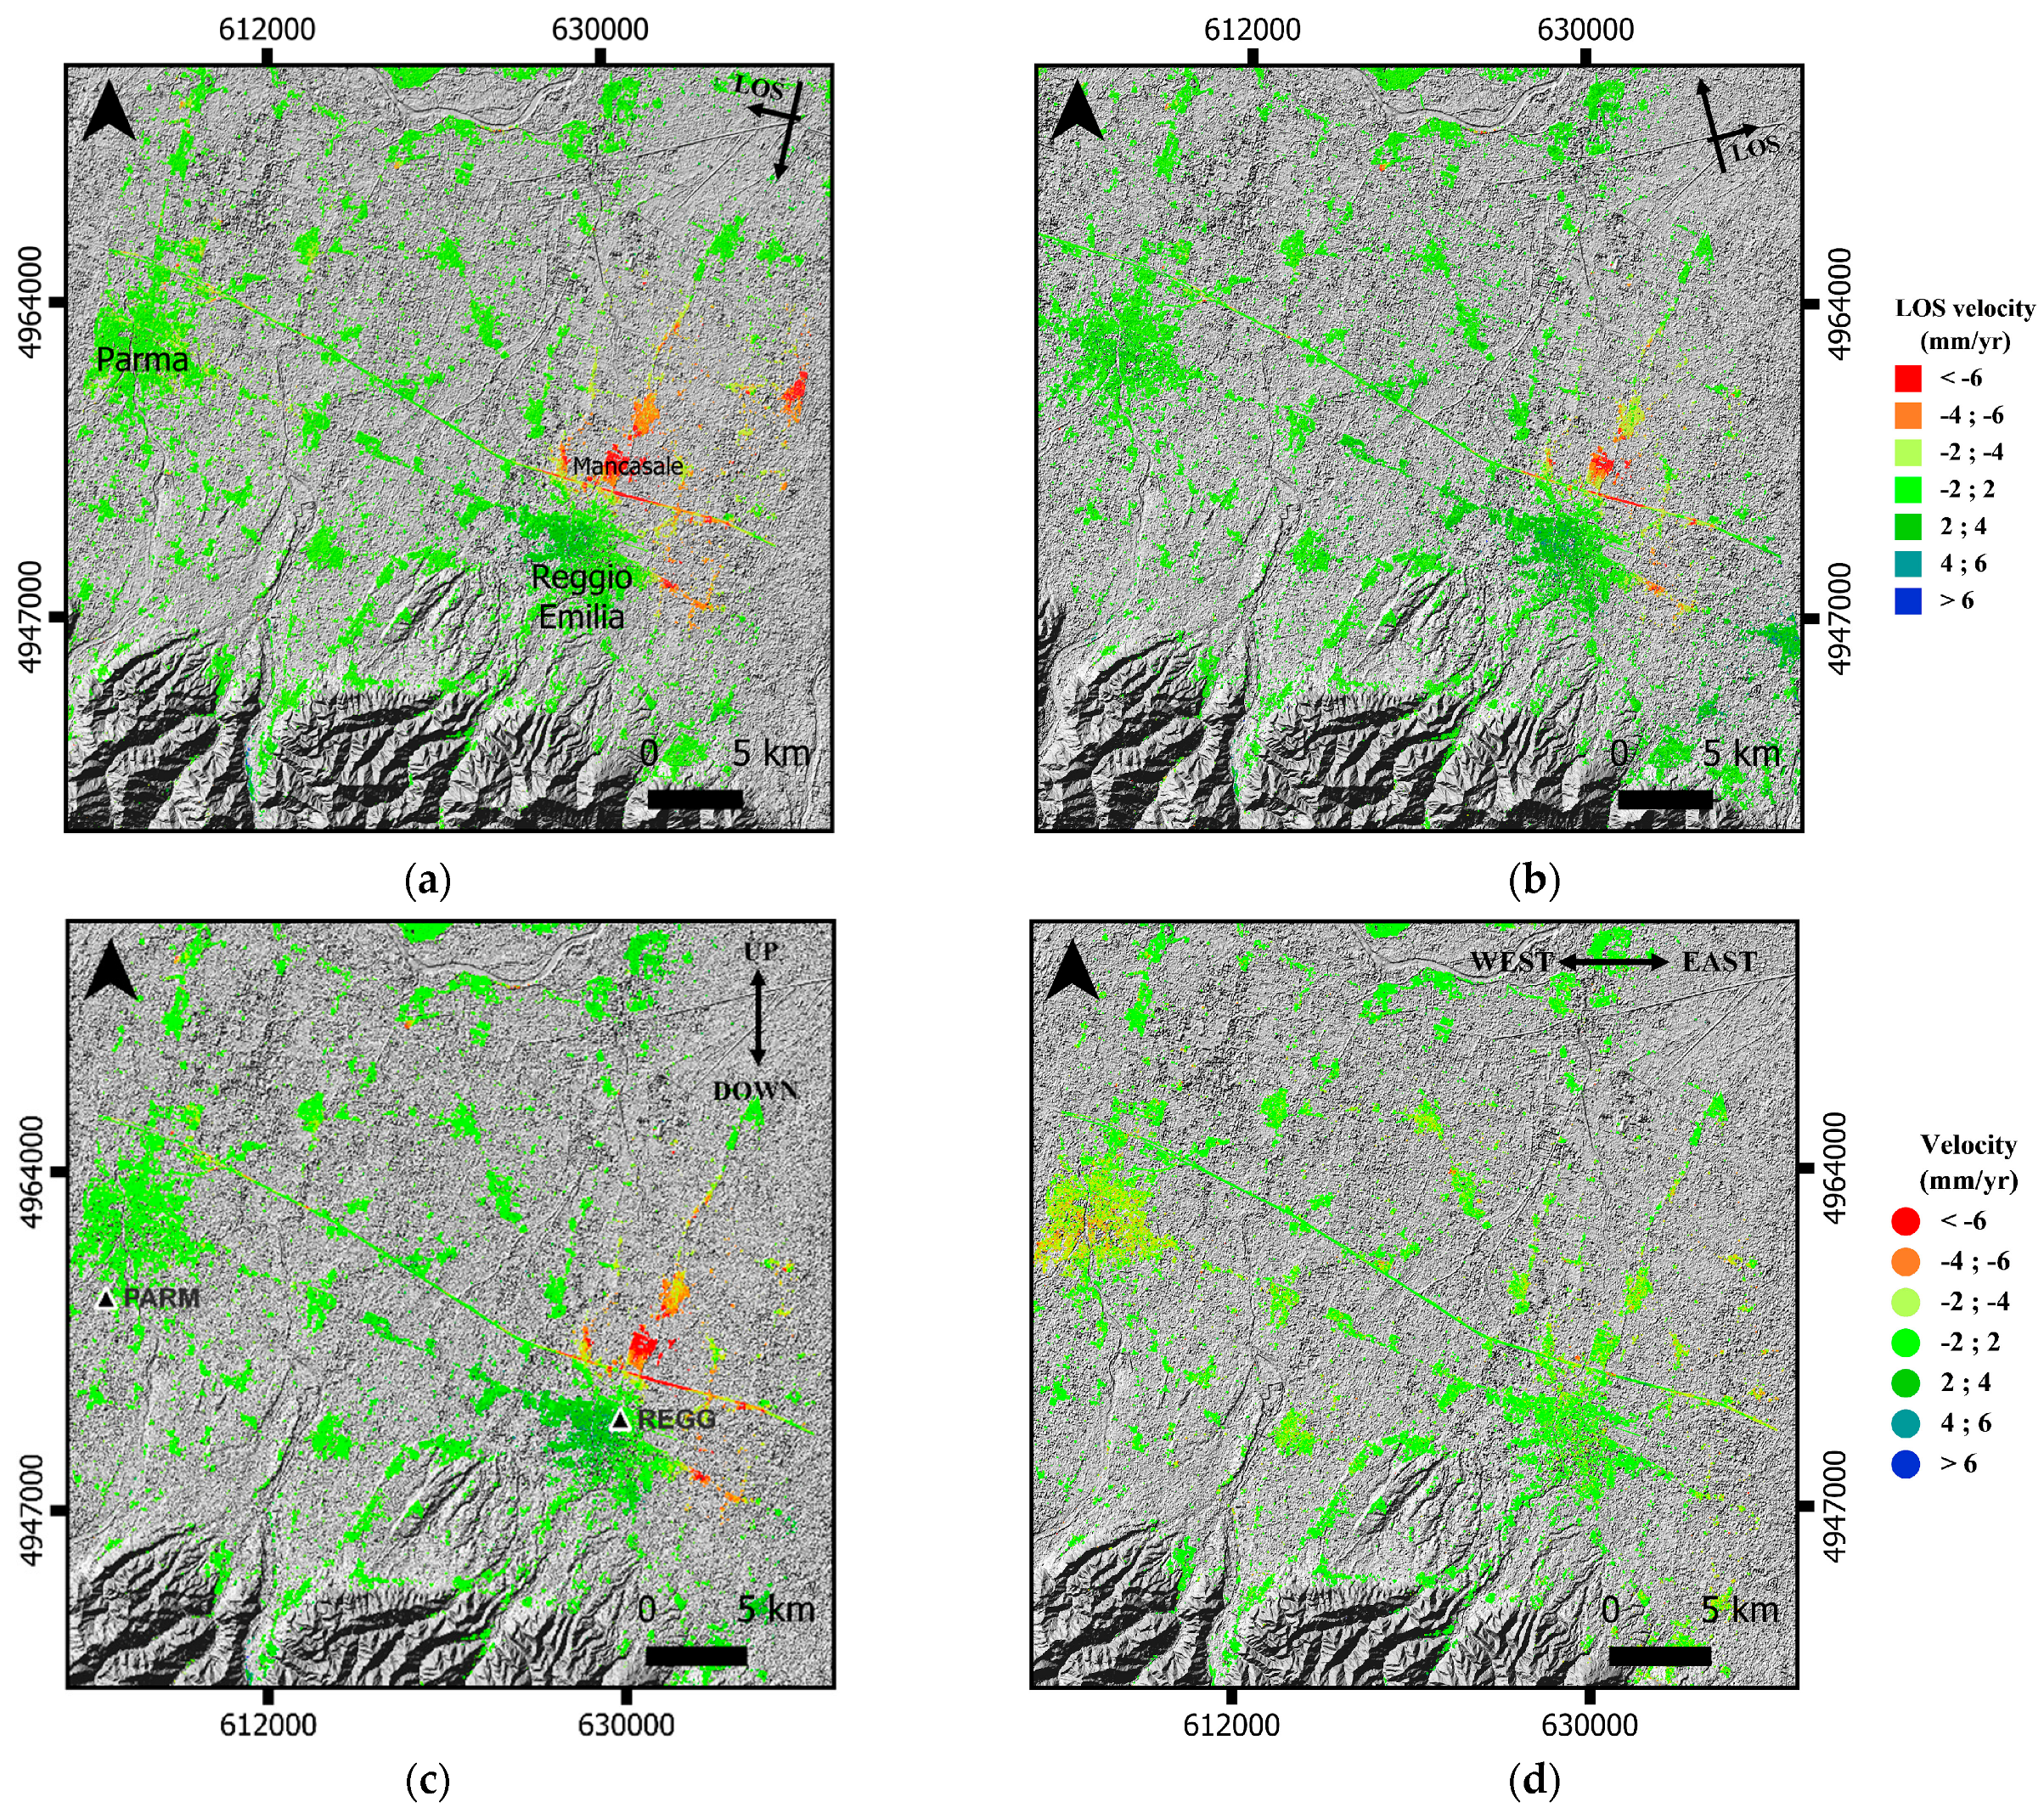
Cosmo-SkyMed displacement maps, computed for the 2012–2016 temporal span, are visible in
Figure 2. Both maps showing displacements measured along descending (
Figure 2a) and ascending (
Figure 2b) LOS highlighted negative average displacement rates in the area north of the Reggio Emilia Municipality and positive values south of its city centre. The negative and positive displacements recorded by both tracks indicate predominantly downward and upward movements, respectively north and south of Reggio Emilia city. This is confirmed by the displacement pattern exhibited by the vertical displacement map (
Figure 2c). The horizontal displacement map (
Figure 2d) does not show particular trends in the EW direction.
Uplift identified in the southern part of Reggio Emilia is well documented also by previous works [
24] and it will be analysed in detail through the displacement time series analysis (
Section 4.3.1). Instead, continuous subsidence movements are identified in the northern and eastern part of the city of Reggio Emilia and are located in correspondence with: (i) highly industrialized areas (e.g., Mancasale industrial area; from 6 to 10 mm/yr) and (ii) a part of the high-speed railway network approximately 2.5 km long near the train station known as Reggio Emilia Mediopadana (from 10 to 15 mm/yr). This last area will be treated specifically inside
Section 4.3.3 and
Section 4.4.
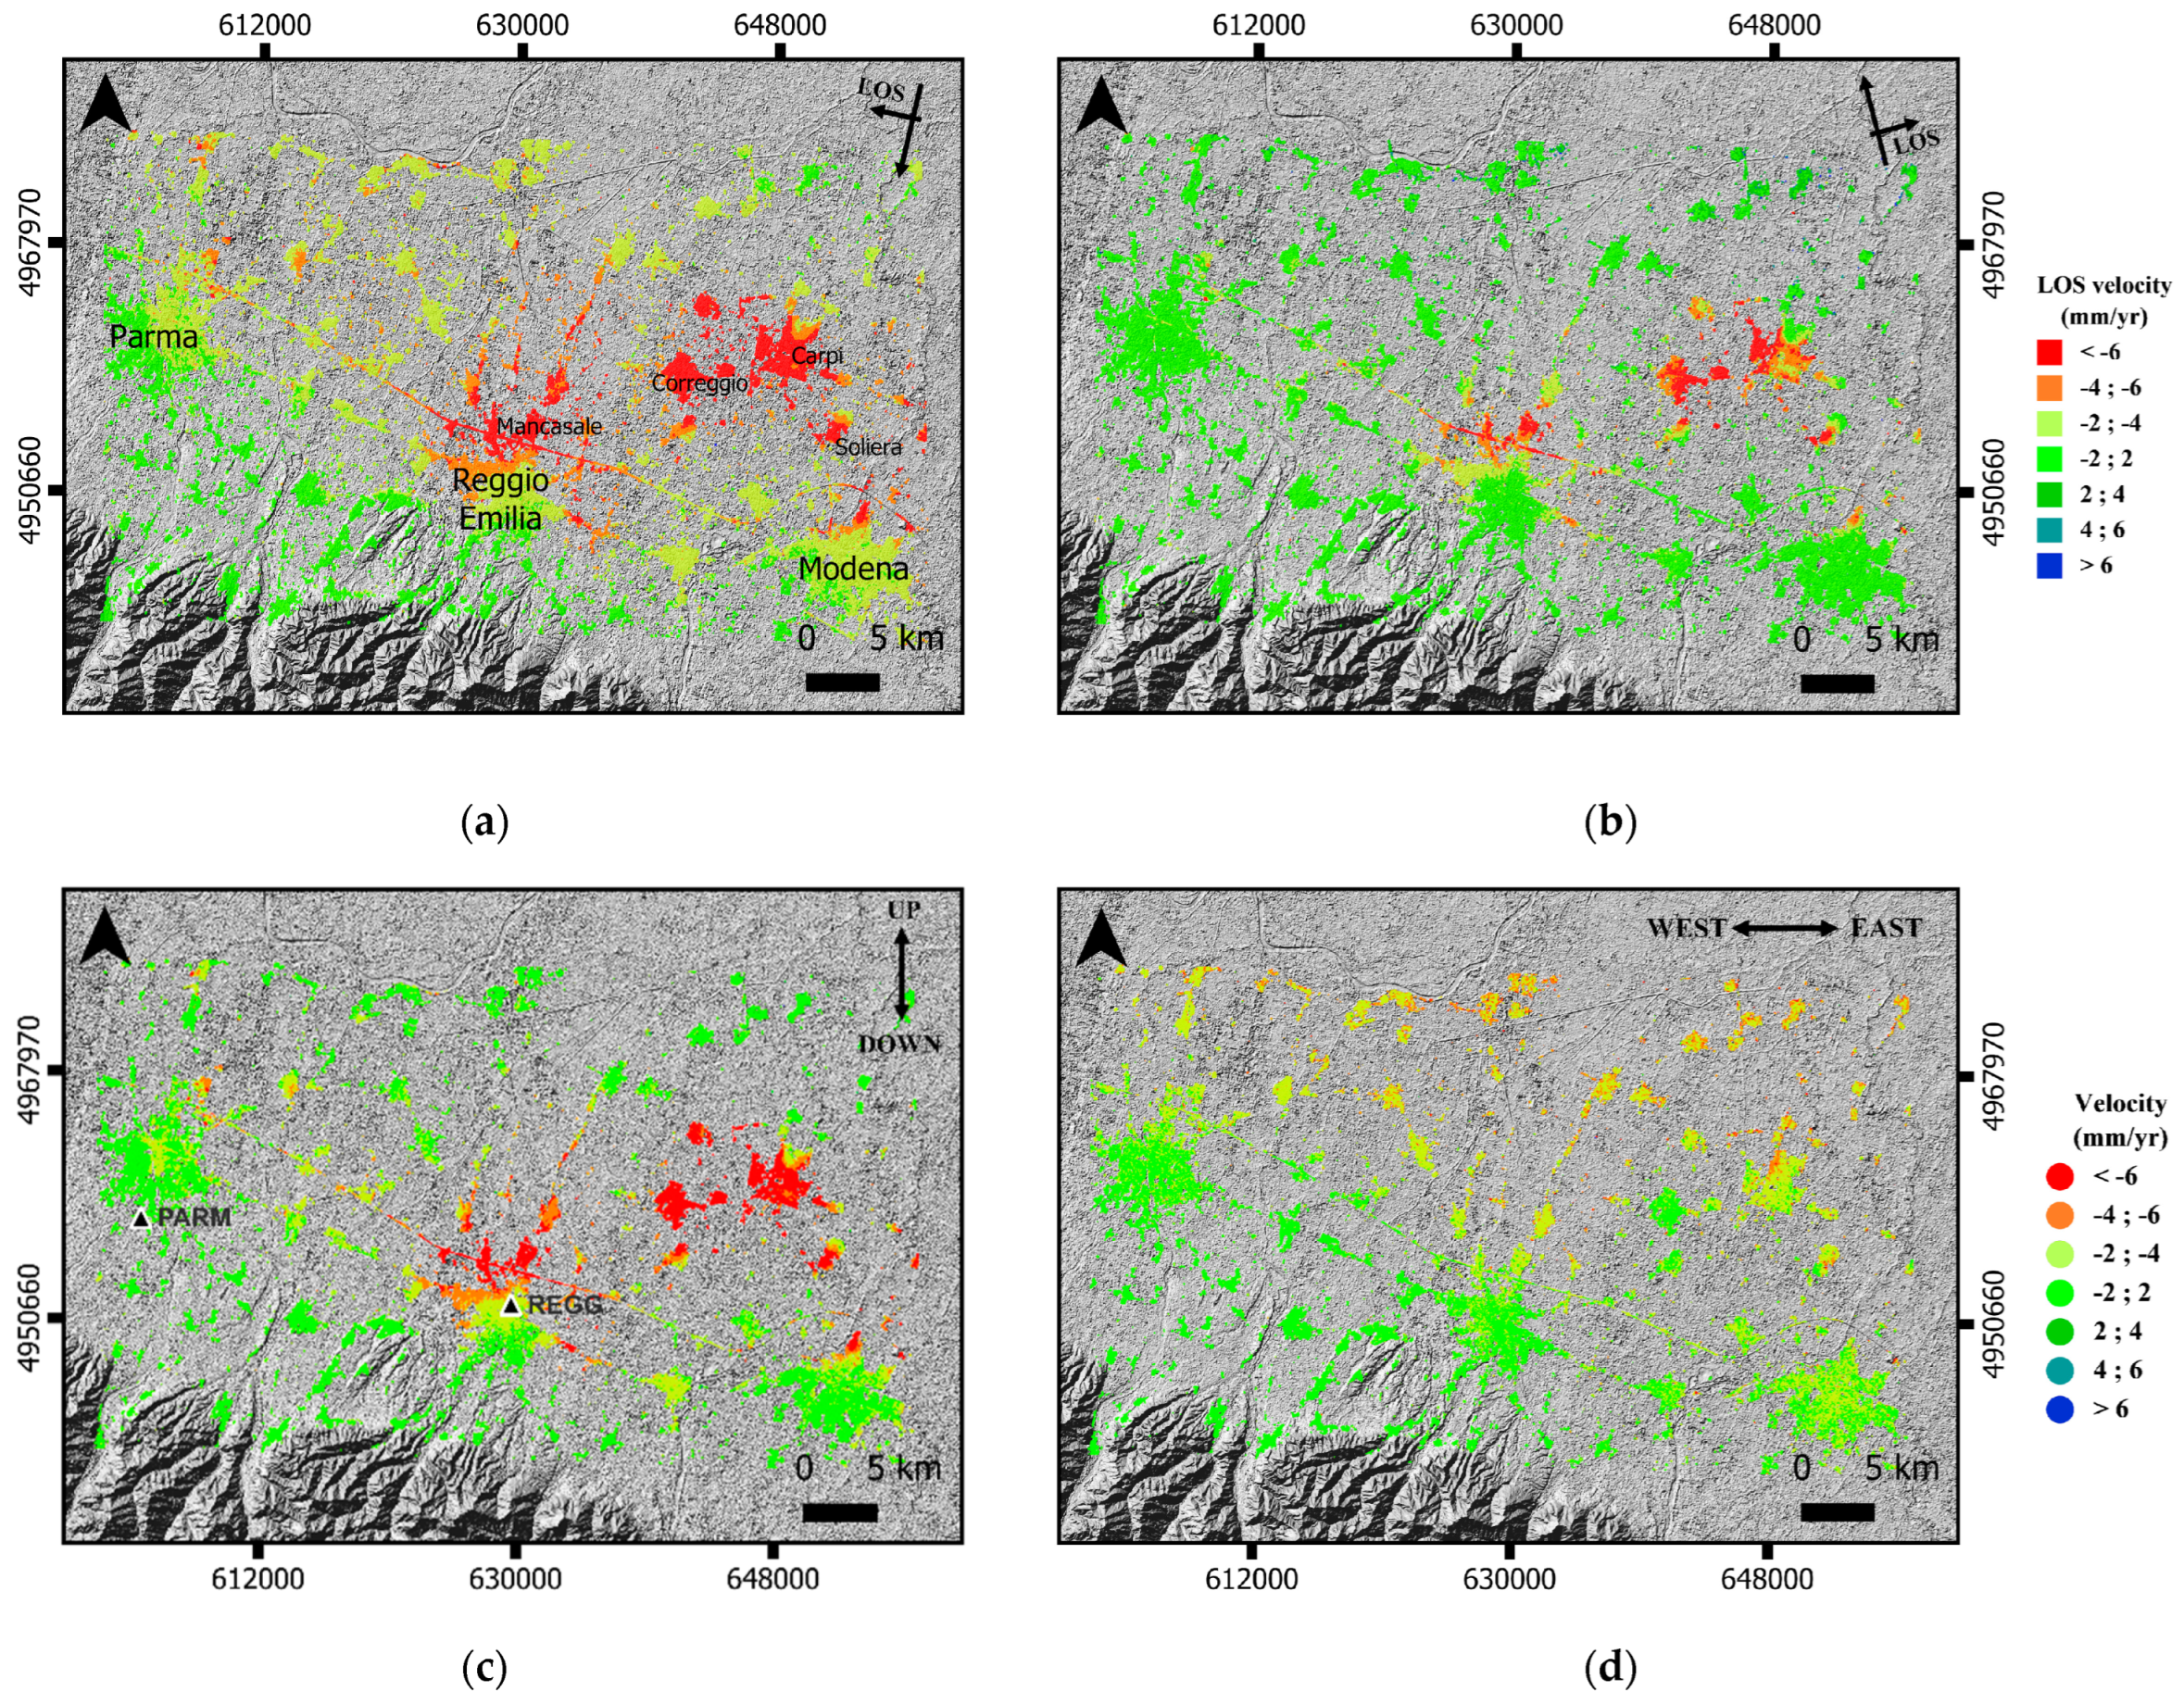
Sentinel-1 displacement maps, retrieved for the 2016–2022 period, are presented in
Figure 3. Descending (
Figure 3a) and ascending (
Figure 3b) displacements maps show negative values mainly north of Reggio Emilia city and in the highly industrialized area located between the municipalities of Reggio Emilia and Modena. These areas are characterized by high subsidence in the vertical displacement map (
Figure 3c). The horizontal displacement map (
Figure 3d) shows slight westward rates (from 2 to 4 mm/yr) throughout the area north of the main regional country seats. This signal is characterized by strong oscillations, probably deriving from atmospheric residuals in the descending results affecting coherent agricultural areas south of the Po River.
It is interesting to note that, unlike the results obtained with Cosmo-SkyMed data, no uplifts in the entire analysed area were recorded. Subsidence is clearly visible in the industrial area north of Reggio Emilia (Mancasale industrial area), in the Correggio district, and in the industrial area east of it, where subsidence rates are in the order of 6 and 15 mm/yr. These values are well comparable with the subsidence rates detected in the same areas until 2016 [
26], suggesting that the subsidence trend in these areas has continued steadily from 2016 until the present. Regarding the province of Modena, high subsidence movements are recorded in correspondence with the industrial area west of Carpi (about 20 mm/yr) and south of the Soliera district (about 10 mm/yr). The values confirm what was identified up to 2016 [
26], i.e., the continuous reduction of subsidence within the aforementioned areas. Finally, subsidence values greater than 10 mm/yr were recorded along a ~10 km long portion of high-speed railway located north of the town of Reggio Emilia, where also the Cosmo-SkyMed outcomes showed the same displacement rates. Spatially, the displacement evolution over time in this area can be observed in
Video S1.
4.2. InSAR Results Validation
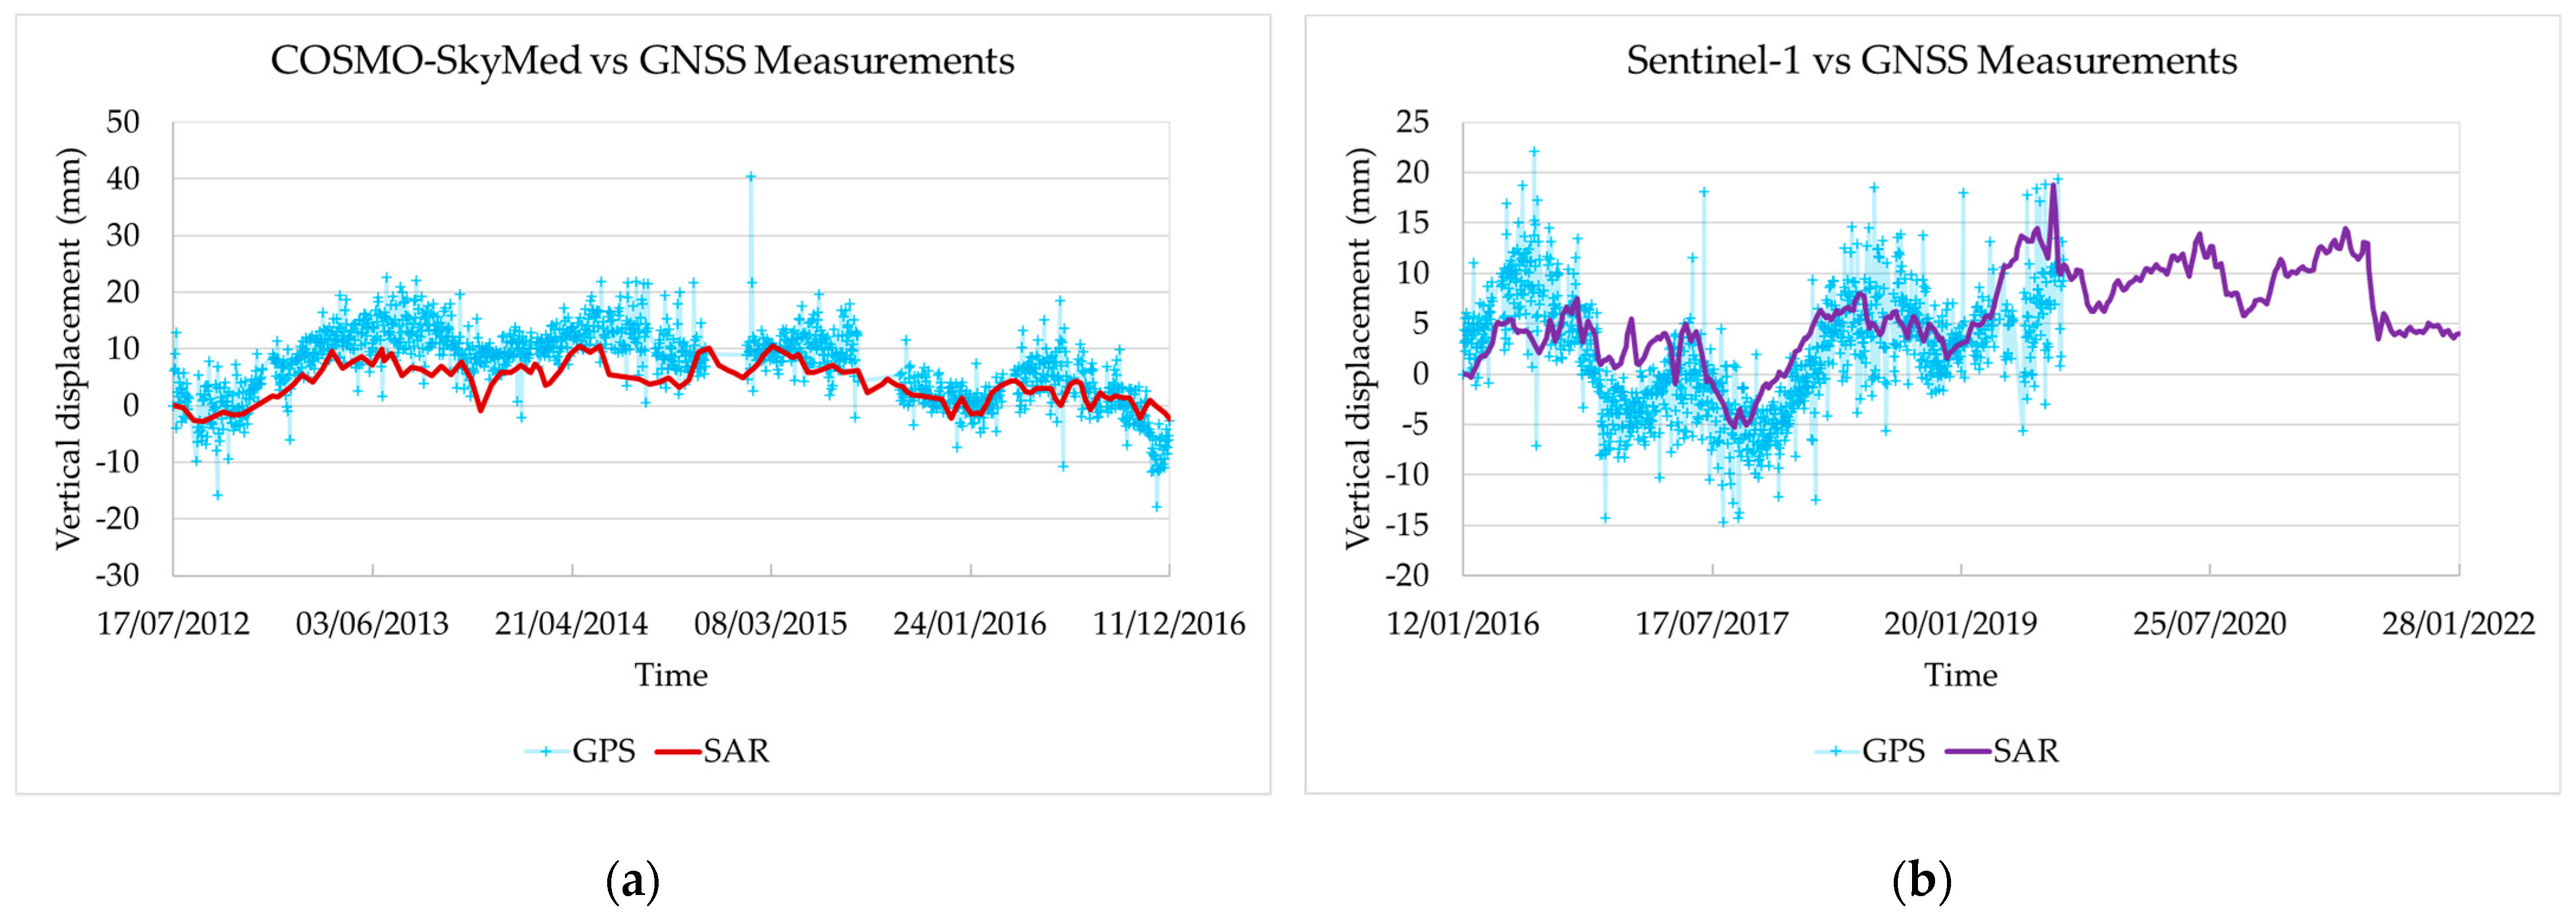
Figure 4a shows the graph that compares the vertical displacement time series obtained by processing CSK data (red line) and those obtained from the analysis of GNSS measurements (light blue crosses). Likewise,
Figure 4b reveals the comparison between the Sentinel-1 vertical displacements time series (purple line) and those obtained from the GNSS processing (light blue crosses). Note that the comparisons shown in
Figure 4 represent the differences between GPS measurements acquired at the PARM and REGG stations and, similarly, between SAR measurements at the two previously mentioned stations. Therefore, the behaviours obtained from the analysis do not depict a real phenomenon but permit us to appreciate that trends are very similar, testifying to the high accuracy of the InSAR results. The errors associated with SAR and GNSS measurements are estimated through the standard deviation (Σ) of satellite and ground measurements, respectively. Regarding CSK and GNSS data comparison, Σ is equal to 3.4 and 6.3 mm/yr, correspondingly. Instead, S1 and GNSS measurements comparisons have respectively an error of 4.4 and 5.7 mm/yr.
4.3. InSAR Displacement Time Series and Piezometric Level Analysis
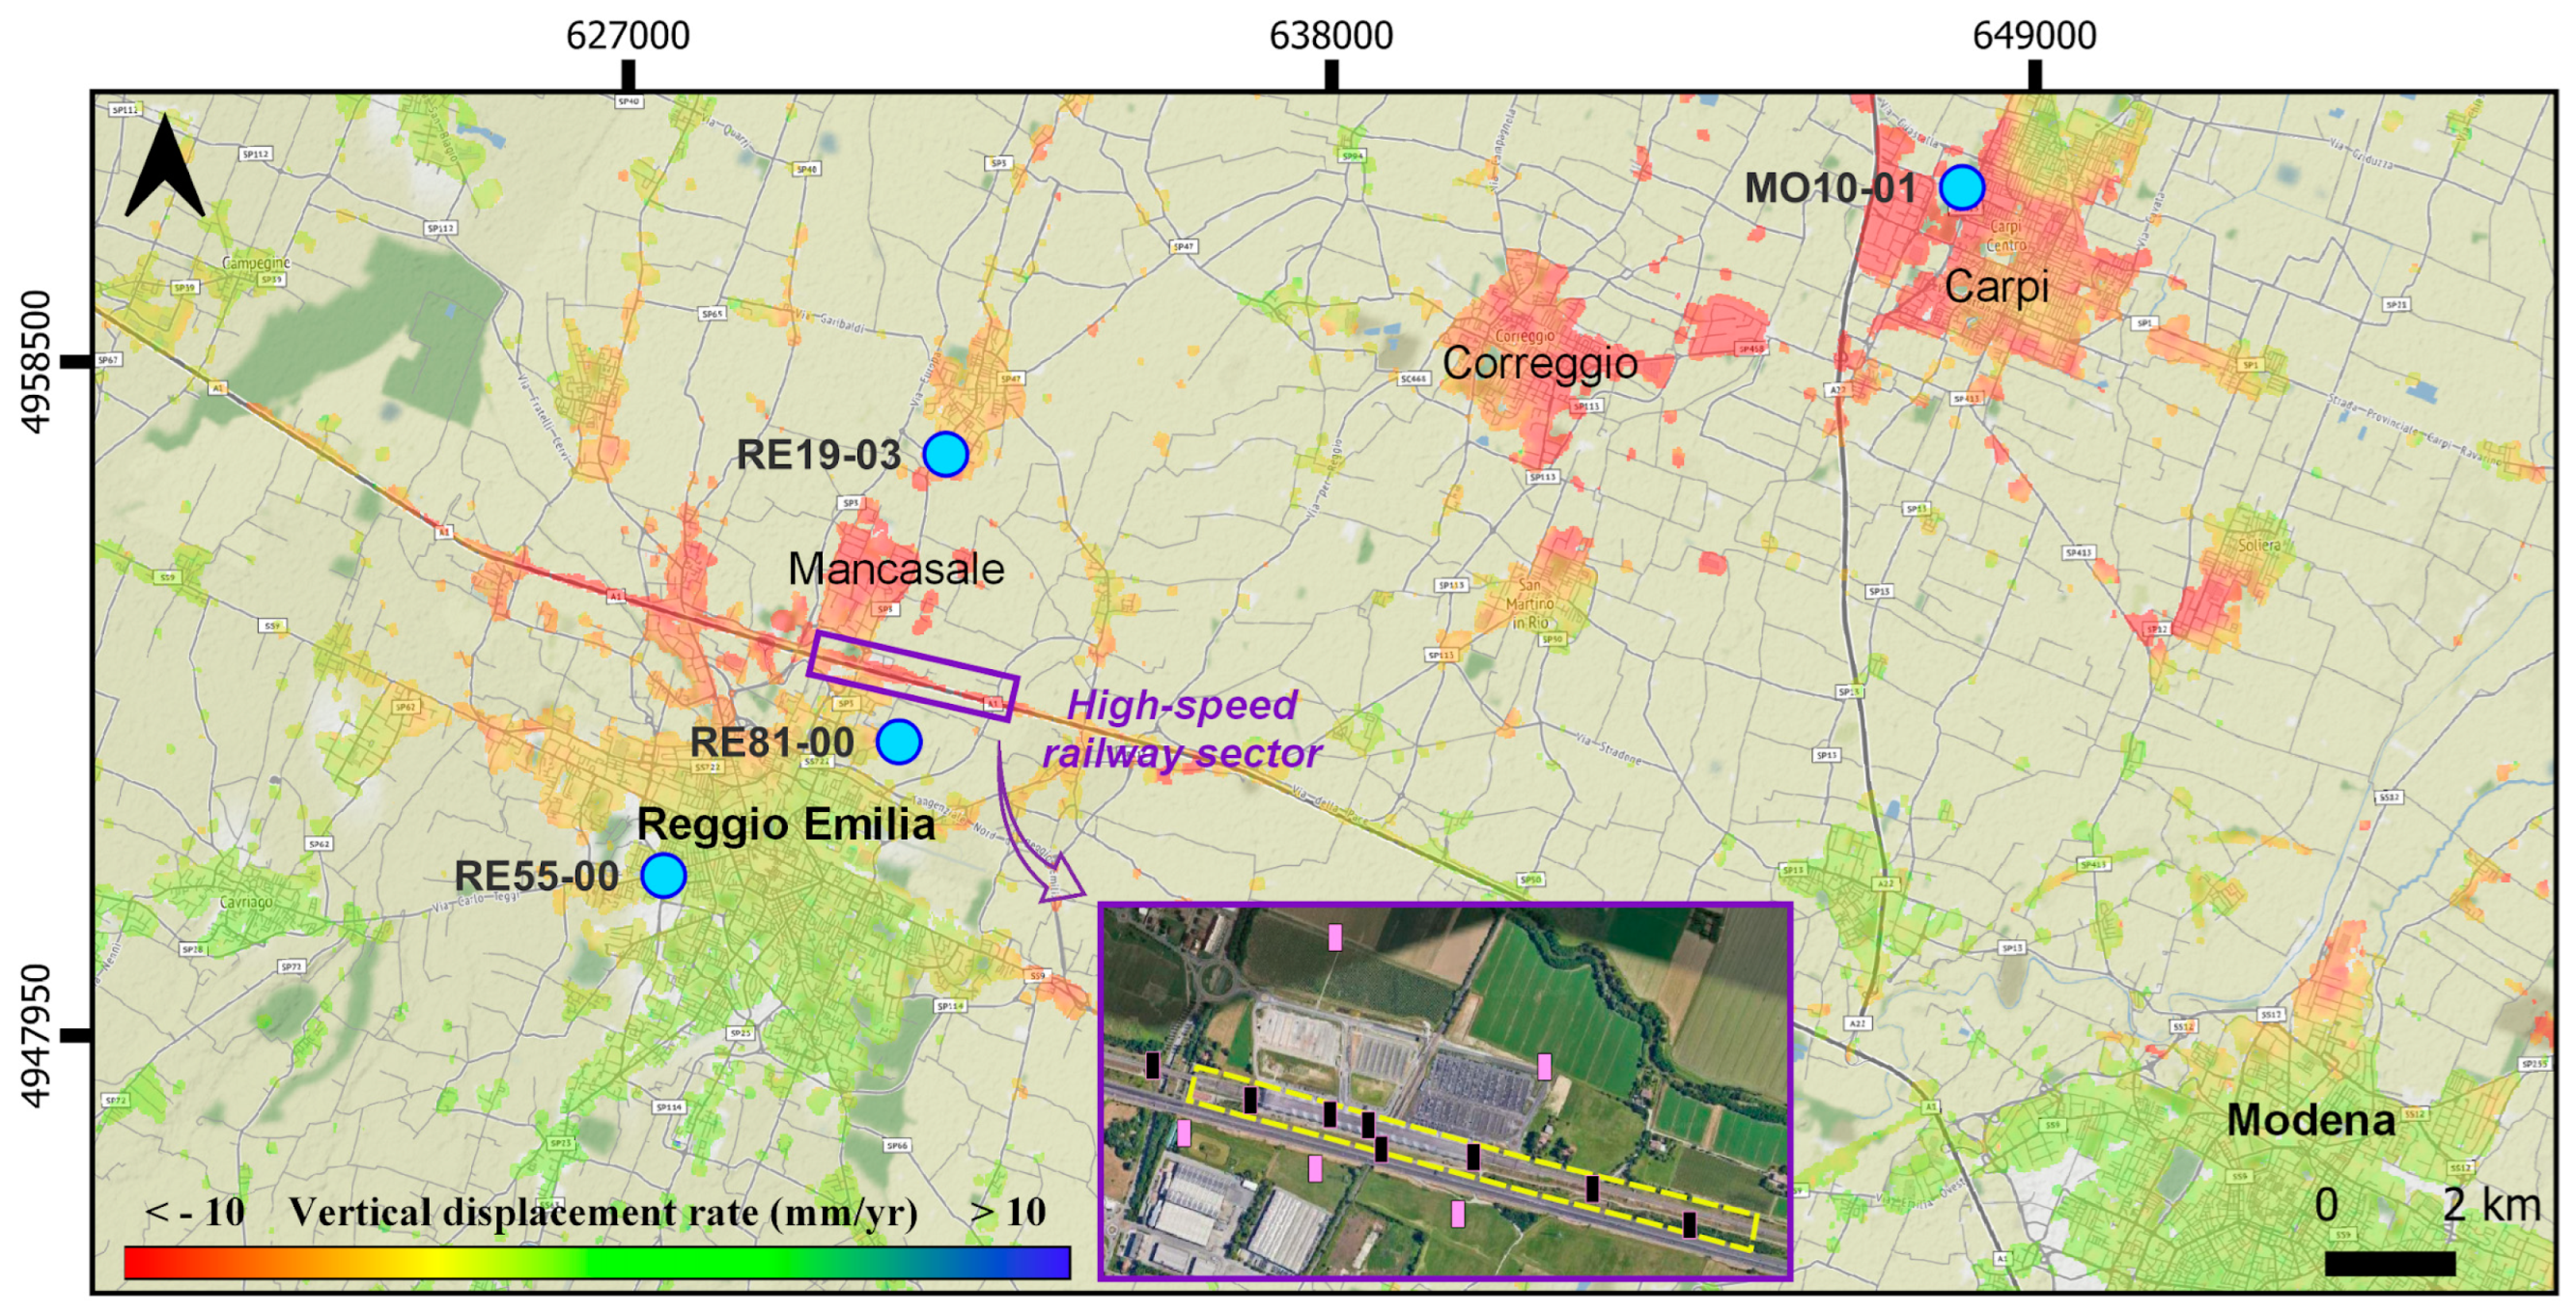
For those areas affected by specific deformations for the vertical direction, i.e., (i) the southern part of the city centre of Reggio Emilia, (ii) the industrial areas of Mancasale (north Reggio Emilia) and Carpi (northwest Modena) and (iii) the section of the Milano–Bologna high-speed railway (
Figure 5), it was considered important to deepen the study by generating the vertical displacement time series (DTS). DTS permitted to follow the evolution of the vertical displacements over time within the aforementioned areas, integrating also piezometric measurements from ARPAE (
https://dati.arpae.it (accessed on 28 March 2023)). For the sake of completeness, we compared the deformation rates detected in our elaborations with those published within the European Ground Motion Service (EGMS) (
https://land.copernicus.eu/pan-european/european-ground-motion-service (accessed on 28 March 2023)) at the aforementioned areas. Overall, we can state that average vertical velocities recorded by EGMS and retrieved by our results are comparable. The only difference is the less oscillatory behaviour of EGMS results which could be due to processing strategies different from those used by us. In particular, we think that different filtering approaches could strongly influence those oscillations. The use of slight signal filtering, as performed in our case, allows a more detailed analysis with external data (e.g., piezometric level).
4.3.1. Southern Reggio Emilia City
At the south-western portion of the centre of Reggio Emilia Municipality, where the CSK results showed uplift (
Figure 2c) and the Sentinel-1 outcomes recorded subsidence (
Figure 3c), the displacement time series were generated by averaging all the points falling within a 100-metre neighbourhood of the RE 55-00 piezometric station (
Figure 5).
CSK vertical DTS visible in
Figure 6 shows that the uplift reaches about 2 cm from the beginning of the considered time period (July 2012) up to mid-2015, then, gradual subsidence starts. This suggests that according to movements recorded NW of Bologna city by other authors [
24], uplifts observed south of the Reggio Emilia Municipality are man-induced and not driven by tectonics. Here the behaviour of the uplift is intermittent and reflects the recovery of piezometric levels (blue line in
Figure 6) due to a decrease in groundwater withdrawals. Sentinel-1 vertical displacement time series visible in the same graph (red diamonds in
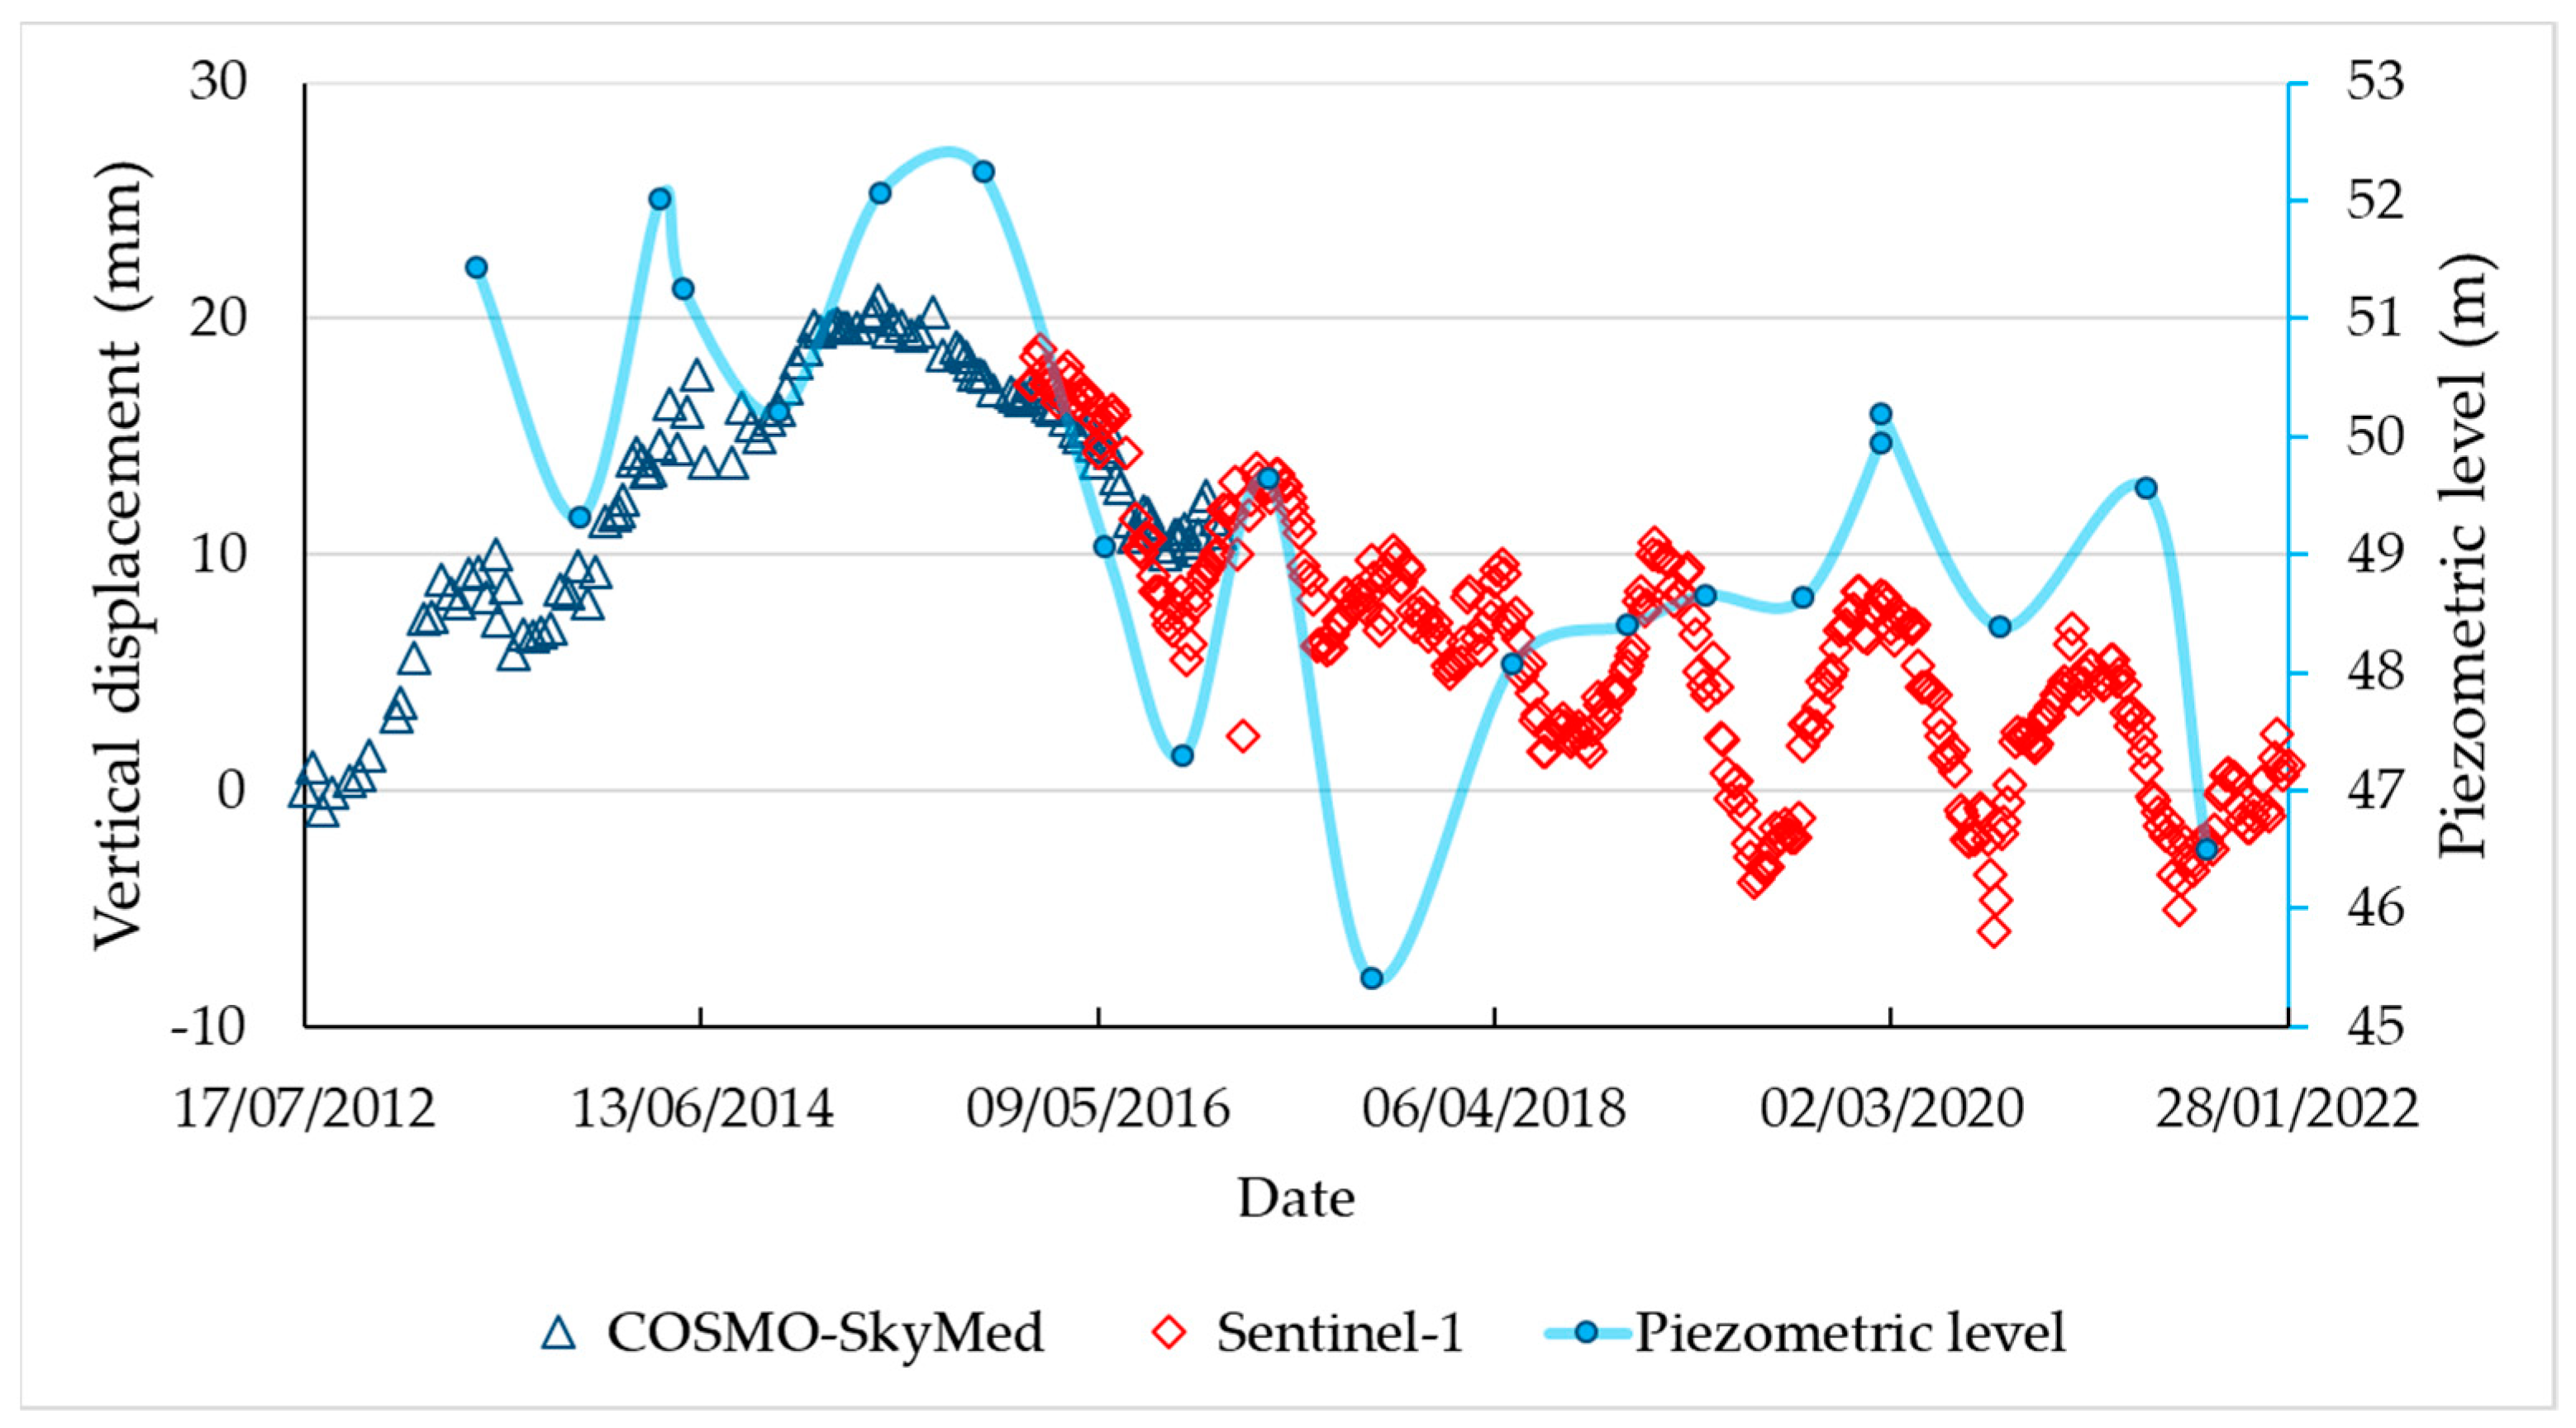
Figure 6) show that the subsidence identified by CSK data starting from mid-2015 continues here and is still ongoing at the end of the analysed period (February 2022). In addition, in this case, Sentinel-1 DTS oscillations seem to correspond to water table variation. Moreover, the reversal trend (from uplift to subsidence) identified in mid-2015 appears to be driven by the sharp decrease in the groundwater level, equal to 5 m in just 12 months, from October 2015 to the same month of 2016. Overall, this result suggests that since mid-2015 groundwater withdrawal has exceeded aquifer recharge at most of the urban area south of the municipality of Reggio Emilia.
4.3.2. Industrial Areas
Figure 7 shows vertical displacement time series plotted at two of the industrial zones sited in our study area: Mancasale (
Figure 7a) and Carpi (
Figure 7b), the latter located in the middle valley where the thickness of the Ravenna sub-synthema (made up by fine compressible sediments) is greater than the upper valley hosted Reggio Emilia centre. For the first case, DTS were generated by averaging all the points falling within a 200-metre neighbourhood of the RE 19-03 piezometric station, instead for the second area DTS were plotted considering all the points inside a 500 m neighbourhood of the MO 10-01 piezometer (
Figure 5).
DTS at Mancasale show a constant subsidence trend throughout the entire period (2012–2022). CSK and Sentinel-1 subsidence rates are equal to 6.73 mm/yr and 6.77 mm/yr, respectively. The constant subsidence rate throughout the analysed period can be explained by considering both the decrease in groundwater withdrawals in recent years which translates into a piezometric level rise, and the industrial expansion of the area which certainly took place before August 2016 (from historical Google Earth images) which creates an overload on the subsoil.
Sentinel-1 DTS at Carpi industrial area (
Figure 7b) highlighted 11.5 mm/yr of subsidence. In this zone, the recorded movements can be mainly related to a recent increase in groundwater withdrawal used for normal industrial consumption. Moreover, the groundwater level since 2016 is around 6 m a.s.l., while before 2016 it was around 10 m a.s.l. Furthermore, in this area, the subsoil is characterized by the presence of highly compressible peat and organic matter, as inferred by geotechnical core drilling available in the literature [
38,
46].
4.3.3. High-Speed Railway Sector
At the section of the Milano–Bologna high-speed railway, where both CSK and Sentinel-1 vertical displacement maps showed remarkable ground motions (
Figure 2c and
Figure 3c, respectively), DTS were generated by averaging all the points falling within a 1300 × 80 m area, next to AV Mediopadana train station (yellow dashed area within the inset in
Figure 5). This area is occupied by a railway embankment above which the rails rest (the effects of embankment overload are debated in
Section 4.4).
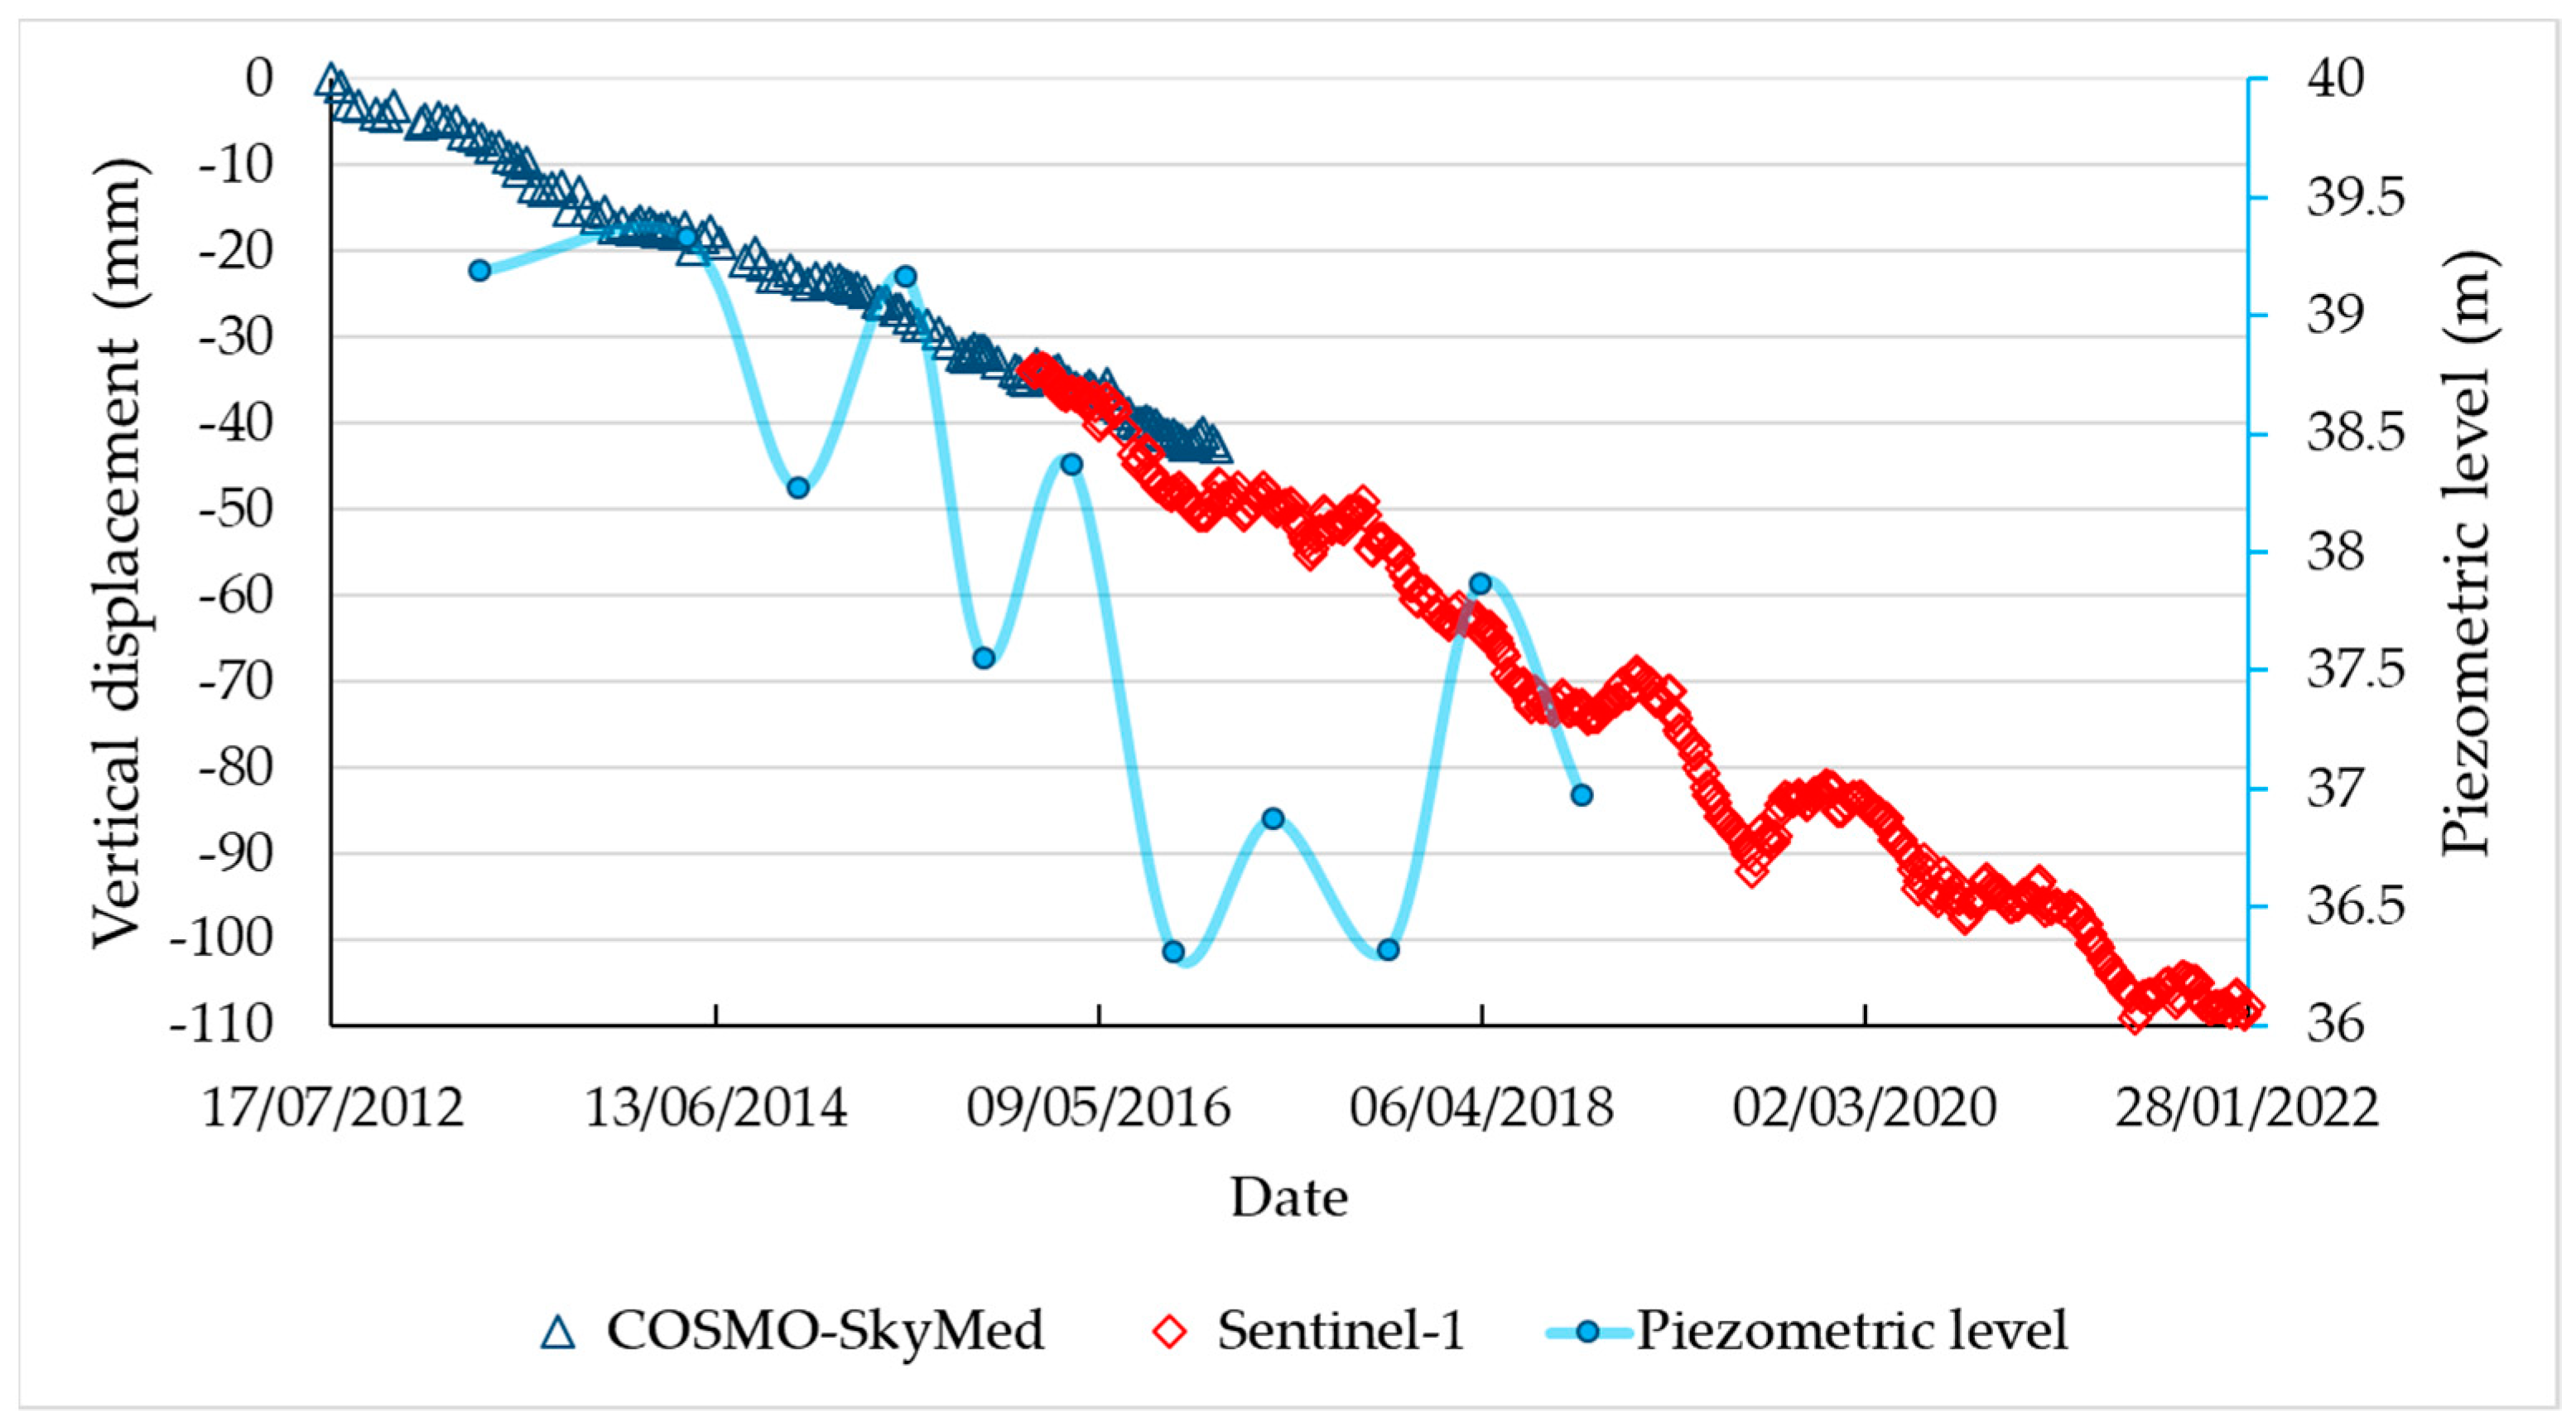
The time series plotted in this area show continuous subsidence with a mostly constant trend. The average subsidence velocity in the entire period analysed is equal to 11.3 mm/yr. The vertical displacement rate considering only the CSK data is equal to 9.7 mm/yr, while the one obtained with Sentinel-1 data is equal to 12.2 mm/yr. The acceleration of the subsidence rate in the railway embankment area may be conditioned by the rapid lowering of the piezometric level in 2016, measured at the RE-81 piezometer and visible by the light blue line in
Figure 8. Moreover, in just 6 months, from March to September 2016, the water table dropped by about 2 m.
4.4. Vertical Consolidation along Railway
Along the high-speed railway, we computed the subsidence rate induced by the railway embankment load following the classical one-dimensional vertical consolidation theory by Terzaghi [
47] and using the Geostru Loadcap software. For the railway embankment close to the Reggio Emilia AV Mediopadana station, we reconstructed a simplified geotechnical model based on an official geological map (sheet 200 “Reggio nell’Emilia” [
37]), eight geotechnical core drilling and five static penetration tests (CPT) both available from Emilia Romagna Region (
https://geoportale.regione.emilia-romagna.it (accessed on 28 March 2023)). The CTPs were re-elaborated to investigate geotechnical parameters. The location of the geotechnical investigations used for the reconstruction of the model is visible in the inset of
Figure 5.
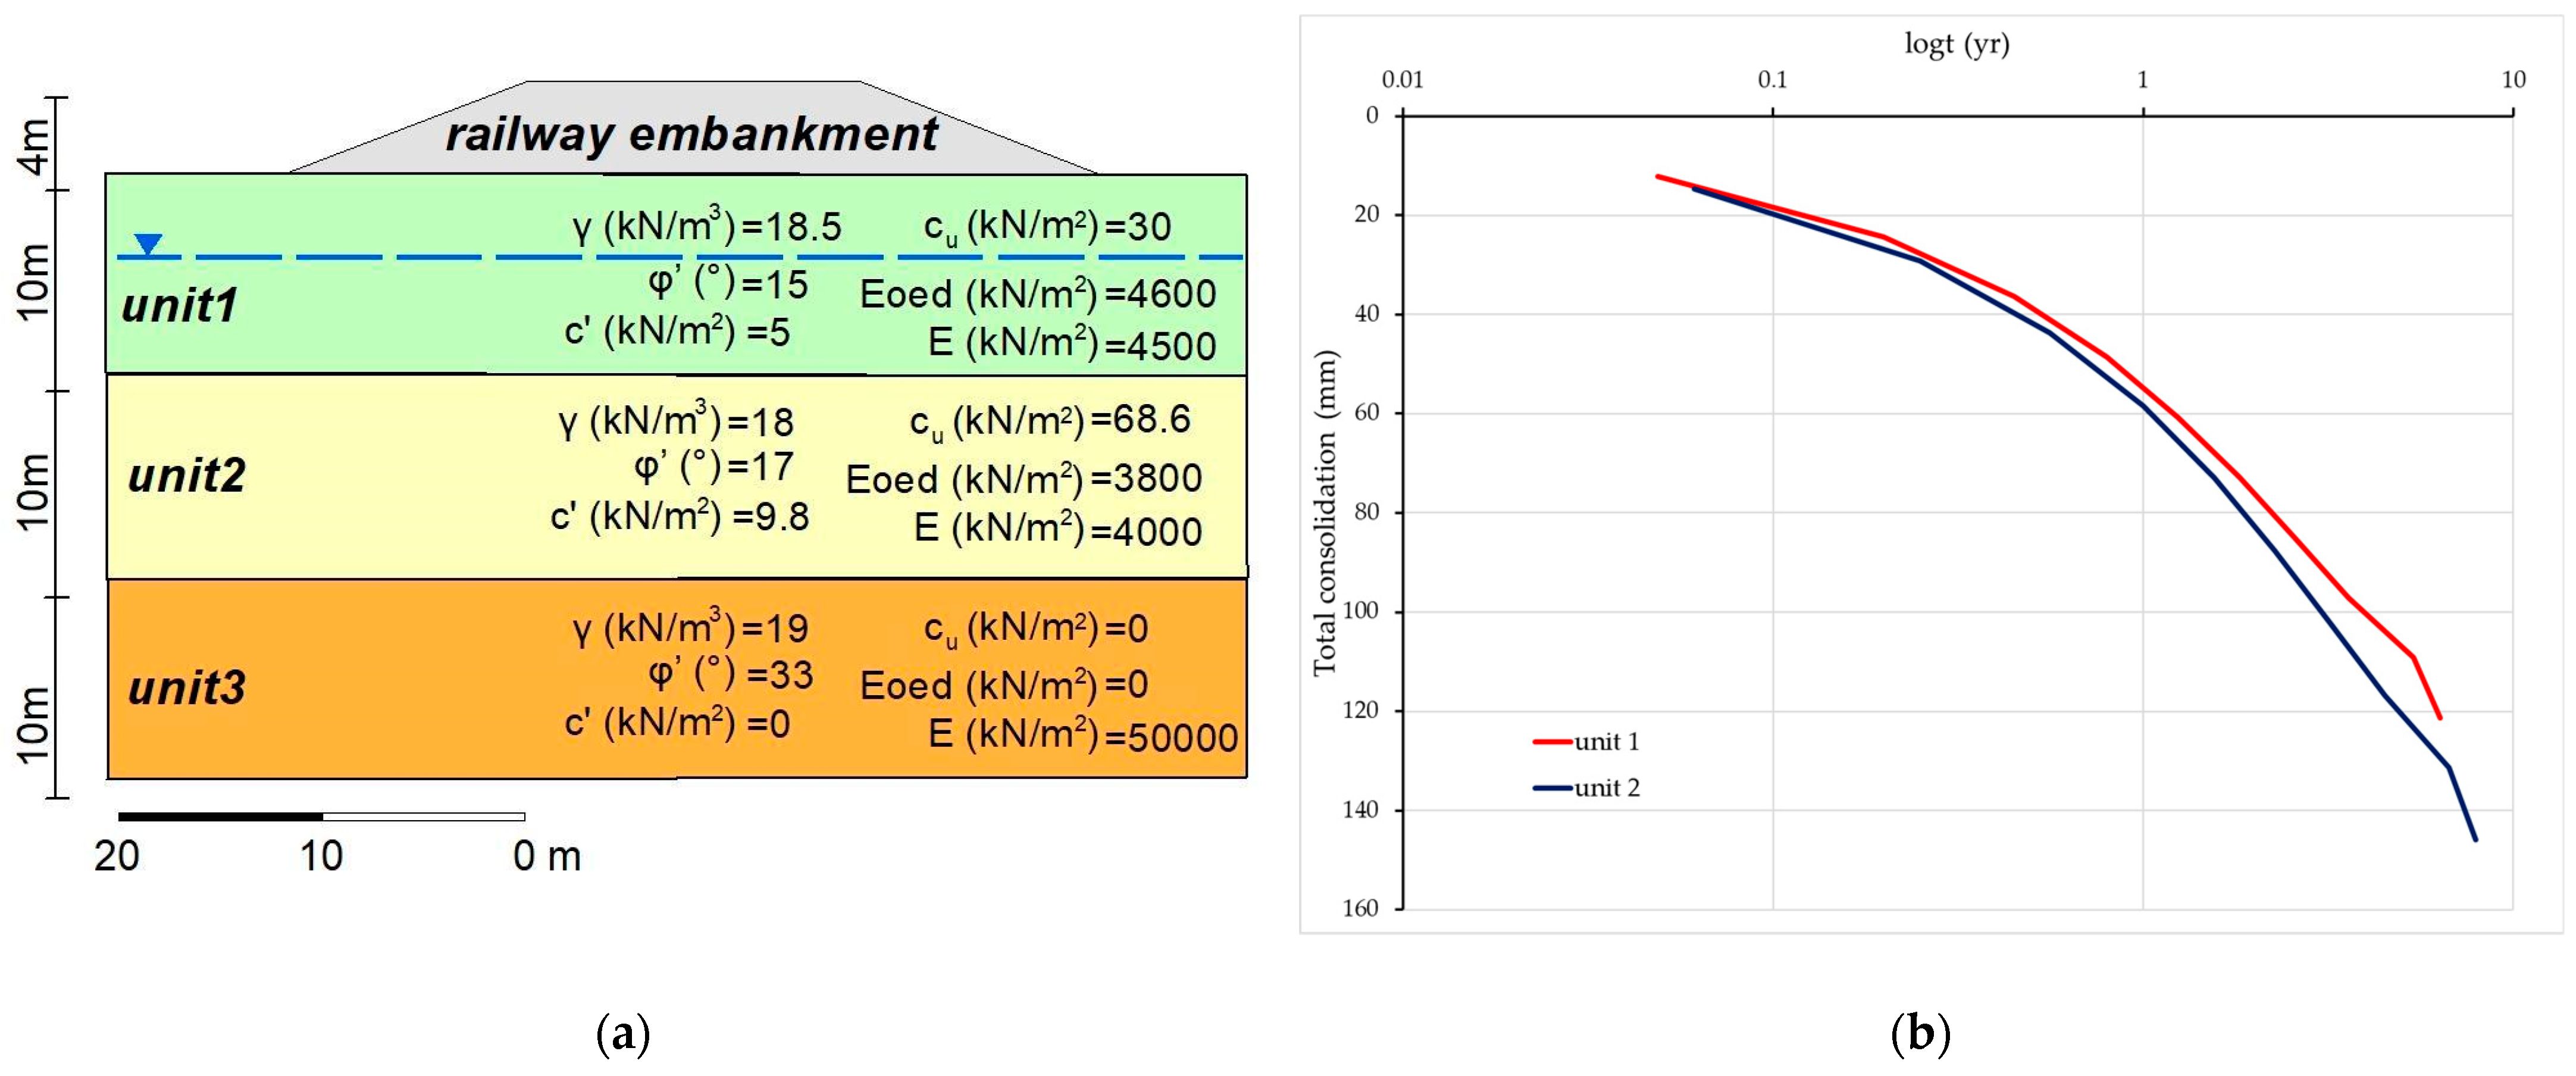
The geotechnical model (
Figure 9a) consists of 20 m-thick deposits of Ravenna sub-synthema lying on the sands and gravels (unit 3) of the Villa Verucchio sub-synthema. The Ravenna sub-synthema was divided into two 10 m-thick litho-geotechnical units made, starting from the ground level, by silty clay (unit 1) and clayey-sandy silt (unit 2).
For the railway embankment, we considered an isosceles trapezoid section characterized by parallel sides of 40 and 16 m, a height of 4 m, and a specific weight of 20 kN/m3. The embankment produces an overload of about 50 kN/m2. Moreover, we took into account a water table depth of 4 m referring to the last measurement available from the ARPAE piezometer RE-81.
The analysis of the time-dependent consolidation (
Figure 9b), evaluated for a period of 10 years, shows a total consolidation of ~27 cm which involves units 1 and 2. The total consolidation includes primary (occurring in a short period) and secondary consolidation processes [
48]. The primary consolidation occurred during the first ~2.5 and ~3.2 yr (with a rate higher than 30 mm/yr) in units 1 and 2, respectively. The secondary consolidation is instead characterized by rates of ~10 mm/yr which agrees with the vertical displacement rates inferred by S1 and CSK data. Therefore, SAR data allows monitoring the secondary consolidation due to the embankment overload which, unlike the primary consolidation, is realized over a longer period.
5. Conclusions
We analysed ground displacements which occurred from June 2012 to February 2022 by exploiting the SBAS InSAR technique applied to Cosmo-SkyMed and Sentinel-1 data on a heavily urbanized and populated portion of the Emilia Romagna Region. Displacement maps highlighted some sensitive sites characterized by non-negligible displacements in the vertical direction, as they could result in future infrastructure instabilities: (i) the south-western part of the Reggio Emilia city, (ii) the industrial areas of Mancasale (north Reggio Emilia) and Carpi (northwest Modena) and (iii) the section of the Milano–Bologna high-speed railway.
Overall, the displacement time series analysis in such areas, together with the examination of the water table heights, suggests that the displacements trend over time is mainly conditioned by the oscillations of the piezometric level due to variations in groundwater withdrawals and by the different compressibility of sediments constituting the subsoil.
Specifically, the geotechnical analysis carried out considering the embankment load in the railway area north of the city of Reggio Emilia allowed us to attest that the subsidence rate detected by the InSAR analysis (~11 mm/yr) matches the modelled secondary vertical consolidation (~10 mm/yr). Therefore, it is believed that in the 10 km long (at the beginning of 2022) sector of the railway line the subsidence identified derives mainly from secondary consolidation processes of the fine-grained soils loaded by the railway embankment and that rapid changes in the water table level can accelerate the displacement rate.
Since 2001, in the Po Plain, the drought episodes have become stronger in terms of frequency and length [
49]. An exceptional drought episode is assessed in 2022 and the possible future increase of frequency for events of this intensity is supposed [
50]. In this climate-change scenario, the ever-increasing drought and water stress negatively affect many human activities, producing ever-growing exploitation of groundwater resources. Considering the shown relationship between piezometric level oscillation and vertical ground motion, a possible increase in groundwater withdrawal could exacerbate the subsidence. The knowledge of these phenomena is therefore essential in order to prevent negative impacts on the population and socio-economic activities.


