Article

Imprints of Millennial-Scale Monsoonal Events during the MIS3 Revealed by Stalagmite δ13C Records in China

1
School of Geographical Sciences, Nantong University, Nantong 226007, China
2
State Key Laboratory of Loess and Quaternary Geology, Institute of Earth Environment, Chinese Academy of Sciences, Xi’an 710075, China
*
Author to whom correspondence should be addressed.
Geosciences 2023, 13(5), 136; https://doi.org/10.3390/geosciences13050136
Submission received: 28 February 2023 / Revised: 11 April 2023 / Accepted: 25 April 2023 / Published: 8 May 2023
(This article belongs to the Special Issue Climate Variations at Millennial Timescales)

Abstract

:
Regions located on the Chinese Loess Plateau are sensitive to changes in the Asian monsoon because they are on the edge of the monsoon region. Based on six 230Th experiments and 109 sets of stable isotope data of LH36 from Lianhua Cave, Yangquan City, Shanxi Province, we obtained a paleoclimate record with an average resolution of 120 years from 54.5 to 41.1 ka BP during the MIS3 on the Chinese Loess Plateau. Both the Hendy test and the replication test indicated an equilibrium fractionation of stable isotopes during the stalagmite deposition. Comparison with four other independently-dated, high-resolution stalagmite δ13C records between 29°N and 41°N in the Asian monsoon region shows that the stalagmite δ13C records from different caves have good reproducibility during the overlapped growth period. We suggest that speleothem δ13C effectively indicates soil CO2 production in the overlying area of the cave, reflecting changes in the cave’s external environment and in the Asian summer monsoon. Five millennial-scale Asian summer monsoon intensification events correspond to the Dansgaard–Oeschger 10–14 cycles recorded in the Greenland ice core within dating errors, and the weak monsoon processes are closely related to stadials in the North Atlantic. The spatial consistency of stalagmite δ13C records in China suggests that the Asian summer monsoon and the related regional ecological environment fluctuations sensitively respond to climate changes at northern high latitudes through sea-air coupling on the millennial timescale.

1. Introduction

A series of millennial-scale abrupt climate events occurred during the last glacial period, including Heinrich Stadial (HS) events and Dansgaard–Oeschger (DO) events [1,2,3,4]. Among them, HS events refer to the six North Atlantic ice-rafted detritus (IRD) events caused by ice sheet collapses. This type of events occurs in a cycle of ~10,000 years, mainly characterized by a decreased planktonic foraminifera content, a significant increase in carbonate deposits, a low salinity and a low water temperature between 40°N and 55°N in the North Atlantic [1,5]. DO events are 25 significant millennial-scale cooling and warming oscillations identified in the Greenland ice core records [2,3,4]. DO events occurred at a frequency of about 1.5 ka and the amplitude of temperature changes in Greenland has reached 5–16 °C within decades, exceeding half the magnitude of the glacial-interglacial cycles [2,3]. These millennial-scale climate events not only occurred at mid-to-high latitudes in the North Atlantic, but also exerted profound and extensive impacts on the climate in monsoonal and equatorial regions [6], indicating that there were significant teleconnections between the high and low-latitude climate systems during the last glacial period [7,8,9,10,11].
Stalagmites have advantages of high resolution, multiple proxies and absolute 230Th dating; thus, they are important geological materials for paleoclimate reconstruction. So far, the climatic significance and interpretation of Chinese stalagmite δ18O is still a hotly-debated topic in academic research. Some scholars suggest that it could represent the intensity of the East Asian summer monsoon (EASM) [8,12,13], water vapor sources and transport pathways [14,15], atmospheric circulation patterns and hydrological processes [16] or the movement of the westerly jet [17]. Previous studies point out that when the EASM strengthens, the stalagmite δ18O shifts negatively, and when the EASM weakens, the stalagmite δ18O shifts positively. Consistent changes in the intensity of the monsoon circulation result in the reproducibility of stalagmite δ18O records on orbital to millennial timescales in different regions of China [9]. However, simulations show that the spatial correlation range between precipitation δ18O and precipitation does not exceed 500 km, which contradicts the continental-scale spatial consistency characteristics of stalagmite δ18O records [15]. Recently, Cheng et al. [13,18] suggested that the variation in the Asian summer monsoon indicated by Chinese stalagmite δ18O records should represent changes in the mean state of summer monsoon intensity. In other words, the variation in the monsoon strength revealed by the spatial consistency of stalagmite δ18O records represents more likely the nature of “wind” or the consistency of the atmospheric circulation and the accompanying changes in remote and nearby water vapor sources. It does not necessarily in all cases represent changes in precipitation at the specific study site. On the fringes of the summer monsoon, the monsoon “wind” and “rainfall” may be consistent. For example, based on the Zhenzhu Cave stalagmites in the monsoon fringe region of northern China, Li et al. [19] found that the stalagmite δ13C records and the loess carbonate δ13C records are very similar in terms of amplitudes and trends on the orbital and millennial timescales, suggesting that stalagmite δ13C can indicate summer monsoon precipitation, while δ18O indicates the change in the intensity of the East Asian summer monsoon. Although some records and simulations show that Chinese stalagmite δ18O tends to indicate the intensity of the EASM at the continental scale [8,12,13,20], its climatic significance remains to be further clarified, and other proxy indicators may be used to supplement the research on stalagmite δ18O.
Compared to stalagmite δ18O which is mainly controlled by precipitation, the sources and the influence factors of carbon isotopes (δ13C) in stalagmites are more complex (including atmosphere, soil, organisms, rocks, etc.) [21]. Recently, reconstruction work has shown that stalagmite δ13C records have great potential for revealing changes in the paleoclimate and paleoenvironment, and to a certain extent can make up for the deficiency that stalagmite δ18O cannot indicate local environmental changes [19,22,23,24]. For example, Shennong speleothem δ13C is suggested to be controlled by vegetation density, and during the early mid Holocene, a long-term calcite δ13C indicates a gradual increase in precipitation [24]. Speleothem δ13C from the nearby Yongxing Cave shows that during warm and humid conditions, δ13C is relatively low, consistent with negatively biased δ18O and decreased trace element ratios [22]. In addition, during the last glacial period, the stalagmite δ13C of Hulu Cave reflected the “damping effects” on the millennial timescale, and the reconstructed EASM precipitation changes based on this sequence can complement the Hulu δ18O records, indicating changes in the monsoon intensity [25]. In northern China, speleothem δ13C is mainly interpreted as the soil microbial activity and vegetation associated with changes in soil moisture and temperature [19,23]. Li et al. [19] also suggested that cave δ13C records are a sensitive and reliable indicator of the EASM rainfall amount, while δ18O is an indicator of changes in the phase of the EASM.
These previously published Chinese records have been reconstructed and analyzed at a single cave site and a few studies have comprehensively analyzed the response of stalagmite δ13C records to millennial-scale abrupt climate events in different regions during the last glacial period (Marine Isotope Stage 3, MIS3). In this paper, we selected stalagmites from Lianhua Cave, Shanxi Province, in the eastern Chinese Loess Plateau (LP), which is located at the edge of the Asian summer monsoon, to reconstruct the stalagmite δ13C time series from 54.5 ka BP to 41.1 ka BP. We compared our newly derived record with δ13C records from different caves and regions in China and discussed the palaeoclimatic significance of δ13C proxy. Furthermore, we evaluated the response process of Chinese stalagmite δ13C records to millennial-scale abrupt climate events and revealed the possible driving mechanisms behind it.

2. Materials and Methods

Shanxi Province is located inland of the east coast of the Eurasian continent (Figure 1). The LP is a typical plateau with extensive coverage of loess and its altitude decreases from the northeast to the southwest, leading to the strong influence of ocean water vapor. As the region is located on the edge of the Asian monsoon, it is sensitive to the advance and retreat of the winter and summer monsoon circulation and is therefore suitable for studying the history of the Asian monsoon.
Lianhua Cave (113°43′ E, 38°10′ N) is located in Jiaokou Town, Yangquan City, Shanxi Province, with an elevation of 1200 m. The cave was developed in the limestone of the Ordovician Majiagou Formation. Its length is about 250 m, and the entrance is so narrow that only one person can crawl through it. Due to its poor ventilation with the outside, the relative humidity in the inner cave reaches 98%–100%. In July, the measured temperature in the cave is 11 °C, close to the annual average temperature on the surface. Affected by the Asian monsoon, the regional average annual rainfall is about 515 mm, and ~70% of the annual rainfall occurs from June to September. The vegetation outside the cave is mainly composed of a temperate deciduous broad-leaved forest, shrubs and herbs.
The 206 mm long LH36 stalagmite sample is columnar, with varying diameters from 80 to 110 mm. After slicing and polishing along its growth axis, clear growth layers could be observed. The sample is mainly composed of white and yellowish calcite according to both the X-ray diffraction results and the polished profile (Figures S1 and S2). There are brown weathered crusts at sections of 33–35 mm and 145–150 mm from the top, and the lithofacies above and below the interface differ significantly, indicating two hiatuses. Considering these hiatuses, we use the section from 37 to 145 mm in this paper.
On the polished surface, 109 subsamples (approximately 50 μg per sample) were collected for oxygen and carbon isotope analyses at 1 mm intervals along the growth axis of stalagmite using a 0.3 mm diameter dental drill. The analyses were completed in the Isotope Laboratory, School of Geography Sciences, Nanjing Normal University. The analytical error was less than ±0.05‰ for δ18O and ±0.06‰ for δ13C. In addition, 36 powdered samples were drilled with carbide dental burrs along the growth axes and used for trace element analyses at the College of Geography, Nantong University, China. Each sample weighed ~3 mg and was dissolved in a 5 mL solution of 5% HNO3. The solutions were then left overnight and filtered using water filters with a 0.22-μm pore diameter. All solutions were analyzed using an inductively coupled plasma optical emission spectrometer (ICPE-9000, Shimadzu). The precision was better than 2%.
Six 230Th age samples at depths of 37, 51, 80, 95, 113 and 127 mm were collected using a 0.9 mm diameter dental drill. Powder samples were processed and tested in the High Precision Mass Spectrometry and Environmental Change Laboratory, National Taiwan University and Isotope Laboratory, Nanjing Normal University. The analytical instrument was a Thermo Neptune multi-collector inductively coupled plasma mass spectrometer (MC-ICP-MS). The processing and analytical methods are shown in refs. [30,31] and the decay constants are the same with [32,33]. The age analytical error was ±2σ, and detailed results have been published in ref. [9].

3. Results

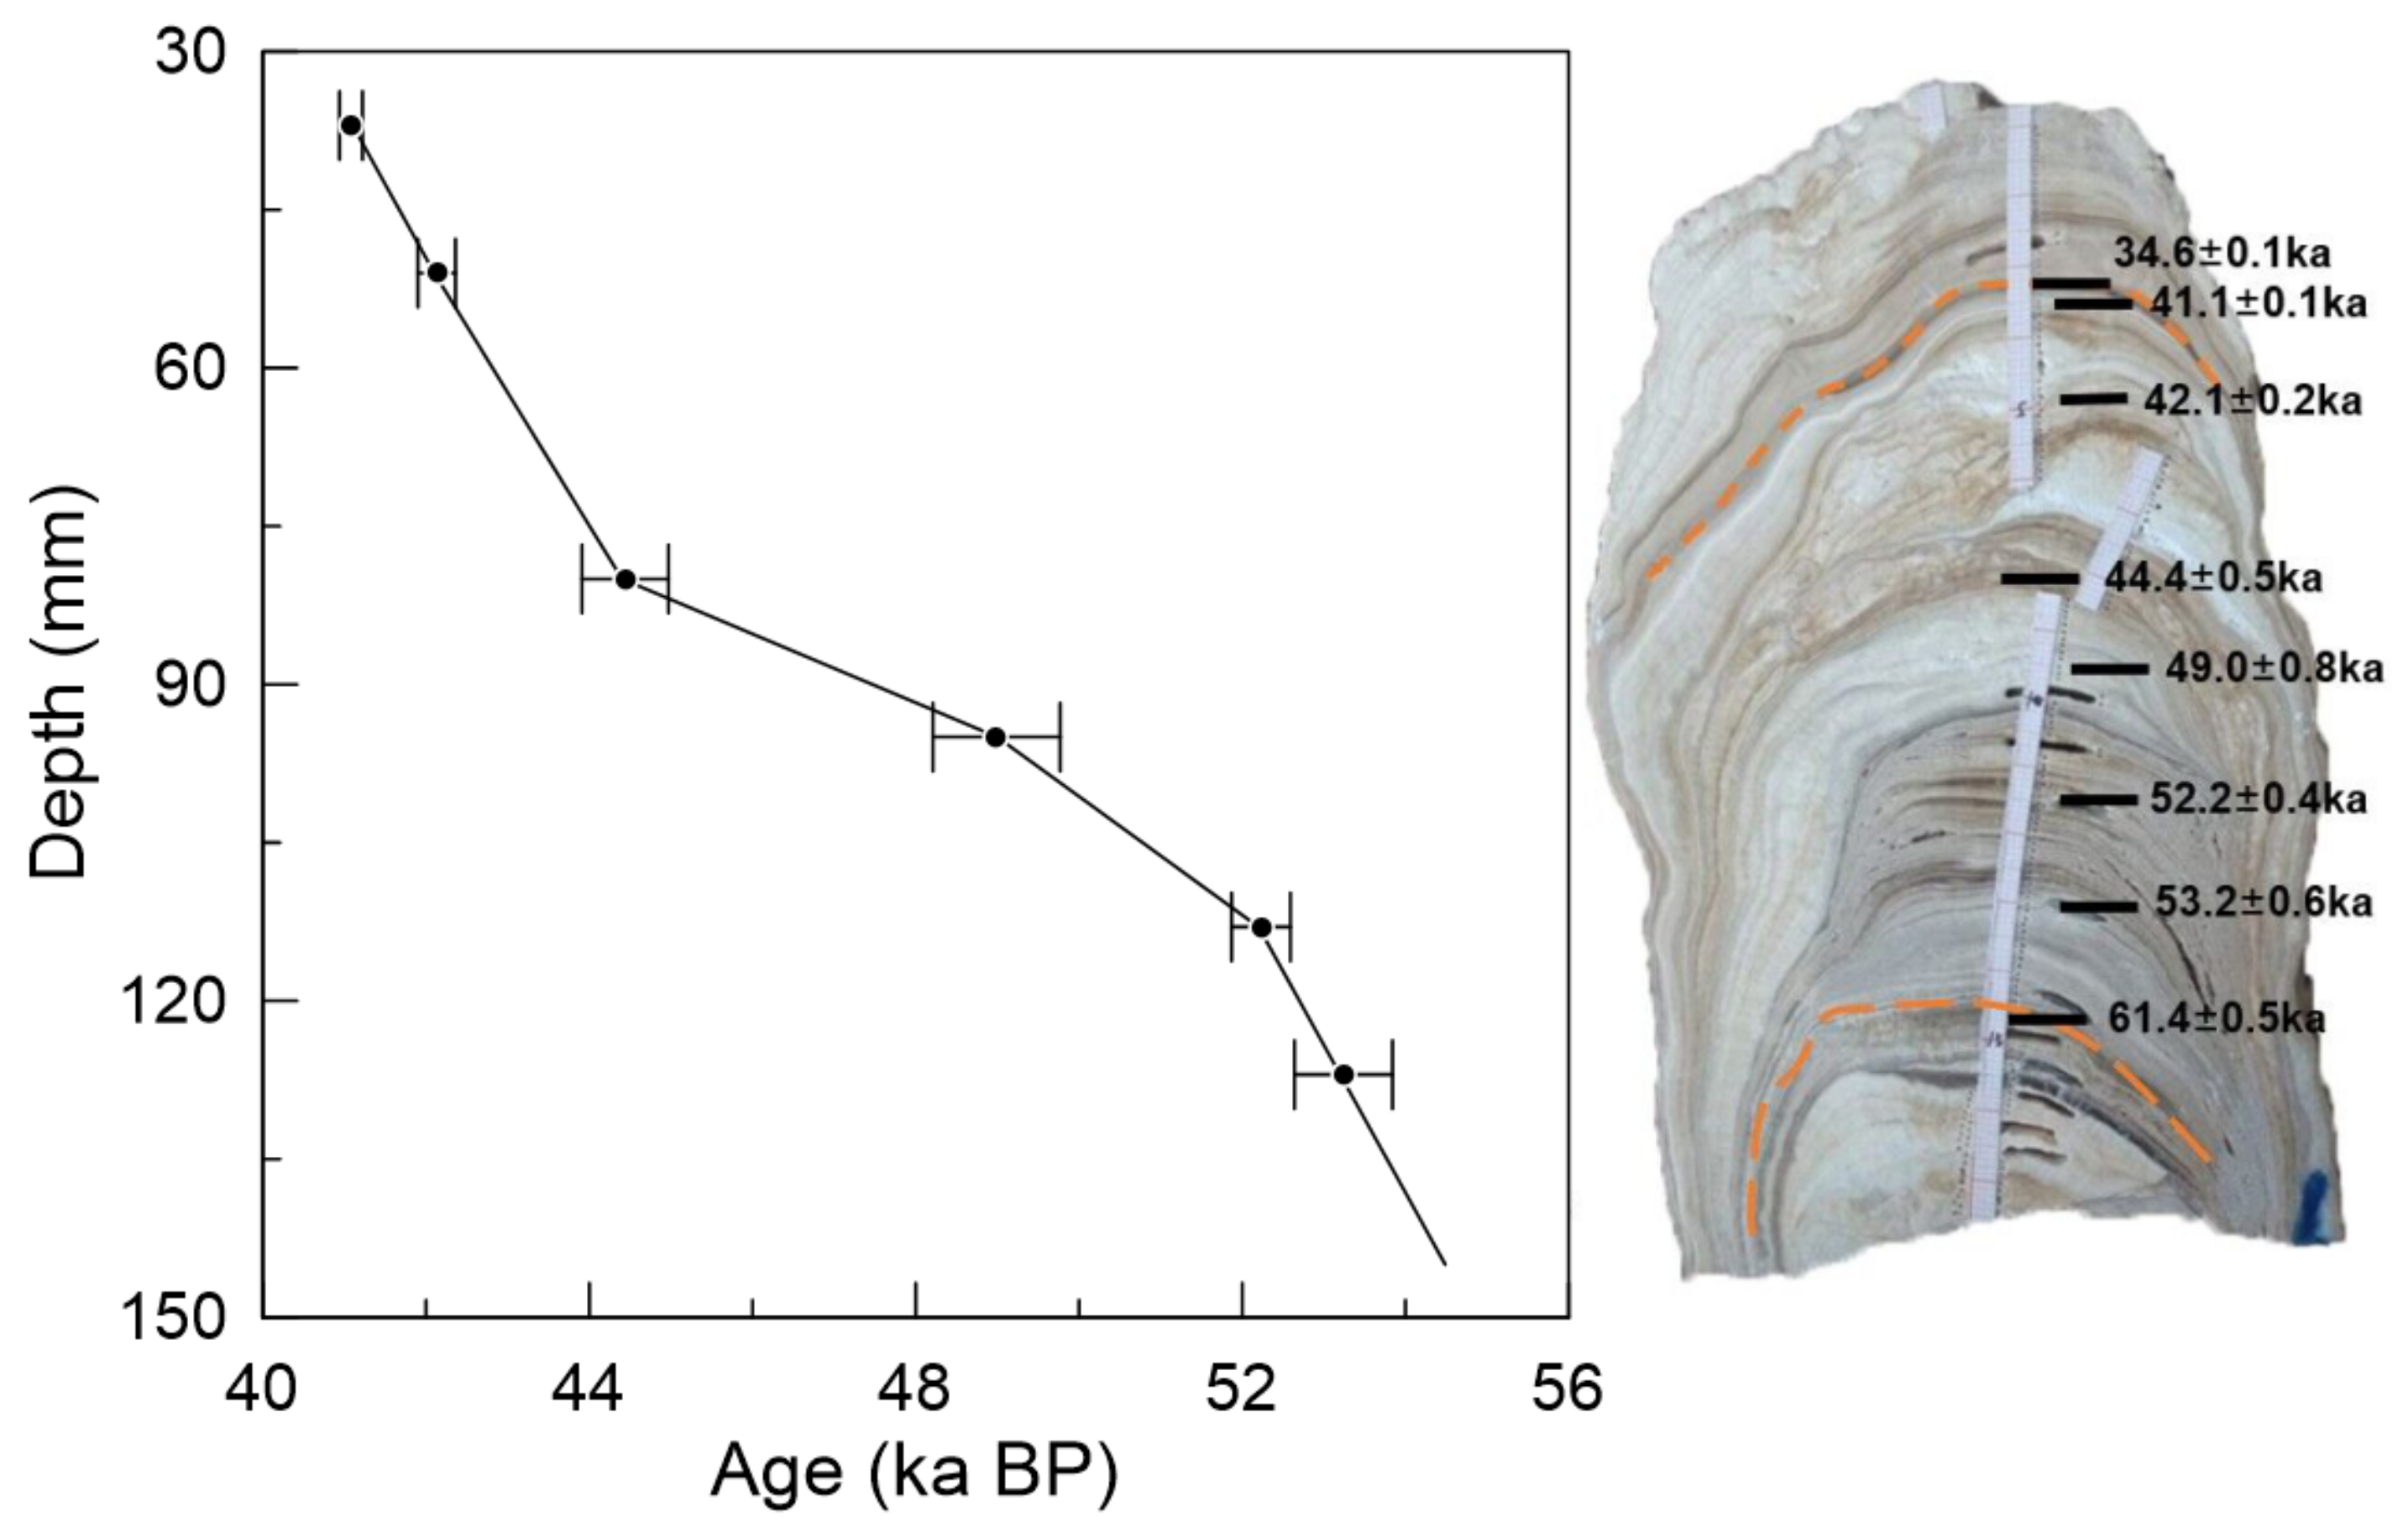
3.1. Chronology of Stalagmite LH36

According to the U and Th isotopic composition results of stalagmite LH36 in ref. [9], which are attached in Table S1, the concentration of 238U is low and in the range of 95.6 ± 0.1–975.1 ± 0.1 ppb. The concentration of 232Th is high, ranging from 2.1 ± 0.01 to 21.3 ± 0.11 ppb. The atomic ratio of 230Th/232Th is low and in the range of (0.124 ± 0.01) × 10−3–(0.861 ± 0.08) × 10−3. Due to the impurity of the samples and the high concentration of 232Th, the initial 230Th corrections of the sample LH36 were relatively large, most of which were within 0.1–0.9 ka. The sample with the largest correction was LH36-95, reaching 1.3 ka. Despite the large dating errors, all of the corrected ages were in stratigraphic order (Figure 2). In this paper, the LH36 time series during early MIS3 was established by linear interpolation and arithmetic progression of the dating points. The results showed that the stalagmite LH36 grew continuously from 54.5 to 41.1 ka BP after sedimentary discontinuities, with an average resolution of 120 years.

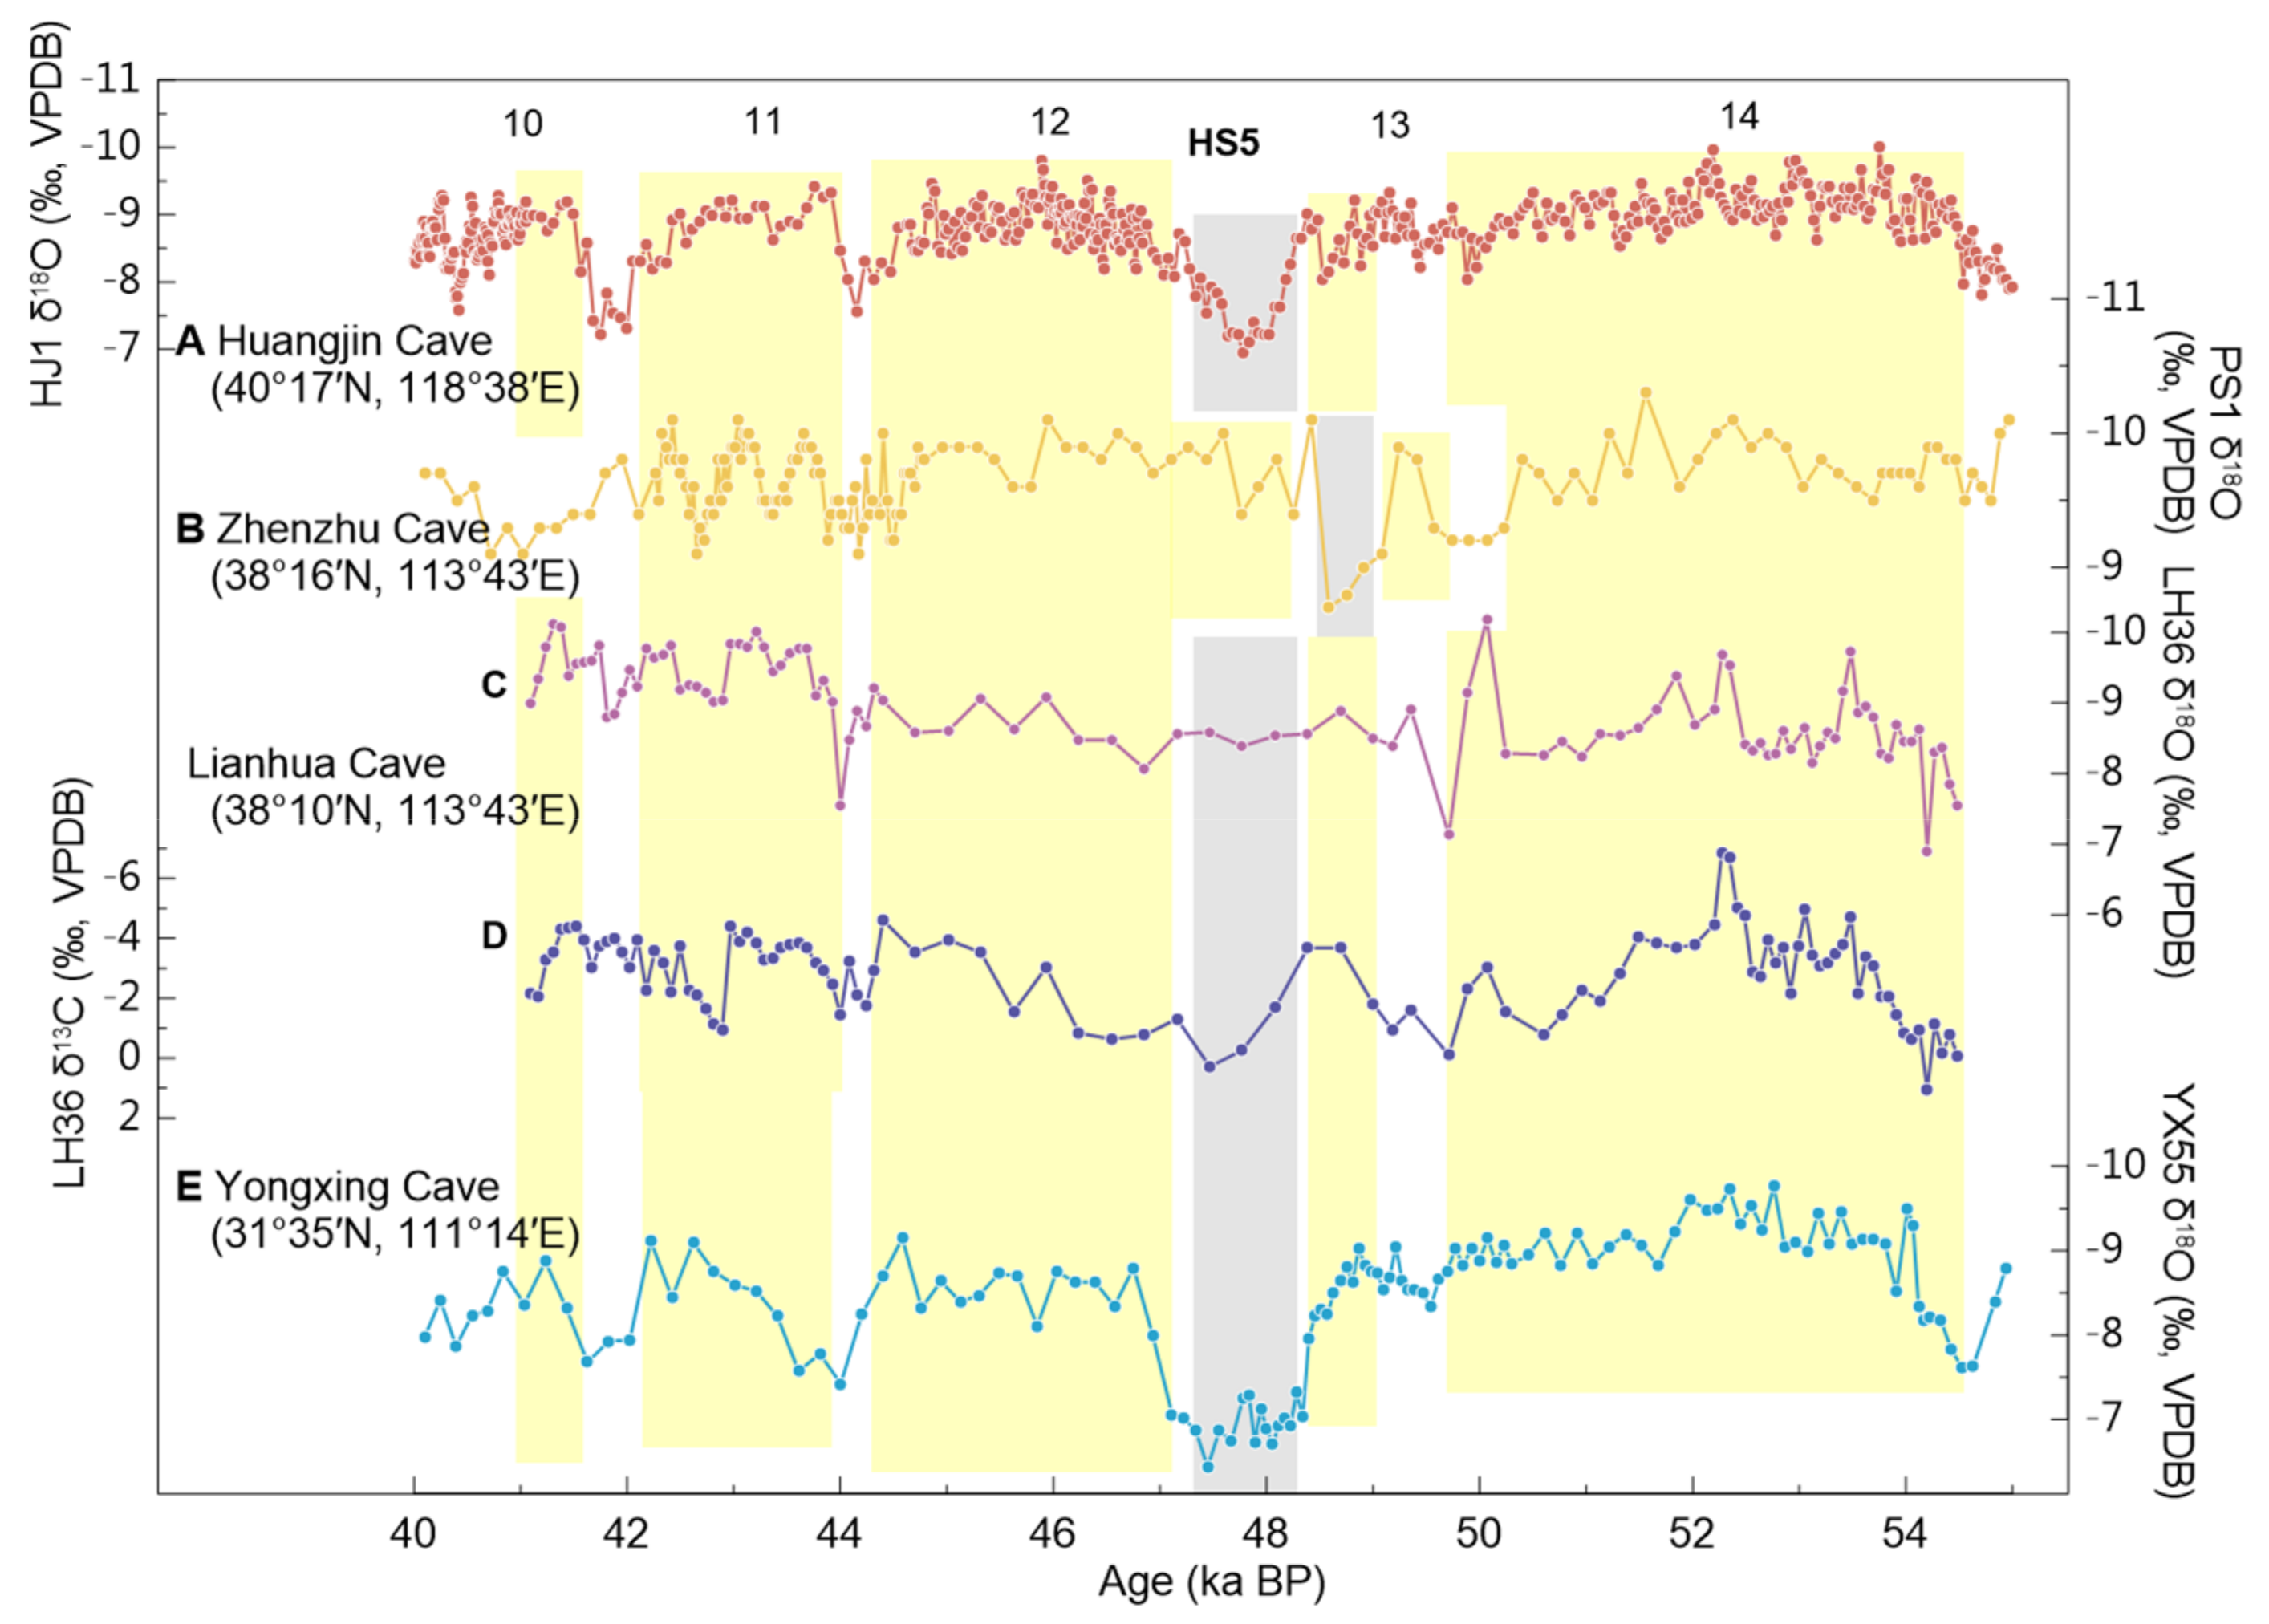
3.2. Multi-Proxy Sequences of Stalagmite LH36

From 54.5 to 41.1 ka BP, the δ18O value fluctuates between −10.2‰ and −6.9‰, with an amplitude of 3.4‰ and an average value of −8.9‰ (Figure 3C). The δ13C values of stalagmite LH36 fluctuate between −6.9‰ and 1.1‰, with an amplitude of 5.8‰ and an average value of −2.7‰ (Figure 3D). The correlation between δ13C and δ18O records is 0.6, showing a significant positive correlation (Table S2). Stalagmite δ13C records a series of millennial-scale climate events, including DO10–14 events and HS5 (Heinrich Stadial 5) events. During the five DO warm stages, the δ13C is significantly negatively biased, with a value of about −4‰ and an average amplitude of over 3‰, showing a trapezoidal structure. Particularly, the trapezoidal structure of DO14 event is particularly obvious, with the largest δ13C amplitude (5.8‰). In the HS5 event, the δ13C is the most positive, with values larger than 0‰. Compared with the stalagmite δ13C records, the millennial-scale events in the δ18O curve are ambiguous; the peaks of DO12 and DO13 events are absent. Obviously, the stalagmite LH36 δ13C is more sensitive to millennial-scale climate oscillations than δ18O.
The necessary prerequisite for using stalagmite stable isotope records for paleoclimate reconstruction is that the stalagmites were deposited under isotopic equilibrium fractionation conditions. There are two methods for an equilibrium test: the Hendy test [34] and the replication test [35]. The Hendy test requires that the isotope values in the same layer do not change much. We selected three layers (125 mm, 146 mm and 158 mm) on the polished surface and collected powder subsamples from both sides of the growth axis at 5 mm intervals for each layer. The results show that changes in δ13C and δ18O on the same layer of stalagmite LH36 are less than 1‰, i.e., basically stable, and the standard deviations in the data in the three layers are less than 0.3 (Figure S2), passing the Hendy test. In addition, Dong et al. [9] showed that since 60 ka BP, the δ18O records of different stalagmites in Lianhua and nearby caves have high similarities in terms of amplitude and changing trends, supporting the replication test [35]. We further compare the LH36 δ18O records with calcite δ18O records from Chinese caves, including Huangjin Cave, Zhenzhu Cave and Yongxing Cave (Figure 3A,B,E). From the comparison, it is noted that on the millennial timescale, these δ18O records show consistent shifts in values, that is, positive biases during stadials and negative biases during interstadials, as marked with yellow bars. In addition, the three multi-centennial fluctuations during DO11, as captured in PS1 δ18O records (Figure 3B), are also detected in LH36 δ18O records (Figure 3C), possibly due to the fact that both records are derived from the Loess Plateau. Both lines of evidence in the Hendy test and the replication test indicate that the stalagmites from Lianhua Cave were equilibrium fractionated during the deposition process. However, we cannot deny that there are differences in different δ18O records, e.g. internal structures during the DO11 event, which might be due to different moisture sources or pathways [36]. In addition, compared with other δ18O records, DO12 and DO13 are ambiguous in our LH36 δ18O records, while the LH36 δ13C records shows prominent DO12 and DO13 peaks (Figure 3D). This is the reason why we chose to discuss LH36 δ13C records in the following context.
The concentrations of Mg, Sr and Ba in stalagmite LH36 are expressed as ratios to Ca (Figure S3C–E). The Sr/Ca and Ba/Ca ratios exhibit a coherent long-term increasing pattern (dashed lines in Figure S3C,D) and are strongly positively correlated (R = 0.53, n = 36, P < 0.01, Table S2). The Mg/Ca ratio displays a general decreasing trend during the entire interval (Figure S3E) and is found to be negatively correlated with Sr/Ca and Ba/Ca ratios (Table S2). The correlation between stable isotope composition and trace elements is complex, and Sr/Ca and Ba/Ca are negatively correlated with δ13C and δ18O (Table S2).

4. Discussion

4.1. Interpretation of LH36 Stalagmite δ13C

The carbon in stalagmite sources from soils (80%–95%), carbonate bedrocks (10%–15%) and atmospheric CO2 (~0.03%) [37]. The δ13C values of bedrock mainly affect the baseline of δ13C [37]. The average δ13C value of the Ordovician Majiagou Formation limestone in China is −1‰–0‰ [38], which may lead to the relatively high δ13C average of LH36 (−2.7‰). Although stalagmite δ13C is also disturbed by a variety of internal cave factors, including isotopic fractionation, dead carbon, ventilation of karst systems and prior calcite precipitation effects (PCP) [37,39], evidence shows that it is mainly controlled by the soil CO2 concentration and can indirectly reflect changes in the external climate and environment [21,37,40]. Generally, soil CO2 is prone to affect the short-term fluctuations of stalagmite δ13C, while soil CO2 itself is mainly affected by vegetation type, soil respiration and biomass changes [34,40,41,42]. Therefore, soil CO2 is closely related to external climate factors [43]. Hendy et al. [34] found that C3 or C4 vegetation changes exerted the greatest impact on stalagmite δ13C. The stalagmite δ13C in caves (−14‰–−6‰) under the influence of C3 vegetation is lighter than the stalagmite δ13C in caves (−6‰–2‰) under the influence of C4 vegetation [40]. Since a cold and wet climate is favorable for the growth of C3 vegetation and a warm and dry climate is favorable for the growth of C4 vegetation, the abundance and climatic conditions of C3 and C4 vegetation can be inferred from stalagmite δ13C. In addition, Genty et al. [41] believed that stalagmite δ13C can be used as an indicator of overlying biomass changes on the millennial timescale based on a study of the Villars Cave, thus reflecting the improvement or degradation in the ecological environment. Obviously, due to high correspondence between vegetation, biomass changes and climate factors (temperature and humidity), stalagmite δ13C can reflect climate change to a certain extent [23,26,27]. At the same time, various factors related to soil CO2 have the same effects on stalagmite δ13C; that is, under good climate conditions, dense vegetation, large biomass and an increased C3/C4 ratio will lead to lighter δ13C, and vice versa [44].
We suggest that the δ13C of stalagmite LH36 mainly refers to soil CO2 changes related to vegetation type, biomass and biological respiration. Firstly, the PCP effect in stalagmite LH36 is falsified by the inconsistency in millennial-scale variations in three trace metal records (Figure S3C–E), as well as the low correlation coefficients (≤0.32) between trace metal ratios and stable isotopic values (Table S2). In addition, according to the PCP test proposed by Sinclair et al. [45], the slope of the theoretical PCP gradient should be around 0.9 at Lianhua Cave. However, the slope of the trend line through the plot of ln (Mg/Ca) versus ln (Sr/Ca) is −0.2 for the LH36 sample (Figure S3F), indicating an absence of PCP control during calcite deposition. Secondly, previous studies found that C3-C4 mixed vegetation was mainly developed in the central and eastern LP during the last glacial period, where C3 vegetation dominated and the proportion of C4 vegetation increased from the northwest to the southeast of the LP [46,47,48]. Meanwhile, due to the “temperature threshold” which inhibited the expansion of C4 vegetation, the loess records showed small variations in the proportion of C3 and C4 vegetation during the cold MIS3 period [43,44,45]. Furthermore, biogenic production records from Lake Sihailongwan (SHLW [28], Figure 4F) in northeastern China show similar fluctuations with our records.
In addition, δ13C records from northern China to southern China display consistent biases in δ13C values on the millennial timescale, with negative shifts during DO interstadials and positive shifts during DO stadials and HS events, with most of them having similar durations (Figure 4). Stalagmite δ13C values in different records gradually increase during the long-term DO14 interstadial (dashed arrows in Figure 4). Huangjin, Zhenzhu and Lianhua caves are all located in northern China (Figure 1), and the distance from Lianhua to Huangjin and Zhenzhu is less than 600 km and 100 km, respectively. The PS1 chronology is systematically older than other stalagmites by around 1 ka, but millennial-scale variations could also be identified, and their structural characteristics for DO13 share strong similarities with our LH36 records. Both modern monitoring and record reconstruction show that Zhenzhu Cave δ13C mainly reflects soil CO2 changes and is significantly related to the external precipitation and vegetation [49,50]. In the past 30 years, the difference in the mean annual temperature between Lianhua Cave and Zhenzhu Cave was only 2 °C, and the difference in the mean annual precipitation was only 24 mm [9,19]. Considering the similar modern climate conditions, the precipitation and vegetation changes at the two sites during the last glacial period could also be similar. In addition, HJ1 δ13C is suggested to represent the regional biomass and the C3/C4 vegetation ratio [26], and the stalagmite δ13C records from Wanxiang Cave in the western LP is indicative of vegetation and coverage changes, with negative δ13C values indicating increases in vegetation coverage and the C3/C4 vegetation ratio, and vice versa [51]. Therefore, similar variations in δ13C records in northern China could indicate similar vegetation and environmental changes under the same climatic conditions. It can be speculated that during the warm DO stages, an increase in summer precipitation could lead to an increase in soil moisture and vegetation biomass, and the enhancement in soil respiration and an increase in CO2 partial pressure. These conditions were favorable for negative δ13C values in secondary carbonate deposition of cave stalagmites.
In addition, there are discrepancies in Chinese cave δ13C records (Figure 4). For instance, the negatively-biased duration of DO12 and DO13 interstadials are longer in Zhenzhu δ13C records (Figure 4B) than any other records by hundreds of years, which might be due to its poor age constraints (see large error bars above the PS1 δ13C record). A general decreasing trend during DO12 is observed in both LH36 and YZ1 δ13C records, but contradicts with the increasing trend in other cave records (Figure 4A,C,D). In addition, the internal variations in DO10 are variable; that is, there is a flat trend in Huangjin, Zhenzhu and Yangzi records, a positive valley in Lianhua records and a sharp peak in Yongxing records. These differences might be due to the fact that calcite δ13C signals can incorporate local-scale environmental variations, which can vary in different places.
In conclusion, the stalagmite δ13C in Lianhua Cave mainly indicates a change in terrestrial CO2 production, which is related to the local vegetation type, biomass and biological respiration above the cave, and can further reflect changes in the intensity of the EASM.

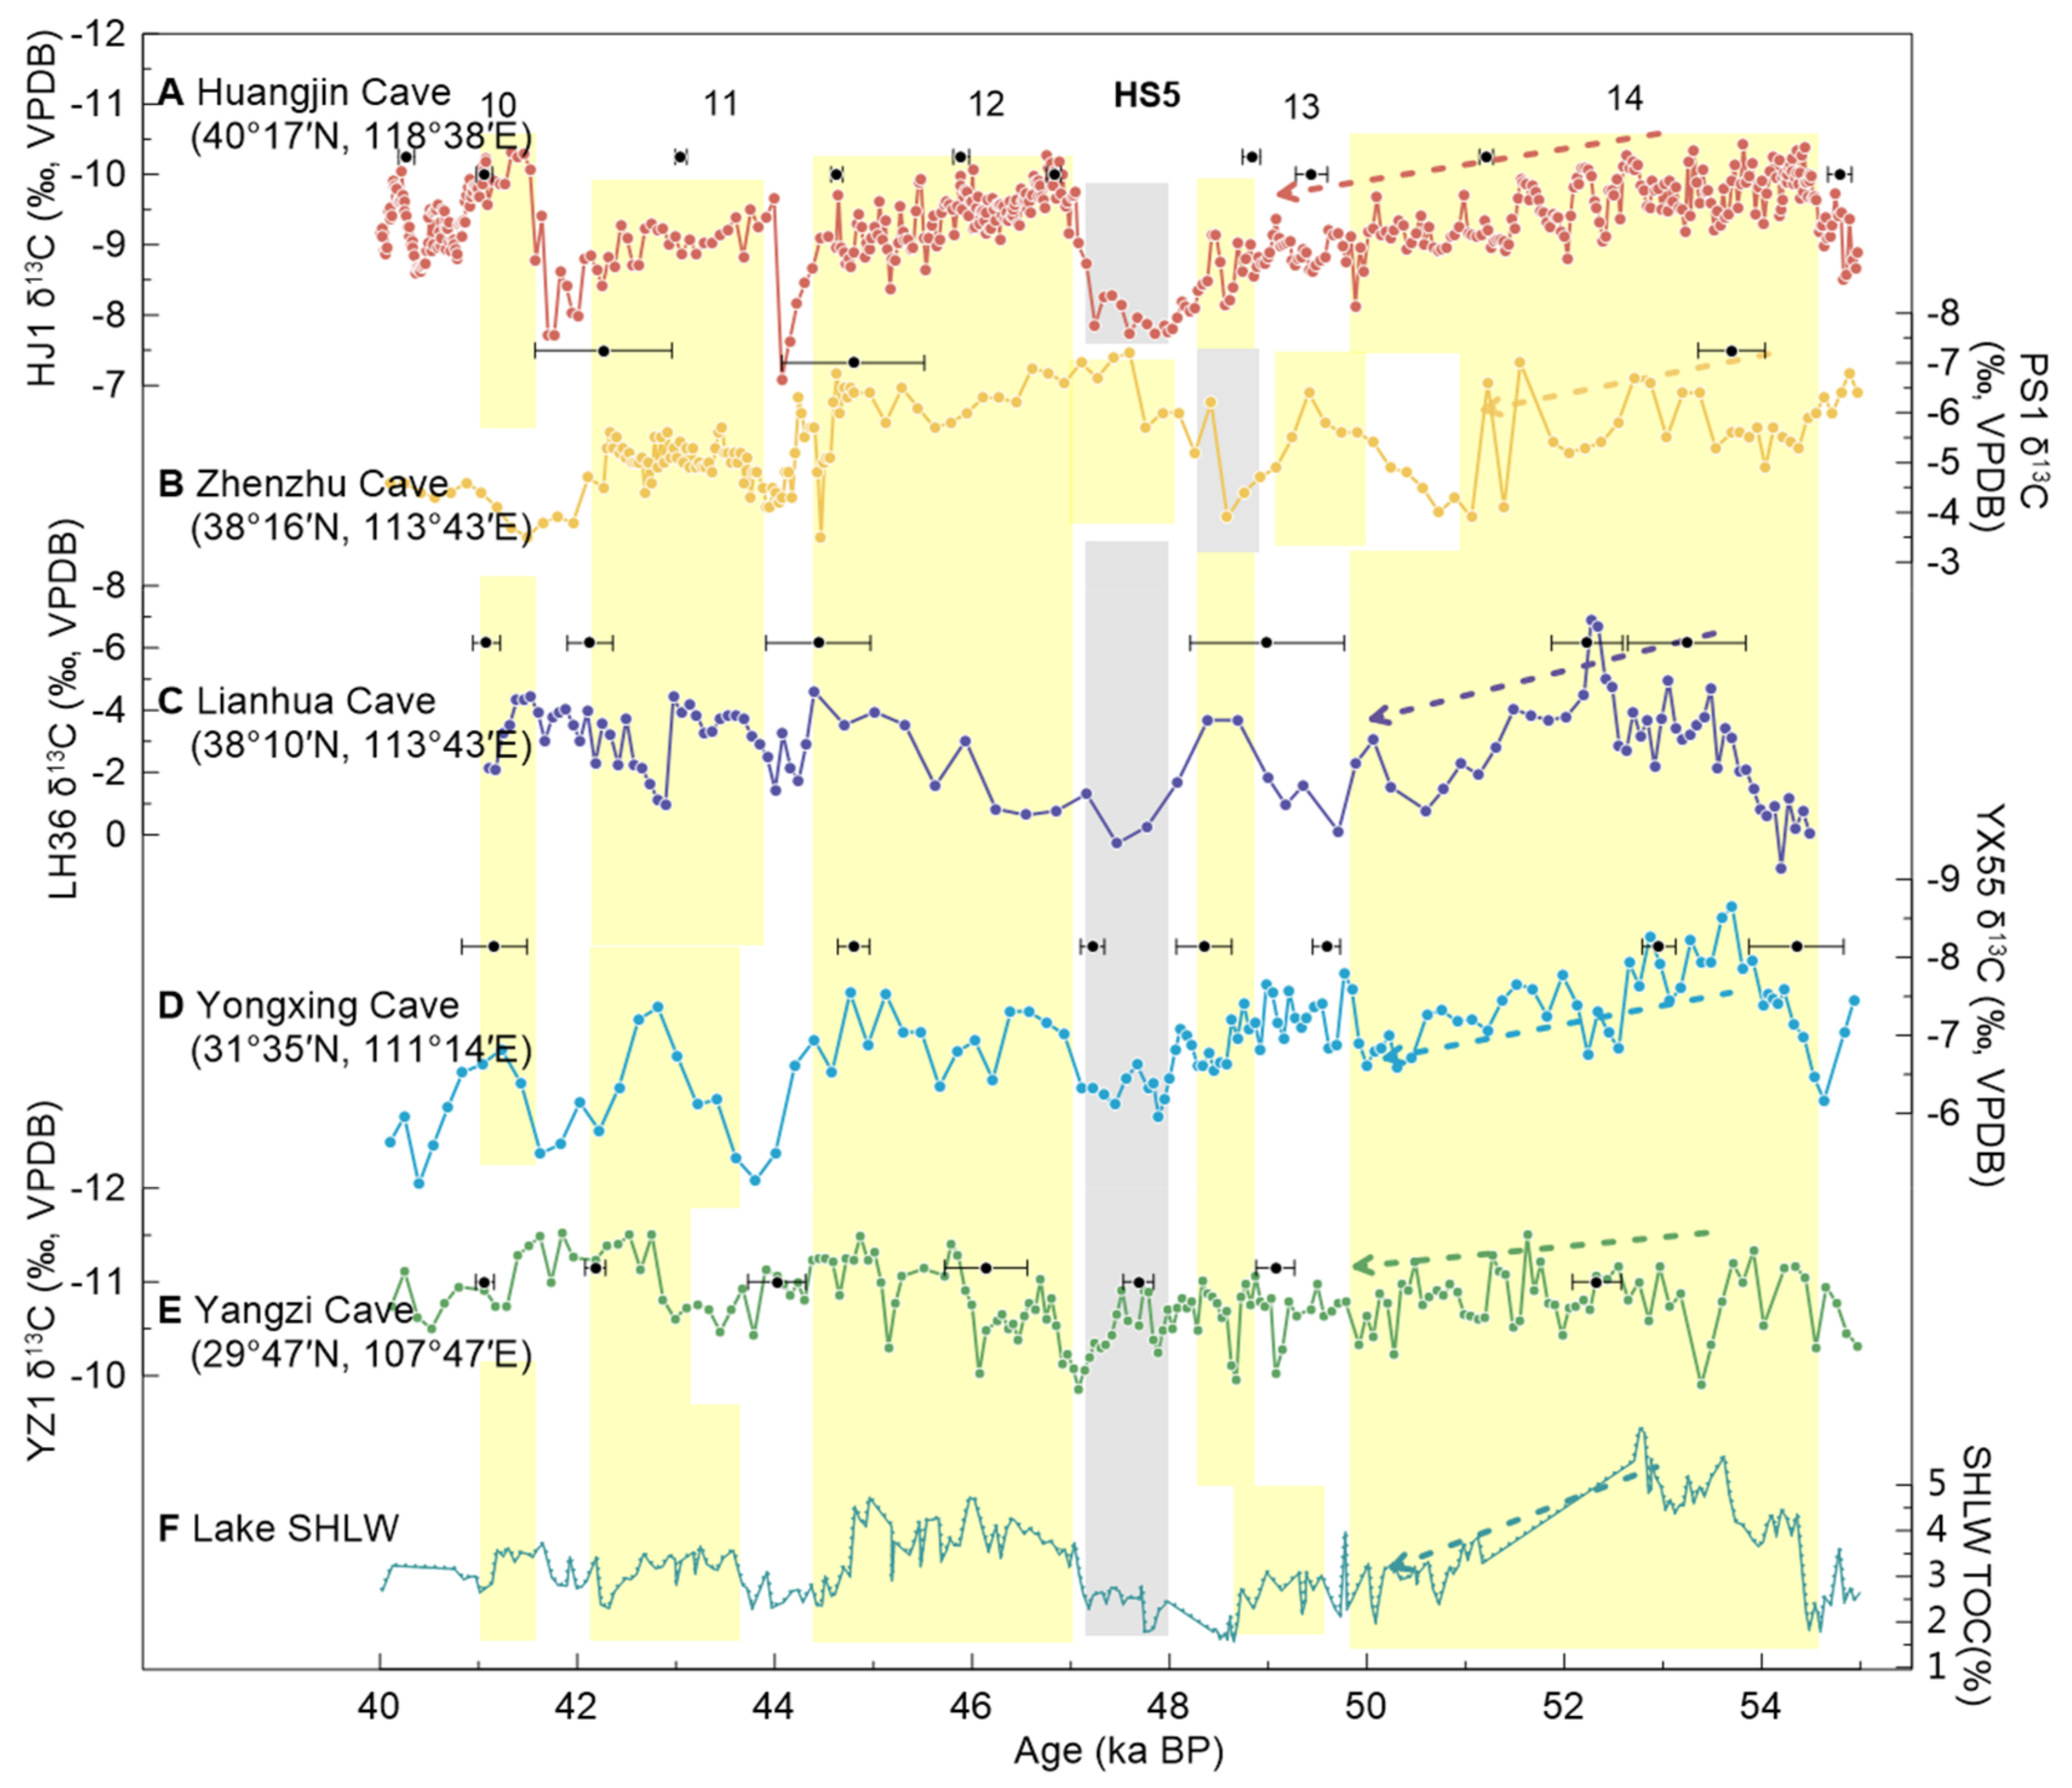
4.2. Millennial-Scale Abrupt Climate Events Recorded by Stalagmite δ13C Records

Continental-scale replication has been found in Chinese stalagmite δ18O records on the orbital and millennial timescales [8,9,12,13,27], suggesting the extensive consistency of precipitation δ18O signals across China under the control of the EASM circulation [20]. In contrast to the numerous researches on Chinese stalagmite δ18O during the last glacial period, studies of the δ13C records are scarce, especially regional comparisons in previous studies. Here, we attempt to compare and analyze cave δ13C records in the EASM domain during the MIS3 and explore their similarities and differences during the overlapping periods (Figure 4). Lianhua Cave and other four published caves, including Huangjin [26], Zhenzhu [19], Yongxing [22] and Yangzi [27], are all located between 29°N and 41°N in China (Figure 1). These five stalagmite δ13C records have independent 230Th-dated ages with a high sampling resolution. Within 230Th dating errors (54 to 160 years for HJ1, 339 to 722 years for PS1, 110 to 390 years for YX55 and 93 to 419 years for YZ1), these δ13C records have good replication during the overlapped time interval, including the same isotopic shifts in response to the millennial-scale events in the northern high latitudes, the same the transitional characteristics and the same duration of abrupt events (Figure 4). For instance, DO10 to 14 events and the HS5 can be identified in these δ13C records, with lighter δ13C during the DO warm stages and heavier δ13C values during the DO stadials and the HS events. Meanwhile, the δ13C values gradually increased during the interstadial of DO14, as shown by the dotted arrows in Figure 4. In addition, DO events all started relatively fast, within a few hundreds of years. Strong similarities between cave δ13C records in northern and southern China on the large space scale indicate that it is an effective proxy for climate, vegetation and soil CO2 production changes under the control of the EASM, even in different regions of China. However, we also find that there are north-south differences in the stalagmite δ13C records. For instance, three stalagmite δ13C records in northern China (Figure 4A–C) record higher amplitudes of variabilities during the millennial-scale oscillations, ranging from 2‰ to 5.8‰. However, the amplitudes of YX55 and YZ1 are relatively small (1‰–2‰). This north-south difference might be related to a higher sensitivity of the climate and vegetation changes in the monsoon fringe region.
A comparison with the NGRIP ice core δ18O record (Figure 5A) suggests that the similar characteristics of stalagmite δ13C sequences in different caves could be related to the millennial-scale northern high latitude temperature changes. Evidence include the similar shapes and rapid DO onsets in both stalagmite δ13C records and ice core δ18O records, the sawtooth structure of DO14 and the almost -equivalent time duration of DO events (Figure 4 and Figure 5A,D). Previous studies have shown that the land and oceans temperature in the mid-to-low latitudes of the northern hemisphere during the DO cycle is consistent with the temperature changes in the North Atlantic and high northern latitudes, and thus the northern hemisphere warms up during the interstadials and cools down during the stadials [6]. The extensive northern hemisphere cooling during stadials, due to the collapse/stagnation of the Atlantic Meridional Overturning Circulation (AMOC) [52,53] causes southward shifts in the Intertropical Convergence Zone (ITCZ) [54], leading to the weakening of the EASM [8]. Such cooling also causes an increased dust flux from Euro-Asia continent to Greenland (Figure 5B). The weakening of the monsoon results in a decrease in precipitation, and dry and cold stadial conditions then lead to deteriorated vegetation and a decreased C3/C4 ratio in both northern and southern China, leading to heavier stalagmite δ13C values (Figure 4). In addition, the climate in the northern high latitudes can also adjust the hydrothermal conditions in China through the mid-latitude westerly belt or the Eurasian remote control function [29,55], and further affects the changes in the environmental climate outside the caves and vegetation biomass, thus controlling the stalagmite δ13C values. It is obvious that during DO cycles, the northern/southern position of the westerlies is consistent with warming/cooling in Greenland (Figure 5A–C). However, during the DO interstadials, the recovery of the AMOC warms up the northern hemisphere and the northward migration of the ITCZ, thus transporting more oceanic moisture to the EASM region. With improved moisture and thermal conditions, C3 vegetation flourishes and C4 vegetation growth is inhibited under humid conditions. At the same time, the soil respiration is enhanced and soil CO2 levels increase, resulting in lighter stalagmite δ13C. Therefore, the cave stalagmite δ13C records can be indicative of the EASM intensity and the regional ecological environment under monsoonal control, and its similarity to the millennial-scale Greenland ice core climate fluctuations suggests that the low-latitude monsoon can respond to abrupt climate events at high northern latitudes through rapid air-sea coupling.

5. Conclusions

Based on six high-precision 230Th dating experiments and 108 sets of δ18O and δ13C data of the stalagmite LH36 in Lianhua Cave, we reconstructed climatic and environmental change sequences on the eastern margin of the Chinese Loess Plateau from 54.5–41.1 ka BP, covering DO10–14 events and the HS5 event with an average resolution of 120 years. A comparison with δ13C records from four other caves across China between 29 and 41°N shows good replication during the overlapped interval, with more negative δ13C values during interstadials and more positive δ13C values during stadials. Considering the trace metal results and the millennial-scale similarities with cave, lake and loess records, we suggest that LH36 δ13C is mainly related to the terrestrial CO2 production above the cave and could reflect monsoon intensity. The consistent millennial-scale changes in these Chinese cave δ13C records are possibly tele-connected with temperature changes in Greenland, due to the one-to-one correspondence with the DO events recorded by the Greenland ice core. During the DO interstadials, following warming of the northern hemisphere, monsoonal intensification and improved hydro-thermal conditions, the ratio of C3/C4 vegetation, the vegetation coverage and biomass production increased, causing negative shifts in calcite δ13C values. Additionally, the conditions are the opposite during the stadials. The continental-scale consistency recorded by cave stalagmite δ13C records indicates that the Asian monsoon and the regional ecological environment under monsoonal control could respond to abrupt climate events in the northern high latitudes through an air-sea teleconnection.

Supplementary Materials

The following supporting information can be downloaded at: https://www.mdpi.com/article/10.3390/geosciences13050136/s1, Figure S1: X-ray diffraction results of stalagmite LH36; Figure S2: Hendy test results for stalagmite LH36; Figure S3: Multi-proxy records and the PCP test results for stalagmite LH36; Table S1: 230Th/U dating results for stalagmite LH36 from Lianhua Cave; Table S2: Pearson correlation coefficients for LH36 proxies.

Author Contributions

Conceptualization, J.D.; formal analysis, R.S. and P.Z.; investigation, R.S., P.Z., J.C., J.L. and X.L.; resources, J.D.; data curation, R.S.; writing—original draft preparation, R.S., P.Z., J.C., J.L. and X.L.; writing—review and editing, L.T., J.D. and Y.L.; supervision, J.D. and Y.L.; funding acquisition, P.Z., J.D. and Y.L. All authors have read and agreed to the published version of the manuscript.

Funding

This research was funded by the National Nature Science Foundation of China (awards no. 41877287 and 42207505), the State Key Laboratory of Loess and Quaternary Geology, the Institute of Earth Environment, CAS (award no. SKLLQG2120) and the National College Students’ innovation and entrepreneurship training program (award no. 202210304059Z).

Data Availability Statement

The data have been posted to a trusted repository, and which is located at Mendeley deposit: http://dx.doi.org/10.17632/8tpj7swhxs.1 (accessed on 1 May 2023).

Acknowledgments

We thank the reviewers and editors for their constructive suggestions which greatly improved our manuscript.

Conflicts of Interest

The authors declare no conflict of interest.

References

  1. Heinrich, H. Origin and Consequences of Cyclic Ice Rafting in the Northeast Atlantic Ocean during the Past 130,000 Years. Quat. Res. 1988, 29, 142–152. [Google Scholar] [CrossRef]
  2. Grootes, P.M.; Stuiver, M.; White, J.W.C.; Johnsen, S.; Jouzel, J. Comparison of Oxygen Records from the GISP2 and GRIP Greenland Ice Cores. Nature 1993, 366, 552–554. [Google Scholar] [CrossRef]
  3. Dansgaard, W.; Johnsen, S.J.; Clausen, H.B.; Dahl-Jensen, D.; Gundestrup, N.S.; Hammer, C.U.; Hvidberg, C.S.; Steffensen, J.P.; Sveinbjörnsdottir, A.E.; Jouzel, J. Evidence for General Instability of Past Climate from a 250-Kyr Ice Core Record. Nature 1993, 364, 218–220. [Google Scholar] [CrossRef]
  4. Seierstad, I.K.; Abbott, P.M.; Bigler, M.; Blunier, T.; Bourne, A.J.; Brook, E.; Buchardt, S.L.; Buizert, C.; Clausen, H.B.; Cook, E.; et al. Consistently Dated Records from the Greenland GRIP, GISP2 and NGRIP Ice Cores for the Past 104 Ka Reveal Regional Millennial-Scale δ18O Gradients with Possible Heinrich Event Imprint. Quat. Sci. Rev. 2014, 106, 29–46. [Google Scholar] [CrossRef]
  5. Naafs, B.D.A.; Hefter, J.; Grützner, J.; Stein, R. Warming of Surface Waters in the Mid-Latitude North Atlantic during Heinrich Events: High SSTs during Heinrich events. Paleoceanography 2013, 28, 153–163. [Google Scholar] [CrossRef]
  6. Voelker, A.H.L. Global Distribution of Centennial-Scale Records for Marine Isotope Stage (MIS) 3: A Database. Quat. Sci. Rev. 2002, 21, 1185–1212. [Google Scholar] [CrossRef]
  7. Wang, X.; Edwards, R.L.; Auler, A.S.; Cheng, H.; Kong, X.; Wang, Y.; Cruz, F.W.; Dorale, J.A.; Chiang, H.-W. Hydroclimate Changes across the Amazon Lowlands over the Past 45,000 Years. Nature 2017, 541, 204–207. [Google Scholar] [CrossRef]
  8. Wang, Y.J.; Cheng, H.; Edwards, R.L.; An, Z.S.; Wu, J.Y.; Shen, C.-C.; Dorale, J.A. A High-Resolution Absolute-Dated Late Pleistocene Monsoon Record from Hulu Cave, China. Science 2001, 294, 2345–2348. [Google Scholar] [CrossRef]
  9. Dong, J.; Shen, C.-C.; Wang, Y.; Hu, H.-M.; Banerjee, Y.; Huang, W. Multicentennial to Millennial–Scale Changes in the East Asian Summer Monsoon during Greenland Interstadial 25. Quat. Res. 2022, 109, 195–206. [Google Scholar] [CrossRef]
  10. Carolin, S.A.; Cobb, K.M.; Adkins, J.F.; Clark, B.; Conroy, J.L.; Lejau, S.; Malang, J.; Tuen, A.A. Varied Response of Western Pacific Hydrology to Climate Forcings over the Last Glacial Period. Science 2013, 340, 1564–1566. [Google Scholar] [CrossRef]
  11. Woods, A.; Rodbell, D.T.; Abbott, M.B.; Hatfield, R.G.; Chen, C.Y.; Lehmann, S.B.; McGee, D.; Weidhaas, N.C.; Tapia, P.M.; Valero-Garcés, B.L.; et al. Andean Drought and Glacial Retreat Tied to Greenland Warming during the Last Glacial Period. Nat. Commun. 2020, 11, 5135. [Google Scholar] [CrossRef] [PubMed]
  12. Wang, Y.; Cheng, H.; Edwards, R.L.; Kong, X.; Shao, X.; Chen, S.; Wu, J.; Jiang, X.; Wang, X.; An, Z. Millennial- and Orbital-Scale Changes in the East Asian Monsoon over the Past 224,000 Years. Nature 2008, 451, 1090–1093. [Google Scholar] [CrossRef]
  13. Cheng, H.; Edwards, R.L.; Sinha, A.; Spötl, C.; Yi, L.; Chen, S.; Kelly, M.; Kathayat, G.; Wang, X.; Li, X.; et al. The Asian Monsoon over the Past 640,000 Years and Ice Age Terminations. Nature 2016, 534, 640–646. [Google Scholar] [CrossRef] [PubMed]
  14. Maher, B.A. Holocene Variability of the East Asian Summer Monsoon from Chinese Cave Records: A Re-Assessment. Holocene 2008, 18, 861–866. [Google Scholar] [CrossRef]
  15. Dayem, K.E.; Molnar, P.; Battisti, D.S.; Roe, G.H. Lessons Learned from Oxygen Isotopes in Modern Precipitation Applied to Interpretation of Speleothem Records of Paleoclimate from Eastern Asia. Earth Planet. Sci. Lett. 2010, 295, 219–230. [Google Scholar] [CrossRef]
  16. Caley, T.; Roche, D.M.; Renssen, H. Orbital Asian Summer Monsoon Dynamics Revealed Using an Isotope-Enabled Global Climate Model. Nat. Commun. 2014, 5, 5371. [Google Scholar] [CrossRef]
  17. Chiang, J.C.H.; Herman, M.J.; Yoshimura, K.; Fung, I.Y. Enriched East Asian Oxygen Isotope of Precipitation Indicates Reduced Summer Seasonality in Regional Climate and Westerlies. Proc. Natl. Acad. Sci. USA 2020, 117, 14745–14750. [Google Scholar] [CrossRef]
  18. Cheng, H.; Zhang, H.; Zhao, J.; Li, H.; Ning, Y.; Kathayat, G. Chinese Stalagmite Paleoclimate Researches: A Review and Perspective. Sci. China Earth Sci. 2019, 62, 1489–1513. [Google Scholar] [CrossRef]
  19. Li, Y.; Rao, Z.; Xu, Q.; Zhang, S.; Liu, X.; Wang, Z.; Cheng, H.; Edwards, R.L.; Chen, F. Inter-Relationship and Environmental Significance of Stalagmite δ18O and δ13C Records from Zhenzhu Cave, North China, over the Last 130 Ka. Earth Planet. Sci. Lett. 2020, 536, 116149. [Google Scholar] [CrossRef]
  20. He, C.; Liu, Z.; Otto-Bliesner, B.L.; Brady, E.C.; Zhu, C.; Tomas, R.; Clark, P.U.; Zhu, J.; Jahn, A.; Gu, S.; et al. Hydroclimate Footprint of Pan-Asian Monsoon Water Isotope during the Last Deglaciation. Sci. Adv. 2021, 7, eabe2611. [Google Scholar] [CrossRef]
  21. Fohlmeister, J.; Voarintsoa, N.R.G.; Lechleitner, F.A.; Boyd, M.; Brandtstätter, S.; Jacobson, M.J.L.; Oster, J. Main Controls on the Stable Carbon Isotope Composition of Speleothems. Geochim. Cosmochim. Acta 2020, 279, 67–87. [Google Scholar] [CrossRef]
  22. Wang, M.; Chen, S.; Wang, Y.; Zhao, K.; Wang, X.; Liang, Y.; Wang, Z.; Zhang, Z.; Chen, G. Stalagmite Multi-Proxy Evidence of Wet and Dry Intervals in the Middle Yangtze Valley during the Last Glacial Period. Palaeogeogr. Palaeoclim. Palaeoecol. 2022, 586, 110764. [Google Scholar] [CrossRef]
  23. Huang, W.; Dong, J.; Shao, Q.; Duan, F.; Wang, Y. Strong Coupling of the East Asian Summer Monsoon and Hydroclimate Footprints during 53–47 Ka. Palaeogeogr. Palaeoclim. Palaeoecol. 2022, 597, 111003. [Google Scholar] [CrossRef]
  24. Zhang, H.; Cheng, H.; Sinha, A.; Spötl, C.; Cai, Y.; Liu, B.; Kathayat, G.; Li, H.; Tian, Y.; Li, Y.; et al. Collapse of the Liangzhu and Other Neolithic Cultures in the Lower Yangtze Region in Response to Climate Change. Sci. Adv. 2021, 7, eabi9275. [Google Scholar] [CrossRef] [PubMed]
  25. Kong, X.; Wang, Y.; Wu, J.; Cheng, H.; Edwards, R.L.; Wang, X. Complicated Responses of Stalagmite δ13C to Climate Change during the Last Glaciation from Hulu Cave, Nanjing, China. Sci. China Ser. D Earth Sci. 2005, 48, 2174–2181. [Google Scholar] [CrossRef]
  26. Liang, Y.; Zhao, K.; Wang, Y.; Edwards, R.L.; Cheng, H.; Shao, Q.; Chen, S.; Wang, J.; Zhu, J. Different Response of Stalagmite δ18O and δ13C to Millennial-Scale Events during the Last Glacial, Evidenced from Huangjin Cave, Northern China. Quat. Sci. Rev. 2022, 276, 107305. [Google Scholar] [CrossRef]
  27. Wu, Y.; Li, T.-Y.; Yu, T.-L.; Shen, C.-C.; Chen, C.-J.; Zhang, J.; Li, J.-Y.; Wang, T.; Huang, R.; Xiao, S.-Y. Variation of the Asian Summer Monsoon since the Last Glacial-Interglacial Recorded in a Stalagmite from Southwest China. Quat. Sci. Rev. 2020, 234, 106261. [Google Scholar] [CrossRef]
  28. Mingram, J.; Stebich, M.; Schettler, G.; Hu, Y.; Rioual, P.; Nowaczyk, N.; Dulski, P.; You, H.; Opitz, S.; Liu, Q.; et al. Millennial-Scale East Asian Monsoon Variability of the Last Glacial Deduced from Annually Laminated Sediments from Lake Sihailongwan, N.E. China. Quat. Sci. Rev. 2018, 201, 57–76. [Google Scholar] [CrossRef]
  29. Nagashima, K.; Tada, R.; Tani, A.; Sun, Y.; Isozaki, Y.; Toyoda, S.; Hasegawa, H. Millennial-Scale Oscillations of the Westerly Jet Path during the Last Glacial Period. J. Asian Earth Sci. 2011, 40, 1214–1220. [Google Scholar] [CrossRef]
  30. Shen, C.-C.; Wu, C.-C.; Cheng, H.; Lawrence Edwards, R.; Hsieh, Y.-T.; Gallet, S.; Chang, C.-C.; Li, T.-Y.; Lam, D.D.; Kano, A.; et al. High-Precision and High-Resolution Carbonate 230Th Dating by MC-ICP-MS with SEM Protocols. Geochim. Cosmochim. Acta 2012, 99, 71–86. [Google Scholar] [CrossRef]
  31. Shao, Q.-F.; Pons-Branchu, E.; Zhu, Q.-P.; Wang, W.; Valladas, H.; Fontugne, M. High Precision U/Th Dating of the Rock Paintings at Mt. Huashan, Guangxi, Southern China. Quat. Res. 2017, 88, 1–13. [Google Scholar] [CrossRef]
  32. Hendy, C.H. The Isotopic Geochemistry of Speleothems—I. The Calculation of the Effects of Different Modes of Formation on the Isotopic Composition of Speleothems and Their Applicability as Palaeoclimatic Indicators. Geochim. Cosmochim. Acta 1971, 35, 801–824. [Google Scholar] [CrossRef]
  33. Jaffey, A.H.; Flynn, K.F.; Glendenin, L.E.; Bentley, W.C.; Essling, A.M. Precision Measurement of Half-Lives and Specific Activities of U 235 and U 238. Phys. Rev. C 1971, 4, 1889–1906. [Google Scholar] [CrossRef]
  34. Cheng, H.; Edwards, R.L.; Shen, C.-C.; Polyak, V.J.; Asmerom, Y.; Woodhead, J.; Hellstrom, J.; Wang, Y.; Kong, X.; Spötl, C.; et al. Improvements in 230Th Dating, 230Th and 234U Half-Life Values, and U–Th Isotopic Measurements by Multi-Collector Inductively Coupled Plasma Mass Spectrometry. Earth Planet. Sci. Lett. 2013, 371–372, 82–91. [Google Scholar] [CrossRef]
  35. Dorale, J.A.; Liu, Z. Limitations of Hendy Test Criteria in Judging the Paleoclimatic Suitability of Speleothems and the Need for Replication. J. Cave Karst Stud. 2009, 71, 73–80. [Google Scholar]
  36. Liang, Y.; Zhao, K.; Edwards, R.L.; Wang, Y.; Shao, Q.; Zhang, Z.; Zhao, B.; Wang, Q.; Cheng, H.; Kong, X. East Asian Monsoon Changes Early in the Last Deglaciation and Insights into the Interpretation of Oxygen Isotope Changes in the Chinese Stalagmite Record. Quat. Sci. Rev. 2020, 250, 106699. [Google Scholar] [CrossRef]
  37. Genty, D.; Baker, A.; Massault, M.; Proctor, C.; Gilmour, M.; Pons-Branchu, E.; Hamelin, B. Dead Carbon in Stalagmites: Carbonate Bedrock Paleodissolution vs. Ageing of Soil Organic Matter. Implications for 13C Variations in Speleothems. Geochim. Cosmochim. Acta 2001, 65, 3443–3457. [Google Scholar] [CrossRef]
  38. Yang, H.; Wang, B.; Sun, L.; Ren, J.; Huang, Z.; Wu, C. Characteristics of Oxygen and Carbon Stable Isotopes for Middle Ordovician Majiagou Formation Carbonate Rocks in the Ordos Basinz. Nat. Gas Geosci. 2012, 23, 616–625. [Google Scholar]
  39. Fairchild, I.; McMillan, E. Speleothems as Indicators of Wet and Dry Periods. Int. J. Speleol. 2007, 36, 69–74. [Google Scholar] [CrossRef]
  40. McDermott, F. Palaeo-Climate Reconstruction from Stable Isotope Variations in Speleothems: A Review. Quat. Sci. Rev. 2004, 23, 901–918. [Google Scholar] [CrossRef]
  41. Genty, D.; Blamart, D.; Ouahdi, R.; Gilmour, M.; Baker, A.; Jouzel, J.; Van-Exter, S. Precise Dating of Dansgaard–Oeschger Climate Oscillations in Western Europe from Stalagmite Data. Nature 2003, 421, 833–837. [Google Scholar] [CrossRef] [PubMed]
  42. Campos, M.C.; Chiessi, C.M.; Voigt, I.; Piola, A.R.; Kuhnert, H.; Mulitza, S. Δ13C Decreases in the Upper Western South Atlantic during Heinrich Stadials 3 and 2. Clim. Past 2017, 13, 345–358. [Google Scholar] [CrossRef]
  43. Dorale, J.A.; Gonzalez, L.A.; Reagan, M.K.; Pickett, D.A.; Murrell, M.T.; Baker, R.G. A High-Resolution Record of Holocene Climate Change in Speleothem Calcite from Cold Water Cave, Northeast Iowa. Science 1992, 258, 1626–1630. [Google Scholar] [CrossRef] [PubMed]
  44. Huang, W.; Wang, Y.; Cheng, H.; Edwards, R.L.; Shen, C.-C.; Liu, D.; Shao, Q.; Deng, C.; Zhang, Z.; Wang, Q. Multi-Scale Holocene Asian Monsoon Variability Deduced from a Twin-Stalagmite Record in Southwestern China. Quat. Res. 2016, 86, 34–44. [Google Scholar] [CrossRef]
  45. Sinclair, D.J.; Banner, J.L.; Taylor, F.W.; Partin, J.; Jenson, J.; Mylroie, J.; Goddard, E.; Quinn, T.; Jocson, J.; Miklavič, B. Magnesium and Strontium Systematics in Tropical Speleothems from the Western Pacific. Chem. Geol. 2012, 294, 1–17. [Google Scholar] [CrossRef]
  46. Zhou, B.; Shen, C.; Zheng, H.; Zhao, M.; Sun, Y. Vegetation Evolution on the Central Chinese Loess Plateau since Late Quaternary Evidenced by Elemental Carbon Isotopic Composition. Sci. Bull. 2009, 54, 2082–2089. [Google Scholar] [CrossRef]
  47. Sun, Y.; Kutzbach, J.; An, Z.; Clemens, S.; Liu, Z.; Liu, W.; Liu, X.; Shi, Z.; Zheng, W.; Liang, L.; et al. Astronomical and Glacial Forcing of East Asian Summer Monsoon Variability. Quat. Sci. Rev. 2015, 115, 132–142. [Google Scholar] [CrossRef]
  48. Sun, B.; Liu, W.; Sun, Y.; An, Z. The Precipitation “Threshold Value” on C4/C3 Abundance of the Loess Plateau, China. Sci. Bull. 2015, 60, 718–725. [Google Scholar] [CrossRef]
  49. Yin, J.-J.; Li, H.-C.; Rao, Z.-G.; Shen, C.-C.; Mii, H.-S.; Pillutla, R.K.; Hu, H.-M.; Li, Y.-X.; Feng, X. Variations of Monsoonal Rain and Vegetation during the Past Millennium in Tiangui Mountain, North China Reflected by Stalagmite Δ18O and Δ13C Records from Zhenzhu Cave. Quat. Int. 2017, 447, 89–101. [Google Scholar] [CrossRef]
  50. Li, Y.; Zhang, S.; Liu, X.; Gao, Y.; Rao, Z. Variations of the Stable Isotopic Composition of Precipitation and Cave Drip Water at Zhenzhu Cave, North China: A Two-Year Monitoring Study. J. Cave Karst Stud. 2019, 81, 123–135. [Google Scholar] [CrossRef]
  51. Wu, X.; Ding, M.; Hou, D.; Sun, W.; Du, W.; Zhang, D. Time-frequency analysis of carbon isotope record of stalagmite from Wanxiang cave, western loess plateau, during the late of last glacial. J. Arid Land Res. Environ. 2012, 26, 42–47. [Google Scholar]
  52. Krebs, U.; Timmermann, A. Tropical Air–Sea Interactions Accelerate the Recovery of the Atlantic Meridional Overturning Circulation after a Major Shutdown. J. Clim. 2007, 20, 4940–4956. [Google Scholar] [CrossRef]
  53. Broccoli, A.J.; Dahl, K.A.; Stouffer, R.J. Response of the ITCZ to Northern Hemisphere Cooling. Geophys. Res. Lett. 2006, 33, L01702. [Google Scholar] [CrossRef]
  54. Chiang, J.C.H.; Friedman, A.R. Extratropical Cooling, Interhemispheric Thermal Gradients, and Tropical Climate Change. Annu. Rev. Earth Planet. Sci. 2012, 40, 383–412. [Google Scholar] [CrossRef]
  55. Hong, X.; Lu, R.; Li, S. Amplified Summer Warming in Europe–West Asia and Northeast Asia after the Mid-1990s. Environ. Res. Lett. 2017, 12, 094007. [Google Scholar] [CrossRef]
  56. North Greenland Ice Core Project Members. High-Resolution Record of Northern Hemisphere Climate Extending into the Last Interglacial Period. Nature 2004, 431, 147–151. [Google Scholar] [CrossRef]
  57. Svensson, A.; Andersen, K.K.; Bigler, M.; Clausen, H.B.; Dahl-Jensen, D.; Davies, S.M.; Johnsen, S.J.; Muscheler, R.; Parrenin, F.; Rasmussen, S.O.; et al. A 60,000 Year Greenland Stratigraphic Ice Core Chronology. Clim. Past 2008, 4, 47–57. [Google Scholar] [CrossRef]
  58. Erhardt, T.; Capron, E.; Rasmussen, S.O.; Schüpbach, S.; Bigler, M.; Adolphi, F.; Fischer, H. Decadal-Scale Progression of the Onset of Dansgaard–Oeschger Warming Events. Clim. Past 2019, 15, 811–825. [Google Scholar] [CrossRef]
Figure 1. Regional climatology and cave sites. NCEP/NCAR May to August (MJJA) daily precipitation (mm/day) and 850 hPa wind vectors (m/s) averaged from 1983 to 2012. The cave sites are Lianhua Cave (113°43′ E, 38°10′ N, this study), Zhenzhu Cave (113°42′ E, 38°15′ N [19]), Huangjin Cave (118°38′ E, 40°17′ N [26]), Yongxing Cave (111°14′ E, 31°35′ N [22])and Yangzi Cave (107°47′ E, 29°47′ N [27]). Other research sites used in this paper are Sihailongwan (SHLW) Lake [28] and MD01-2407 [29].
Geosciences 13 00136 g001
Figure 2. Age model and polished surface of stalagmite LH36. In the left panel, the black dots and error bars represent the measured ages and errors, respectively. The solid black line is the linearly interpolated age models. In the right panel, the black strips on the stalagmite section are the sampling locations of the dating samples. The orange dotted lines are sedimentary hiatuses. The data from 61.4 ± 0.5 ka BP are the one under the hiatus and are thus not used for chronology establishment.
Geosciences 13 00136 g002
Figure 3. Stable isotope proxy records for stalagmite LH36 and a comparison with δ18O records from other caves. Grey shaded bars indicate the HS5 event, and yellow bars and numbers indicate interstadial in DO10 to 14 events. δ18O records from (A) Huangjin Cave [26], (B) Zhenzhu Cave [19], (C,D) Lianhua Cave (this study) and (E) Yongxing Cave [22].
Geosciences 13 00136 g003
Figure 4. Comparison of geological records in the EASM domain. δ13C records from (A) Huangjin Cave [26], (B) Zhenzhu Cave [19], (C) Lianhua Cave (this study), (D) Yongxing Cave [22] and (E) Yangzi Cave [27]. (F) Total organic carbon record of Lake Sihailongwan (SHLW); high values indicate a stronger biogenic production [28]. Dashed arrows indicate the slope of DO14 interstadial. The gray shaded bar indicates the HS5 event and yellow bars and numbers indicate DO10 to 14 events.
Geosciences 13 00136 g004
Figure 5. Comparison of geological records. (A) δ18O record of NGRIP ice core on the GICC05 chronology [56,57,58]. (B) NGRIP ice core Ca2+ record [58]. (C) Electron spin resonance (ESR) intensity of core MD01-2407 in the Japanese Sea; high values indicate a dominance of dust with a Mongolian Gobi provenance and suggest a southward shift in the westerly jet [29]. (D) Total organic carbon record of Sihailongwan (SHLW) Lake; high values indicate a stronger biogenic production [28]. Gray bars indicate the HS5 event and numerical values indicate DO events. Dashed arrows indicate the changing trend of DO14 in each record.
Geosciences 13 00136 g005
Disclaimer/Publisher’s Note: The statements, opinions and data contained in all publications are solely those of the individual author(s) and contributor(s) and not of MDPI and/or the editor(s). MDPI and/or the editor(s) disclaim responsibility for any injury to people or property resulting from any ideas, methods, instructions or products referred to in the content.

