1. Introduction
The active layer refers to horizons at and near the ground surface in permafrost-affected soils that freeze and thaw annually. Active layer thickness (ALT), or the maximum depth of annually thawed soil, is a critical parameter for ecosystems and hydrological processes in permafrost terrain that interact with and are dependent on this dynamic soil zone. With the effects of global climatic change amplified in the high latitude regions [
1,
2], the response of the permafrost system, and specifically ALT, to climate change is of considerable interest to a variety of scientific and engineering applications [
3,
4,
5].
Climate is understood as a first-order control on both permafrost and ALT. It is therefore assumed that as air temperature increases, permafrost will warm and thaw, corresponding to a thickening of the active layer. Many broad-scale modeling studies have focused on potential permafrost responses to projected climate changes using the Intergovernmental Panel on Climate Change (IPCC) scenario approach. Such studies suggest an anticipated progressive increase in active layer thickness across the rapidly warming Arctic [
6,
7,
8]. These regional to circumarctic projections have important implications for biological and hydrological processes [
9,
10,
11], which can significantly impact the function of terrestrial ecosystems. Moreover, it has been recognized that active layer thickening can intensify the production of biogenic methane and carbon dioxide [
12,
13], which, when introduced into the atmosphere, can fuel a positive feedback mechanism, further promoting warming [
14,
15].
However, observational evidence suggests that although warming is generally occurring throughout the circumpolar north [
2], the long-term active layer trends are less directly linked to increasing air temperatures. While active layer thickening trends are reported from Scandinavia [
16], Russian [
17], and Alaskan [
18] sub-Arctic sites, a number of Arctic monitoring sites demonstrate relative ALT stability and, in some instances, a decrease in ALT, despite atmospheric warming [
3].
The observed decoupling of the active layer from air temperature trends indicates that this relationship between the ground thermal regime and climate is complicated by vegetation dynamics, snow thickness, precipitation timing and duration, as well as substrate properties, such as soil texture and moisture, and possibly other landscape-specific factors [
19]. Moreover, ongoing pronounced changes in Arctic ecosystems in response to changing climate result in numerous positive and negative feedbacks [
20] that can significantly affect the sensitivity of the active layer to climatic variability and change. At present, the role of landscape evolution in active layer change is not fully understood due to the limited amount of empirical information.
In this paper, we present the results of long-term active layer observations from a representative sample of permafrost-affected landscape units characteristic of typical tundra of the western part of the Yamal Peninsula in West Siberia. The analysis is focused on the role of soil moisture, ground ice, and vegetation dynamics impacting observed active layer trends.
2. Study Area
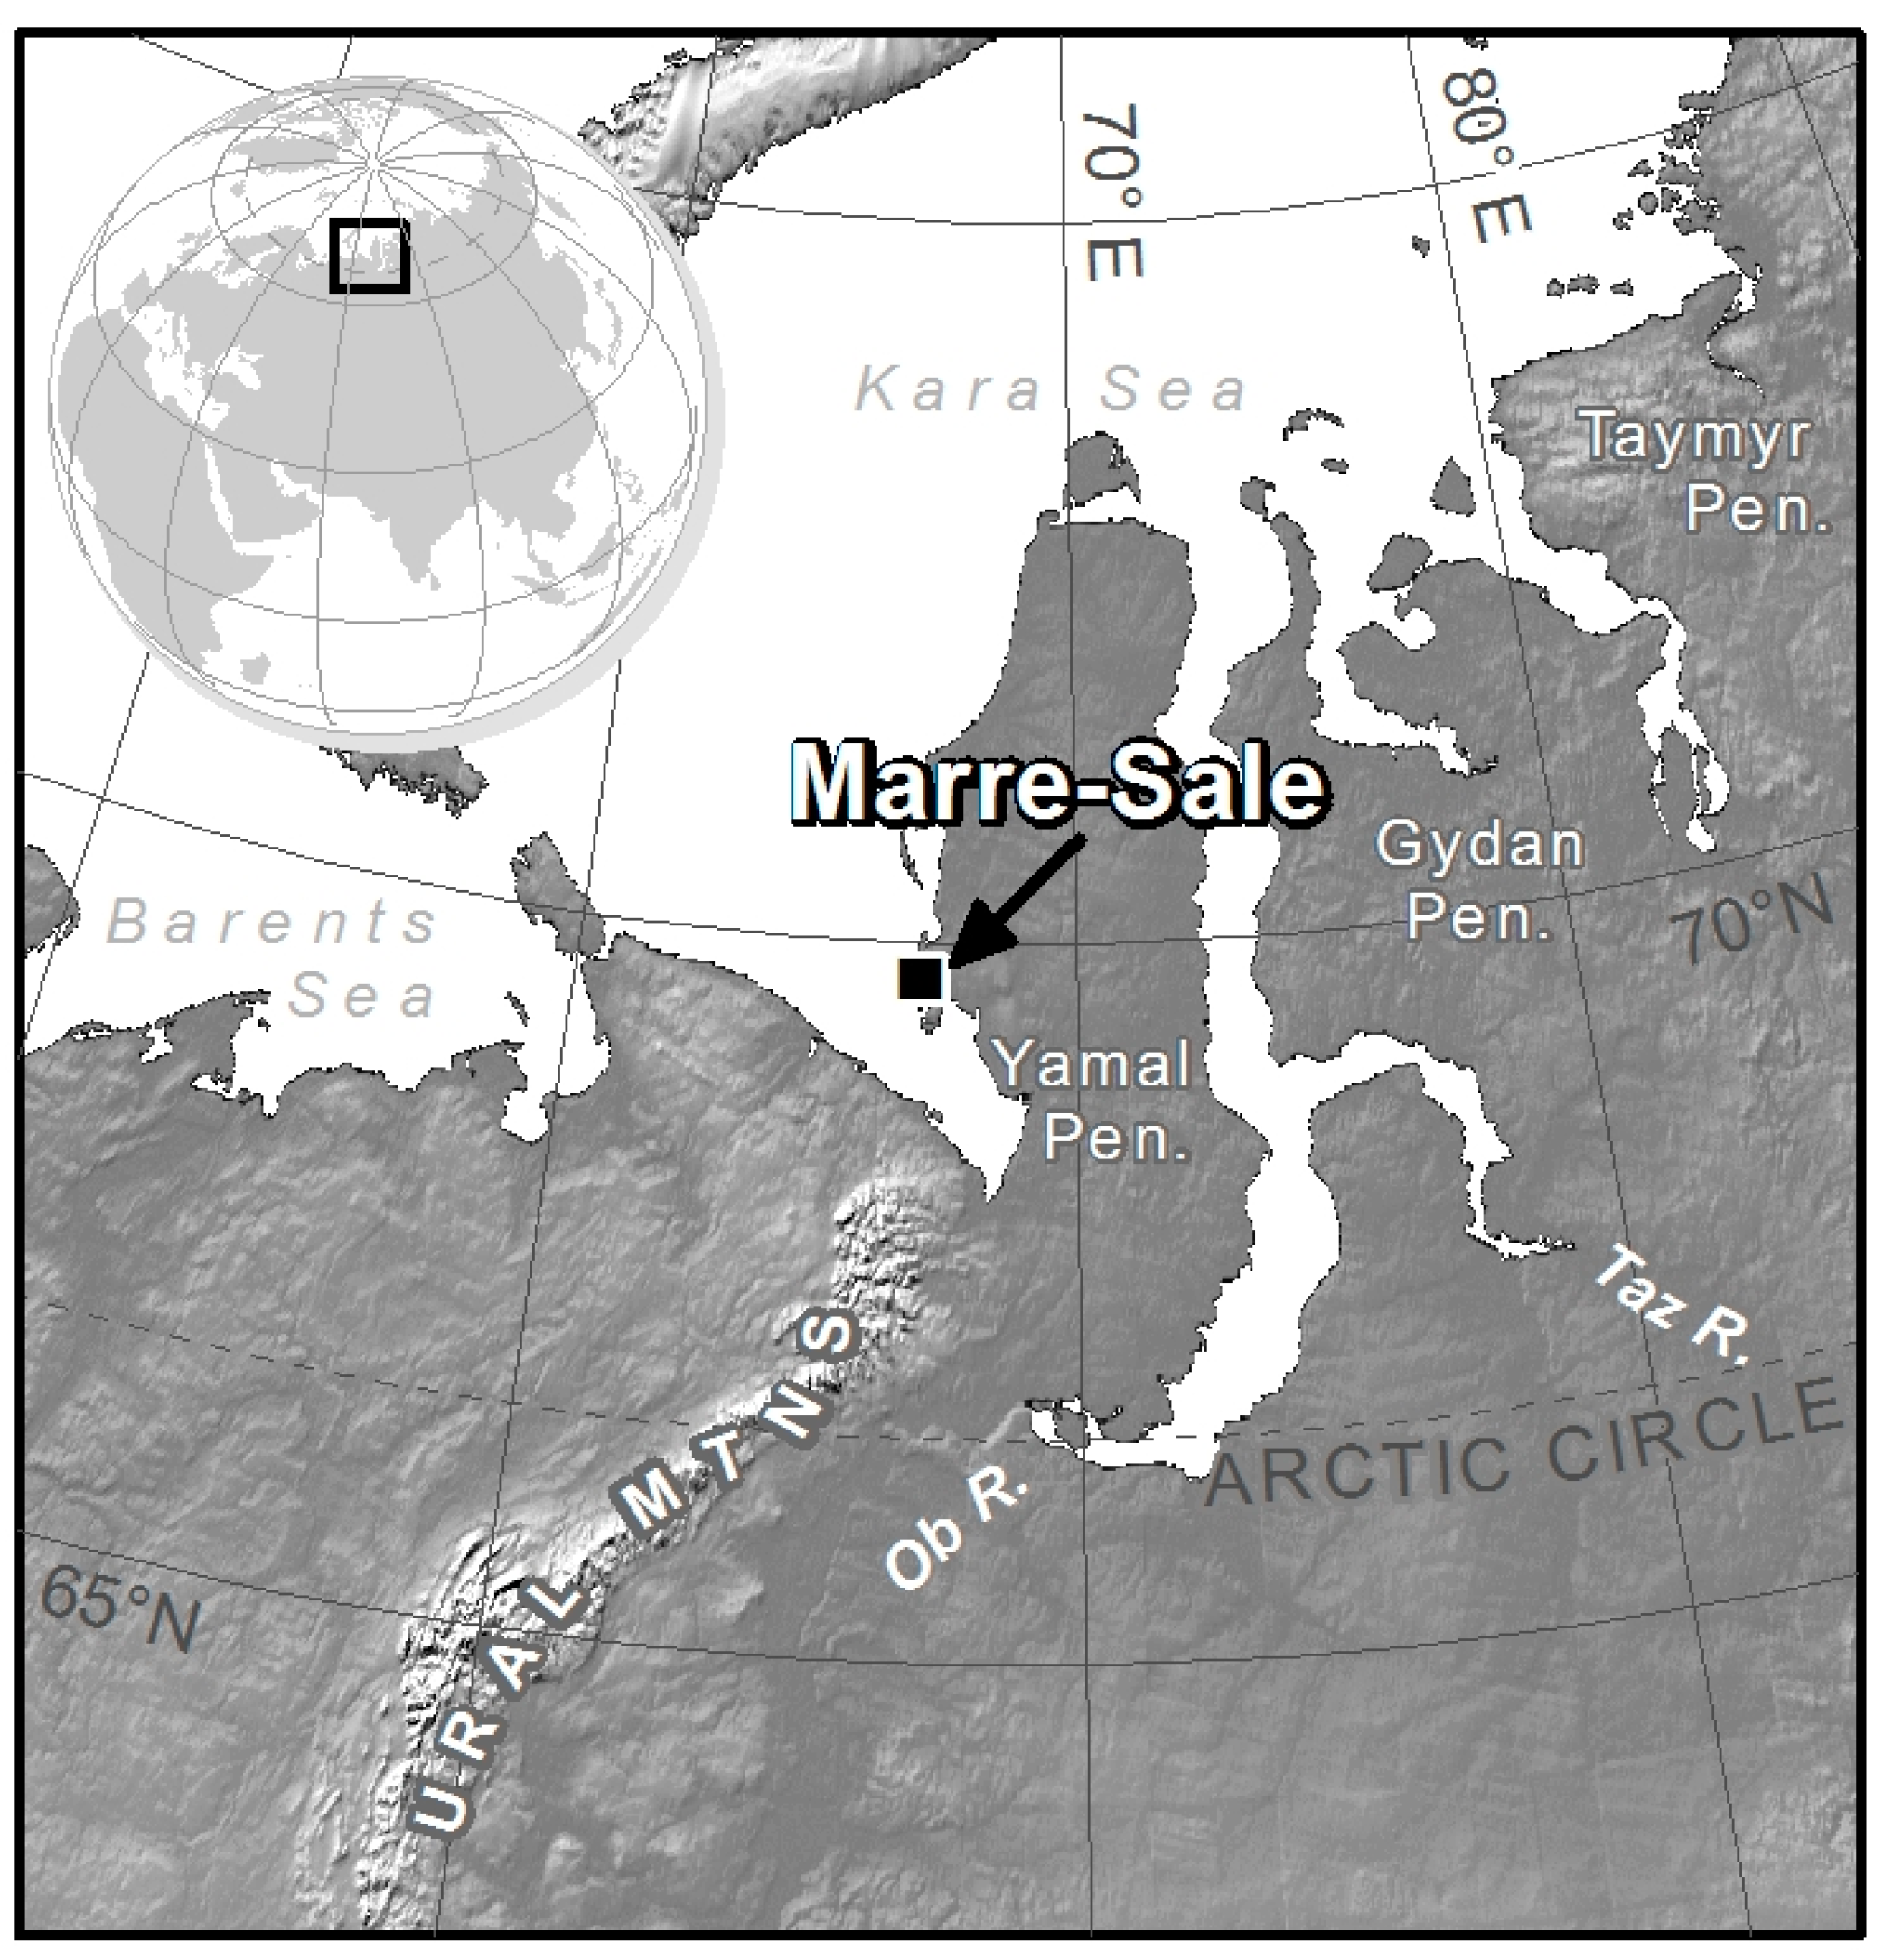
The Marre-Sale Polar Research Station is located on the west coast of the Yamal Peninsula in Western Siberia (
Figure 1). Permafrost monitoring was initiated at the Marre-Sale site in 1978 by the Institute of Hydrogeology and Engineering Geology of the USSR (VSEGINGEO). Since 1995, consistent, systematic monitoring has been conducted in a variety of tundra landscapes surrounding the station by Earth Cryosphere Institute researchers. Tundra here is made up of a variety of dwarf shrubs, mosses, and lichens typical of bioclimatic subzone D [
21,
22]). All monitored tundra sits on the third marine terrace from 20 to 24 m.a.s.l. dissected intermittently by gullies, with some drained lake basins and thermokarst lakes up to 10–15 m deep. The northern portions of the area studied are located on the flood plain of the Marre-Yakha River from 0.1 to 1.5 m.a.s.l.
Permafrost and periglacial processes are widespread in northwest Siberia, and the Yamal Peninsula is underlain by continuous permafrost [
23,
24]. The permafrost temperature at 10 m depth varies from −4.8 to −3.5 °C depending on specific landscape conditions. For instance, the tundra landscapes in the region, with the exception of sand blowouts, have peat layer(s) present. The general stratigraphic profile for this site includes marine loam to clay horizons accumulated during the Middle Weichselian (MIS 3) and Eemian (MIS 5), overlain by fine-grained silty sands from the Late Weichselian (MIS 2), topped by a Holocene sands cap [
25].
Landscapes here are dominated by herbaceous covers, including mosses, lichens, and sedge varieties, with intermittent dwarf and Salix shrubs up to 0.4 m in height typical of sub-Arctic [
26] or low Arctic [
27] tundra. The primary landcovers found on interfluves are sandy blowouts with little or no vegetation (#6 according to [
24]) and well-drained flat tundra overlying sand (#6a); each of these occupies approximately 5% of the study area. Well-drained polygonal tundra on sand (#6b) occupies approximately 20% of the area, and an additional 5% is covered by moist and wet flat tundra (#6v) and another 5% by moist polygonal tundra (#6g) (largely dwarf shrubs and grasses covering loamy sands). Azonal landscapes include the wet river floodplain (#3d) occupying 34% of the area, peat bogs (#3b) occupying 18%, and gullies/water tracks (#2v) and polygonal peatlands (#4v) occupying 4% each.
3. Materials and Methods
The active layer is measured at the end of August when seasonal ground thaw approaches its maximum depth by mechanically probing the ground with a 180 cm graduated metal probe. Active layer thickness is regularly measured across 16 (10 × 10 m) sites established in 1978, representing the variety of tundra landscapes surrounding Marre-Sale. Each of these 10 m sites consists of two transects crossed perpendicularly. Prior to 2020, a total of 10 measurements were taken at 2 m intervals along each transect. After 2020, 21 active layer measurements were taken at 1 m intervals across these transects. A 1 km
2 grid covering a mosaic of typical tundra types was established in 1995, where six active layer measurements are conducted at 121 grid nodes consistently spaced every 100 m. This 1 km
2 grid is part of an international network of standardized monitoring sites called the Circumpolar Active Layer Monitoring (CALM) program [
28]. The international CALM program code for the Marre-Sale grid is R3.
Soil moisture is also measured annually since 2016 at eight of the 10 m landscape sites using handheld drills. Hand-drilled cores are sampled at 10 cm intervals for average soil moisture content. Additional sampling was performed in 2002 at all the R3 CALM grid nodes for volumetric moisture content and bulk density of mineral and organic (peat) materials, and moss thickness. Moss thickness measures were repeated across the R3 CALM grid in 2021. Moss studies conducted in the last few decades were intended to complement Sphagnum thickness and abundance studies conducted when permafrost and active layer monitoring were originally established in 1978 and 1989 [
29].
Permafrost temperature measurements were conducted using a series of 10 m boreholes located in dominant landscape conditions from 1978 to 2022. Water and ice content within the active layer and permafrost were determined in 1978 from cores obtained when thermometric boreholes were drilled.
Data on daily temperature, precipitation, and snow thickness are available from the Marre-Sale weather station. The compiled meteorological record for this station allowed long-term climatic change estimations and assessment of spatial and temporal variability of active layer thickness in dominant landscapes.
4. Results
4.1. Changing Climate Conditions at Marre-Sale
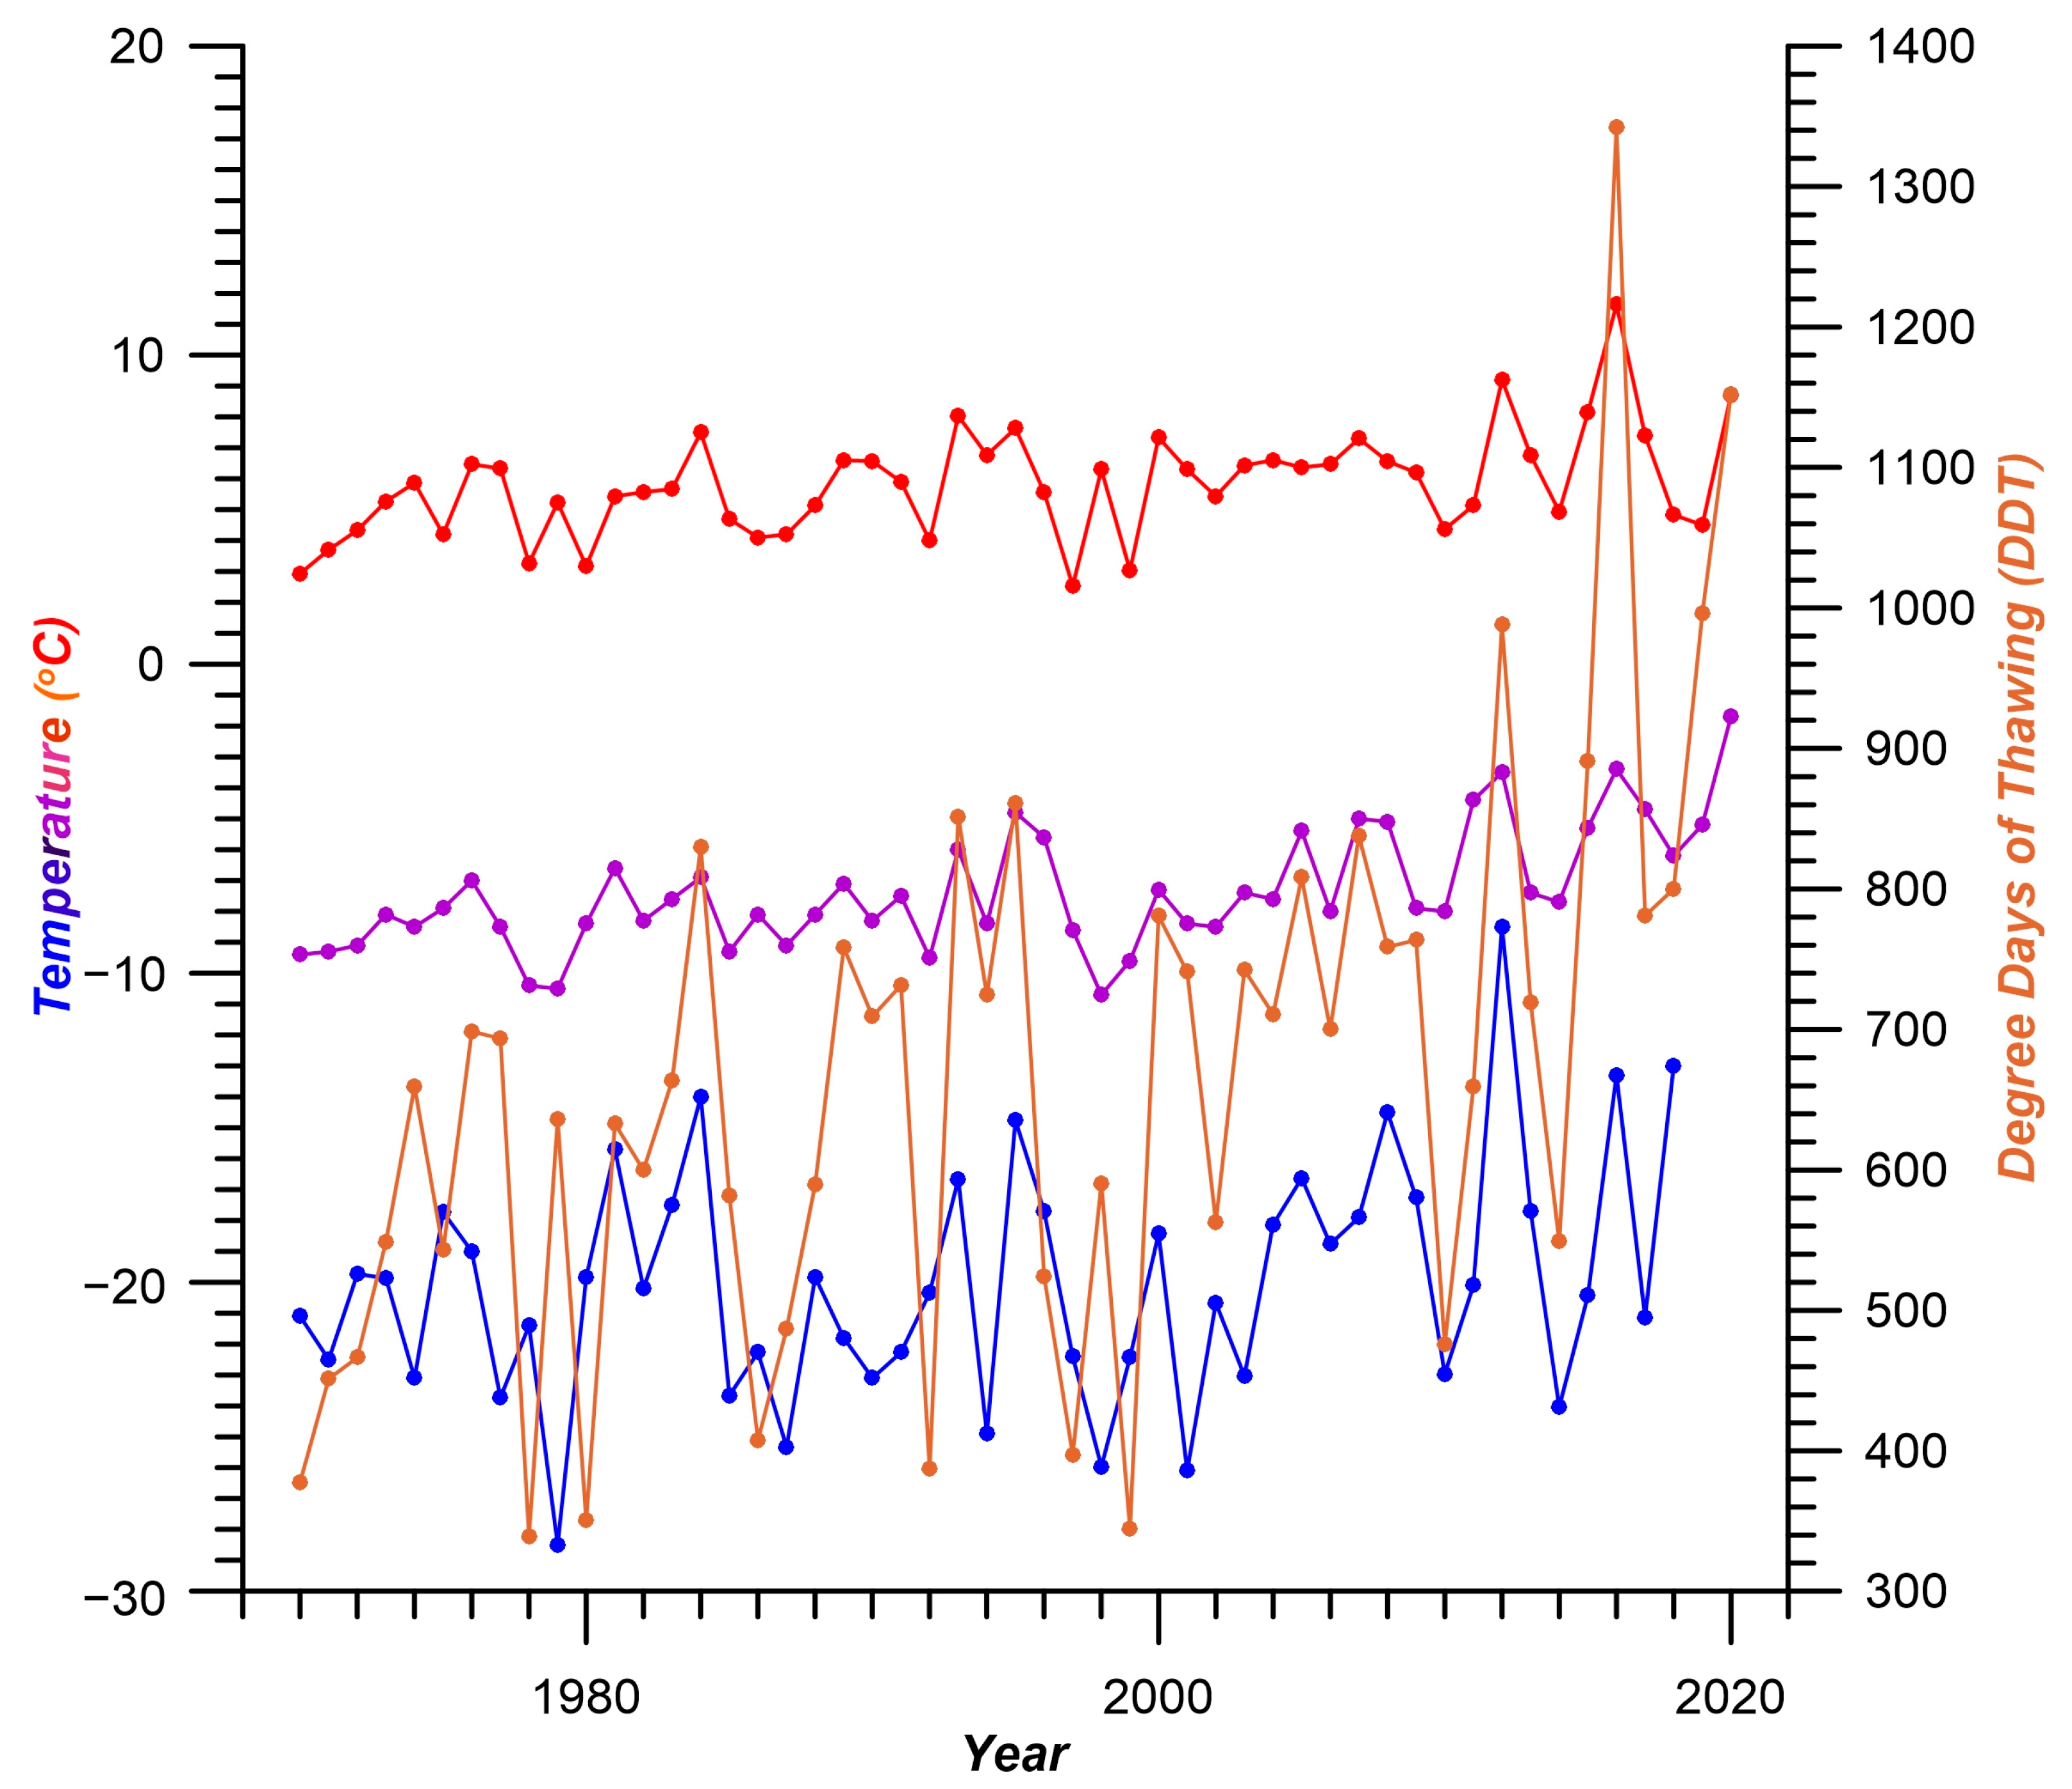
Mean annual air temperature has increased from −9 °C to −5 °C from 1970 to 2020 at a linear rate of 0.08 °C/year. Mean summer temperatures also warmed over the same time period from 4.4 °C to 7.3 °C at a rate of 0.05 °C/year. Degree days of thawing (DDTs), or the sum of positive daily temperatures accumulated over a year) is understood to be a major control acting on active layer development [
30]. Extremely warm summers recorded by the Marre-Sale weather station were in 2012, 2016, and 2020, affording much higher DDTs. DDTs have increased from fewer than 500 on average during the 1970s, to almost 1000 on average in the 2010s, to DDT values in excess of 1100 in 2016 and 2020 (
Figure 2). Increasing DDT values can be attributed to both increasing summer temperatures and the extended duration of the warm summer period. Overall, the duration of the thawing period has increased by more than 20 days. Precipitation and snow cover thickness have also increased at rates of 1–3 mm/year and 1.8 cm/year, respectively, over the same period of observation.
4.2. Regional Active Layer Thickness Trends
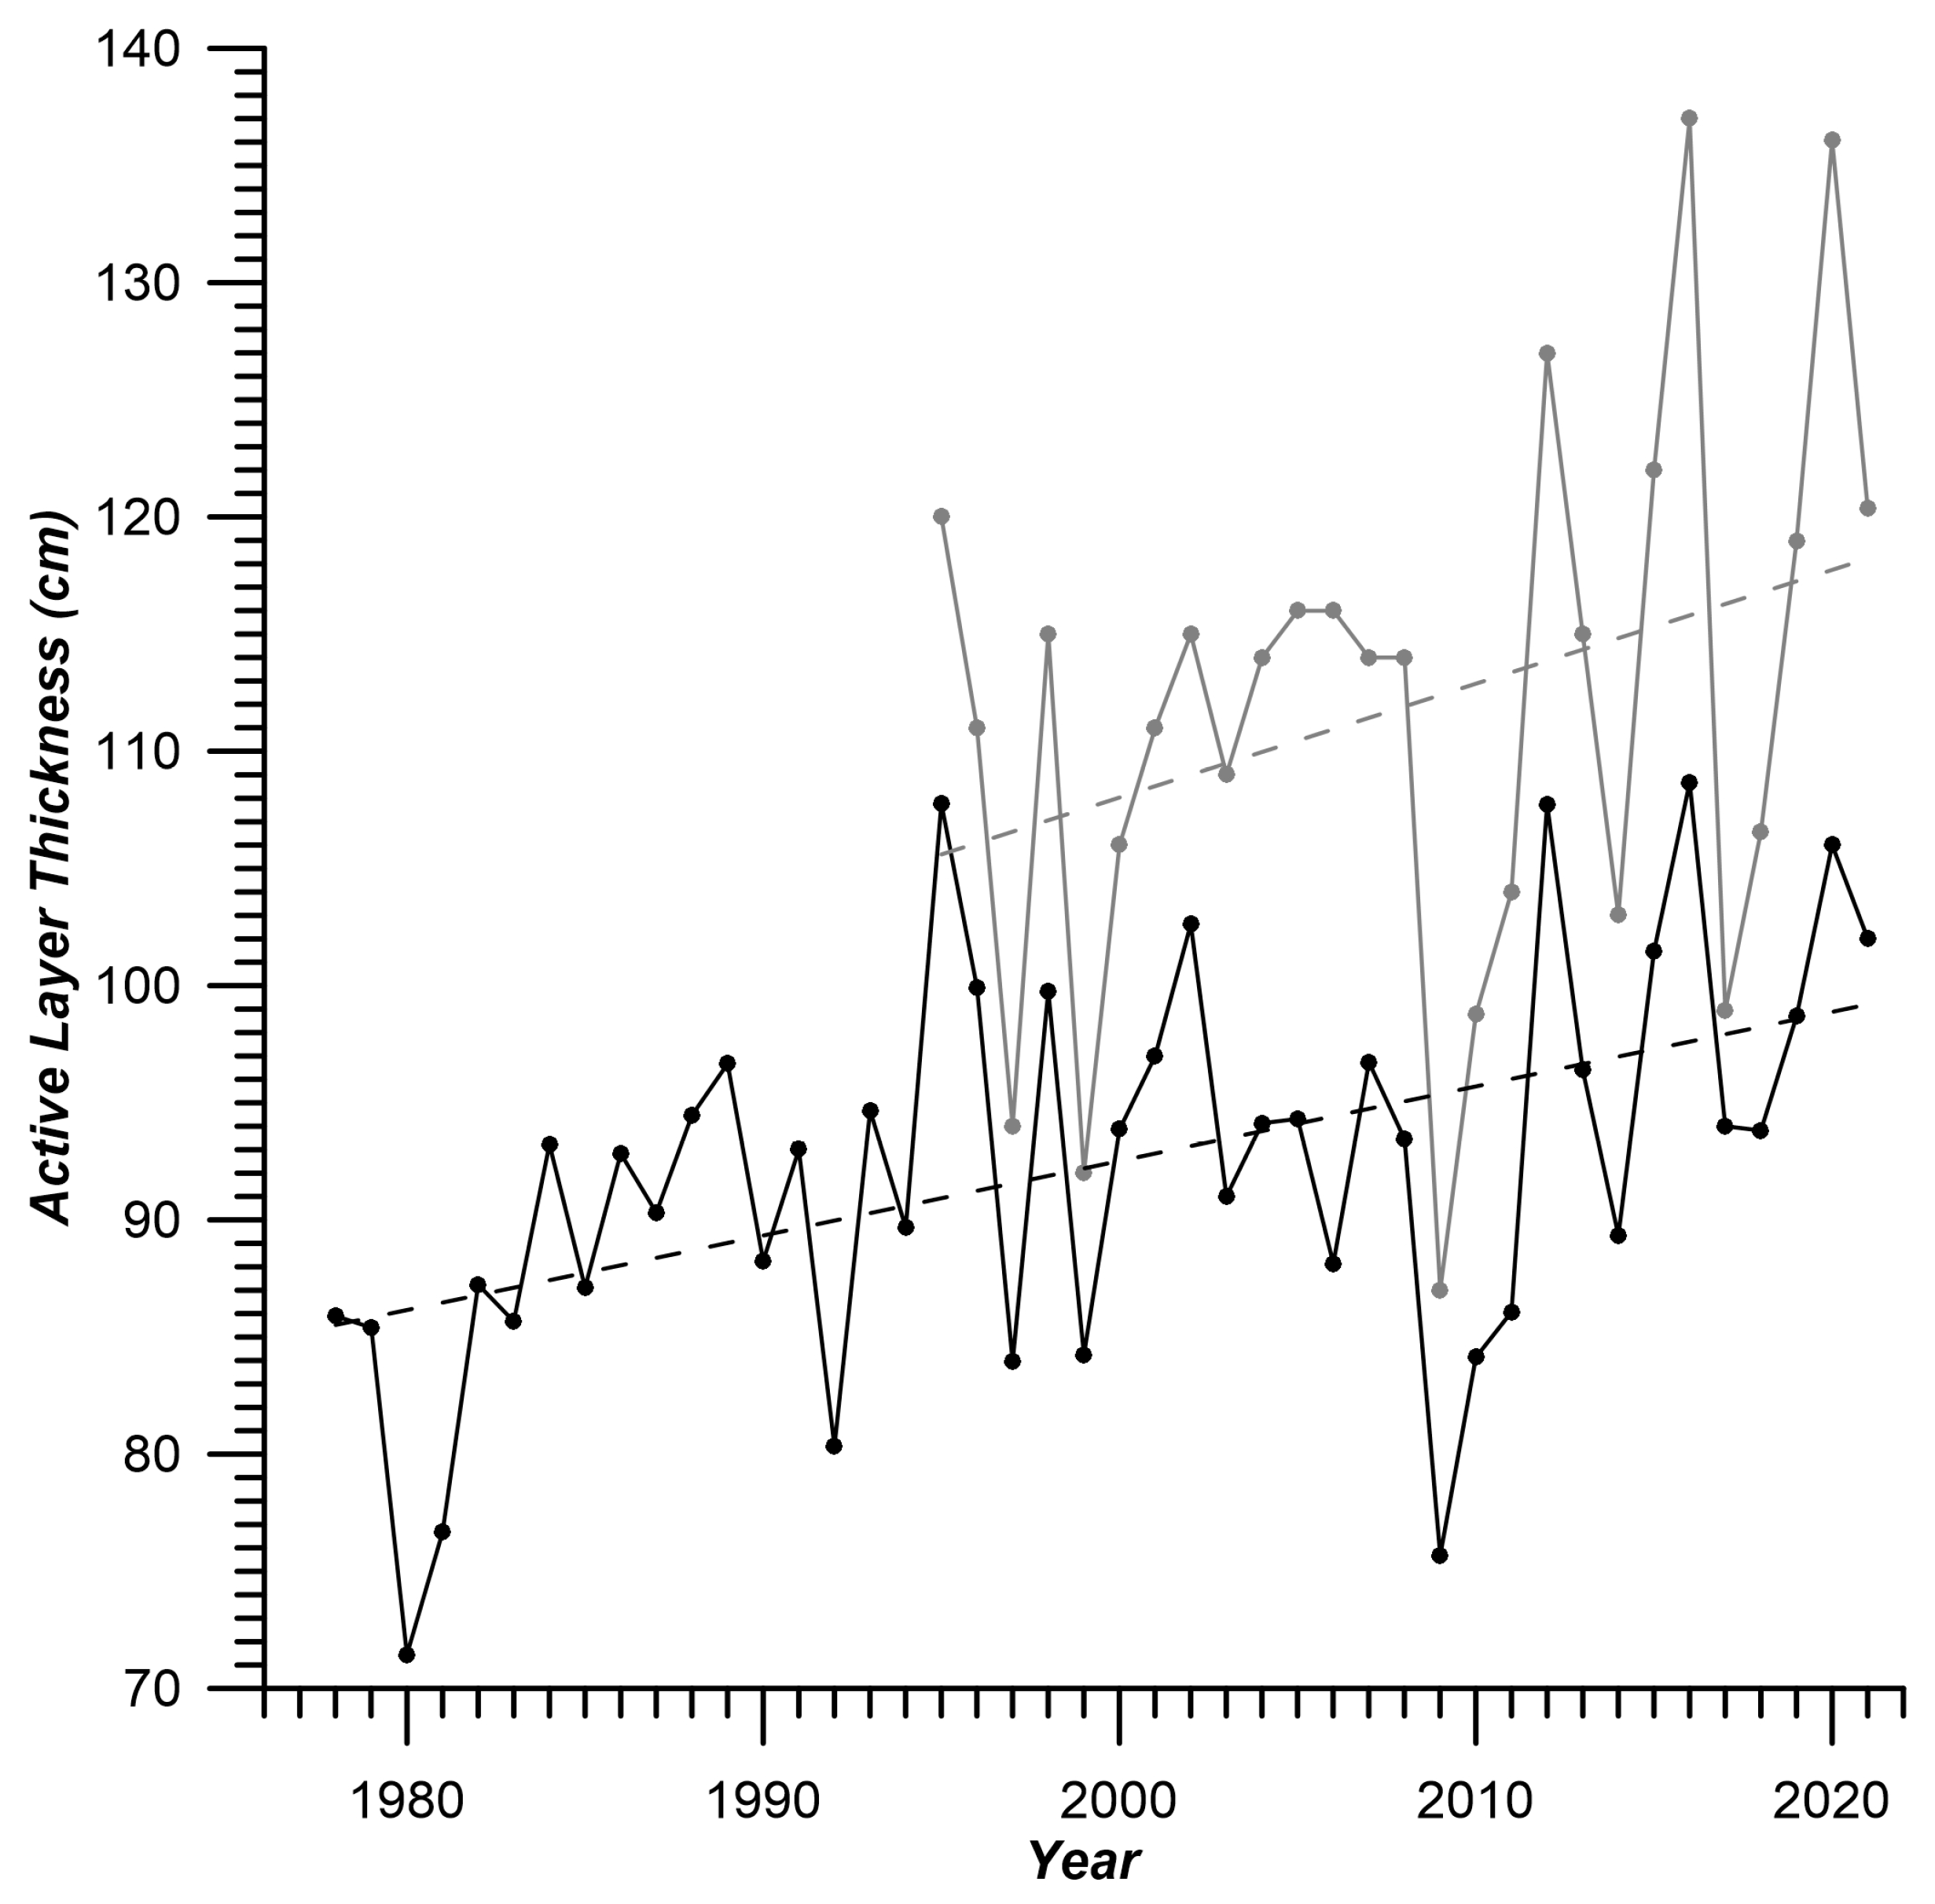
Due to the high spatial heterogeneity of active layer thickness, it can be difficult to infer regional trends based on what are usually limited numbers of records from very few observational sites. Active layer comparisons should also be made between sites representative of similar landscape units [
31]. Active layer estimations are all the more challenging across extensive regions such as the Yamal Peninsula, which has a complex mix of dominant tundra landscapes controlled by broad bioclimatic zonality and azonal landscape units formed under more localized environmental factors. The long-term sampling strategy based out of the Marre-Sale Research Station considers all of these challenges, particularly given the array of sites in the 16 regional landscape units. These records allow observed active layer trends to be spatially integrated regionally by employing a weighted average for active layer thicknesses according to the relative areas occupied by each landscape unit within the region. This long-term, regional active layer trend is shown in
Figure 3 compared to the trend based on observations across the CALM R3 site established in an effort to also capture regional landscape variations across its 1 km
2 grid.
Over the 1978–2021 period, the regional active layer thickness increased from 87 to 101 cm. Both the regional weighted average and CALM R3 site records demonstrate similar interannual variability and positive active layer thickness trends. This result supports the idea that regional interannual variability and trends can be adequately inferred based on observations from a single representative site if sufficiently large and inclusive of a variety of dominant landscapes. However, annual observations from the CALM R3 site are consistently 8 to 29 cm thicker than the weighted average based on small landscape-specific sites. For logistical reasons related to access and effective measurement by mechanical probing, the 1 km2 CALM R3 grid was established to avoid lakes and particularly wet lake basins, characterized by shallow active layers, which could explain the positive bias compared to the regional average.
4.3. Landscape-Specific Active Layer Thickness Trends
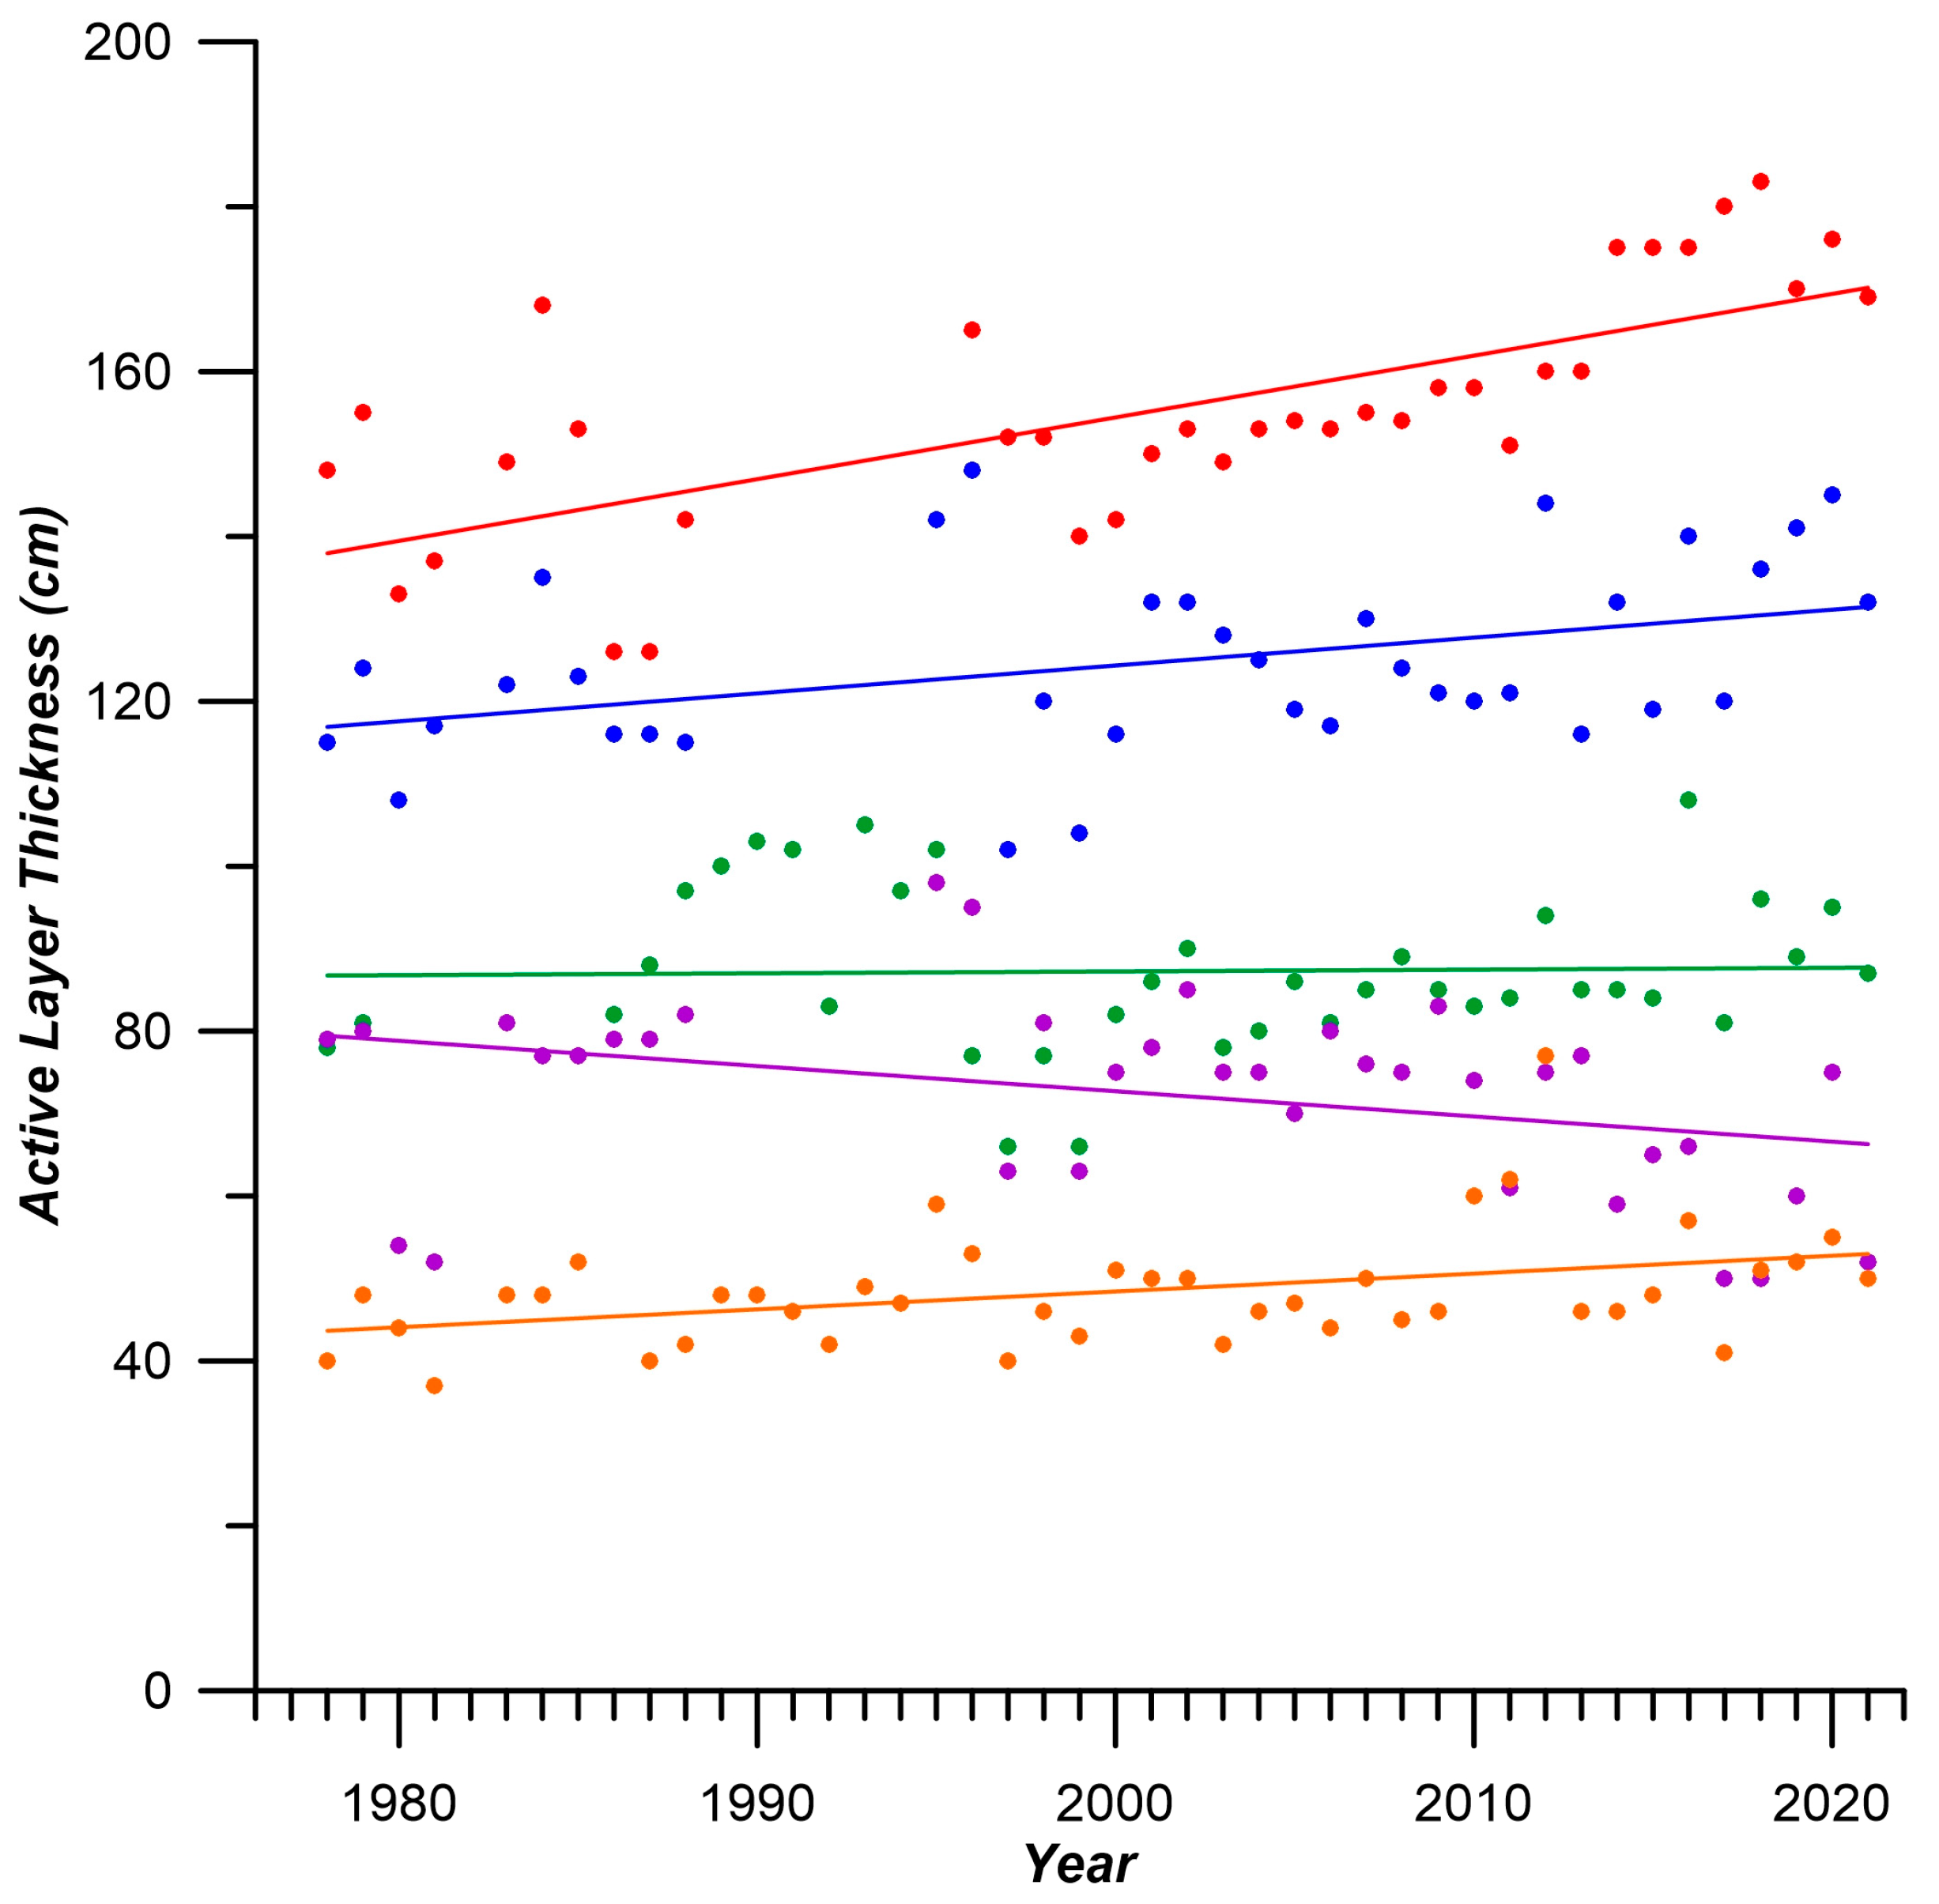
The long-term observations from a selection of the 16 dominant landscapes indicate that, under the same climatic forcing, well-drained landscapes exhibit more dramatic active layer thickening (positive trends) relative to moist or wet landscapes (
Figure 4). Well-drained polygonal tundra and polygonal peatlands, for instance, both exhibit positive but not statistically significant trends (0.34 cm/year and 0.22 cm/year, respectively), while sand blowouts have thickened at a faster and statistically significant rate of 0.75 cm/year (
p-value < 0.00). The active layer thickness on the river floodplain was relatively stable (0.00 cm/year) over the observational period, and moist polygonal tundra exhibited a statistically significant active layer thinning trend of −0.31 cm/year (
p-value < 0.05).
A relatively low explanatory power of DDTs in explaining active layer trends at the observed landscapes highlights other factors’ influence on active layer dynamics. Site-specific factors include soil moisture, the presence of an ice-rich “transient” layer, and changes in vegetative covers.
4.4. Soil Moisture Changes
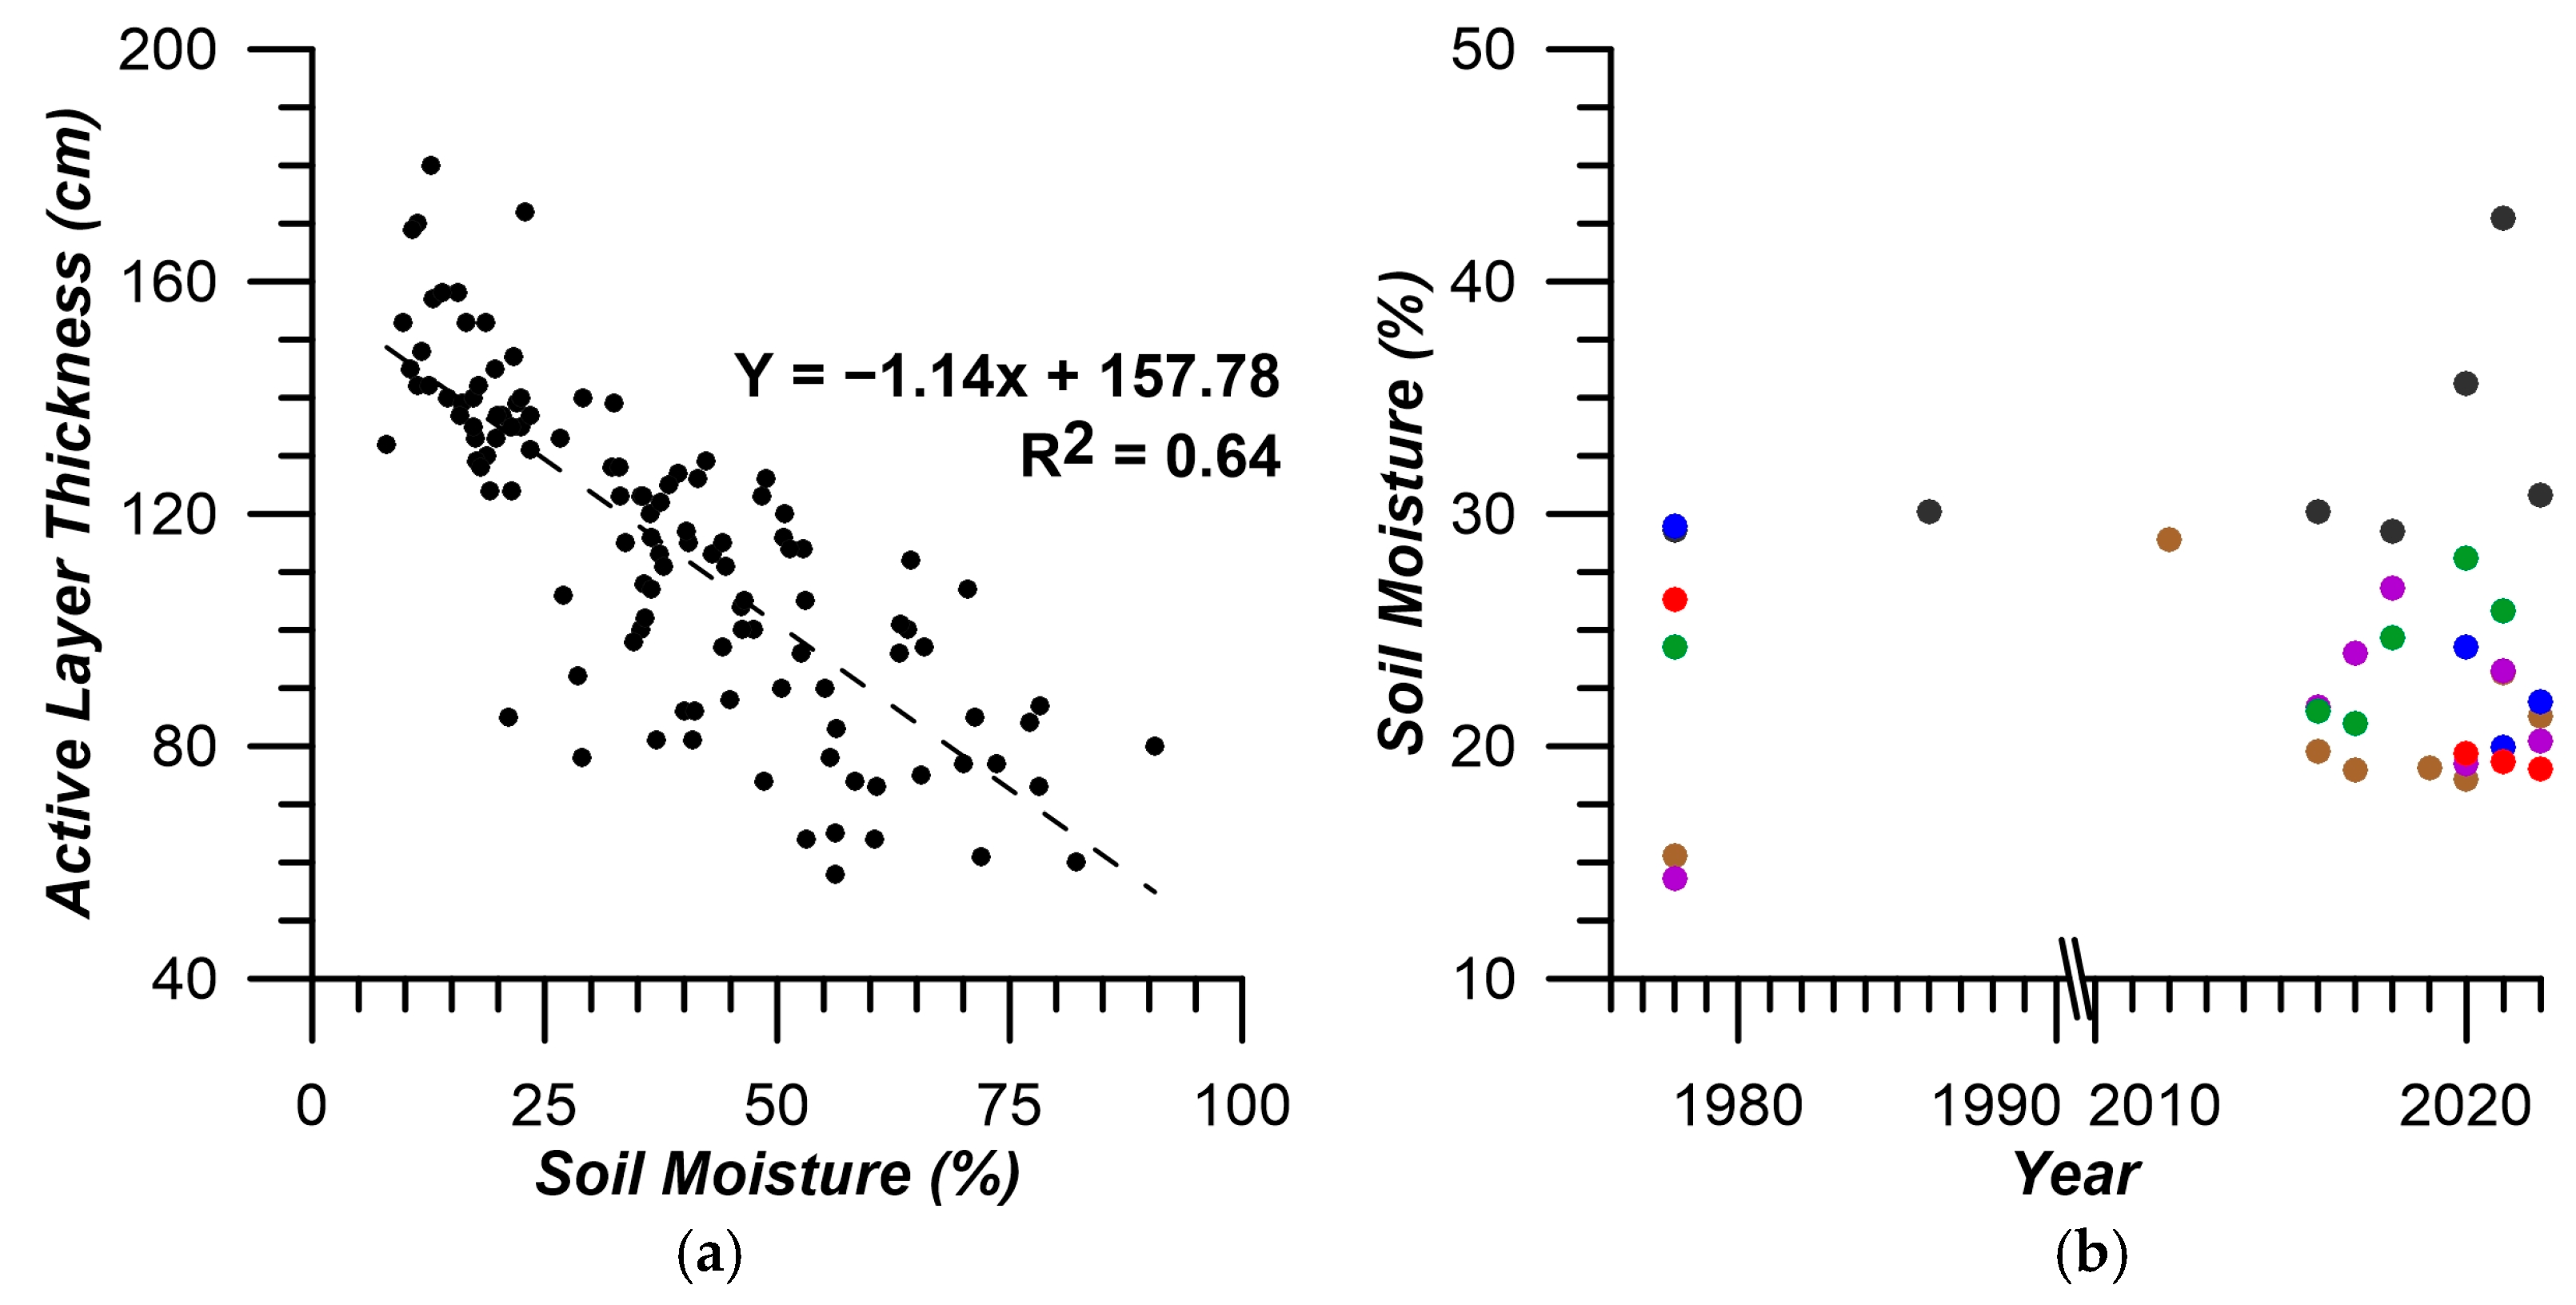
Soil moisture affects the thickness of the active layer in two ways: through changes in soil thermal properties and through latent heat associated with phase transition, the latter of which usually produces a more pronounced effect. In general, with greater ground ice content (dependent on the active layer on prewinter soil moisture content), more heat is required for the phase transition associated with the thinner active layer the following summer. Over time, changes in soil moisture, therefore, have the potential to offset active layer development and dynamics. The comparison of soil moisture data collected from dominant landscape units intermittently from 1978 to 2022 indicates that, on average, the soil moisture content has increased from 23% to 26% (
Figure 5a). Well-drained polygonal tundra and sand blowouts experienced small but statistically significant drying or a decrease in soil moisture (−0.17%/year and −0.16%/year, respectively), while soil moisture in moist polygonal tundra increased (0.19%/year); the other landscapes showed no statistically significant changes.
Simultaneous soil moisture and active layer observations collected in 2002 across the CALM R3 grid demonstrate the negative correlation between soil moisture content and active layer thickness, in which the thinner active layer consistently corresponds with higher soil moisture content (
Figure 5b). Given the relation presented in
Figure 5b, such an increase in soil moisture content can potentially contribute up to 4 cm of active layer thinning.
4.5. Ground Ice Content and the Transient Layer
A more pronounced active layer stabilizer than increasing soil moisture can be thaw propagation into an ice-rich transitional zone at the interface between the active layer and permafrost, known as the transient layer [
32,
33]. Latent heat associated with melting ground ice can hinder the propagation of a thawing front into the ground and simultaneously trigger differential thaw settlement. Surface subsidence complicates the interpretation of active layer thickness change measured by mechanical probing relative to the ground surface [
34].
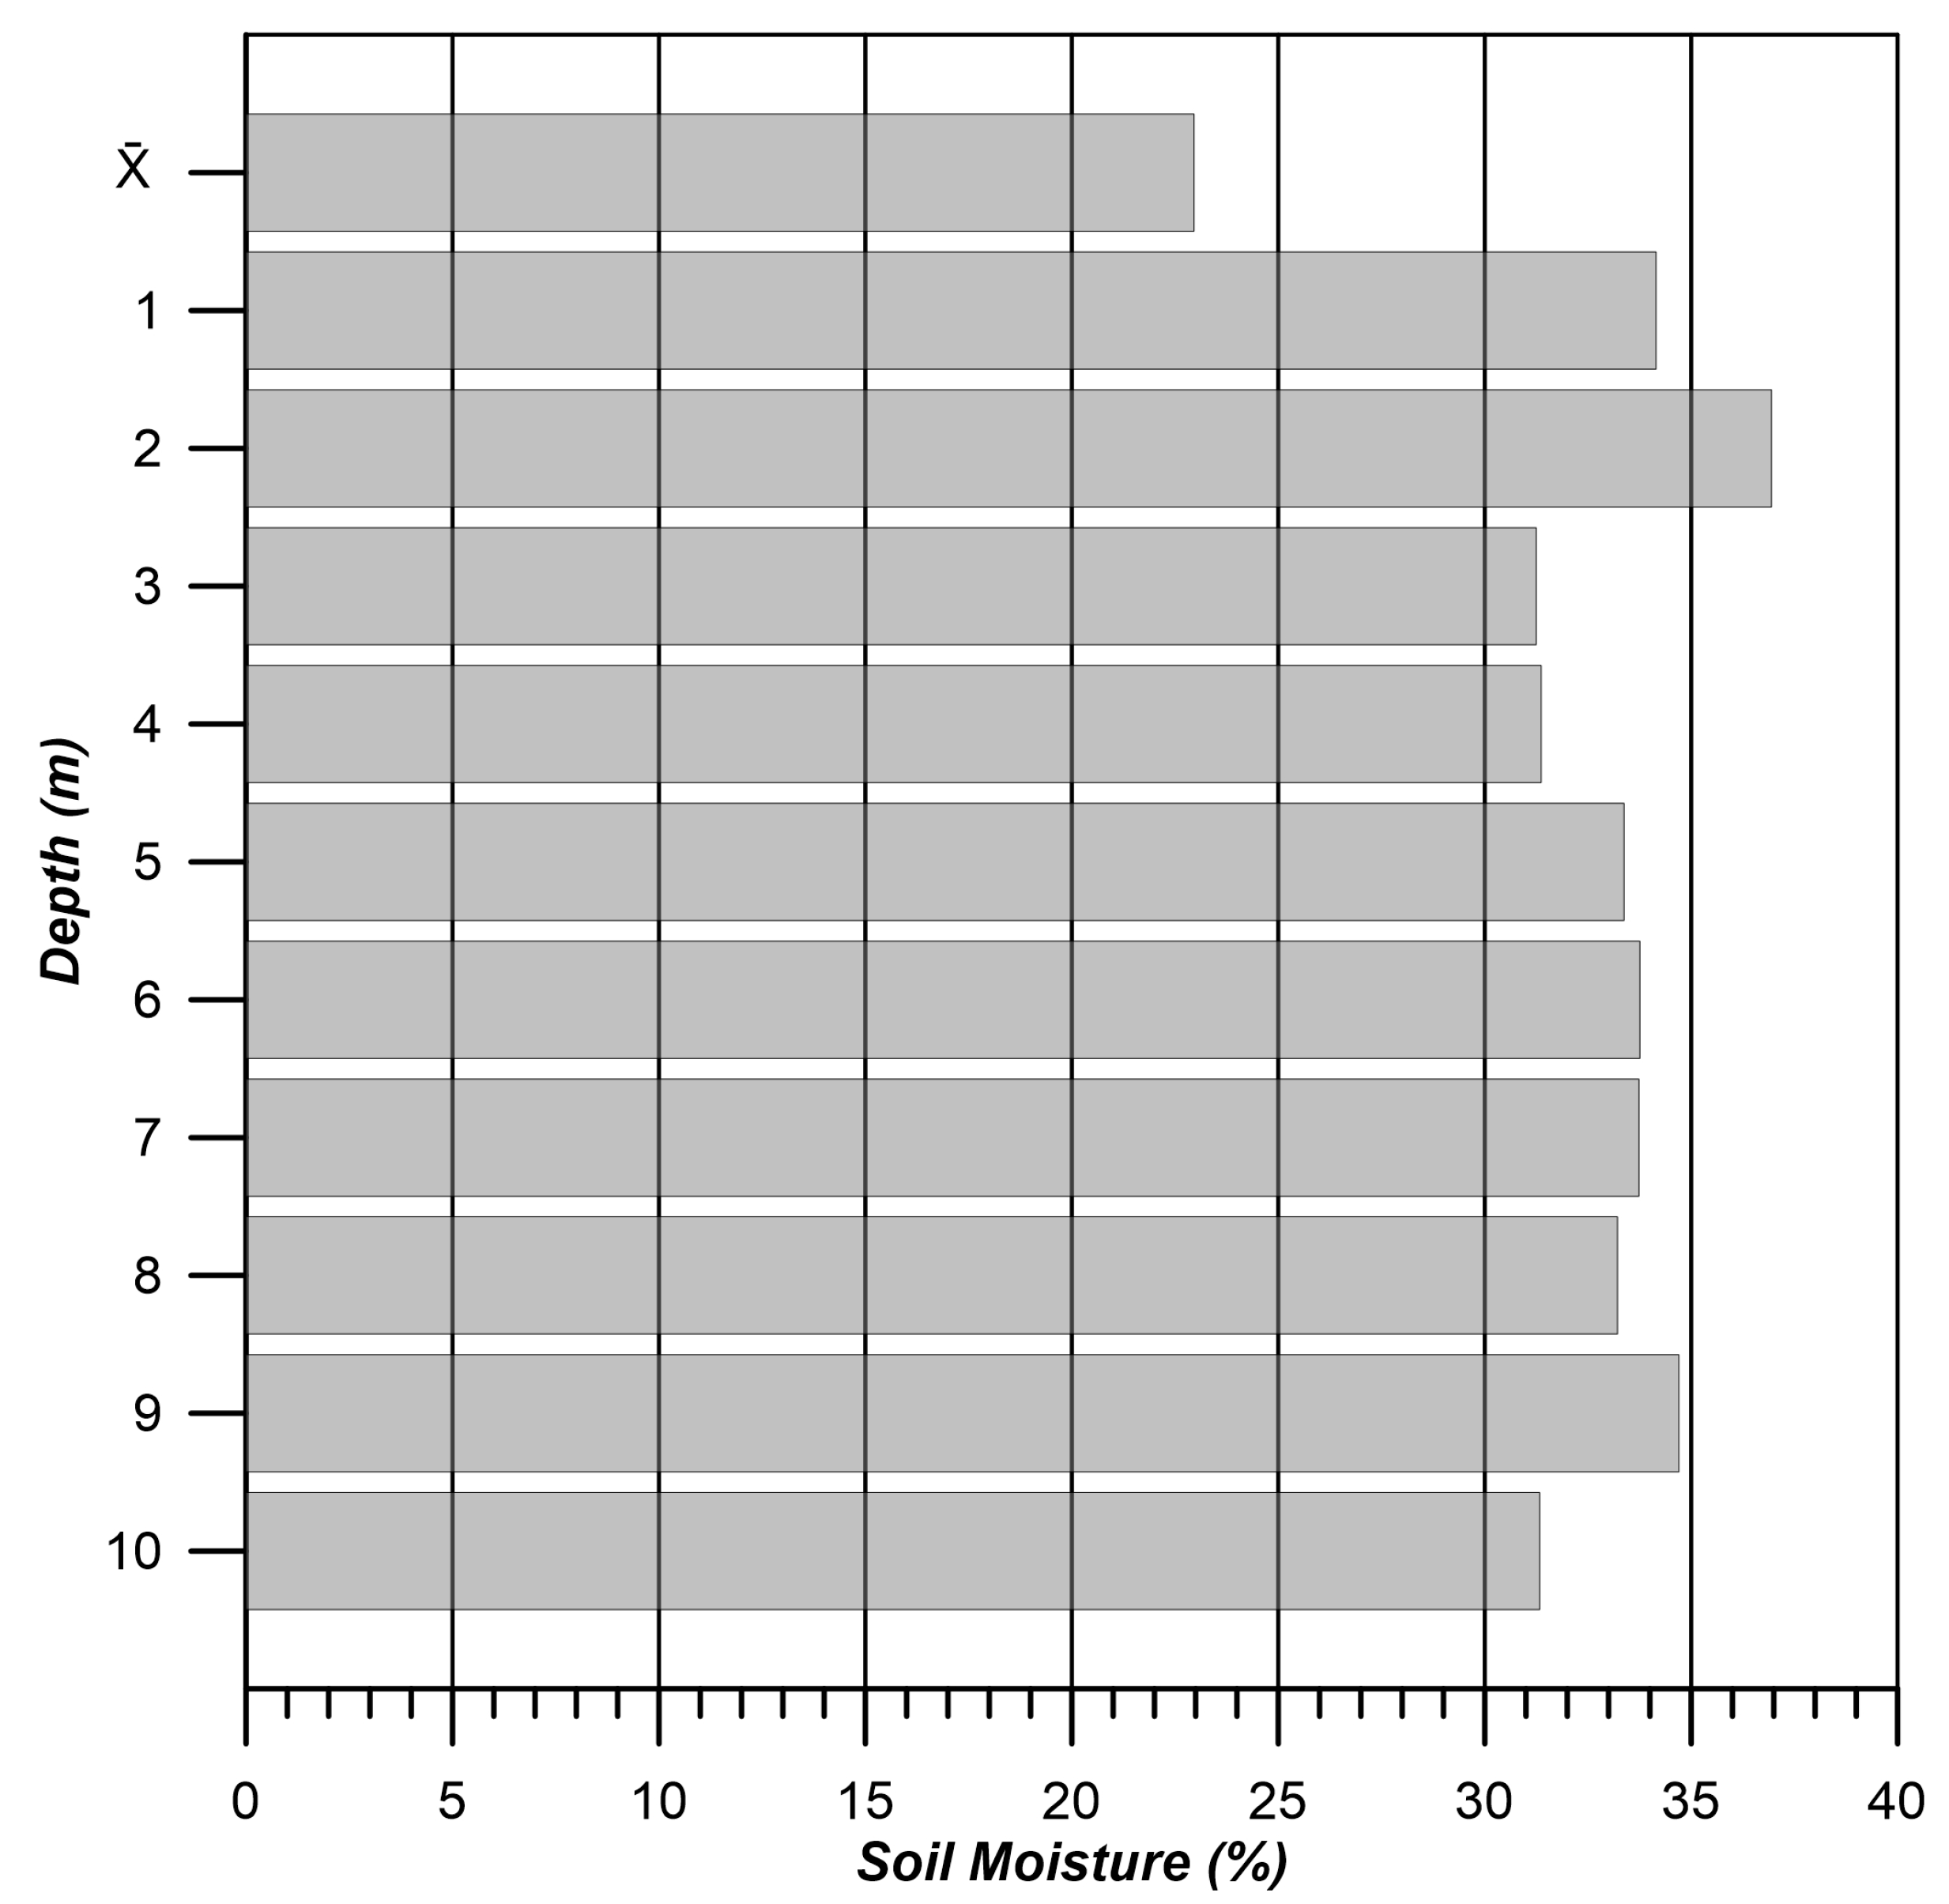
To determine whether a transient layer is present at a site, statistical analysis of soil moisture/ground ice content with depth was performed on a total of 637 samples extracted from 42 deep boreholes 10–12 m deep colocated with landscape-specific sites. Soil moisture content within the active layer was estimated separately from ground ice content in the underlying permafrost. Ground ice content was sampled in 1 m increments to 10 m depth. Results shown in
Figure 6 clearly demonstrate the presence of an ice-rich transient layer with 34–37% ice content at the active layer and permafrost. Active layer thickening is likely to slow with that propagation into the transient layer and may result in subsidence, not currently measured at the Marre-Sale suite of monitoring sites.
4.6. Vegetation Dynamics
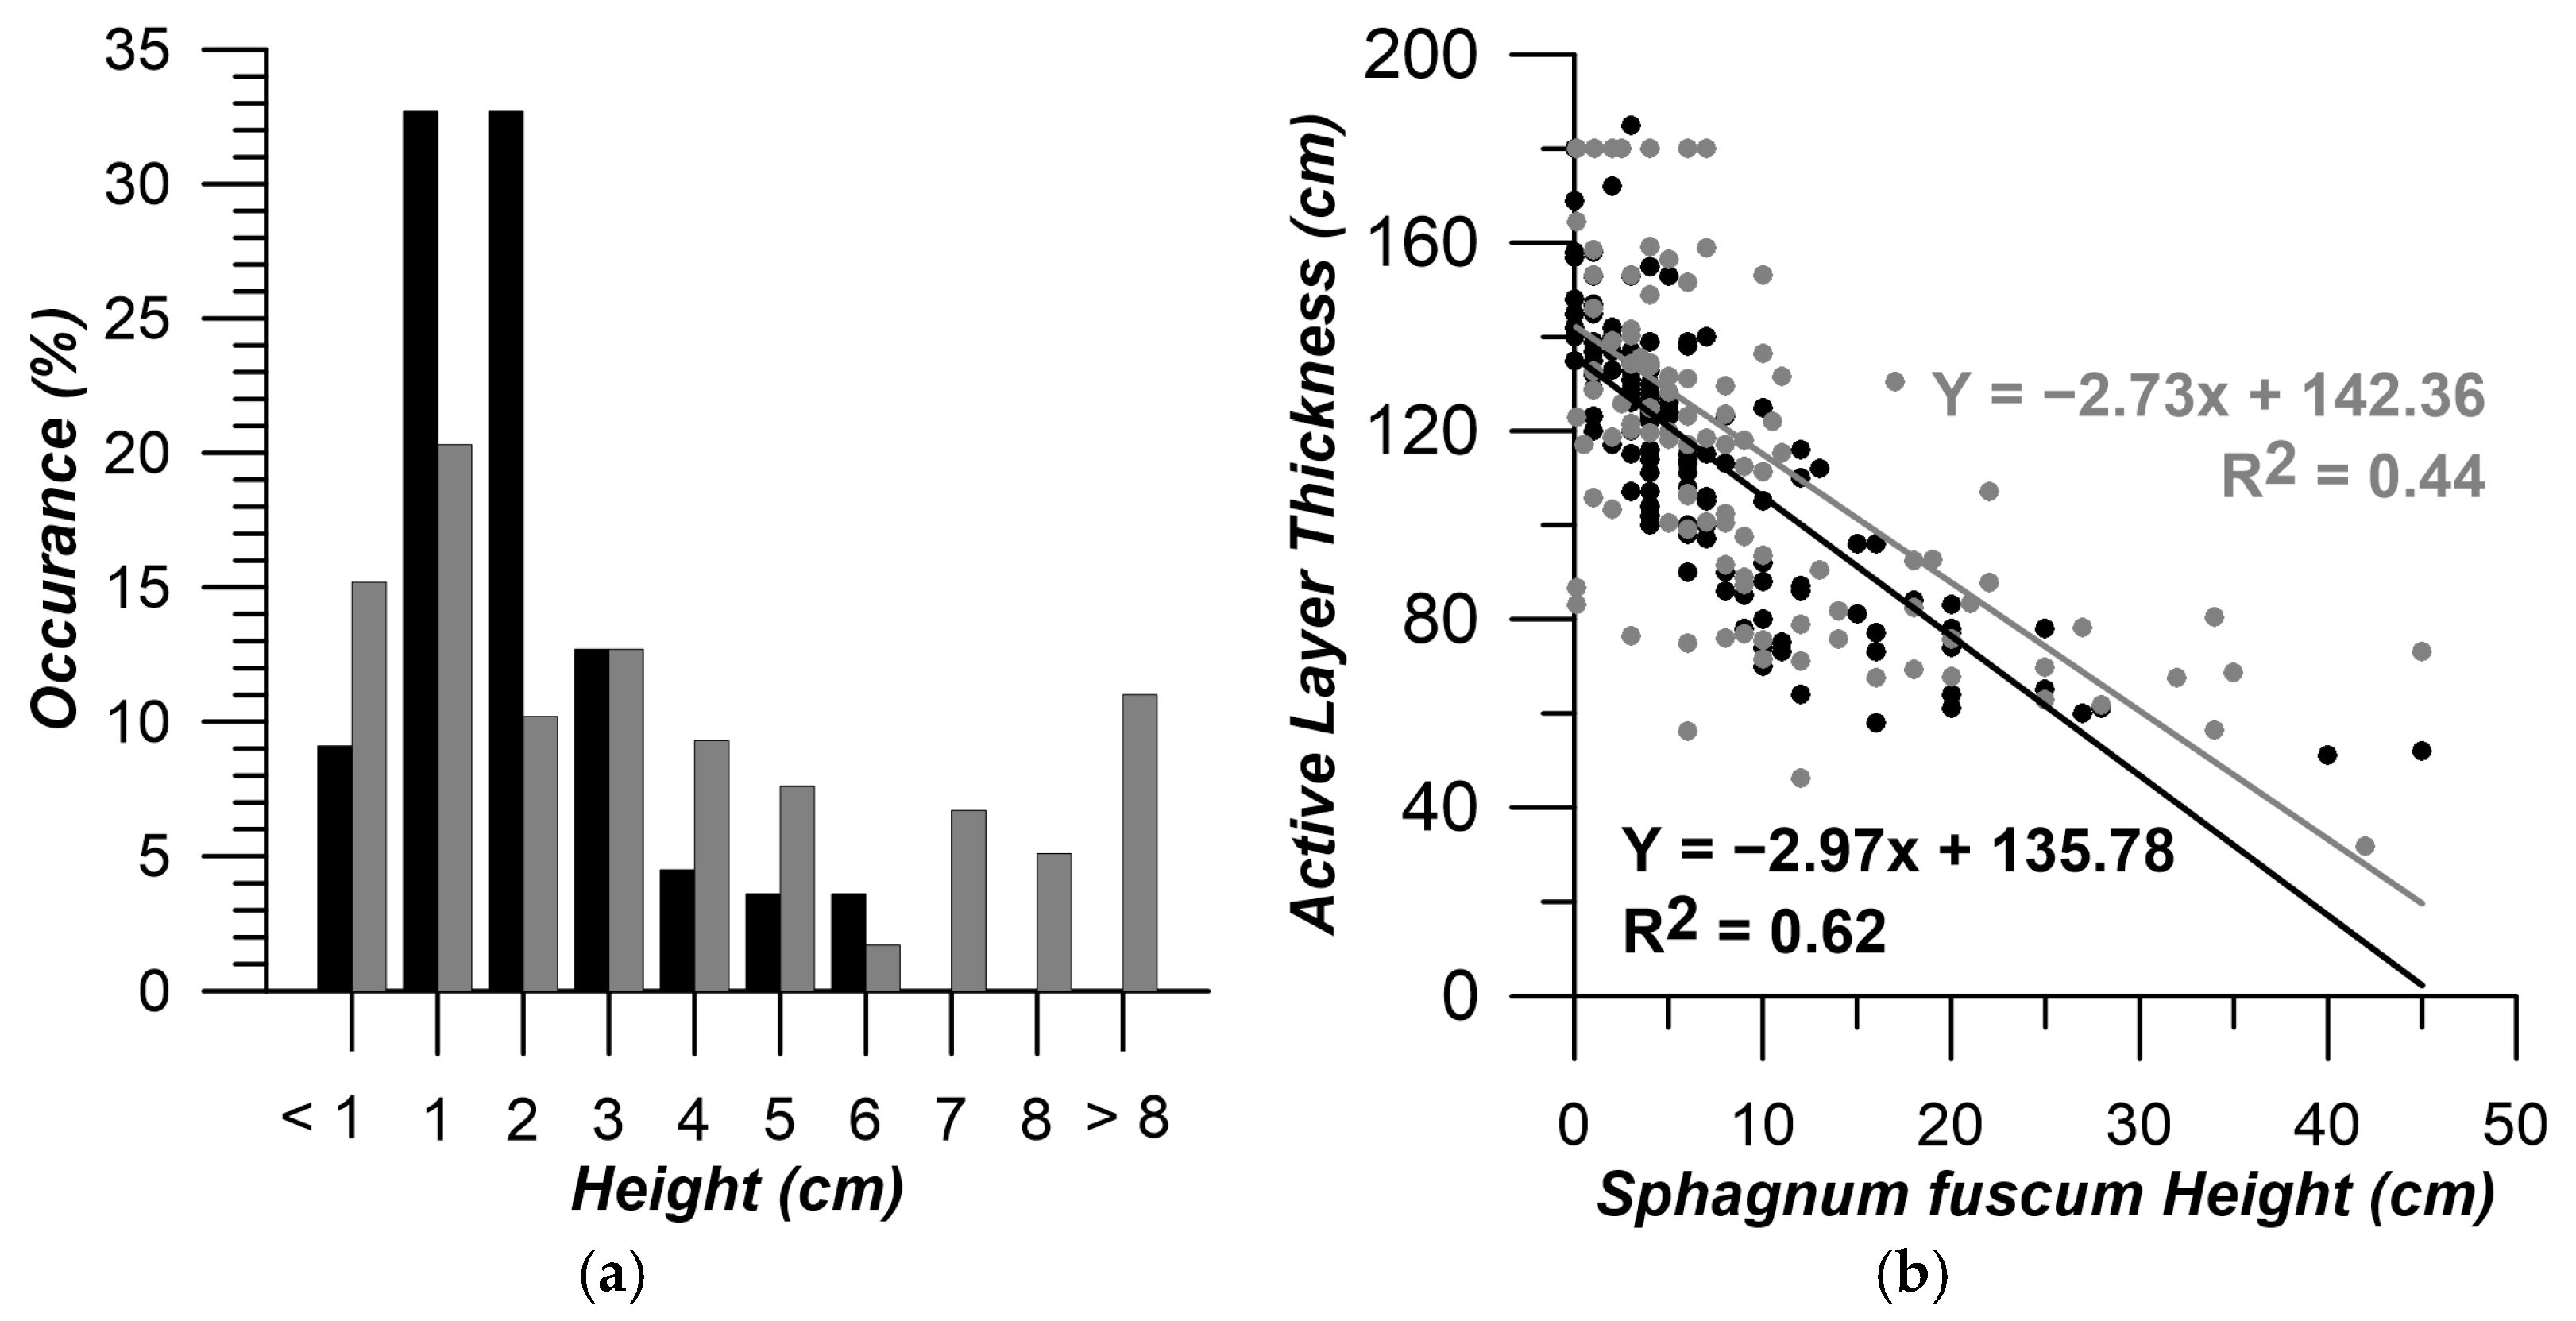
Vegetation, and especially mosses, provide substantial thermal insulation to the ground in summer, limiting active layer development or thickness. Moss thickness measurements, regardless of species, conducted across the CALM R3 site in 2002 and 2021 were used to evaluate the potential impacts on active layer dynamics. The statistical distribution of moss thickness across this 1 km
2 grid observed in 2002 and 2021 is shown in
Figure 7a. The analysis indicates that 1 to 2 cm thick mosses dominated the site in 2002, and no mosses >6 cm thick were observed. By 2021, there was a pronounced increase in the occurrence of mosses >6 cm thick and a corresponding reduction in the area covered in mosses <3 cm thick. Overall, from 2002 to 2021, average moss thickness across the 1 km
2 R3 grid increased from 2.0 ± 1.5 cm to 4.1 ± 4.4 cm.
Analysis of more detailed observations on Sphagnum conducted between 1978 and 1989 at several 10 × 10 plots characteristic of poorly drained tundra within the study area [
29] showed the thickness of the Sphagnum cover increased from 2.0 to 4.5 over that decade when mean summer air temperatures warmed from 2.8 to 6.2 °C. Sphagnum areal coverage increased correspondingly from 13% to 21%, while peat under the vegetation remained a constant 5.1 ± 5.73 cm thick. These results confirm the positive relationship between summer temperature and moss thickness and areal extent (abundance) of Sphagnum. Moss thickness surveys conducted at the R3 grid site in 2002 and 2021 described above did not differentiate species. However, the increase in the standard deviation of moss thickness from 1.5 cm to 4.4 cm suggests that some moss species tend to increase their thickness more or faster than others under climatic warming. Similar results were also obtained by warming manipulation experiments [
35].
There is a strong dependence of ALT on the combined effects of moss or lichen and underlying peat layers, which thermally insulate the ground in summer, resulting in a relatively shallower active layer in locations with thicker organic layers (
Figure 7b). Results show that from 2002 to 2021, the sensitivity of active layer thickness to organic layer thickness remained relatively constant, with slopes of 2.3 and 2.6, respectively. The on average 3 cm increase in moss cover thickness, therefore, could account for up to 7 cm in active layer thinning over this 20-year period. However, the decrease in the explanatory power of linear regression from 2002 to 2021 suggests a simultaneously increased influence of other site-specific factors, such as soil moisture, and greater interannual variability in these factors impacting seasonal active layer development.
5. Discussion
Relatively consistent and even thinning active layers despite warming climatic conditions have also been documented in other Arctic regions characterized by tundra vegetation and cold continuous permafrost, such as the North Slope of Alaska [
18,
36] and the Canadian McKenzie Valley [
3]. Climate-driven thaw depth dynamics are proportional to atmospheric cumulative seasonal heat, commonly expressed as degree days of thaw (DDTs). Soil properties, particularly ice content and soil moisture, dictating conductivity and vegetation providing thermal insulation can slow seasonal active layer development by interrupting the propagation of atmospheric heat into the ground [
19].
Data currently available on soil moisture from Marre-Sale presented here do not allow detailed quantitative analysis of long-term trends and their effect on the active layer. However, an increase in soil moisture content has been documented in tandem, which, to a limited degree, slowed active layer thickening attributable to latent heat effects. Clayton et al. [
37] discussed the latent heat of fusion for thawing ground following an analysis of bulk volumetric water content from a series of Alaskan landscapes. They also found, despite landscape differences, a general trend in which bulk volumetric water content for the entirety of the active layer was negatively correlated with active layer thickness. However, there is an opposite, positive correlation between bulk water content and active layer thickness within 12 cm of the surface, similar to the findings of Shiklomanov et al. [
38] based on a study also conducted on the Alaskan North Slope and another more recent augmentation experiment conducted by Magnússon et al. [
39] in the Indigirka Lowlands of Siberia. Therefore, the long-term analysis presented here supports the mitigation of thaw under a warming climate via the latent heat of fusion by thawing soils producing a subsequently thinner active layer in nonsaturated soils. More pronounced stabilizing effects than increased moisture content, however, can be achieved when thaw propagation reaches the ice-rich transitional zone or transient layer at the active layer–permafrost boundary.
An increasing number of studies document thaw subsidence as a factor that can help to explain the lack of apparent active layer thickening despite significant climate warming [
18]. Shiklomanov et al. [
40] reported thaw subsidence of 10 to 18 cm from two sites in the Kuparuk River Basin on the Alaskan North Slope from 2001 to 2011, or surface subsidence rates from 1 to 1.8 cm/year. Slower subsidence rates from 0.4 to 1.0 cm/year were later reported by Streletskiy et al. from a site in Utqiagvik, Alaska, also on the North Slope [
34]. A rate of 1.3 cm/year was reported from the northern Russian European Plain near the city of Vorkuta after a total of 20 cm of subsidence was measured from 1999 to 2015 [
41]. Yet another study reported rates from 0.3 to 0.8 cm/year near the city of Norilsk, between the Central Siberian Plateau and the Taymyr Peninsula, reporting 3 cm of subsidence in typical tundra, 4 cm in polygonal tundra with frost boils, and 8 cm in water tracks from 2010 to 2020 [
42]. All of these studies suggest that, depending on soil moisture and ground ice conditions, thaw subsidence may account for 0.3 to 2.0 cm/year of thaw in addition to active layer thickness as measured relative to the ground surface.
Warmer climatic conditions in typical tundra subzones have also promoted vegetation growth. Thicker vegetation covers provide additional thermal insulation to the ground. Particularly effective insulators are mosses, and as their height and coverage increase, active layer trends decouple from atmospheric warming trends. Besides a strong thermal insulating effect, mosses can promote permafrost stability despite warming climate conditions through evapotranspiration [
43]. Different vegetation types have a variety of combined impacts on active layer and permafrost due to changes in albedo, canopy, and their ability to trap snow drifts, so these findings may not be applicable to southern tundra with shrubs and generally more heterogeneous vegetation communities [
9].
6. Conclusions
Statistical analyses of long-term permafrost monitoring in typical tundra landscapes of northwest Siberia demonstrate that mean annual air temperatures at the Marre-Sale Research Station have warmed by 4 °C from 1970 to 2020. In reaction to warmer air temperatures and prolonged warm summer seasons, the active layer has thickened, on average, by 10 cm in well-drained flat polygonal tundra to 33 cm in sand blowouts with little vegetation. However, despite the same climate forcing, active layer thickness has remained constant, or relatively stable, in peat bogs and even thinned 14 cm in wet polygonal tundra. The main factors that offset, or decouple, active layer thickness trends observed at sites underlain by peat and in polygonal tundra from climate trends include: (1) increased soil moisture content, (2) the presence of an ice-rich transient layer, and (3) thickening and expanding moss covers.
These results indicating the influences of soil moisture, permafrost ice content, and vegetation were discussed and found to confirm similar findings from studies conducted throughout bioclimatic subzone D in Siberia, Alaska, and Canada. Soils saturated near the surface can enhance thermal conductivity thickening the active layer, but nonsaturated, thawing soils release latent heat during phase transition, slowing active layer thickening. Thawing that reaches ice-rich transient layers can also slow active layer thickening as the ground compacts and the ground surface subsides. Vegetation thickness and spatial coverage (particularly that of mosses) thermally insulate the ground from summer warmth, also limiting thaw propagation from the surface and thereby hindering active layer development.
The trends detected from the extensive array of fine-scale, landscape-specific sites at Marre-Sale were also detected from the single, colocated CALM site, R3. However, this paper quantifies the R3 site’s positive bias (8 to 29 cm) due to the underrepresentation of moist and wet tundra landscapes within the 1 km2 grid. The R3 CALM site is then confirmed to be representative of regional landscape conditions and is an appropriate data source when accounting for the known sampling bias and internal site variability for northwest Siberian regional active layer estimations.
Author Contributions
Conceptualization, G.E.O., A.A.V. and D.A.S.; fieldwork data collection, G.E.O. and A.A.V.; analysis, G.E.O., A.A.V., D.A.S., N.I.S. and K.E.N.; writing—original draft preparation, G.E.O., A.A.V., D.A.S., N.I.S. and K.E.N.; writing—review and editing, G.E.O., A.A.V., D.A.S., N.I.S. and K.E.N.; visualization, G.E.O. and K.E.N.; project administration, A.A.V., D.A.S. and N.I.S.; funding acquisition, A.A.V. All authors have read and agreed to the published version of the manuscript.
Funding
This research was funded by the Russian Science Foundation project 22-27-00181.
Data Availability Statement
Acknowledgments
We are thankful to the many contributors to this work, including other researchers and students who assisted with filed data collection under the umbrella of Circumpolar Active Layer Monitoring (CALM) program, which is part of the Global Terrestrial Network for Permafrost (GTN-P). We thank three anonymous reviewers for constructive comments on the manuscript.
Conflicts of Interest
The authors declare no conflict of interest.
References
- Rantanen, M.; Karpechko, A.Y.; Lipponen, A.; Nordling, K.; Hyvärinen, O.; Ruosteenoja, K.; Vihma, T.; Laaksonen, A. The Arctic has warmed nearly four times faster than the globe since 1979. Commun. Earth Environ. 2022, 3, 168. [Google Scholar] [CrossRef]
- Thoman, R.; Druckenmiller, M.L.; Moon, T. State of the Climate in 2021. Bull. Am. Meteorol. Soc. 2022, 103, S257–S306. [Google Scholar] [CrossRef]
- Smith, S.L.; O’Neill, H.B.; Isaksen, K.; Noetzli, J.; Romanovsky, V.E. The changing thermal state of permafrost. Nat. Rev. Earth Environ. 2022, 3, 10–23. [Google Scholar] [CrossRef]
- Hjort, J.; Streletskiy, D.; Doré, G.; Wu, Q.; Bjella, K.; Luoto, M. Impacts of permafrost degradation on infrastructure. Nat. Rev. Earth Environ. 2022, 3, 24–38. [Google Scholar] [CrossRef]
- Melnikov, V.P.; Osipov, V.I.; Brouchkov, A.V.; Falaleeva, A.A.; Badina, S.V.; Zheleznyak, M.N.; Sadurtdinov, M.R.; Ostrakov, N.A.; Drozdov, D.S.; Osokin, A.B.; et al. Climate warming and permafrost thaw in the Russian Arctic: Potential economic impacts on public infrastructure by 2050. Nat. Hazards 2022, 112, 231–251. [Google Scholar] [CrossRef]
- Alexandrov, G.A.; Ginzburg, V.A.; Insarov, G.E.; Romanovskaya, A.A. CMIP6 model projections leave no room for permafrost to persist in Western Siberia under the SSP5-8.5 scenario. Clim. Chang. 2021, 169, 42. [Google Scholar] [CrossRef]
- Maslakov, A.; Shabanova, N.; Zamolodchikov, D.; Volobuev, V.; Kraev, G. Permafrost degradation within Eastern Chukotka CALM sites in the 21st century based on CMIP5 climate models. Geosciences 2019, 9, 232. [Google Scholar] [CrossRef]
- Guo, D.; Wang, H. Permafrost degradation and associated ground settlement estimation under 2 C global warming. Clim. Dyn. 2017, 49, 2569–2583. [Google Scholar] [CrossRef]
- Heijmans, M.M.; Magnússon, R.Í.; Lara, M.J.; Frost, G.V.; Myers-Smith, I.H.; van Huissteden, J.; Jorgenson, M.T.; Fedorov, A.N.; Epstein, H.E.; Lawrence, D.M. Tundra vegetation change and impacts on permafrost. Nat. Rev. Earth Environ. 2022, 3, 68–84. [Google Scholar] [CrossRef]
- Koch, J.C.; Sjöberg, Y.; O’Donnell, J.A.; Carey, M.P.; Sullivan, P.; Terskaia, A. Sensitivity of headwater streamflow to thawing permafrost and vegetation change in a warming Arctic. Environ. Res. Lett. 2022, 17, 044074. [Google Scholar] [CrossRef]
- Wright, S.N.; Thompson, L.M.; Olefeldt, D.; Connon, R.F.; Carpino, O.A.; Beel, C.R.; Quinton, W.L. Thaw-induced impacts on land and water in discontinuous permafrost: A review of the Taiga Plains and Taiga Shield, northwestern Canada. Earth-Sci. Rev. 2022, 232, 104104. [Google Scholar] [CrossRef]
- Knoblauch, C.; Beer, C.; Schuett, A.; Sauerland, L.; Liebner, S.; Steinhof, A.; Rethemeyer, J.; Grigoriev, M.N.; Faguet, A.; Pfeiffer, E.M. Carbon dioxide and methane release following abrupt thaw of Pleistocene permafrost deposits in Arctic Siberia. J. Geophys. Res. Biogeosciences 2021, 126, e2021JG006543. [Google Scholar] [CrossRef]
- Schiferl, L.D.; Watts, J.D.; Larson, E.J.; Arndt, K.A.; Biraud, S.C.; Euskirchen, E.S.; Goodrich, J.P.; Henderson, J.M.; Kalhori, A.; McKain, K. Using atmospheric observations to quantify annual biogenic carbon dioxide fluxes on the Alaska North Slope. Biogeosciences 2022, 19, 5953–5972. [Google Scholar] [CrossRef]
- Schuur, E.A.; McGuire, A.D.; Schädel, C.; Grosse, G.; Harden, J.; Hayes, D.J.; Hugelius, G.; Koven, C.D.; Kuhry, P.; Lawrence, D.M. Climate change and the permafrost carbon feedback. Nature 2015, 520, 171–179. [Google Scholar] [CrossRef] [PubMed]
- Schuur, E.A.; Abbott, B.W.; Commane, R.; Ernakovich, J.; Euskirchen, E.; Hugelius, G.; Grosse, G.; Jones, M.; Koven, C.; Leshyk, V. Permafrost and climate change: Carbon cycle feedbacks from the warming Arctic. Annu. Rev. Environ. Resour. 2022, 47, 343–371. [Google Scholar] [CrossRef]
- Strand, S.M.; Christiansen, H.H.; Johansson, M.; Åkerman, J.; Humlum, O. Active layer thickening and controls on interannual variability in the Nordic Arctic compared to the circum-Arctic. Permafr. Periglac. Process. 2021, 32, 47–58. [Google Scholar] [CrossRef]
- Abramov, A.; Davydov, S.; Ivashchenko, A.; Karelin, D.; Kholodov, A.; Kraev, G.; Lupachev, A.; Maslakov, A.; Ostroumov, V.; Rivkina, E. Two decades of active layer thickness monitoring in northeastern Asia. Polar Geogr. 2021, 44, 186–202. [Google Scholar] [CrossRef]
- Nyland, K.E.; Shiklomanov, N.I.; Streletskiy, D.A.; Nelson, F.E.; Klene, A.E.; Kholodov, A.L. Long-term Circumpolar Active Layer Monitoring (CALM) program observations in Northern Alaskan tundra. Polar Geogr. 2021, 44, 167–185. [Google Scholar] [CrossRef]
- Bonnaventure, P.P.; Lamoureux, S.F. The active layer: A conceptual review of monitoring, modelling techniques and changes in a warming climate. Prog. Phys. Geogr. 2013, 37, 352–376. [Google Scholar] [CrossRef]
- Previdi, M.; Smith, K.L.; Polvani, L.M. Arctic amplification of climate change: A review of underlying mechanisms. Environ. Res. Lett. 2021, 16, 093003. [Google Scholar] [CrossRef]
- Walker, D.A.; Raynolds, M.K.; Daniëls, F.J.; Einarsson, E.; Elvebakk, A.; Gould, W.A.; Katenin, A.E.; Kholod, S.S.; Markon, C.J.; Melnikov, E.S. The circumpolar Arctic vegetation map. J. Veg. Sci. 2005, 16, 267–282. [Google Scholar] [CrossRef]
- Walker, D.A.; Daniëls, F.J.A.; Matveyeva, N.V.; Šibík, J.; Walker, M.D.; Breen, A.L.; Druckenmiller, L.A.; Raynolds, M.K.; Bültmann, H.; Hennekens, S.; et al. Circumpolar Arctic Vegetation Classification. Phytocoenologia 2018, 2, 181–201. [Google Scholar] [CrossRef]
- Brown, J.; Ferrians, O.J.; Heginbottom, J.; Melnikov, E. Circum-Arctic Map of Permafrost and Ground-Ice Conditions; US Geological Survey Reston: Reston, VA, USA, 1997. [Google Scholar]
- Melnikov, E. Terrain Units of the Permafrost Region of West Siberia Natural Gas Province; Nauka: Novosibirsk, Russia, 1984. (In Russian) [Google Scholar]
- Forman, S.L.; Ingólfsson, O.; Gataullin, V.; Manley, W.; Lokrantz, H. Late Quaternary stratigraphy, glacial limits, and paleoenvironments of the Marresale area, western Yamal Peninsula, Russia. Quat. Res. 2002, 57, 355–370. [Google Scholar] [CrossRef]
- Aleksandrova, V.D. The Arctic and Antarctic: Their division into geobotanical areas. In The Arctic and Antarctic: Their Division into Geobotanical Areas; Cambridge University Press: Cambridge, UK, 1980. [Google Scholar]
- Bliss, L.C. Arctic Ecosystems of North America. In Polar and Alpine Tundra; Wiegolawski, F.E., Ed.; Elsevier: Amsterdam, The Netherlands, 1997; pp. 551–683. [Google Scholar]
- Shiklomanov, N.; Streletskiy, D.; Nelson, F. Northern Hemisphere Component of the Global Circumpolar Active Layer Monitoring (CALM) Program. In Proceedings of the 10th International Conference on Permafrost, Salekhard, Russia, 25–29 June 2012; pp. 377–382. [Google Scholar]
- Moskalenko, N.G. Antropogennye Izmeneniya Ekosistem Zapadno-Sibirskoj Gazonosnoj Provincii [An-Thropogenic Changes in the Ecosystems of the West Siberian Gas-Bearing Province]; Siberian Branch of the Russian Academy of Sciences, Earth Cryosphere Institute: Novosibirsk, Russia, 2006; p. 357. [Google Scholar]
- Nelson, F.E.; Outcalt, S.I. A Computational Method for Prediction and Regionalization of Permafrost. Arct. Alp. Res. 1987, 19, 279–288. [Google Scholar] [CrossRef]
- Vasiliev, A.A.; Leibman, M.O.; Moskalenko, N.G. Active Layer Monitoring in West Siberia under the CALM II Program. In Proceedings of the Ninth International Conference on Permafros, Fairbanks, AK, USA, 29 June–3 July 2008; Kane, D., Hinkel, K., Eds.; Institute of Northern Engineering, University of Alaska Fairbanks: Fairbanks, AK, USA, 2008; pp. 1815–1820. [Google Scholar]
- Shur, Y.L.; Hinkel, K.M.; Nelson, F.E. The transient layer: Implications for geocryology and climate-change science. Permafr. Periglac. Process. 2005, 16, 5–17. [Google Scholar] [CrossRef]
- Shur, Y.L. Upper Horizon of Permafrost and Thermokarst; USSR Academy of Sciences, Siberian Branch: Novosibirsk, Russia, 1988; p. 209. [Google Scholar]
- Streletskiy, D.A.; Shiklomanov, N.I.; Little, J.D.; Nelson, F.E.; Brown, J.; Nyland, K.E.; Klene, A.E. Thaw subsidence in undisturbed tundra landscapes, Barrow, Alaska, 1962–2015. Permafr. Periglac. Process. 2017, 28, 566–572. [Google Scholar] [CrossRef]
- Dorrepaal, E.; Aerts, R.; Cornelissen, J.H.; Callaghan, T.V.; Van Logtestijn, R.S. Summer warming and increased winter snow cover affect Sphagnum fuscum growth, structure and production in a sub-arctic bog. Glob. Chang. Biol. 2004, 10, 93–104. [Google Scholar] [CrossRef]
- Romanovsky, V.E.; Smith, S.L.; Isaksen, K.; Shiklomanov, N.I.; Streletskiy, D.A.; Kholodov, A.L.; Christiansen, H.H.; Drozdov, D.S.; Malkova, G.V.; Marchenko, S.S. Terrestrial Permafrost [in “State of the Climate in 2017”]. Bull. Am. Meteorol. Soc. 2018, 99, 161–165. [Google Scholar]
- Clayton, L.K.; Schaefer, K.; Battaglia, M.J.; Bourgeau-Chavez, L.; Chen, J.; Chen, R.H.; Chen, A.; Bakian-Dogaheh, K.; Grelik, S.; Jafarov, E. Active layer thickness as a function of soil water content. Environ. Res. Lett. 2021, 16, 055028. [Google Scholar] [CrossRef]
- Shiklomanov, N.I.; Streletskiy, D.A.; Nelson, F.E.; Hollister, R.D.; Romanovsky, V.E.; Tweedie, C.E.; Bockheim, J.G.; Brown, J. Decadal variations of active-layer thickness in moisture-controlled landscapes, Barrow, Alaska. J. Geophys. Res. Biogeosci. 2010, 115, G4. [Google Scholar] [CrossRef]
- Magnússon, R.Í.; Hamm, A.; Karsanaev, S.V.; Limpens, J.; Kleijn, D.; Frampton, A.; Maximov, T.C.; Heijmans, M.M. Extremely wet summer events enhance permafrost thaw for multiple years in Siberian tundra. Nat. Commun. 2022, 13, 1556. [Google Scholar] [CrossRef] [PubMed]
- Shiklomanov, N.; Streletskiy, D.; Little, J.; Nelson, F. Isotropic thaw subsidence in undisturbed permafrost landscapes. Geophys. Res. Lett. 2013, 40, 6356–6361. [Google Scholar] [CrossRef]
- Kaverin, D.; Pastukhov, A.; Novakovskiy, A. Active layer thickness dynamics in the tundra permafrost: Affected soils: A calm site study, the European north of Russia. Earth Cryosphere 2017, 21, 35–44. [Google Scholar]
- Grebenets, V.I.; Tolmanov, V.A.; Streletskiy, D.A. Active layer dynamics near Norilsk, Taimyr peninsula, Russia. Geogr. Environ. Sustain. 2021, 14, 1055–1065. [Google Scholar] [CrossRef]
- Blok, D.; Heijmans, M.; Schaepman-Strub, G.; van Ruijven, J.; Parmentier, F.; Maximov, T.; Berendse, F. The cooling capacity of mosses: Controls on water and energy fluxes in a Siberian tundra site. Ecosystems 2011, 14, 1055–1065. [Google Scholar] [CrossRef]
| Disclaimer/Publisher’s Note: The statements, opinions and data contained in all publications are solely those of the individual author(s) and contributor(s) and not of MDPI and/or the editor(s). MDPI and/or the editor(s) disclaim responsibility for any injury to people or property resulting from any ideas, methods, instructions or products referred to in the content. |
© 2023 by the authors. Licensee MDPI, Basel, Switzerland. This article is an open access article distributed under the terms and conditions of the Creative Commons Attribution (CC BY) license (https://creativecommons.org/licenses/by/4.0/).


 ,
, 


