Article

Assessment of the Record-Breaking 2020 Rainfall in Guinea-Bissau and Impacts of Associated Floods

by
Orlando Mendes
1,2 and
Marcelo Fragoso
2,3,*
1
National Institute of Meteorology of Guinea-Bissau, Avenida do Brasil, Cx.P. 75 1038 Bissau, Guinea-Bissau
2
Centre of Geographical Studies, Institute of Geography and Spatial Planning, University of Lisbon, 1600-276 Lisbon, Portugal
3
Associated Laboratory Terra, 1349-017 Lisbon, Portugal
*
Author to whom correspondence should be addressed.
Geosciences 2023, 13(2), 25; https://doi.org/10.3390/geosciences13020025
Submission received: 1 December 2022 / Revised: 16 January 2023 / Accepted: 18 January 2023 / Published: 20 January 2023
(This article belongs to the Special Issue Scientific Assessment of Recent Natural Hazard Events)

Abstract

:
The impacts of Climate Change are quite visible in Guinea-Bissau. Greater irregularity at the beginning and end of the rainy season, as well as in relation to the interannual variability of precipitation, are evidence that shows these phenomena in West African countries and particularly in Guinea-Bissau, where the agriculture is rain-fed. The year 2020 was characterized as very rainy in comparison to the climatological average of 1981–2020, with positive anomalies throughout the country, despite the late arrival of the wet season, which usually occurs in May. July, August, and September 2020 were the rainiest months, registering above a normal frequency of days with precipitation greater than 50 mm. Bissau, the capital, registered a record-breaking annual rainfall and monthly amounts higher than the 90th and 95th percentiles in July and August, respectively. This heavy rain accompanied by strong winds caused flooding in several urban areas and agricultural fields, and the destruction of roads, houses, and infrastructures in different cities across the country. As a way of mitigating these impacts, the government, through the Ministry of Solidarity, made available 100 million CFA francs (6.5 million euros) to help families that were victims of the floods.

1. Introduction

In West Africa, weather and climate have a major impact on agricultural production, water resources, and public health, as well as other economic sectors such as power generation, transport, and fisheries. Guinea-Bissau (Figure 1) belongs to the group of the world’s poorest and most fragile countries. Its economy is essentially based on non-mechanized rain-fed agriculture, fishing, cashew exports, non-formal trade, and foreign aid. In this country, agriculture is the most dominant economic sector, contributing for 69% of GDP, contributing to over 90% of exports [1], and employing 83.6% of the active population [2]. These elements reveal a context of strong vulnerability to the variability of precipitation. About 75% of the population lives in rural areas and depends mainly on agriculture for their livelihood, so the lack or excess of rain reflects negatively on the living subsistence levels. Similar to other West African countries, the impact of climate variability is manifested by reduced agricultural production, worsening food crises [3], and increased imports [4]. Accumulated evidence indicates that agricultural production is being affected by climate change [5] which represents an additional burden for developing countries in meeting food security targets [3] and the amount needed to meet the increasing demand for food. The populations of Guinea-Bissau coastal areas are among the most vulnerable communities to sea-level rise (SLR) and tropical storms in Africa [6], and coastal flooding will tend to intensify with the expected SLR in coming decades [7]. The intensity and frequency of heavy rainfall have increased significantly [8,9] in West Africa, and provide a glimpse of what the future rainfall regime might look like. Projected increase in heavy rainfall events at all levels of warming in many regions in Africa will cause increasing exposure to pluvial and riverine flooding (high confidence), with expected human displacement increasing 200% for 1.6 °C and 600% for 2.6 °C [10]. These extreme variations have serious consequences for populations and development, and are associated with hydro-climatic events such as extreme floods and droughts [8] that often lead to loss of life, population displacement, damage to the infrastructure, and disastrous disruption to water management and agriculture. In addition to extreme events, annual rainfall variability is a major concern for West Africa regarding the timing of agricultural activities.
The course of the agricultural season in Guinea-Bissau is controlled by the evolution of the Intertropical Front (ITF), which is a key feature of atmospheric circulation over the West African region. The ITF is a discontinuity surface between two air masses with very different characteristics: tropical continental, warm and dry air from the harmattan of the northern hemisphere, and tropical maritime, cold and humid air, from the monsoon in the southern hemisphere [11]. The monsoon phenomenon is linked to seasonal variations in the Intertropical Convergence Zone (ITCZ) and follows the apparent movement of the Sun, moving north during the rainy season and returning south during the dry season [12]. Some studies [13,14,15] have revealed the close link between the West African Monsoon and daily average rainfall during the rainy season in the region. The West African monsoon dynamics depend on the sea surface temperature (SST) anomalies [16]. Higher amounts of rainfall in the Sahel regions are observed in the presence of negative SST anomalies in the Gulf of Guinea and simultaneously in a position further north of the ITCZ [11] while, in the Gulf of Guinea, increased precipitation along the coast is associated with increased moisture transport in the lower troposphere induced by the positive SST anomaly and a higher evaporation flux [17]. The atmospheric mechanisms responsible for rainfall intensification in the West African Monsoon region are mainly associated with the enhanced activity of mesoscale convective systems (MCS), which in turn are driven by atmospheric features such as Easterly waves (AEW) and Kelvin waves, e.g., [18,19,20,21].
The seasonal Forecast of Agro-Hydro-Climatic Characteristics for the Sahel zones and West African countries [22] predicted before the start of the rainy season of 2020 that the year would be rainy based on analyses of the surface temperatures of the tropical Atlantic Ocean, which were generally above average, particularly in the Gulf of Guinea and along the coasts of West Africa, which are the favorable conditions for a rainy season, especially for Guinea-Bissau.
In Guinea-Bissau, late onsets and early ends of the rainy season are factors of concern for peasant communities regarding the success of the agricultural campaign [23]. This situation can be further aggravated by the occurrence of droughts or excessive rains during crop development. The year 2020 was characterized as an anomalously wet year. Despite the late arrival of precipitation (beginning of June), the months of July, August, and September were very rainy, which had great consequences related to flooding in the rice fields in the bolanhas and fields of cultivation in the plateaus such as corn, sorghum, mancarra (peanuts), beans and others, causing large derangements and delays in farming activities due to excess water. The relevance of these impacts motivated the authors to carry out this observational study to achieve the following objectives: (1) assess the anomalous, very rainy character of the 2020 rainfall year in Guinea-Bissau using the available long-term precipitation records of the country, and a high-resolution dataset combining rainfall satellite estimates with in situ observations (CHIRPS); (2) characterize the most critical periods of abundant rainfall, and identity the most affected regions; (3) describe the main impacts of the 2020 rainfall, namely its effects on agricultural production and destructive effects (floods, damage to infrastructure). Possible physical mechanisms of the anomalous 2020 rainfall in Guinea-Bissau were not addressed in the current research because this issue will require an upcoming specific study, similarly to those conducted by [24,25] which, respectively, studied precipitation extremes verified in the same year in Java (Indonesia) and Eastern China.

2. Materials and Methods
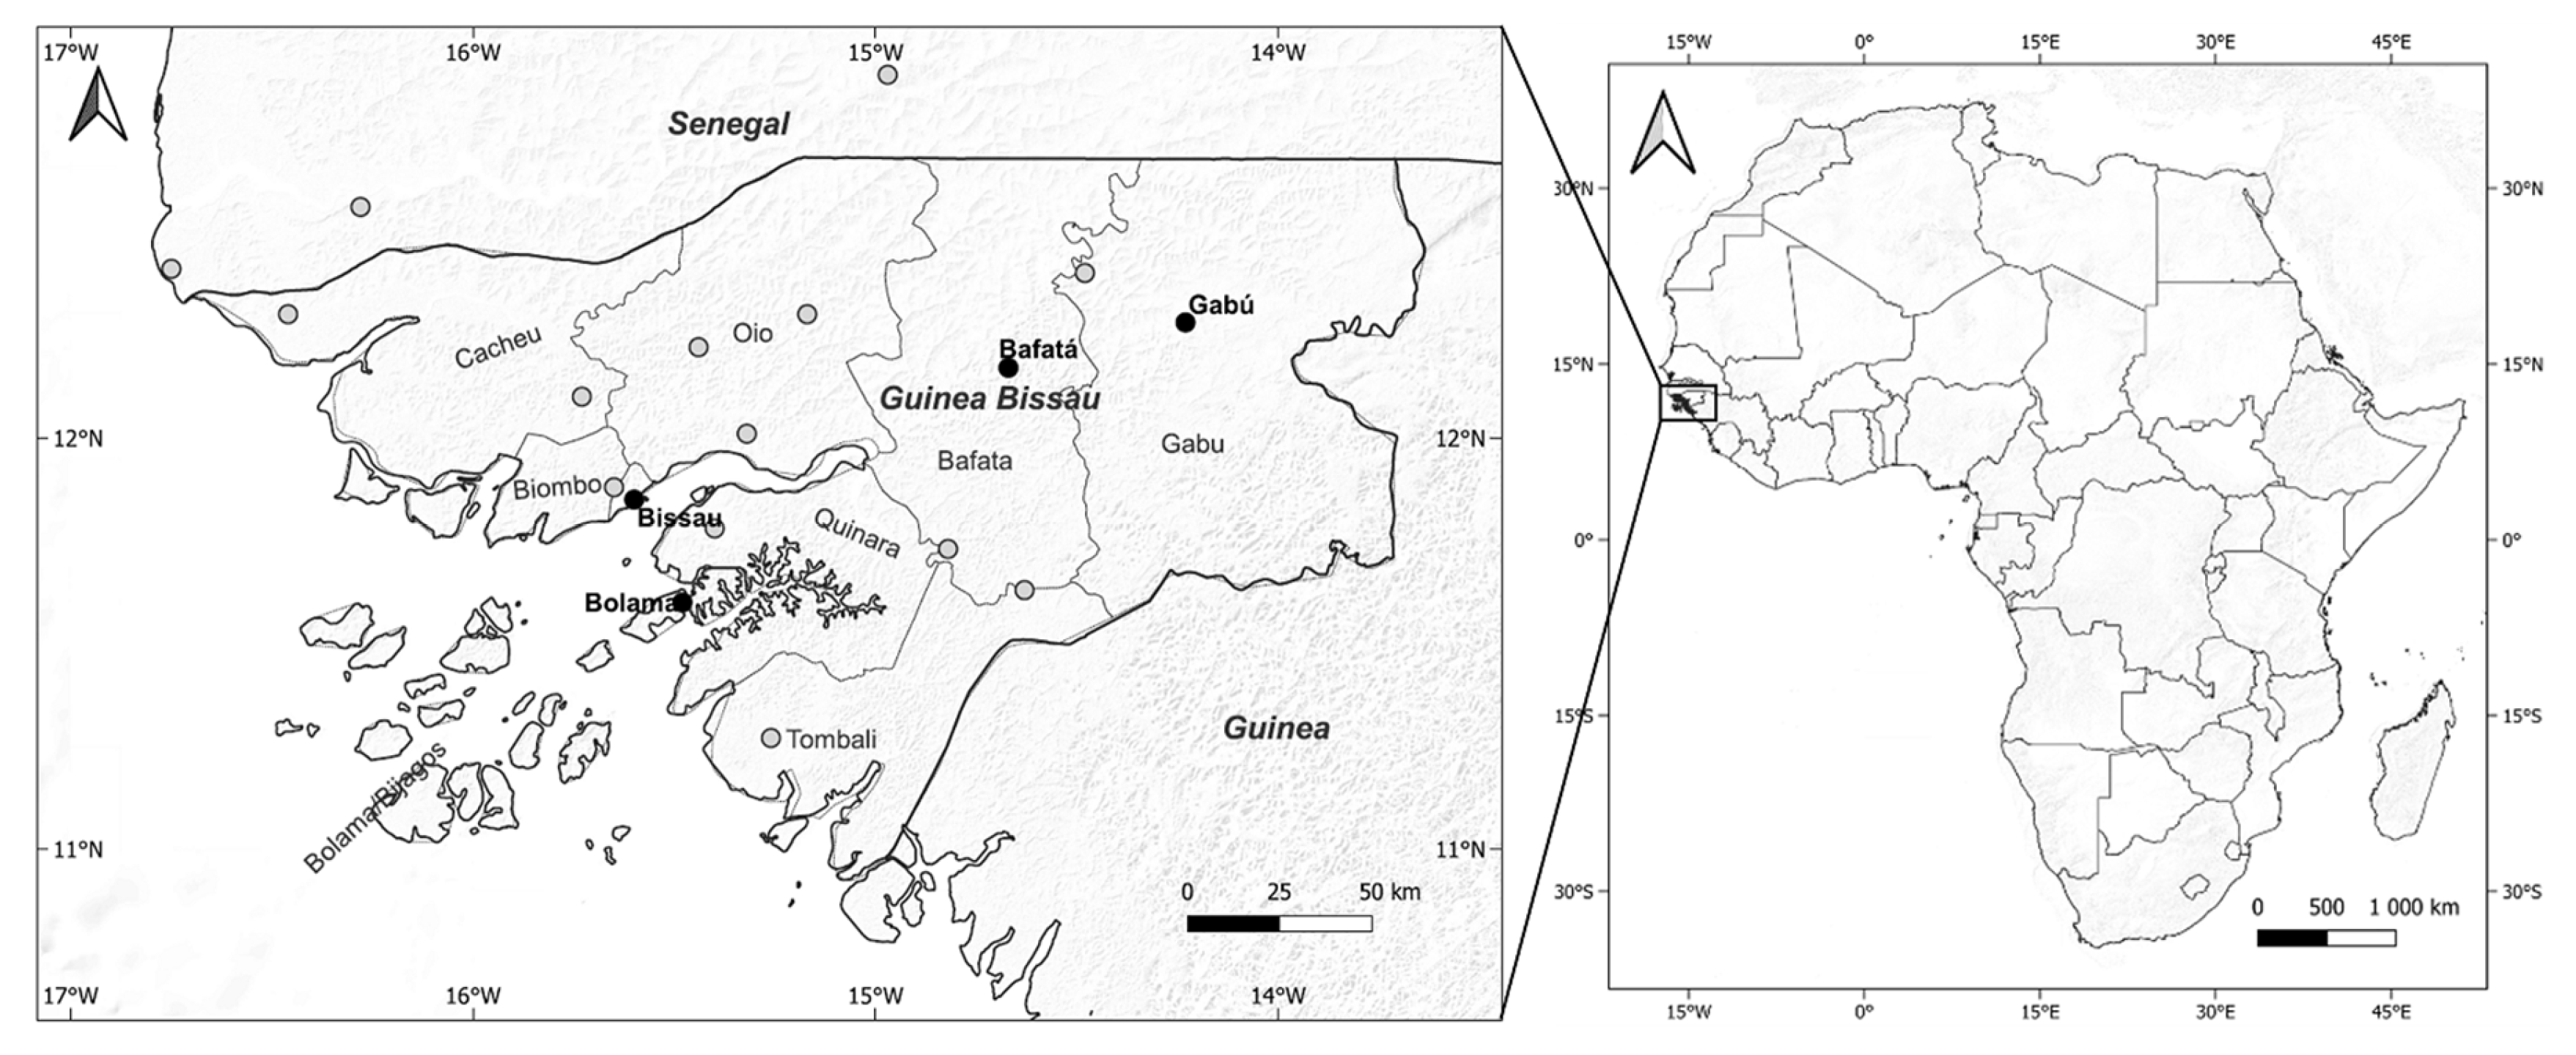
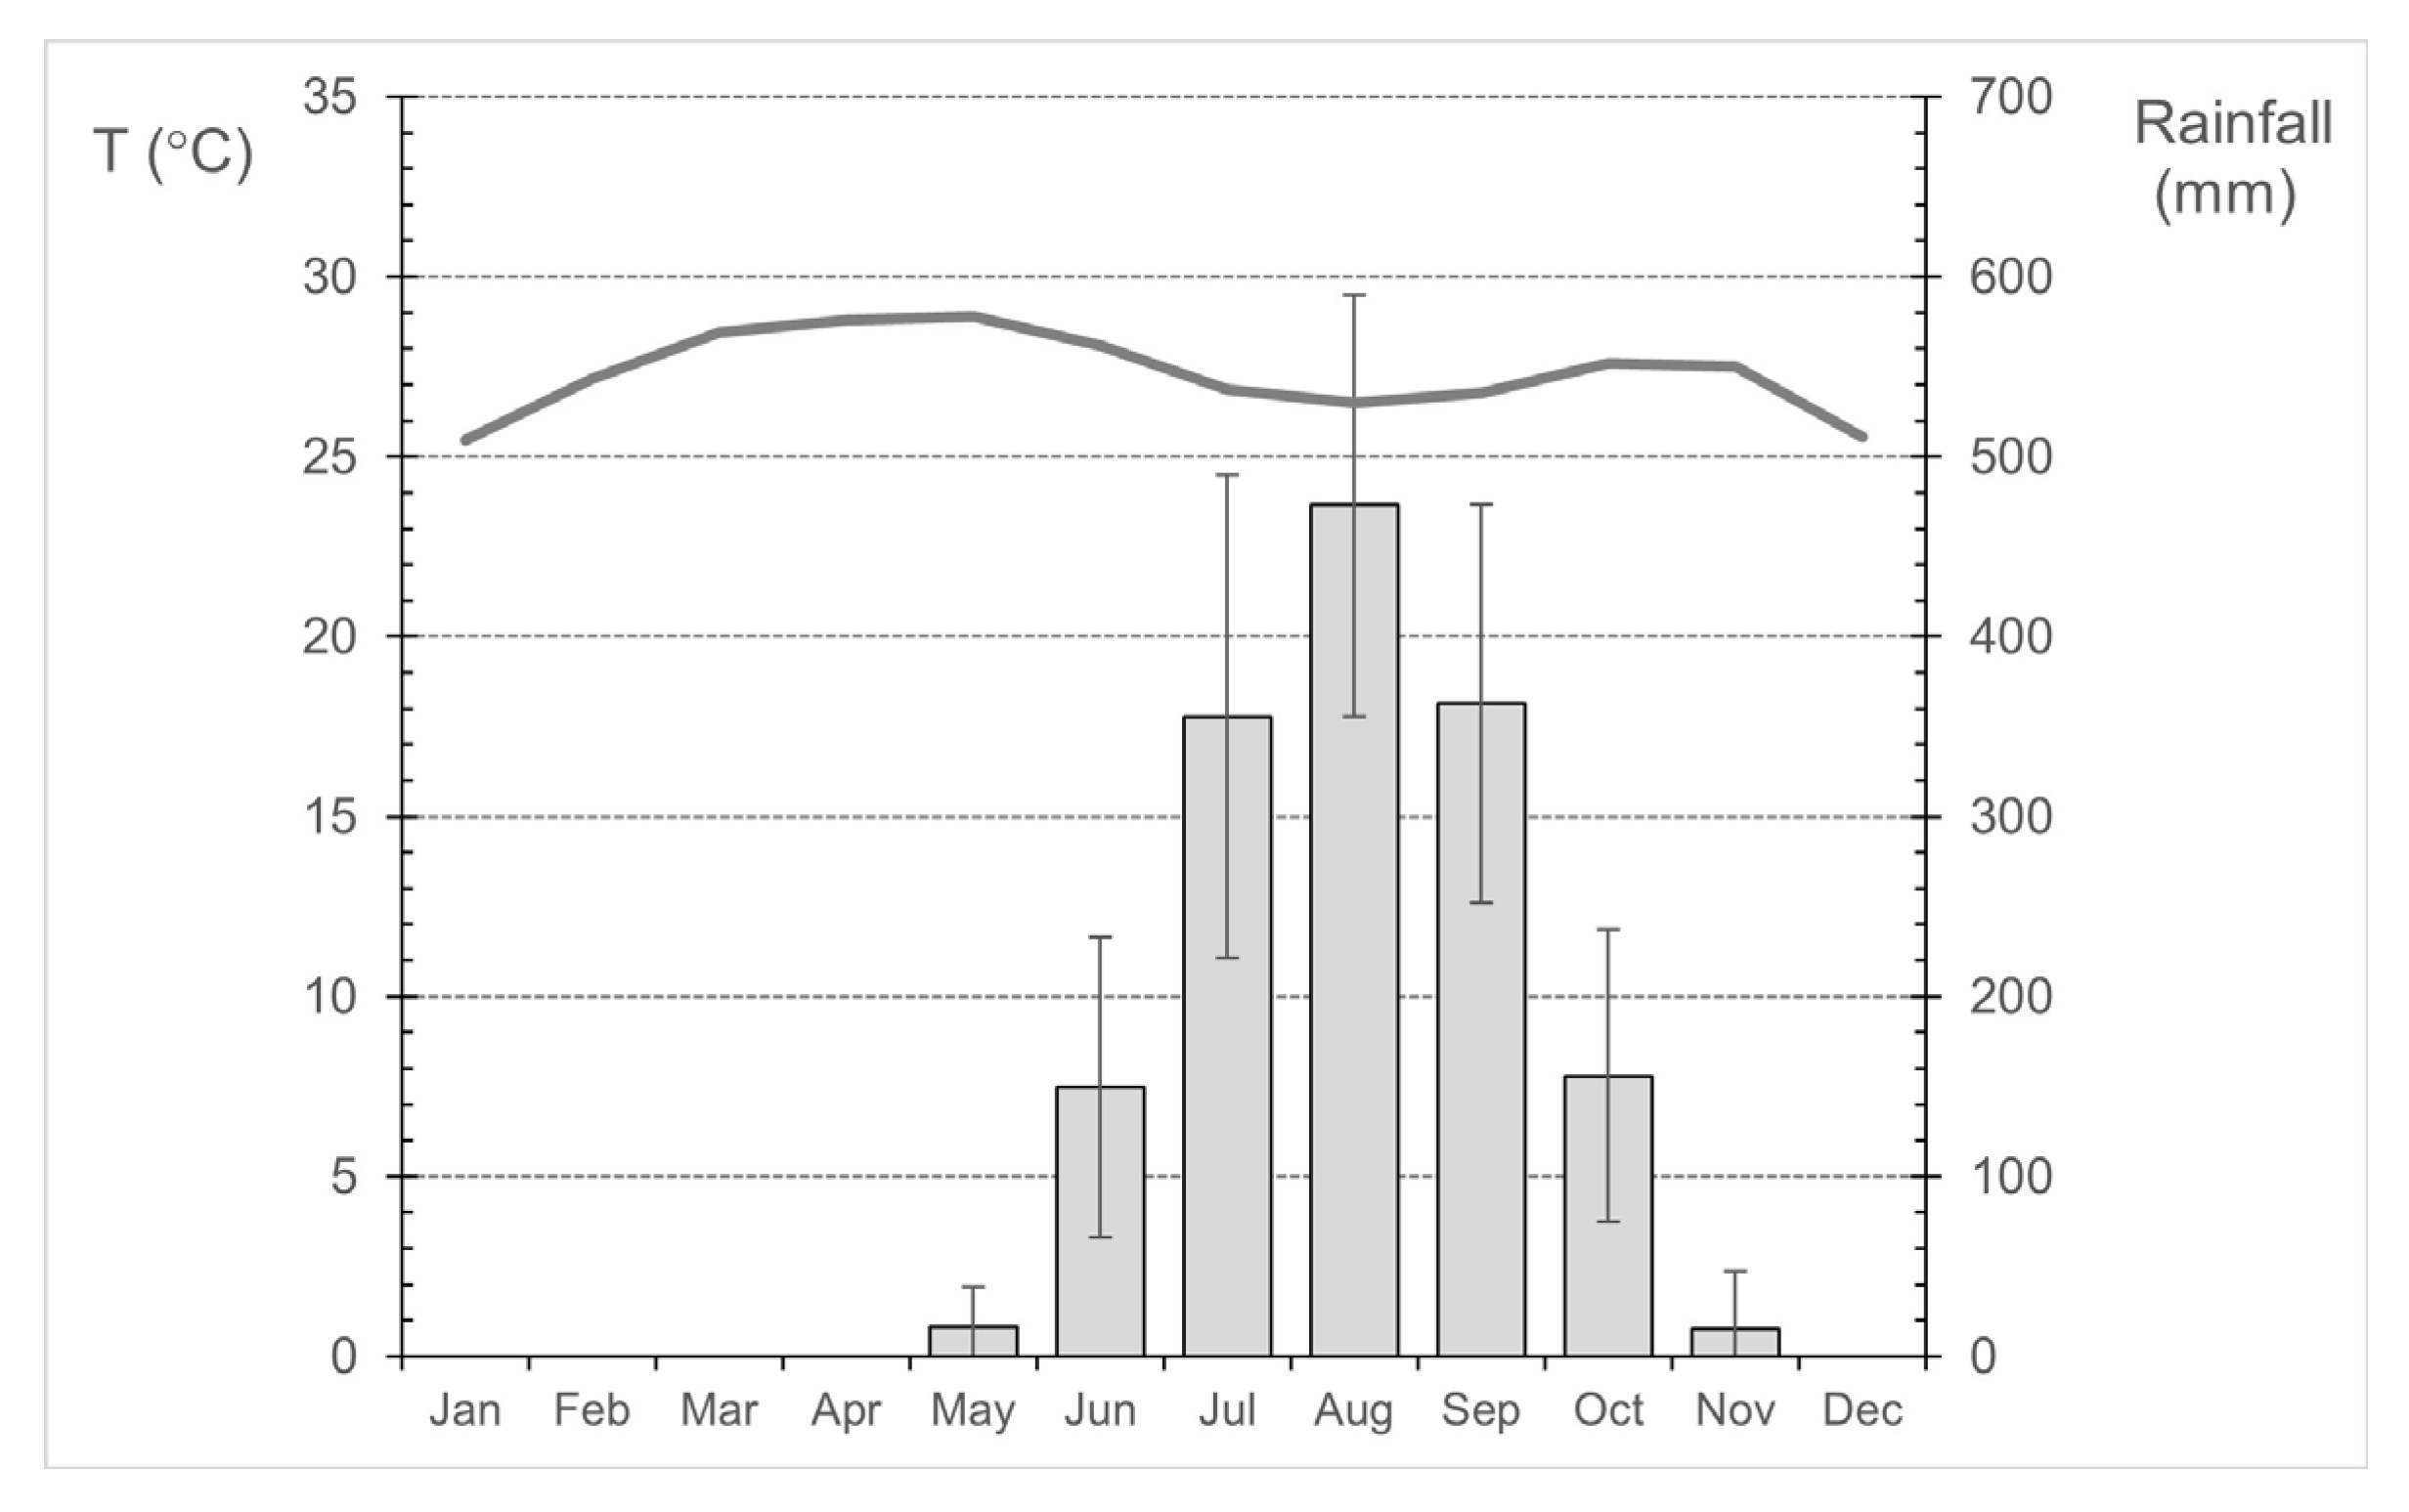
2.1. Study Area

The Republic of Guinea-Bissau (Figure 1) is located in West Africa, limited to the North and East by the Republic of Senegal, South by the Republic of Guinea-Conakry, and West by the Atlantic Ocean, covering a total surface of 36,125 km2. Due to the dominance of flat and low-lying areas, combined with the ecological context, extensive marshy forests of mangroves can be found in the coastal mainland estuaries of Cacheu, Biombo, Oio, Quínara, and Tombali regions and in the Bijagós archipelago [26] (region’s location can be seen in Figure 1). According to [27], Guinea-Bissau is the second country in Africa with the largest extent of mangrove forest and pertains to the top 15 in the world with this land use class.
The climate of West Africa is dominated by the monsoon which is one of the world´s three main monsoon systems. The West African Monsoon represents a seasonal reversal of the prevailing surface winds over most of the West African region. The winter northeast Harmattan winds are replaced in the summer months by the southwest monsoon winds. Summer monsoons bring moisture from the Atlantic Ocean to the mainland and therefore fuel the annual precipitation that is so critical for local populations. Year-to-year monsoon variations determine the difference between good rainfall years and bad years; or on a regional basis, between sufficient rain and drought [28].
The climate of Guinea-Bissau is tropical, and according to the Köppen climate classification, it is a tropical climate of the Aw type, with a rainy season in the summer and a dry season in the winter. The coastal zone is characterized by a tropical sub-Guinean climate with average annual rainfall between 1500 and 2500 mm and the continental part is characterized by a tropical Sudan-Guinean climate with rainfall between 1000 and 1500 mm [29]. Annual average temperatures range from 24 °C to 27 °C [30]. The temperature regime (Figure 2) is characterized by a low annual range (less than 4 °C), May as the hottest month (29 °C) and January as the coldest one (25 °C). The annual rainfall regime is defined by two seasons, the dry season which runs from November to early May, with dominant Northeasterly winds (including the Harmattan wind, characteristic of this region of West Africa [31], and the rainy season, which starts in late May and extends to early November. The wettest months throughout the year are the months of July, August, and September (Figure 2).

2.2. Data

Four main meteorological stations in the country have long series of climatological data (Figure 1, black dots): Bissau Observatory station, which represents the center and north; the Bolama station represents the south and islands; Bafatá and Gabu stations are representative of the climate in the inner and eastern sector of the territory. In addition to these meteorological stations, data from other fifteen rainfall stations of Guinea-Bissau and conterminous regions (Figure 1, gray dots) were used to plot maps of annual and monthly precipitation sums.
To overcome the limitations that arise from the scarce number of gauge stations with long-term series of rainfall data, it was also necessary to explore, as a supplementary information source, a high-resolution dataset combining satellite rainfall estimates with in situ observations, the widely used Climate Hazards Group InfraRed Precipitation with Station dataset (CHIRPSv2.0s) [32]. This daily gridded dataset is global, and its temporal domain extends from 1981 to present, allowing construction of 2020 anomaly maps (yearly and monthly precipitation amounts) based on a climatological period.

2.3. Precipitation Mapping

Interpolation modeling techniques were performed in QGIS software (3.22 version), namely the Inverse Distance Weighting method, allowing the construction of different maps depicting annual and monthly precipitation spatial patterns, based on meteorological stations. Climate Data Operators and Panoply (version 5.2.3) were the applications used to manipulate and analyze precipitation gridded data (CHIRPSv2.0 dataset).

2.4. Calculations of Anomalies and Different Types of Climate Indices

The 40 years series of observed precipitation data (1981–2020) from the four main stations mentioned above were used for the calculation of annual precipitation anomalies concerning the climatological mean of the same period and the calculation of the monthly percentiles (90 and 95%), as well as in calculating several extreme precipitation indices regarding the rainy year of 2020. A selection of daily precipitation indices [15] for the year 2020 was calculated for the four main stations above mentioned and comprise the total annual precipitation, number of rainy days, number of days with precipitation greater or equal to 1 mm, 10 mm, 25 mm, 50 mm, 75 mm, and 100 mm, respectively, and also the identification of the wettest day of the year.
Precipitation anomalies were calculated for the period (1981–2020) using the equation given below [33] to identify the wettest and driest years of the referred period.
I = Xi X ¯   δ
where I is the precipitation index or anomaly, Xi is the precipitation of year I, X ¯ is the average precipitation for the reference period, and δ is the standard deviation of the precipitation of the climatological series.
A table (not shown) listing the days of precipitation greater than 50 mm in the wettest months (July, August, and September) in the analyzed stations was produced to identify the most critical precipitation events to trigger flooding that occurred in different parts of the country. The software Instat+ [34] was used to calculate the extreme precipitation indices.

3. Results

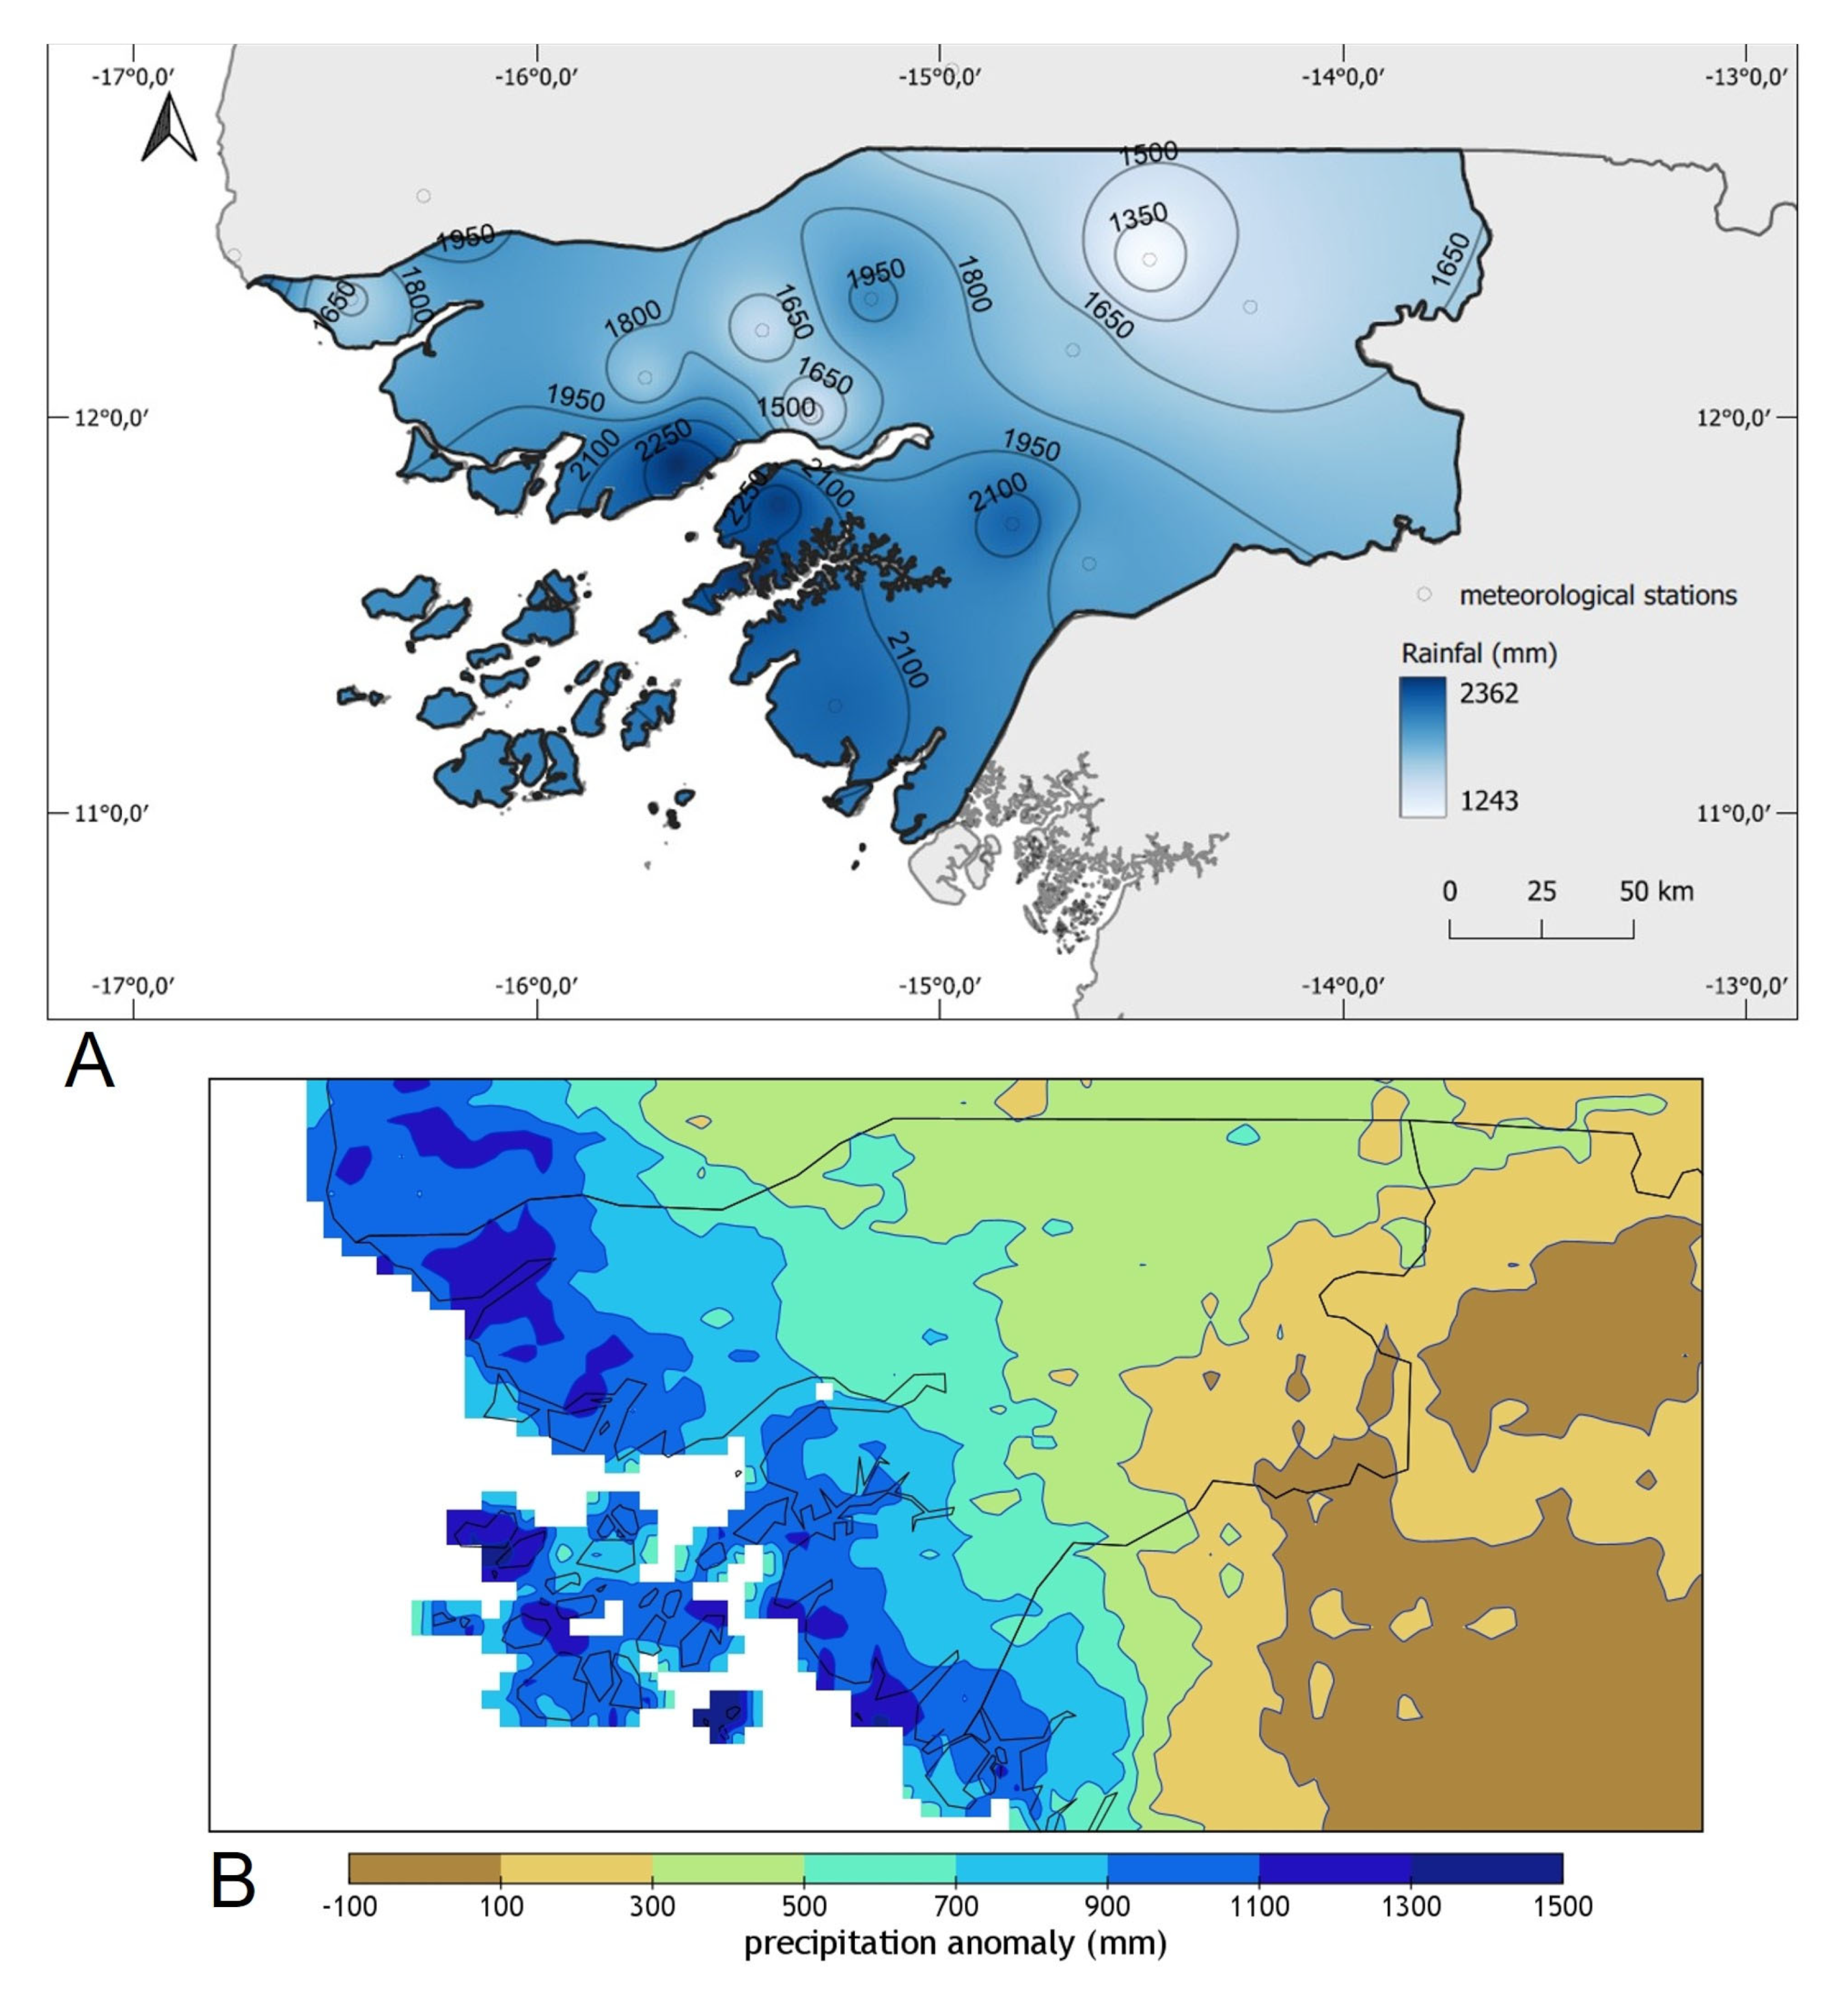
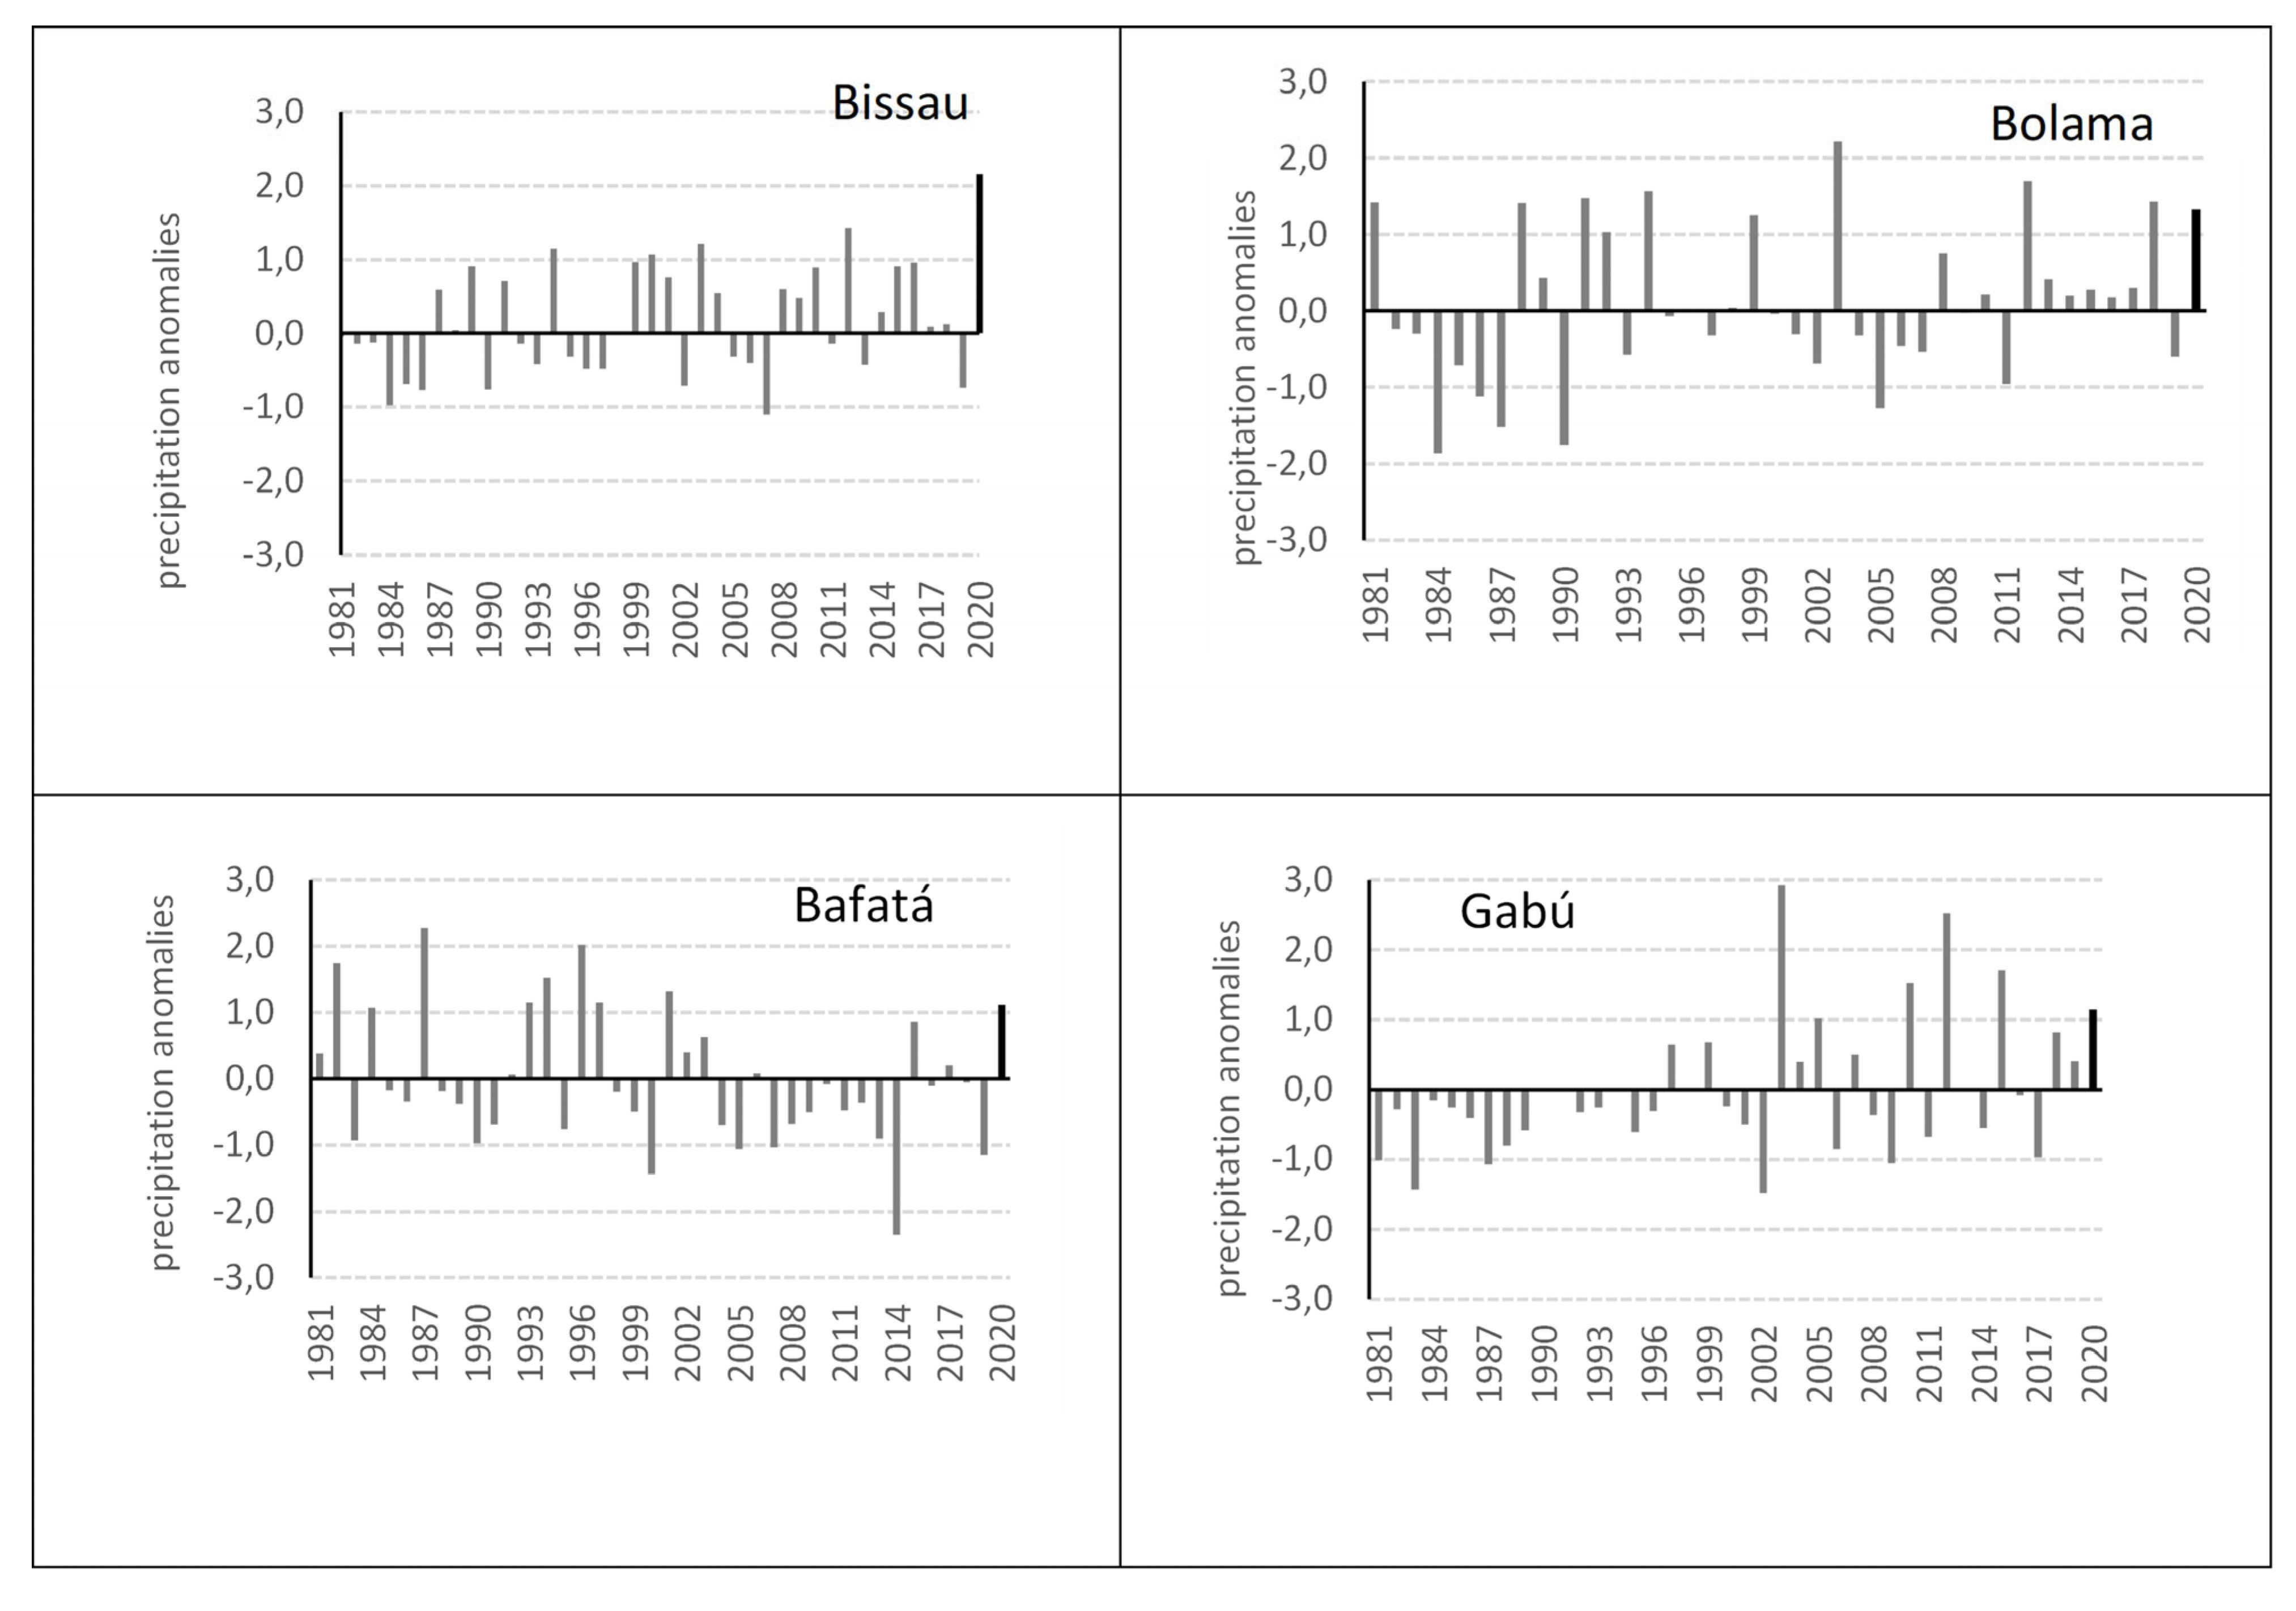
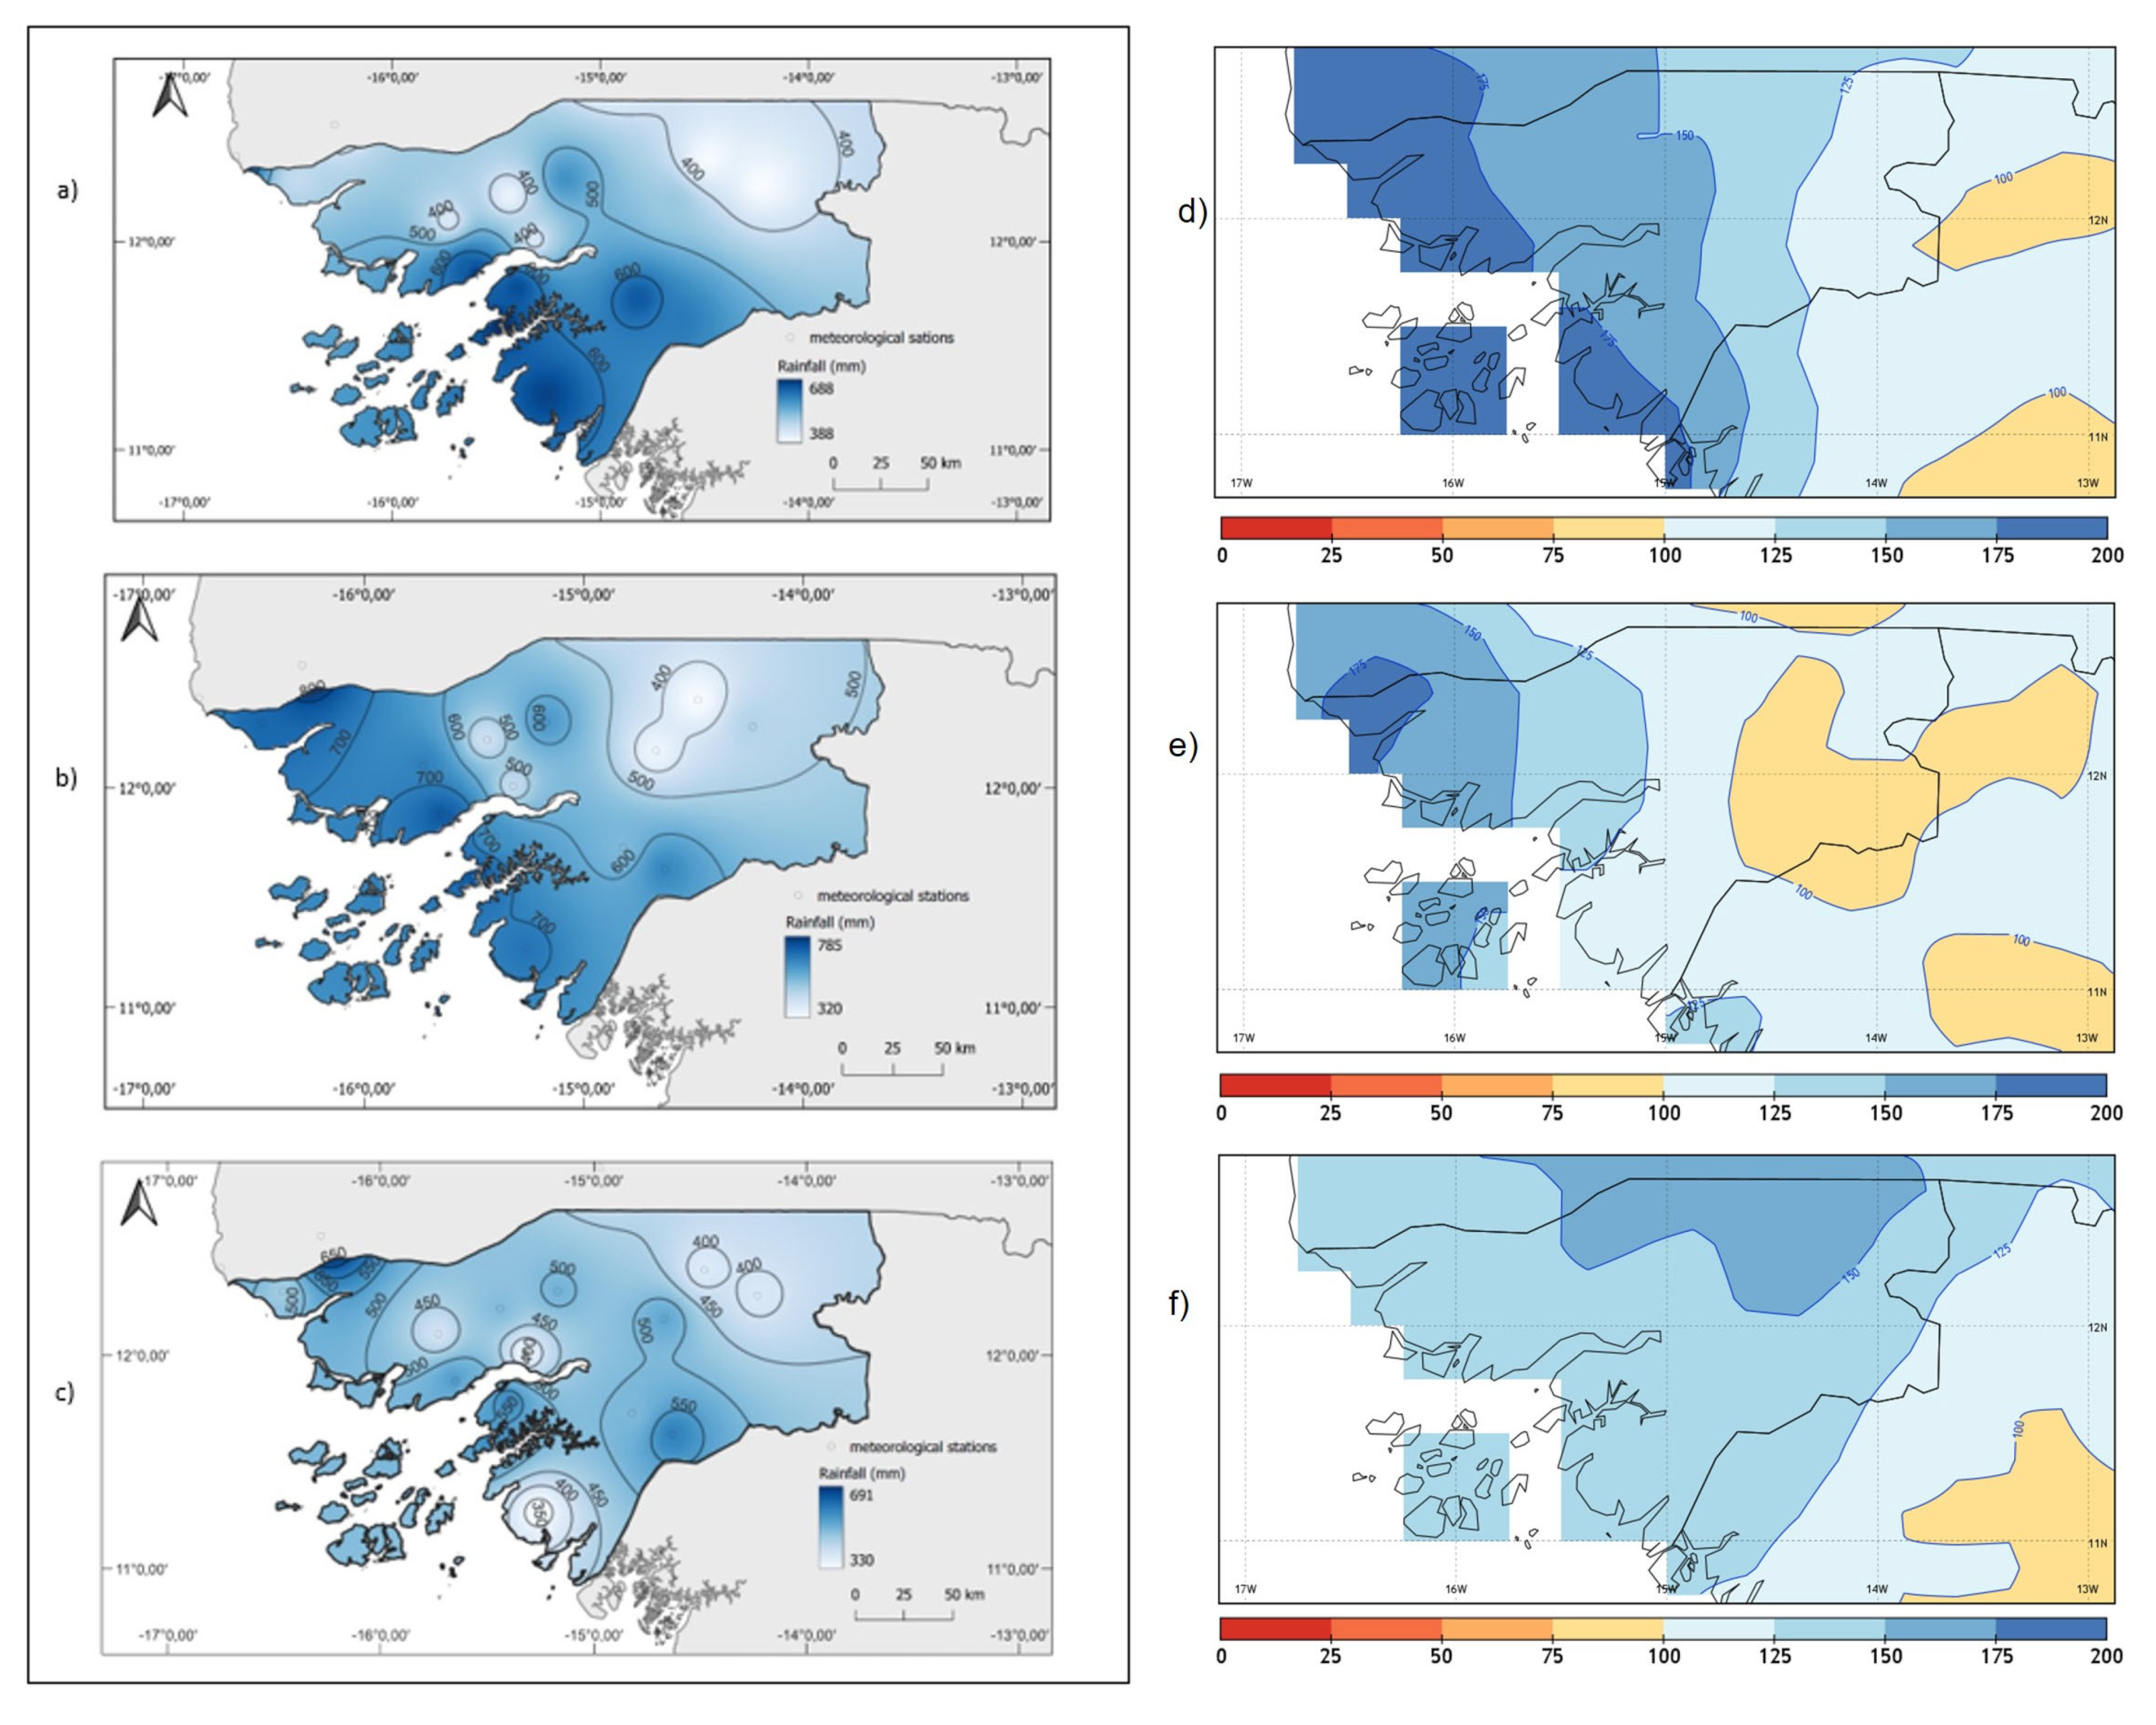
3.1. 2020 Annual Rainfall: Spatial Patterns and Anomalies

This section may be divided by subheadings. It should provide a concise and precise description of the experimental results, their interpretation, as well as the experimental conclusions that can be drawn.
The annual rainfall in 2020 (Figure 3) was above average across the entire territory of Guinea-Bissau. Figure 3 shows that in general, coastal areas south of Bissau and islands were the rainiest areas of the country, with amounts surpassing 2000 mm, or even 2200 mm in both margins of the downstream sector of the Geba river (approximately the areas between Bissau and Bolama, Figure 1a). The corresponding anomalies varied between 1000 and 1500 mm in these regions (Figure 1b). The less rainy area was the East, especially the region of Gabú, showing total amounts varying between 1300–1650 mm, nevertheless quite above the normal values (Table 1, commented later in the text). The North and center of the country exhibited intermediate amounts of annual rainfall, registering between 1650 and 1950 mm.
The annual precipitation anomalies of 1981–2020 compared to the climatological average of the same period (Figure 4) led us to consider that the year 2020 is characterized as a very rainy year across the country. Hence, all four stations with available long-term precipitation series (Bissau, Bolama, Bafatá, and Gabú) show positive precipitation anomalies, ranging from +1.1 in Bafatá to +2.2 in Bissau for the year 2020. As can be noted observing Figure 4, despite the strong interannual variability of the precipitation along the climatological series of the four selected stations, the year 2020 was exceptional, particularly in the case of the station Bissau-Observatory. In this location, over four decades, a positive precipitation anomaly equivalent to the year 2020 has never been detected. Moreover, in 2020 Bissau registered its maximum annual rainfall, at least since 1971, the first year of the longest continuous and complete annual precipitation data series of Guinea-Bissau.

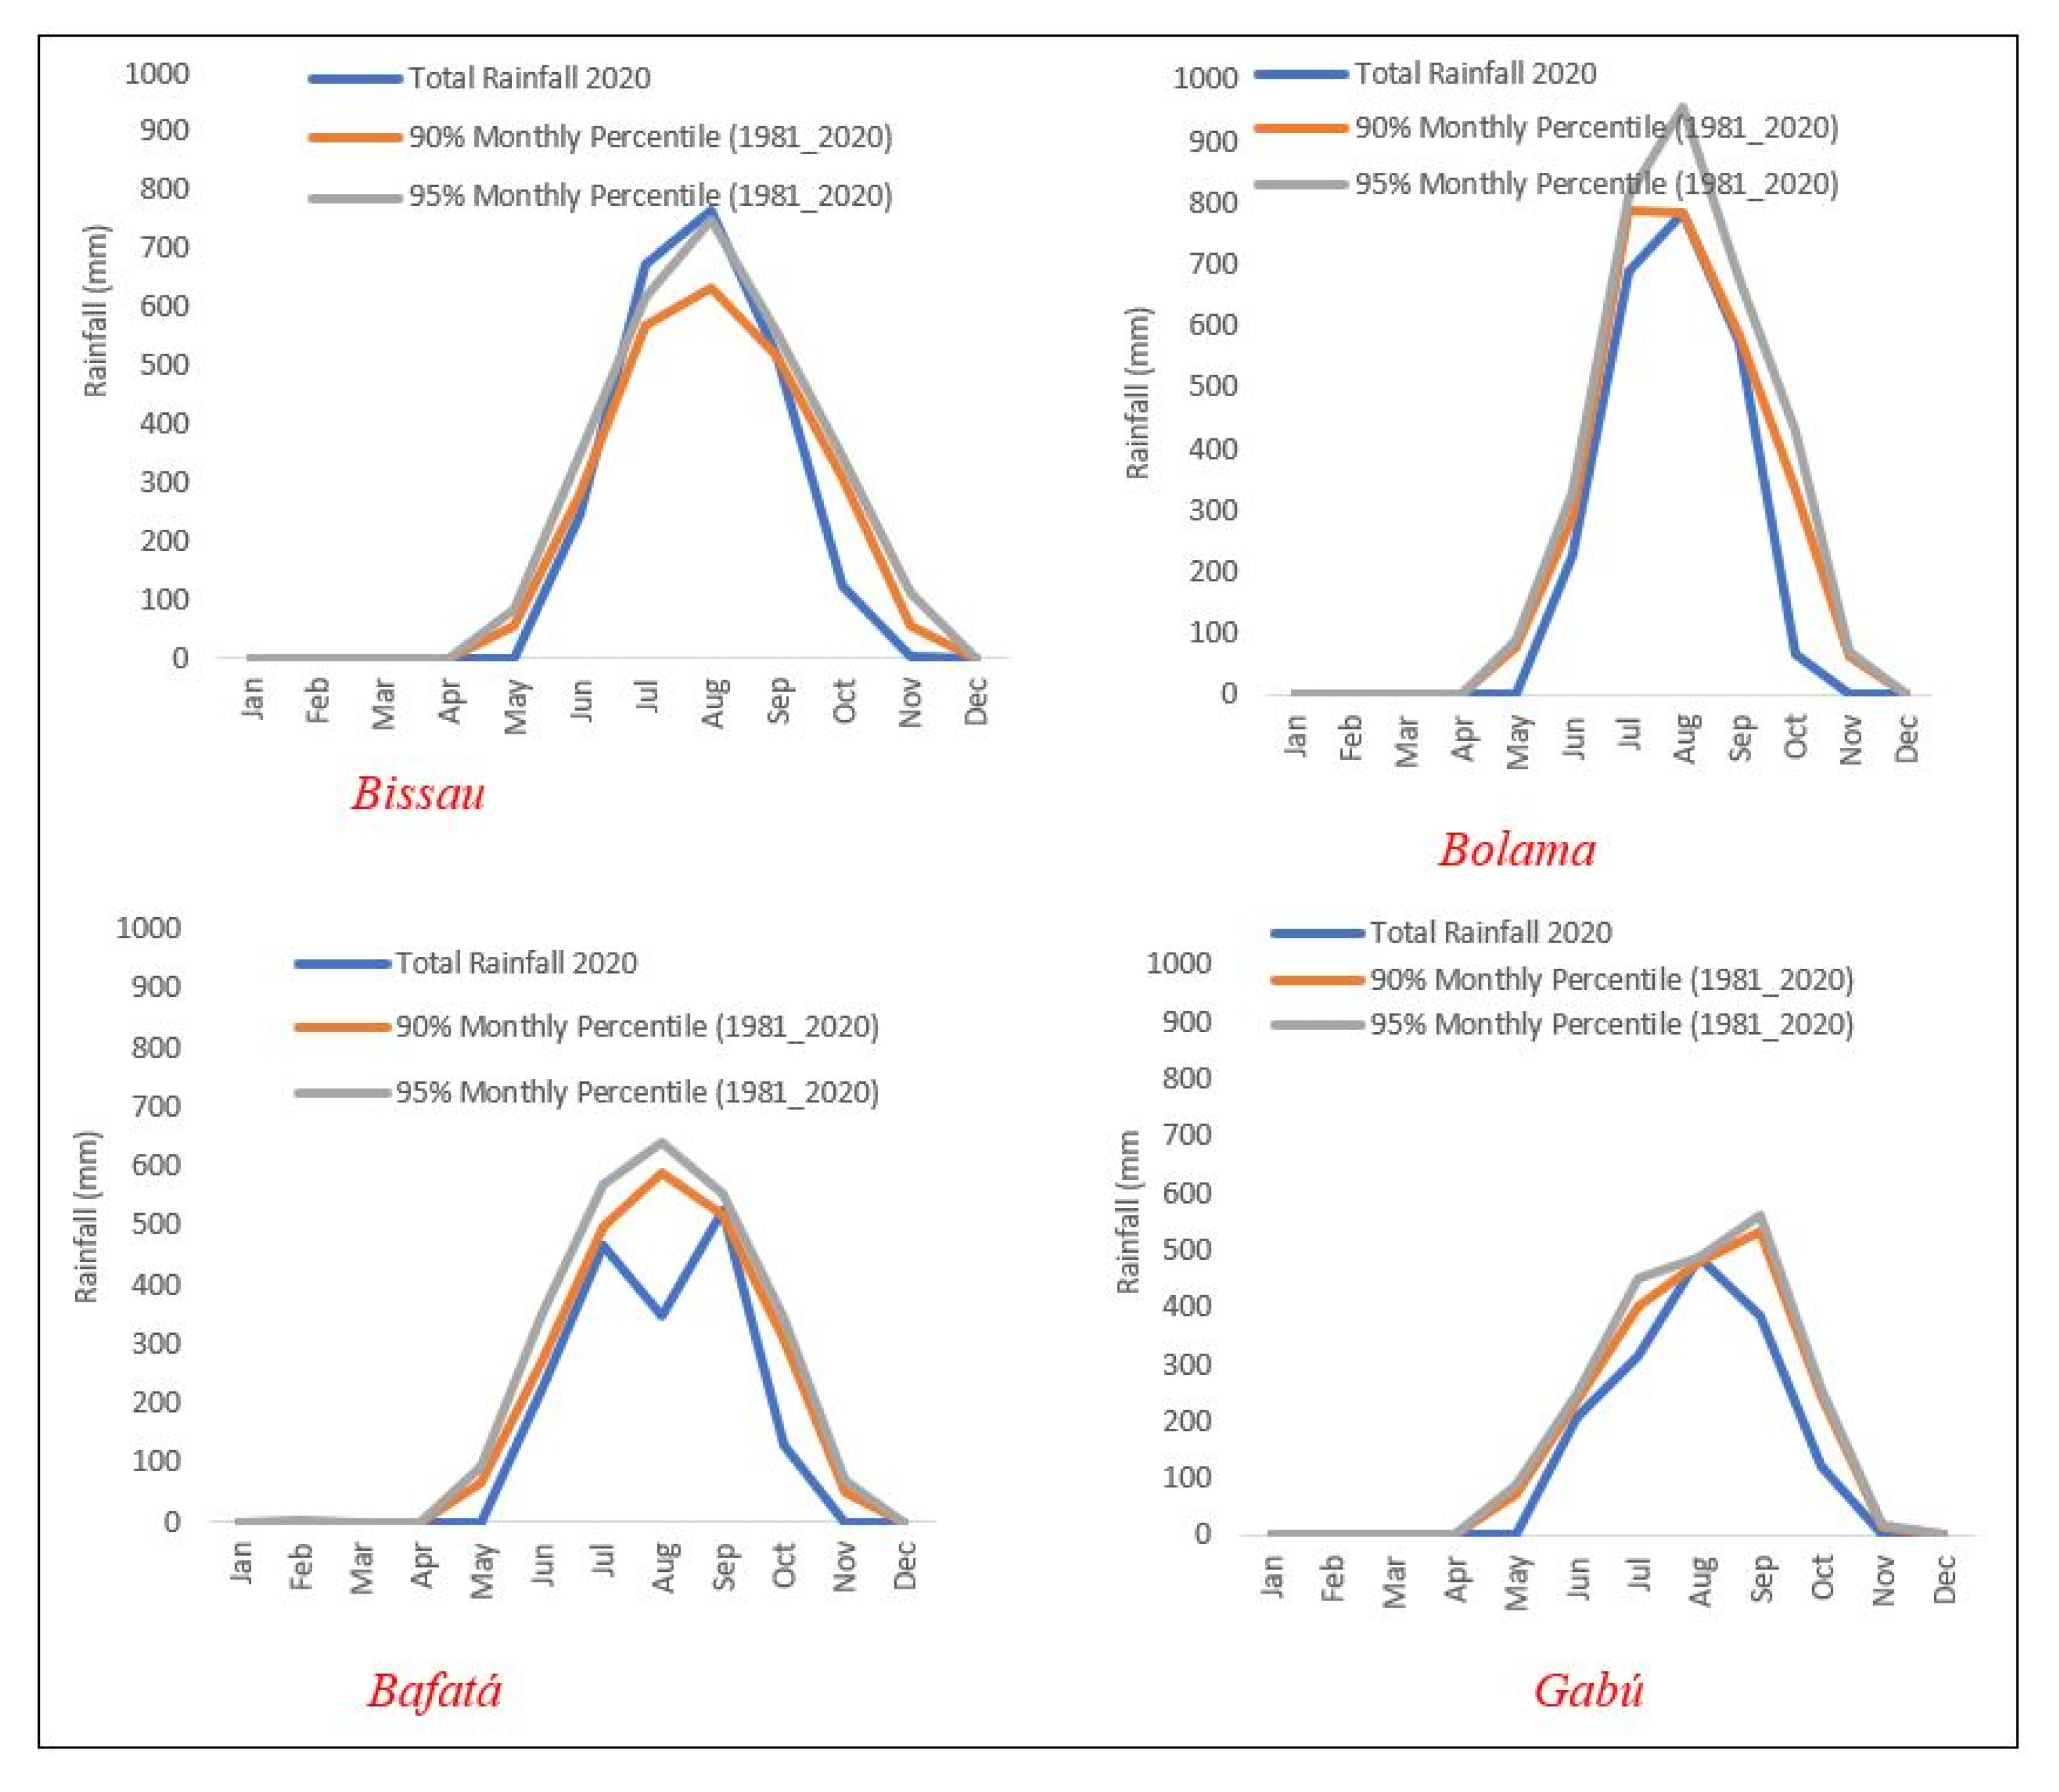
3.2. 2020 Monthly Rainfall: Spatial Patterns and Anomalies

As stated in Section 2.1, the precipitation regime in Guinea-Bissau is characterized by its concentration in July, August, and September, with August being generally considered the wettest month of the year in terms of monthly rainfall totals and frequency of rainy days.
At the monthly temporal scale, the anomalously rainy character of 2020 revealed considerable differences across the country, as Figure 5 illustrates. The graphs in Figure 5 allow the comparison of monthly totals for 2020 in the 4 meteorological stations under analysis with the corresponding 90th and 95th percentiles of the monthly precipitation series (1981–2020 period). It is evident that except for the Bissau/Observatory in July and August—where the monthly totals were higher than the 90th and 95th percentiles—, the remaining stations show slightly lower values compared to the percentiles of the reference. Nevertheless, it must be underlined the close approximation between the curves of the monthly extreme percentiles to the monthly totals of 2020, except for the Bafatá station for August, which recorded low rainfall in 2020.
The study of the spatial patterns of the precipitation during the core months of the 2020 wet season was carried out by constructing the maps depicted in Figure 6.
For July 2020, the highest volume of precipitation was observed in coastal areas south of Bissau, and as we move away from this area towards the interior of the continent, we see a decrease in volume, but not in a linear way throughout the territory (Figure 6a). Precipitation was more than 75% higher than the average (1981–2020) in the coastal areas (Figure 6d).
On the other hand, the month of August—the rainiest of the wet season—, recorded very abundant rainfalls, with greater concentration in coastal areas (700 mm), followed by the center of the country (500–600 mm), and finally the eastern area with a distribution of between 400 and 500 mm (Figure 6b). These amounts corresponded to more than 50% higher in the northern coastal regions (Figure 6e).
As for September, the distribution of precipitation was quite different from the previous months. The extreme south zone has less rainfall than the rest of the country with 350mm, followed by the east zone with 400 mm. In the extreme north, including the coastal zone north to the center, the monthly accumulation varies between 450–550 mm (Figure 6c). The anomaly panel (Figure 6f) shows that the precipitation exceeded again the mean amount (anomalies above 100%) in the whole country.

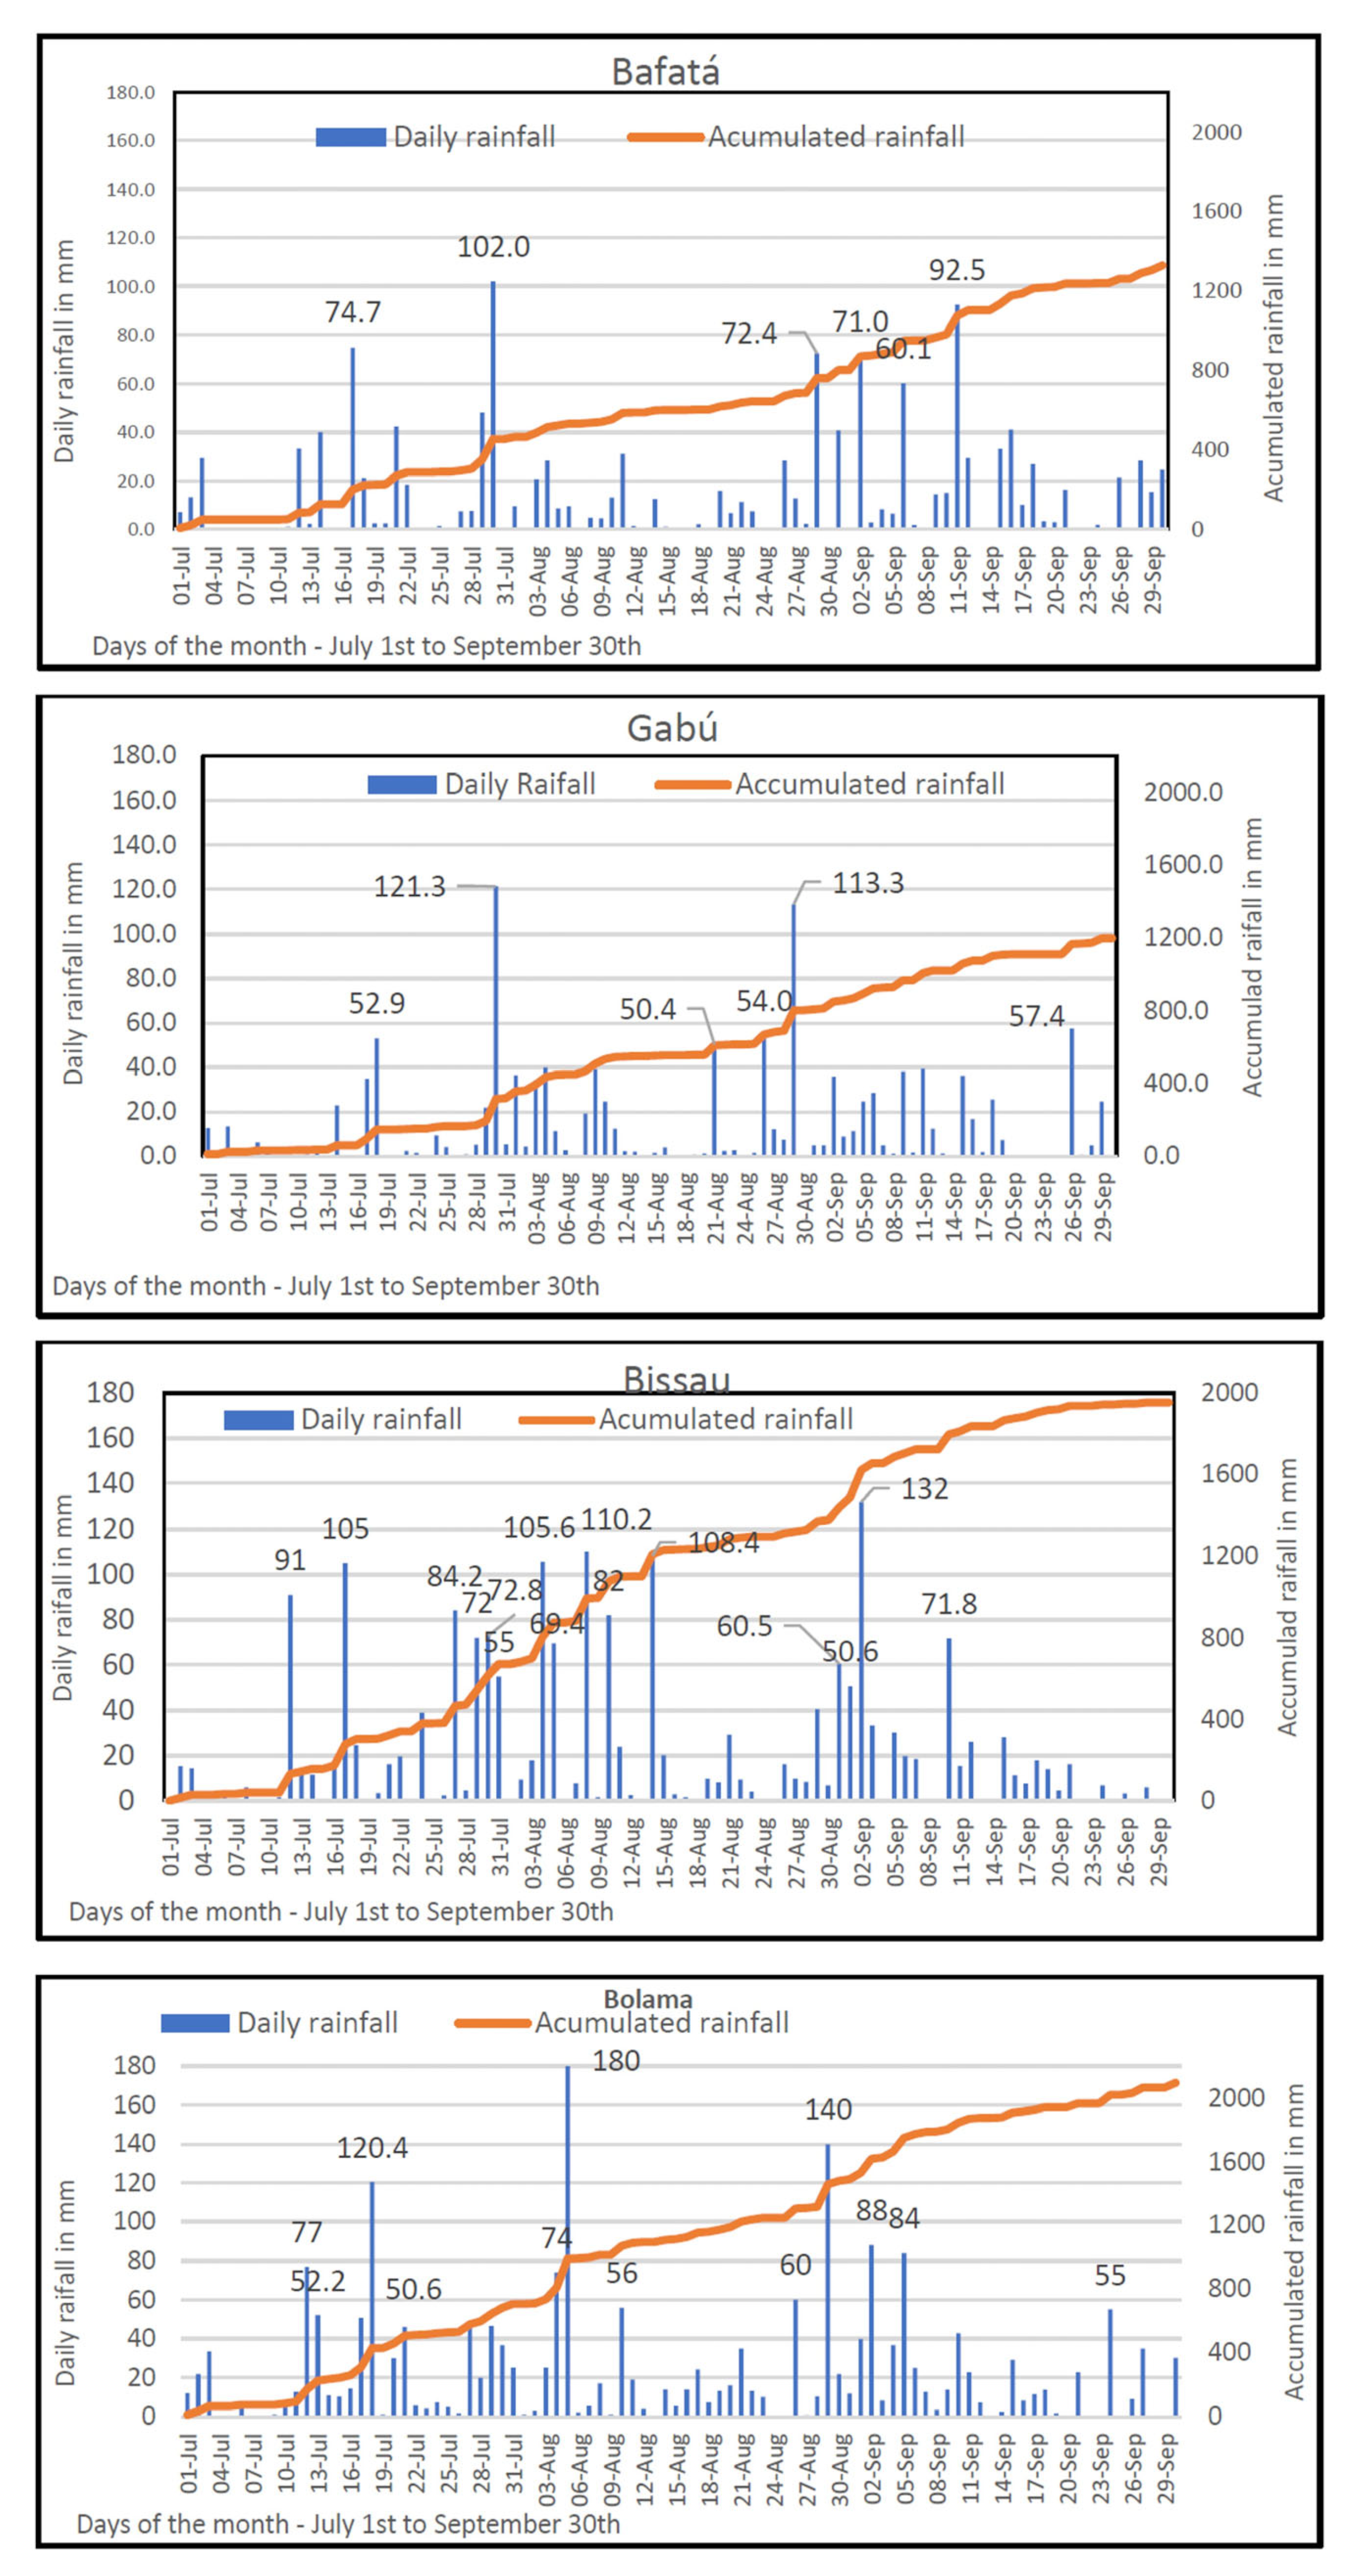
3.3. 2020 Daily Rainfall: Choronology and Extreme Events

The observations show that the 2020 daily rainfall that occurred during July, August, and September (considered the rainiest months) was particularly abundant (Figure 7). There were no dry sequences greater than or equal to 7 days in all seasons. However, at Bafatá station there was a maximum rainfall break period of 6 days (4–9 July). It was also recorded in this station over this period of 6 days with a daily total of precipitation greater than 50 mm, and an extreme event stands out: 102.0 mm on the 30th of July.
In Gabú, there was no rain breaks for more than 3 days during July, August, and September and during the same period, a volume of precipitation greater than 50mn was recorded in 6 days, with two maxima of 113.3 mm and 121.3 mm, respectively.
The Bissau Observatory station presented several notable precipitation events in terms of daily accumulation. The maximum break of rain during the period was 2 days and during these three months, rainfall greater than 50 mm was recorded in 16 days, of which 5 days had values greater than 100 mm daily.
At Bolama station, located in the south of the country, rainfall was almost uninterrupted during the 3 wettest months of the year. The longest rain break lasted only 2 days during this period, and rainfall greater than 50 mm was recorded for 12 days, with 3 days with a volume greater than 100 mm.
To better understand the precipitation behavior of 2020 in comparison to the corresponding average of the climatological period (1981–2020), several climatic parameters referring to rainfall were put into comparative analysis such as total annual precipitation, maximum daily rainfall, the number of days of rain ≥0.1 mm, ≥10.0 mm, n ≥ 25.0 mm, ≥50.0 mm, ≥75.0 mm, and ≥100.0 mm (Table 1).
In this comparison, it is highlighted that the total rainfall observed in 2020 and the number of rainy days ≥ 10.0 mm was higher than the climatological average in all the stations under study. Another highlight is the number of days with precipitation ≥ 0.1 mm and 25.0 mm, which shows us that the year 2020 has values higher than the climatological average of 1981–2020 for all the parameters, apart from Bolama.
Regarding the number of rainy days ≥ 50.0 mm, 75.0 mm, and 100.0 mm, except for Bafatá, the remaining stations registered frequencies higher than the climatological average, with more highlight in the Bissau station with values greater than twice the values observed in the reference period 1981–2020.
For sake of final comment, it must be emphasized that Bissau, the capital, registered an outstanding number of extreme precipitation events (e.g., 5 days with precipitation above 100 mm), a fact that was critical to explain the detrimental impacts of the heavy rains, taking into account that more than 1 million of people (more than half of the country population) lives in this district.

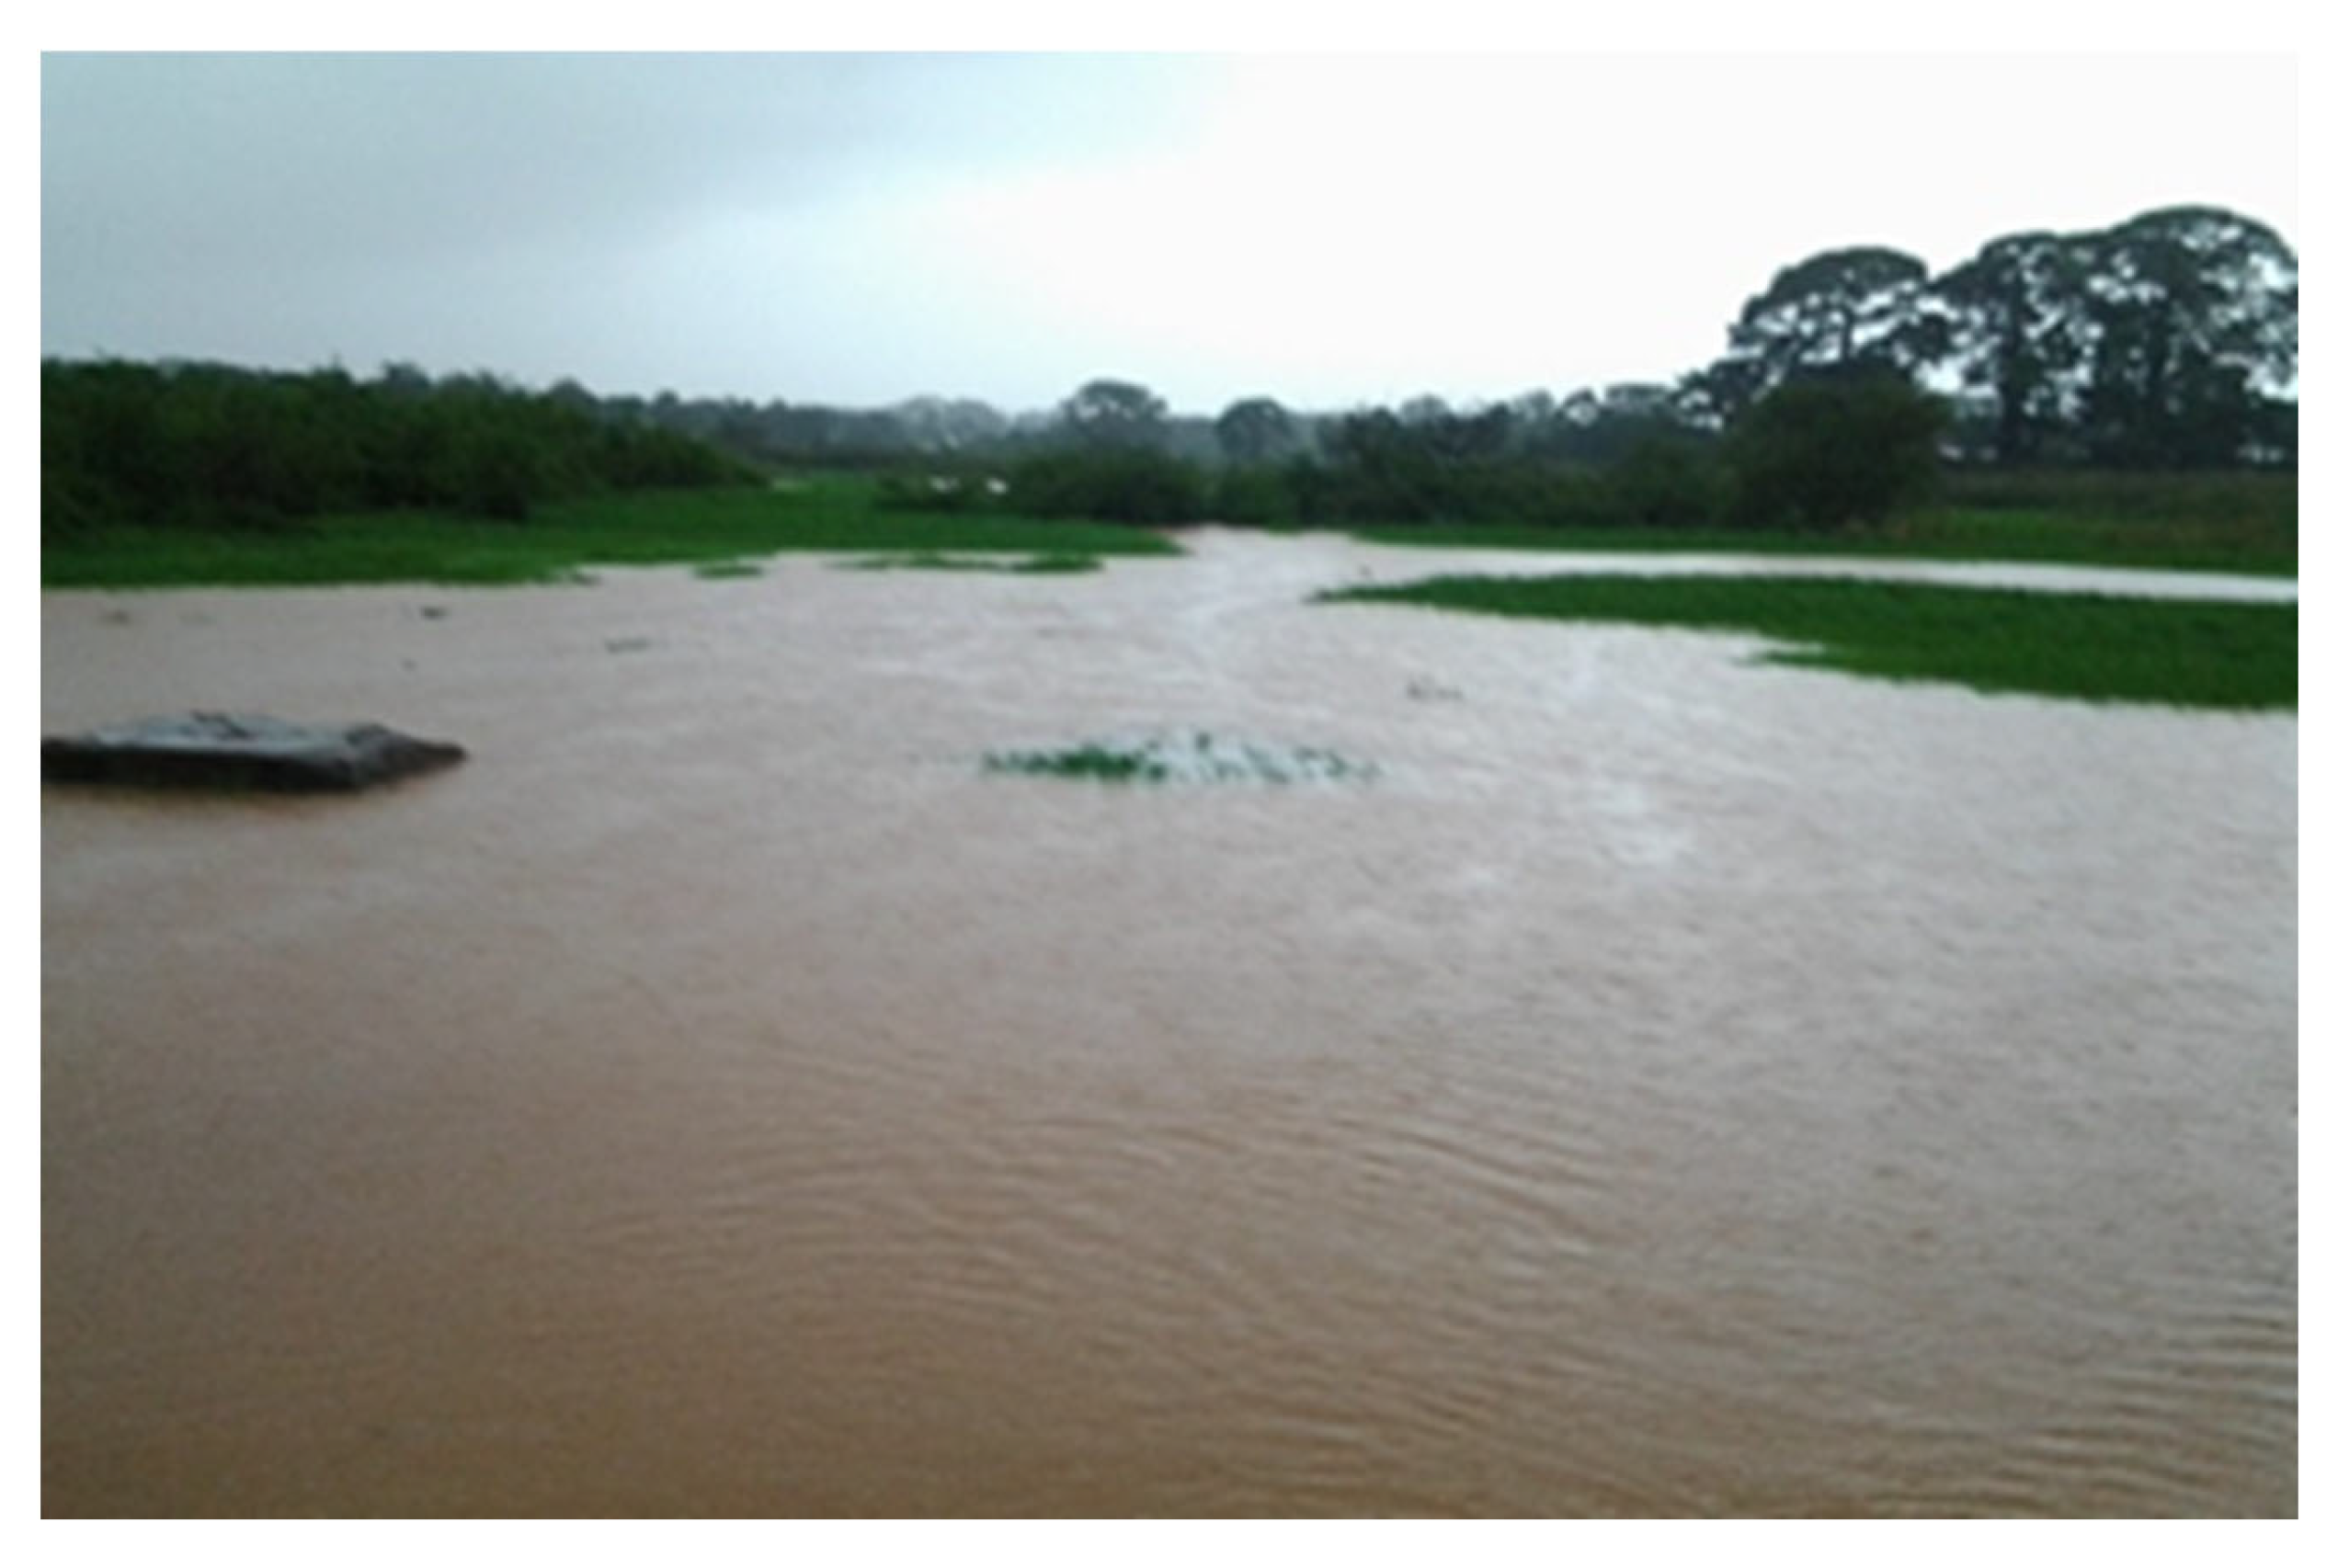
3.4. 2020 Rainfall Impacts on Agriculture, Infrastructures, and Housing

The World Food Program (WFP) monitored the effects of heavy cumulative rains in August and September 2020 that caused flooding in many areas of the West African region resulting in deaths, property damage, destruction of livelihoods, population displacement, and deterioration of roads. According to the Ocha report [35], the floods affected 2.7 million people in 18 West and Central African countries, while the estimated number of human victims in Guinea-Bissau achieved 6000 people [36]. An insight into agricultural and infrastructural damages in this very vulnerable country is undertaken in this section.

3.4.1. Agriculture

Because rainfall is a determining factor for the success of crops, the 2020/2021 agricultural season was characterized by the late arrival of the first rainfall, and sowing activities only started in June and July. Due to the heavy rains that fell in July and early August, Guinean farmers experienced tremendous difficulties in their agricultural activities, being forced, in many cases, to have to purchase equipment, such as PVC pipes, to drain the water accumulated in the flooded fields.
The government, through its partners, managed to provide farmers with 1208 tons of improved agricultural seeds, 300 tons of fertilizers, 1039 litters of phytosanitary products, and 60 tractors to support agricultural activities [36]. Despite this government’s help, many farmers suffered huge losses due to heavy rains that caused flooding in many agricultural fields, especially in the regions of Oio, Cacheu, Tombali, Quinara, Bafatá, and Bissau Autonomous Sector (Figure 8). In some hydrographic basins, significant overflows of rivers that caused floods affecting many agricultural fields were also observed, whose damages were incalculable. The same report points out that the expected total gross production of cereals (rice, maize, sorghum, millet, fonio millet) for the 2020/2021 campaign was estimated at 257,504 tons, and the total private commercial intentions to import cereals was 166,517 tons to address the production deficit. In addition, the weak cashew production of 2020 that constituted the exchange with imported rice and the low price charged by traders to farmers (300 CFA/Kg) made farmers even more vulnerable to food security.

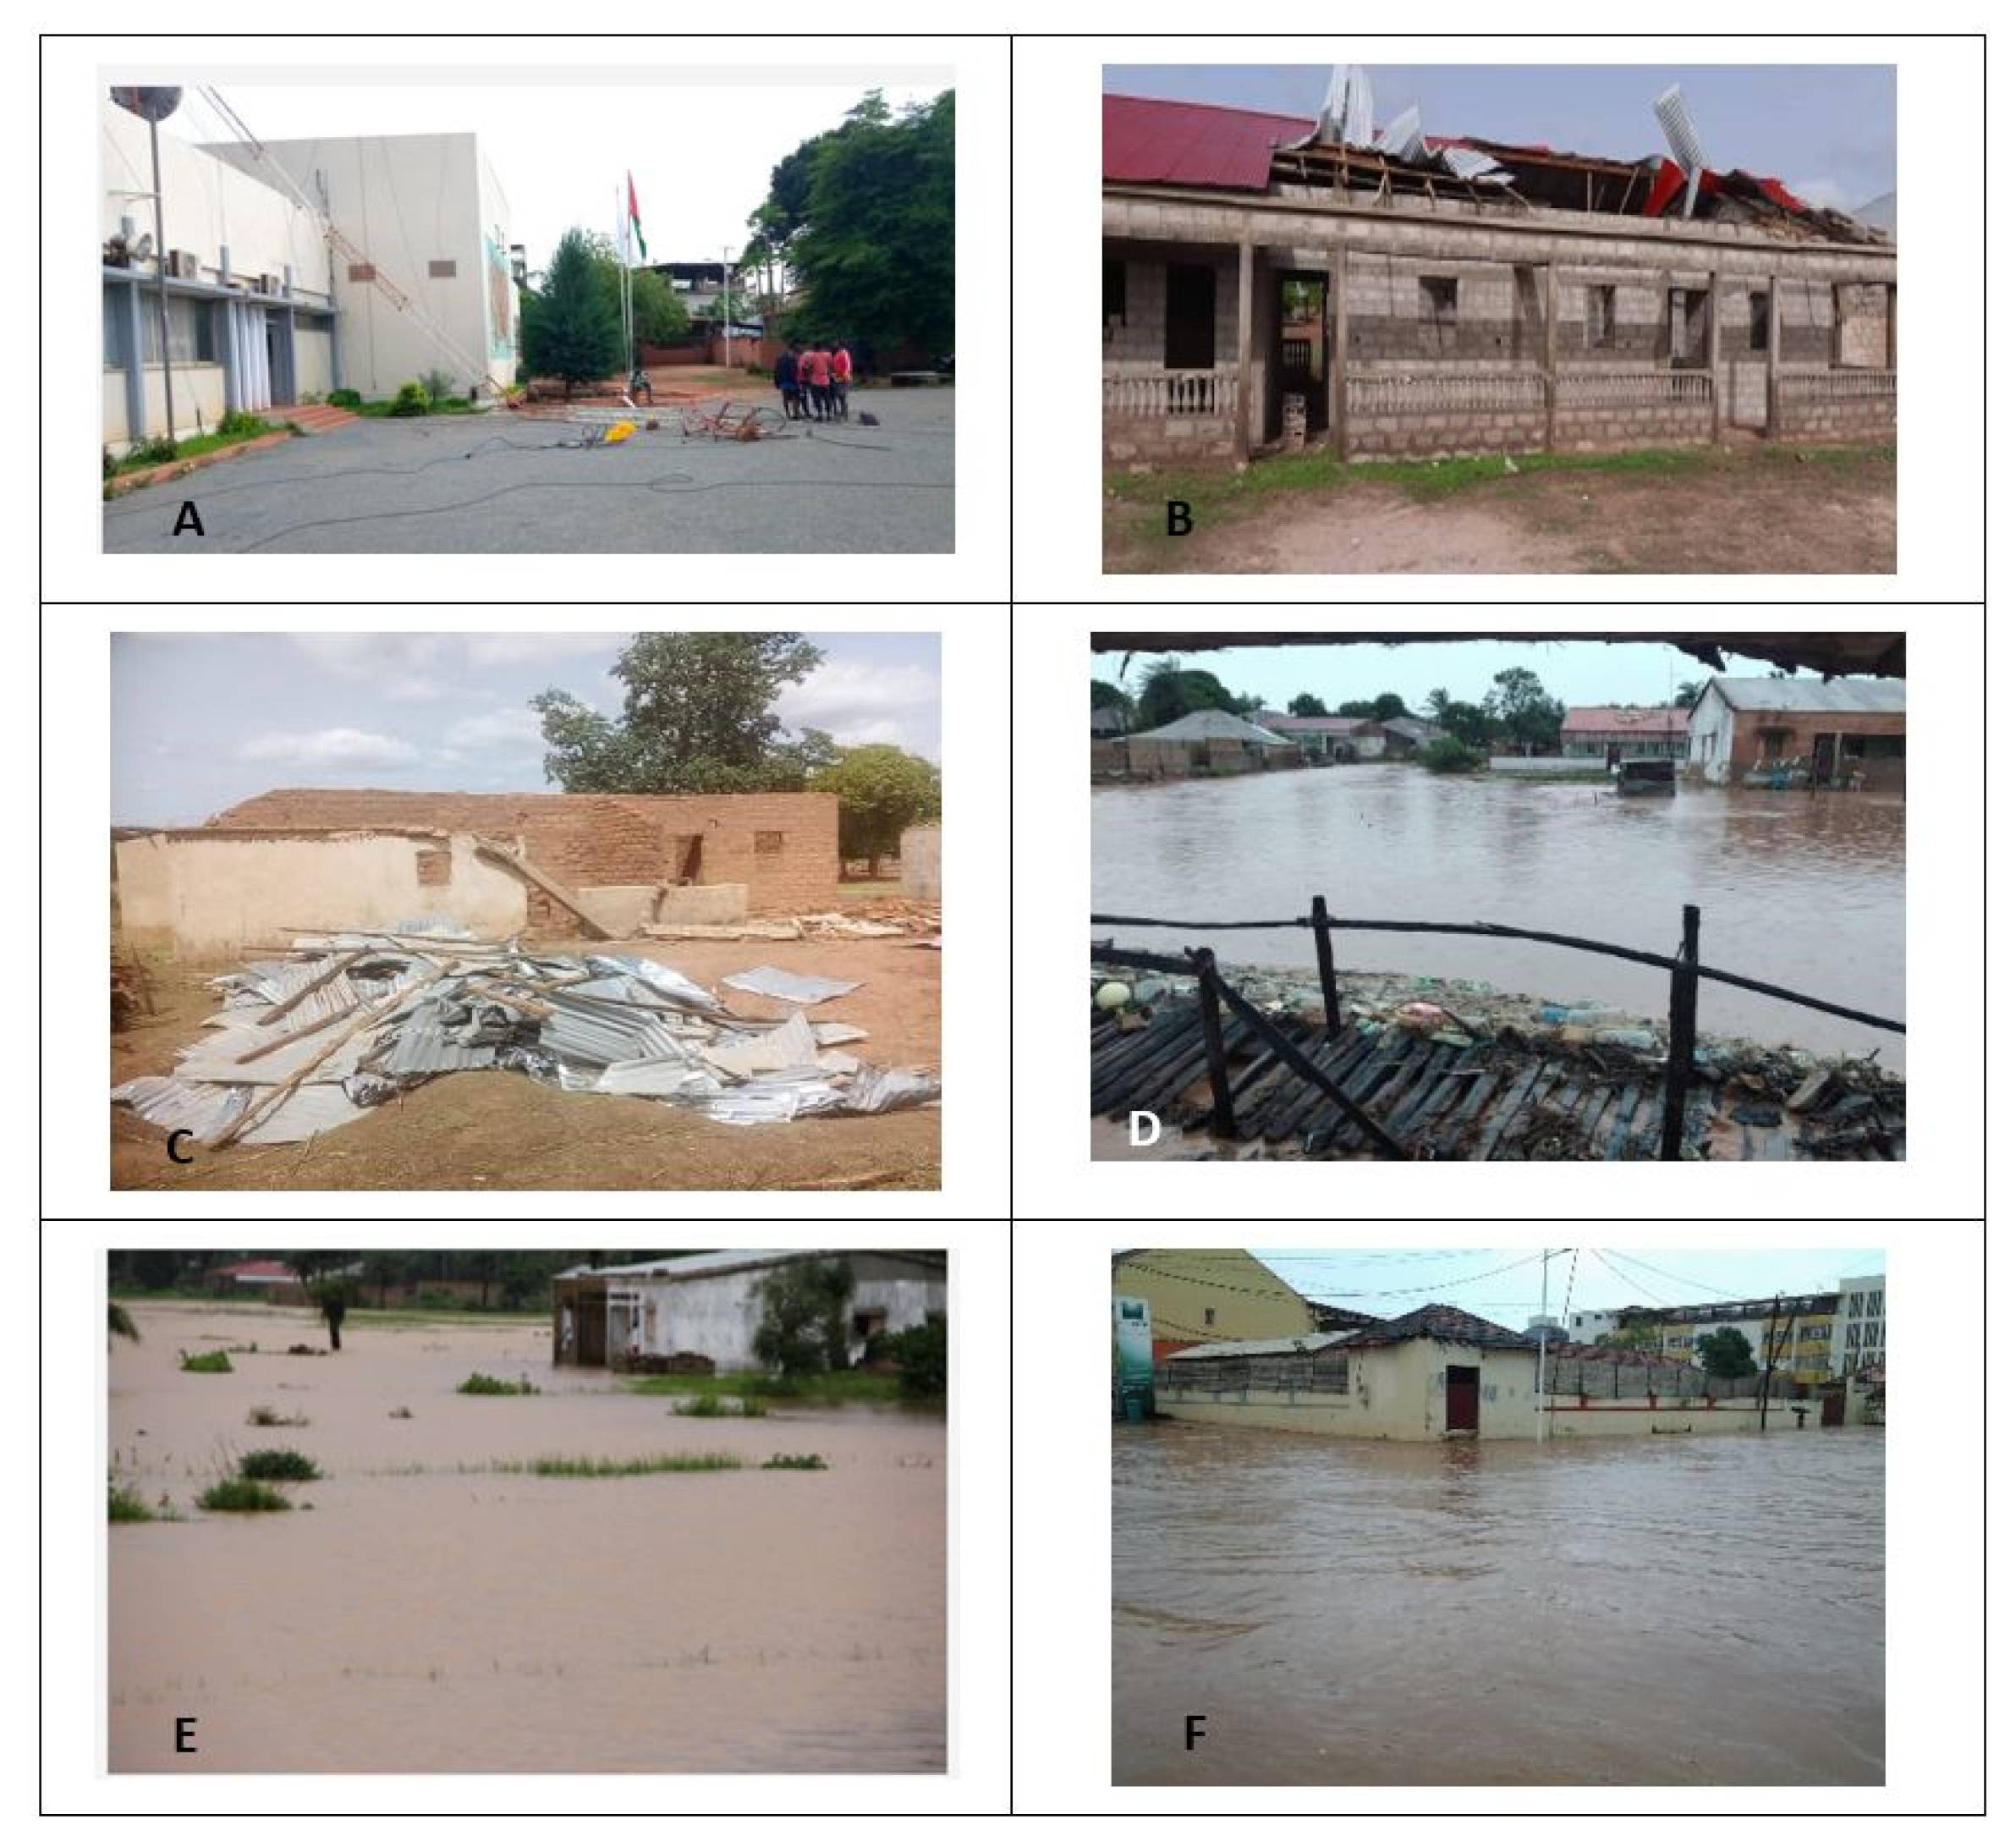
3.4.2. Infrastructures and Housing

According to the Guinea-Bissau civil protection services [36], 4617 people were victims of floods caused by heavy rains observed in July and August 2020, with the capital Bissau having more than 50% of these victims (Figure 9; Table 2). In addition to heavy rains that impacted social infrastructures, such as schools, public health centers, and roads, strong winds also victimized 1374 families, with the highest number of victims registered in the Cacheu Region, Autonomous Sector of Bissau, and Region of Gabú. Serious damage affected the national TV facilities (Television of Guinea-Bissau, TGB), and because of the strong winds, the storm knocked down the mast that supported the radiant antennas and the radio beam (Figure 9), causing enormous financial losses, in addition to paralyzing the emission of the signal for some time [37].
Due to the impacts caused by the heavy rainfall, floods and strong winds, the number of homes destroyed across the country was outstanding (Table 3). The neighborhoods on the outskirts of the capital—Bissau (Bôr, Cuntum Madina, Jericó and Quelelé, Ponta Neto neighborhood)—did not escape the floods caused by the intense rains that caused material damage and disrupted goods supply and services, and as a result, residents cried out for the help from the government and asked for the adoption of safety measures to their lives [26] (Figure 9). According to the testimonials of the residents of these lowland quartiers, the lack of a rainwater drainage system in the neighborhoods is the main cause of the floods that occur every year, so they claimed that the government must build large ditches and sewers that allow the circulation of rainwater, to reduce the flooding and the suffering of populations [38]. As a result, the government made available a fund of 100 million CFA francs (6.5 million euros), through the Ministry of Solidarity, to help victims of the severe weather in different regions, namely Bissau, Boé (East), Cacine (South), and the entire region of Cacheu (North) [39].

4. Discussion and Conclusions

The evidence of climate change is increasingly undoubted in Guinea-Bissau. The start and end of the rainy season became more irregular in recent decades and the interannual variability of the precipitation appears to be increasing. The 2020 wet season was extremely rainy in most of the Guinea-Bissau territory. Bissau, the capital registered its maximum annual rainfall, at least since 1971, the first year of the current continuous and complete climatic data series. The annual amount recorded at Bissau/Observed—2322 mm—corresponds to an anomaly surpassing two standard deviations, the greatest of the last (at least) 50 years. This changing behavior of the climate denotes clear similarities to the identified trends in West African countries [8]. The monthly totals of precipitation for 2020 July and August in Bissau/Observatory station were higher than the 90 and 95 percentiles for the 1981–2020 period, which agrees with Blunden and Boyer [40] findings, who described rainfall above 90 and 95 percentiles in western Niger and Senegal during July-September.
Although the rains arrived late in Guinea-Bissau in 2020, the very abundant rains of July, August, and September resulted in a rainfall year much rainier than the climatological average values (1981–2020 period). A monitoring report for the 2020 African climate [40] also identified poor rainfall at the beginning of the 2020 rainy season in West Africa, and stated that the forecast predicted a shift of this situation to wetter conditions in July, August, and September, right how it came to happen in Guinea-Bissau, and as it was shown in this study. Another seasonal assessment document on the 2020 rainy season in West Africa, carried out by the World Food Program [41], reported the late arrival of the rainy season and its intensification in July, August, and September at the level of West African countries including the Guinea-Bissau [41]. It should be noted that the late onset of the rainy season contributed to the delay of agricultural activities throughout the West African region including Guinea-Bissau, disturbing the development of several crops, particularly rice, the most important culture for the food supply.
As for the detrimental impacts of the 2020 heavy rainfall in Guinea-Bissau, they were severe across the south and central coastal regions, especially in the Bissau district, being related to flooding and strong wind damage (Table 2 and Table 3). The Guinea-Bissau civil protection service estimated that around 6000 people were affected by the impacts of flooding, comprising estimations of dislodged families and damaged dwellings [36]. The economic damage caused by the 2020 heavy rainfalls in Guinea-Bissau was enormous, starting with the agricultural fields that were flooded, the schools and other infrastructure that were destroyed by the rains accompanied by strong winds, the homes that were flooded, and the roads that were destroyed by the heavy rains, similarly to what happened in other West African countries.
The present research showed that an anomalous number of extremely rainy days (e.g., precipitations days with amounts above 100 mm) that happened during the 2020 wet season in Guinea-Bissau contributed to the great extent of damage, particularly in the Bissau district. The prolonged wet spells with such few interruptions by dry days did not allow enough water infiltration due to the saturation of soils and as a consequence of lacking adequate rainwater drainage infrastructure system.
The outcome of the present study raises several possibilities for continuing the investigation of 2020 rainfall anomalies in Guinea Bissau, as well as their impacts. As it was mentioned in the Introduction, it is important to study the atmospheric mechanisms responsible for the occurrence of such abundant rainfall in this region, eventually applying analysis adopted in recent works, for example focusing on weather types or teleconnection patterns (e.g., [18,24,25]). On the other hand, the 2020 floods in Guinea Bissau might be further studied in upcoming studies, applying different perspectives, such as hydrometric analysis of the Geba river and rainfall-runoff relationship, allowing for structural measures proposition, e.g., [42] or, alternatively, by carrying out numerical simulations of the floods in Bissau (e.g., [43]).

Author Contributions

Conceptualization, methodology, software, validation, formal analysis, investigation, resources, data curation, O.M. and M.F.; writing-original draft preparation, O.M.; writing-review and editing, visualization, supervision, M.F. All authors have read and agreed to the published version of the manuscript.

Funding

This work was carried out under the framework of Malmon project, funded by the EU within the DeSIRA initiative [FOOD/2019/412-700, DeSIRA_GB], and by the CEG-IGOT Research Unit UIDB/00295/2020 and UIDP/00295/2020.

Informed Consent Statement

Not applicable.

Data Availability Statement

Not applicable.

Conflicts of Interest

The authors declare no conflict of interest.

References

  1. Guinée-Bissau. Plan Strategique Et Operationnel 2015–2020 « Terra Ranka »; Guinea-Bissau Gouvernement: Bissau, Guinea-Bissau, 2015; p. 198. [Google Scholar]
  2. FAO. World Food and Agriculture–Statistical Pocketbook 2018; FAO: Rome, Italy, 2018. [Google Scholar]
  3. Sylla, M.B.; Pal, J.S.; Faye, A.; Dimobe, K.; Kunstmann, H. Climate change to severely impact West African basin scale irrigation in 2 °C and 1.5 °C global warming scenarios. Sci. Rep. 2018, 8, 14395. [Google Scholar] [CrossRef] [PubMed] [Green Version]
  4. USDA NASS. United States Summary and State Data. Census Agric. 2017, 1, 711. Available online: https://www.nass.usda.gov/Publications/AgCensus/2017/Full_Report/Volume_1,_Chapter_1_US/usv1.pdf (accessed on 25 June 2022).
  5. Adger, W.N.; Pulhin, J.M. Human security. In Climate Change 2014: Impacts, Adaptation, and Vulnerability; UNFCCC: Bonn, Germany, 2014. [Google Scholar]
  6. Jones, H.P.; Nickel, B.; Srebotnjak, T.; Turner, W.; Gonzalez-Roglich, M.; Zavaleta, E.; Hole, D.G. Global hotspots for coastal ecosystem-based adaptation. PLoS ONE 2020, 15, e0233005. [Google Scholar] [CrossRef]
  7. Fandé, M.B.; Lira, C.P.; Penha-Lopes, G. Using TanDEM-X Global DEM to Map Coastal Flooding Exposure under Sea-Level Rise: Application to Guinea-Bissau. ISPRS Int. J. Geo-Inf. 2022, 11, 225. [Google Scholar] [CrossRef]
  8. Diedhiou, A.D.; Bichet, A.; Wartenburger, R.; Seneviratne, S.I.; Rowell, D.P.; Sylla, M.B.; Diallo, I.; Todzo, S.; E Touré, N.; Camara, M.; et al. Changes in climate extremes over West and Central Africa at 1.5 °C and 2 °C global warming. Environ. Res. Lett. 2018, 13, 065020. [Google Scholar] [CrossRef]
  9. Salack, S.; Saley, I.A.; Bliefernicht, J. Observed data of extreme rainfall events over the West African Sahel. Data Brief 2018, 20, 1274–1278. [Google Scholar] [CrossRef] [PubMed]
  10. IPCC. Climate Change 2022: Impacts, Adaptation and Vulnerability. Contribution of Working Group II to the Sixth Assessment Report of the Intergovernmental Panel on Climate Change; Pörtner, H.-O., Roberts, D., Tignor, M., Poloczanska, E., Mintenbeck, K., Alegr, A., Eds.; Cambridge University Press: Cambridge, UK; New York, NY, USA, 2022; p. 3056. [Google Scholar] [CrossRef]
  11. Landry, P. Analyse de la Dynamique du FIT et le Type de Temps Associé en Côte d’Ivoire; Université Nangui Abrogoua: Abidjan, Côte d’Ivoire, 2015. [Google Scholar]
  12. Leduc-leballeur, M. Influence Océanique du golfe de Guinée sur la Mousson en Afrique de l’Ouest; Université Pierre et Marie Curie-Paris: Paris, Franch, 2012. [Google Scholar]
  13. Dia-Diop, A.; Zebaze, S.; Wade, M.; Djiondo, R.N.; Diop, B.; Efon, E.; Lenouo, A. Interannual Variability of Rainfall over the West Africa Sahel. J. Geosci. Environ. Prot. 2020, 8, 85–101. [Google Scholar] [CrossRef] [Green Version]
  14. Lélé, M.I.; Lamb, P.J. Variability of the Intertropical Front (ITF) and Rainfall over the West African Sudan–Sahel Zone. J. Clim. 2010, 23, 3984–4004. [Google Scholar] [CrossRef]
  15. Ogega, O.M.; Gyampoh, B.A.; Mistry, M.N. Intraseasonal Precipitation Variability over West Africa under 1.5 °C and 2.0 °C Global Warming Scenarios: Results from CORDEX RCMs. Climate 2020, 8, 143. [Google Scholar] [CrossRef]
  16. Fontaine, B.; Bigot, S. West African rainfall deficits and sea surface temperatures. Int. J. Climatol. 1993, 13, 271–285. [Google Scholar] [CrossRef]
  17. Messager, C.; Brasseur, O. Precipitation sensitivity to regional SST in a regional climate simulation during the West African monsoon for two dry years. Clim. Dyn. 2004, 22, 249–266. [Google Scholar] [CrossRef]
  18. Bliefernicht, J.; Rauch, M.; Laux, P.; Kunstmann, H. Atmospheric circulation patterns that trigger heavy rainfall in West Africa. Int. J. Clim. 2022, 42, 6515–6536. [Google Scholar] [CrossRef]
  19. Lavender, S.; Matthews, A. Response of the West African Monsoon to the Madden–Julian Oscillation. J. Clim. 2009, 22, 4097–4116. [Google Scholar] [CrossRef] [Green Version]
  20. Moron, V.; Robertson, A.W.; Ward, M.N.; Ndiaye, O. Weather Types and Rainfall over Senegal. Part I: Observational Analysis. J. Clim. 2008, 21, 266–287. [Google Scholar] [CrossRef] [Green Version]
  21. Fink, A.H. Spatiotemporal variability of the relation between African Easterly Waves and West African Squall Lines in 1998 and 1999. J. Geophys. Res. Atmos. 2003, 108, 2816. [Google Scholar] [CrossRef]
  22. AGRHYMET. Prévision Saisonnière des Caractéristiques Agro-Hydro-Climatiques Pour les zones Sahélienne et Soudanienne des Pays de l ’ Espace CILSS/CEDEAO; AGRHYMET: Niamey, Niger, 2020. [Google Scholar]
  23. Mendes, O. Indicadores das mudanças climáticas no leste da Guiné-Bissau e adaptação camponesa. Sintidus 2017, 1, 108–139. Available online: https://drive.google.com/file/d/1TfyGvndCQMeMdIL7mDAhZge_4qdw17oz/view (accessed on 25 June 2022).
  24. Lubis, S.W.; Hagos, S.; Hermawan, E.; Respati, M.R.; Ridho, A.; Risyanto; Paski, J.A.I.; Muhammad, F.R.; Siswanto; Ratri, D.N.; et al. Record-Breaking Precipitation in Indonesia’s Capital of Jakarta in Early January 2020 Linked to the Northerly Surge, Equatorial Waves, and MJO. Geophys. Res. Lett. 2022, 49, 1513. [Google Scholar] [CrossRef]
  25. Liu, B.; Yan, Y.; Zhu, C.; Ma, S.; Li, J. Record-Breaking Meiyu Rainfall Around the Yangtze River in 2020 Regulated by the Subseasonal Phase Transition of the North Atlantic Oscillation. Geophys. Res. Lett. 2020, 47, e2020GL090342. [Google Scholar] [CrossRef]
  26. Temudo, M.P.; Cabral, A.I. The Social Dynamics of Mangrove Forests in Guinea-Bissau, West Africa. Hum. Ecol. 2017, 45, 307–320. [Google Scholar] [CrossRef]
  27. Giri, C.; Ochieng, E.; Tieszen, L.L.; Zhu, Z.; Singh, A.; Loveland, T.; Masek, J.; Duke, N. Status and distribution of mangrove forests of the world using earth observation satellite data. Glob. Ecol. Biogeogr. 2011, 20, 154–159. [Google Scholar] [CrossRef]
  28. Finka, A.H. Meteorology of Tropical West Africa; Wiley: New York, NY, USA, 2017. [Google Scholar]
  29. Guinea-Bissau. Third National Communication: Report to the United Nations Framework Convention on Climate Change. Republic of Guinea-Bissau, Bissau. Rep. to United Nations Framew. Conv. Clim. Change 2018, 171. Available online: http://environment.gov.gb (accessed on 25 July 2022).
  30. Sambú, F.B. Variabilidade Climática da Precipitação na Região da Guiné-Bissau–Situação Sinóptica e a Influencia dos Sistemas Convectivos; Universidade de Évora: Évora, Portugal, 2003; p. 144. Available online: https://dspace.uevora.pt/rdpc/handle/10174/14620 (accessed on 14 May 2022).
  31. Alves, P.H. A Geologia Sedimentar da Guiné-Bissau da Análise Geral e Evolução do Conhecimento ao Estudo do Cenozóico; Universidade De Lisboa: Lisboa, Portugal, 2007. [Google Scholar]
  32. Funk, C.C.; Peterson, P.J.; Landsfeld, M.F.; Pedreros, D.H.; Verdin, J.P.; Rowland, J.D.; Romero, B.E.; Husak, G.J.; Michaelsen, J.C.; Verdin, A.P. A quasi-global precipitation time series for drought monitoring. US Geol. Surv. Data Ser. 2014, 832, 1–12. [Google Scholar] [CrossRef]
  33. Wilks, D.S. Statistical Methods in the Atmospheric Sciences, 2nd ed.; Elsevier: Amsterdam, The Netherlands, 2007; Volume 14. [Google Scholar]
  34. Stern, R.; Rijks, D.; Dale, I.; Knock, J. INSTAT Climatic Guide; Statistical Services Centre: Reading, UK, 2006; pp. 247–281. Available online: http://www.reading.ac.uk/SSC/media/ICRAF_2007-11-15/InStat/docs/climatic.pdf (accessed on 25 June 2022).
  35. OCHA. West and Central Africa: Flooding Situation Overview (January–December 2020). no. December. 2020, pp. 1–2. Available online: https://reliefweb.int/report/niger/west-and-central-africa-flooding-situation-10-october-2020 (accessed on 14 December 2020).
  36. SNPC. Resumo de Diferentes Acontecimentos em Diferentes Regiões; SNPC: Bissau, Guinea-Bissau, 2020. [Google Scholar]
  37. NôPintcha. Noite de Tempestade Deixa um Rasto de Estragos em Bissau. 2020. Available online: http://jornalnopintcha.gw/2021/07/03/noite-de-tempestade-deixa-um-rasto-de-estragos-em-bissau/ (accessed on 3 June 2022).
  38. ODemocrata. Bairros Inundados pela Chuva: MORADORES CLAMAM POR AJUDA DO GOVERNO E PEDEM MEDIDAS DE SEGURANÇA. Available online: https://www.odemocratagb.com/?p=25896 (accessed on 24 June 2022).
  39. Lusa. Chuvas Provocam Estragos um Pouco por toda a Guiné-Bissau, Governo Pensa Lançar Campanha. 2020. Available online: https://observador.pt/2020/09/08/chuvas-provocam-estragos-um-pouco-por-toda-a-guine-bissau-governo-pensa-lancar-campanha/ (accessed on 24 July 2022).
  40. Blunden, J.; Boyer, T. State of the Climate in 2020. Bull. Am. Meteorol. Soc. 2021, 102, S1–S475. [Google Scholar] [CrossRef]
  41. WFP. Suivi Saisonnier en Afrique de l’Ouest; WFP: Rome, Italy, 2020; pp. 1–15. [Google Scholar]
  42. Massazza, G.; Bacci, M.; Descroix, L.; Ibrahim, M.; Fiorillo, E.; Katiellou, G.; Panthou, G.; Pezzoli, A.; Rosso, M.; Sauzedde, E.; et al. Recent Changes in Hydroclimatic Patterns over Medium Niger River Basins at the Origin of the 2020 Flood in Niamey (Niger). Water 2021, 13, 1659. [Google Scholar] [CrossRef]
  43. Coulibaly, G.; Leye, B.; Tazen, F.; Mounirou, L.A.; Karambiri, H. Urban Flood Modeling Using 2D Shallow-Water Equations in Ouagadougou, Burkina Faso. Water 2020, 12, 2120. [Google Scholar] [CrossRef]
Figure 1. Location of Guinea-Bissau, its administrative regions, and meteorological stations used in this study. In the map on the left, black dots are the stations with longer climatological series (1981–2020), and gray dots are the remaining stations with precipitation data for 2020.
Geosciences 13 00025 g001
Figure 2. Mean monthly precipitation (columns, with error bars based on standard deviation) and mean monthly temperature (line) in Bissau/Observatory station, over the period 1981–2010. Data source: National Institute of Meteorology of Guinea-Bissau.
Geosciences 13 00025 g002
Figure 3. 2020 annual rainfall (mm) in Guinea-Bissau: (A) total amount; (B) anomaly (annual precipitation in 2020 minus long-term of mean, 1981–2020 baseline reference period). Data source: National Institute of Meteorology of Guinea-Bissau.
Geosciences 13 00025 g003
Figure 4. Annual rainfall anomalies in four stations of Guinea-Bissau over 1981–2020. The 2020 anomalies are represented by dark columns. Data source: National Institute of Meteorology of Guinea-Bissau.
Geosciences 13 00025 g004
Figure 5. 2020 monthly precipitation and corresponding 90 and 95 percentiles of daily precipitation series over 1981–2020. Data source: National Institute of Meteorology of Guinea-Bissau.
Geosciences 13 00025 g005
Figure 6. Monthly rainfall (mm) in July (a), August (b), and September (c) 2020, in Guinea-Bissau. Monthly rainfall anomalies (% of 1981–2020 mean) in July (d), August (e), and September (f).
Geosciences 13 00025 g006
Figure 7. Daily rainfall in Bafatá, Gabú, Bissau, and Bolama from 1 June to 30 September 2020. Precipitation days with rainfall amounts above 50 mm are indicated.
Geosciences 13 00025 g007
Figure 8. Rice growing areas were flooded by heavy rains on the outskirts of Bissau. Source: SNPC, 2020.
Geosciences 13 00025 g008
Figure 9. Flood damage in Bissau. (A)—TVGB repair work after damage caused by rain and strong winds; (B,C)—Effects of strong winds in Bissau suburbs; (DF)—Flooded houses in the outlying neighborhoods of the city of Bissau. Sources: O Democrata GB, VISÃO, and SNPC.
Geosciences 13 00025 g009
Table 1. Comparison of several rainfall parameters with the corresponding average of the climatological period (1981–2020) in Guinea-Bissau. Above normal values are indicated in bold.
BissauBolamaBafatáGabú
Total rainfall20202322.22340.71693.61520.4
1981–2020 1502.1 1953.5 1427.5 1252.1
Maximum daily rainfall2020132180102121.3
1981–2020 209.5 240.6 209.5 208.3
Number of rainfall days ≥ 0.1 mm20209511010196
1981–2020 88 113 90 79
Number of rainfall days ≥ 10 mm202057665243
1981–2020 45 50 42 38
Number of rainfall days ≥ 25 mm202025262616
1981–2020 21 27 20 6
Number of rainfall days ≥ 50 mm2020161266
1981–2020 7 10 6 4
Number of rainfall days ≥ 75 mm20208622
1981–2020 3 5 2 1
Number of rainfall days ≥ 100 mm20205312
1981–20201211
Table 2. Total number of displaced people by region caused by strong winds and flooding. Source: National Civil Protection Service, Guinea Bissau.
RegionsStrong WindsFloodsTotal
Bissau (SAB)29628513147
Tombali1740174
Quinará65065
Cacheu387147534
Bafatá78178256
Gabú231663894
Bolama606
Biombo49778827
Oio88088
Total137446175991
Table 3. Number of homes completely and partially destroyed, by region, caused by strong winds and flooding. Source: National Civil Protection Service, Guinea Bissau.
RegionsStrong WindsFloodsFlood
Total DestructionPartial DestructionTotal DestructionPartial DestructionTotal DestructionPartial Destruction
SAB22202522547245
Tombali146 146
Quinara53 53
Cacheu241819634381
Bafata113219332
Gabu1206496529
Bolama03 03
Biombo5450775581
Oio120 120
TOTAL8487160393244480
Disclaimer/Publisher’s Note: The statements, opinions and data contained in all publications are solely those of the individual author(s) and contributor(s) and not of MDPI and/or the editor(s). MDPI and/or the editor(s) disclaim responsibility for any injury to people or property resulting from any ideas, methods, instructions or products referred to in the content.

