Article

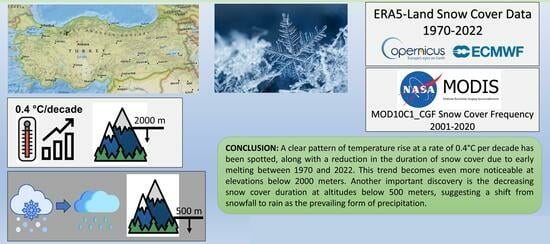
Understanding the Snow Cover Climatology over Turkey from ERA5-Land Reanalysis Data and MODIS Snow Cover Frequency Product

1
Department of Civil Engineering, Faculty of Engineering, Middle East Technical University, 06800 Ankara, Turkey
2
Department of Forest Engineering, Faculty of Forestry, Çankırı Karatekin University, 18200 Çankırı, Turkey
3
Hidrosaf Ltd., Middle East Technical University Technopolis, 06800 Ankara, Turkey
*
Author to whom correspondence should be addressed.
Geosciences 2023, 13(10), 311; https://doi.org/10.3390/geosciences13100311
Submission received: 17 September 2023 / Revised: 10 October 2023 / Accepted: 13 October 2023 / Published: 17 October 2023

Abstract

:
Understanding the distribution, patterns, and characteristics of snowfall and snow cover within a given region over extended periods is important. Snow climatology provides valuable insights into the seasonal and long-term variations in snowfall, helping researchers and meteorologists understand the impacts of climate change on snow accumulation, melt rates, and snowmelt runoff. In this study, in order to understand the spatial and temporal variation in snow cover in Turkey, the temporal and spatial dynamics of snow cover in the country were analyzed during the latest and longest period from 1970 to 2022 using ERA5-Land reanalysis product. It is aimed (1) to show snow-covered area (SCA), snow duration, and snow depth trends over the country; (2) to examine the altitudinal difference of snow phenology response to climate change; and (3) to evaluate the Snow Cover Frequency Maps from MODIS Snow Cover Products with the reanalysis snow depth data. It is found that the “false snow” mapping problem still exists in the MOD10C1_CGF Snow Cover Frequency maps over Turkey, especially in the melting period. We found that an increasing trend of 0.4 °C/decade and snow duration have a decreasing trend due to the early melting between 1970 and 2022. This trend is even more noticeable at elevations below 2000 m. Another important finding is the decreasing trend in snow duration at altitudes below 500 m, indicating a shift from snow to rain for precipitation types.

Graphical Abstract

1. Introduction

Approximately 98% of the seasonal snow cover on the Earth is located in the Northern Hemisphere [1]. Seasonal snow cover, highly responsive to precipitation and temperature fluctuations, exhibits significant spatial and temporal variations in snow mass distribution, influencing freshwater resource recharge, runoff patterns, and near-surface temperature cooling [2]. With climate change driving non-uniform shifts in snowmelt and precipitation, it impacts ecosystems, populations, and economic activities, even in regions devoid of snow. Furthermore, seasonal snow significantly influences the carbon cycle by insulating soil, affecting vegetation growth, and altering carbon fluxes in frozen soil and permafrost areas [3]. The presence of seasonal snow is a crucial element in the global climate system, affecting surface energy, hydrology, heat exchange, and ecosystems. Its high albedo and low thermal conductivity directly impact land surface energy balance, soil temperature, and atmospheric circulation. The Northern Hemisphere heavily relies on snowpack as a natural water storage, making accurate assessment of its spatial and temporal changes essential for climate monitoring, model evaluation, and water resource management [2,3].
In the hydrological cycle, snow represents seasonal water storage from where water is rapidly released during the melting period. Seasonal snow cover in the mountainous areas accumulates much of the water that becomes streamflow, fills water supply reservoirs, and recharges critical groundwater aquifers in the spring and summer months. Snowmelt-driven water is not only demanded by nearly one sixth of the world population as fresh drinking water supply, but it also supports other usages such as industrial, hydro-power, and irrigation applications [4]. Therefore, snow-covered area (SCA) is an important hydrologic variable for streamflow prediction [5], and observations of areal extent have been used in some hydrologic forecasts for decades [6]. Spatiotemporal alterations in the extent of snow cover due to the changing climate are considered to have significant socio-economic impacts in the near future [7,8].
Globally, temperature and precipitation patterns are predicted to change markedly as a result of climate change. Particularly, the regions with a cold or hot semi-arid climate and the Mediterranean climate zone are expected to be strongly affected. A 25–30% decrease in precipitation and increased evaporation are expected by the end of the 21st century in the Mediterranean region, to be accompanied by an even stronger reduction in runoff of up to 30–40%. Climate change influences the snow-dominated basins’ hydrology in two ways. First, climate change causes decrease in runoff amounts, which leads to water insufficiency. Second, it results in shifts in melting times, leading to early floods and/or summer droughts. Owing to increasing air temperatures, snow has begun to ablate 8 days earlier in northern Alaska compared to the mid-1960s [9]. In addition, declines and earlier occurrences of the maximum snow water equivalent (SWE) have been observed in the Cordillera of western North America [10,11,12,13]. Wang et al. [14] evaluated the spatial and temporal dynamic variations in snow in the Northern Hemisphere from 2000 to 2015. They found out that there was a downward fluctuating trend in the variation in snow cover in the Northern Hemisphere. The snow depth and snow cover duration days have decreased across the Northern Hemisphere over the past few decades [15,16,17,18,19].
Reanalysis products are of great importance to improve our understanding of the cryosphere and its interaction with the climate in places where ground observations are limited or do not exist. ERA5-Land reanalysis product [20] is an integral and operational component of the Copernicus Climate Change Service. Snow depth estimates from ERA5-Interim, ERA5, and ERA5-Land are compared with two sets of observations where the sites are distributed among North America, Europe, and Japan in Muñoz-Sabater et al. [20]. In that study, it is presented that ERA5-Land shows lower RMSE over the sites with moderate altitude, i.e., between 1300 and 2500 m, and, with its higher horizontal resolution, it provides a better orographic representation. In the same study, it is also revealed that ERA5 performs better compared to ERA5-Land for heights above 3300 m. In another study, Varga and Breuer [21] found that the ERA5 product represents snow depth remarkably well, with correlation coefficients above 0.9 over a low altitude Central European region. They showed that ERA5-Land overestimates daily mean SD by 2–3 cm for some stations and displays lower correlations (0.7–0.9) during the 26-year time span. Kouki et al. [22] analyzed time series of snow water equivalent (SWE) and snow extent (SCE) in ERA5 and ERA5-Land reanalysis data to compare the time series with several satellite-based datasets in the northern hemisphere in spring 1982–2018. They found that SCE is accurately described in ERA5-Land, whereas ERA5 shows notably larger SCE than the satellite-based datasets. Snow depth retrieved from Sentinel-1 and simulated snow depths of ERA5 and ERA5-Land are compared over the Tibetan Plateau (TP) by Lei et al. [23]. They found out that ERA5-Land matches in situ observations better than ERA5 over the TP.
Sahu and Gupta [24] utilized both atmospheric reanalysis and satellite-based snow products to reveal the relation between climate change and long-term snow cover trends in Chandra Basin, Western Himalaya region. Annual and seasonal variations in snow cover extent over the area between 2001–2017 were realized using Moderate Resolution Imaging Spectroradiometer (MODIS) 8-day snow cover product MOD/MYD10A2 (~500 m) together with precipitation and temperature data from ECMWF’s ERA5 reanalysis dataset (~0.25°). The results indicated a decreasing trend in SCA with increasing temperature, showing a higher rate of correlation as compared to precipitation. ERA5 was also considered as a reliable alternative in long-term trend analysis in case of insufficient in situ observations. Haag et al. [25] also investigated the scope of local climate change and its impacts on the subsistence-based communities over a High Asia region in the Pamir Mountains of Tajikistan, namely, the Savnob and Roshorv villages. They used a holistic perspective by analyzing the statistical trends on temperature and snow cover using downscaled ERA5 temperature data and the MODIS snow cover product MOD10A1 together with the community observations. Monthly temperature trends between 1979 and 2018 were derived from the elevation-corrected [26] and downscaled ERA5 gridded temperature product. The accuracy of the newly created ERA5 temperature dataset was assessed with in situ observations from five ground stations. In order to follow the local snow cover trends over the study region, temporal gap-filled MOD10A1 snow cover data from 2001 to 2018 were employed. To analyze the local community’s observations and opinions on local livelihoods, ecological events, and environmental and climatological conditions such as temperature, precipitation, and snow cover, synchronous research activities composed of workshops and interviews were also held. The elevation-corrected ERA5 temperature dataset indicated a statistically significant increase in summer temperatures in both Savnob and Roshorv with 0.32 °C per decade and 0.38 °C per decade, respectively. Even though it was not statistically significant, MOD10A1 snow cover data over the region revealed an increasing trend in the timing of snow onset and a decreasing trend in the timing of snow offset, indicating a shortening of the snow season. However, in Savnob Village between 2001 and 2018, a statistically significant shortening of the snow period was observed, i.e., 5.4 weeks. The results of the workshops and interviews also pointed to an earlier time of harvest, earlier start of fieldwork, decreasing demand for heating resources, and earlier melting of snow for both villages. Ma et al. [27] explored the spatiotemporal variation and driving mechanisms of snow depth and snow phenology on the TP from daily passive microwave remote sensing snow depth dataset and meteorological data for the period 1979–2020. The findings indicated that the TP exhibited significant elevation-dependent warming (EDW) at 0.04 °C per decade per kilometer, along with decreasing maximum snow depth by 0.12 cm and snow cover duration by 4.1 days per decade per kilometer. EDW correlated with reduced maximum snow depth and snow cover duration. This feedback could exacerbate EDW and earlier snowmelt, potentially increasing droughts and floods.
In Li et al. [28], snow depth and snow cover trends over the Tianshan Mountains in the High Asia region were evaluated by employing and comparing four snow depth datasets from ERA5, ERA5-Land, passive microwave (PMW) (i.e., Special Sensor Microwave Imager (SSM/I) and SSSMI Sounder (SSMI/S)), and dynamically downscaled simulation by Weather Research and Forecasting model (TSS) during the period from 1981 to 2018. The study assessed the snow depth and snow cover from these datasets against in situ meteorological data and interactive multisensor snow and ice mapping system (IMS) snow cover datasets over the region. Then, the spatial patterns and temporal variations in snow-related metrics (i.e., annual mean snow depth and snow cover days) based on the four datasets were compared. The results revealed that although there existed some discrepancies among the four datasets, they were all able to catch the related spatial patterns of snow-related metrics over the study area, indicating a decrease in annual mean snow depth and snow cover days from the north to the east across the Tianshan Mountains. While the ERA5 and ERA5-Land were the only datasets that revealed a significant reduction in annual mean snow depth over the entire study, ERA5, ERA5-Land, and TSS indicated a significant decreasing trend in snow cover days.
Alonso-González et al. [29] studied the snowpack dynamics over Lebanese mountains through the assimilation of MODIS fractional snow-covered area (fSCA) product with ERA5 reanalysis covering the period 2010–2017. The generated 1 km regional-scale snow reanalysis (ICAR_assim) was realized using an ensemble-based data assimilation of MODIS fSCA through an energy and mass snow balance model (i.e., the Flexible Snow Model, FSM2). The necessary boundary and initial conditions required by the regional atmospheric simulation (i.e., Intermediate Complexity Atmospheric Research model, ICAR) were provided by the ERA5 atmospheric reanalysis product. The resultant SWE products exhibited a high degree of agreement with MODIS gap-filled snow cover data, with R = 0.98 and RMSE = 3.0%. The results also highlighted the high temporal variability in the snowpack over the Lebanese mountain ranges, where the most important snow freshwater reservoir resides in the middle elevations (2200–2500 m). The usefulness of data assimilation in snow extent studies in data-scarce regions was also emphasized.
As the Mediterranean basin is considered being one of the most adversely affected regions in the near future due to climate change, according to the simulations regarding the future climatic conditions [30,31], several studies also focused on the spatiotemporal trends in the hydroclimatic variables over Anatolia and the Near East Region by assimilating atmospheric reanalysis products and satellite-based observations. The trends in near-surface air temperature, precipitation, SWE, runoff, and evapotranspiration between 1979 and 2010 over Turkey were evaluated in Gokmen [32] using ERA-Interim and ERA-Interim/Land reanalysis products. The temperature trend analysis from 1979 to 2010 indicated an average warming of 1.26 °C in Turkey, where the largest warming was observed in the western coastal areas next to the Aegean Sea and in the southeastern regions. These trends in air temperature were supported also by the ground measurements from about 100 weather stations, yet they exhibited slightly higher trends ranging from 1 to 2.5 °C. Regarding the precipitation, SWE and runoff trends during the same period, resulting from ERA-Interim and ERA-Interim/Land, were quite different. While the ERA-Interim dataset indicated significant decreasing trends on these parameters in some parts of inner/southeastern Anatolia, ERA-Interim/Land showed no or minor trends over the same regions. Extensive comparisons with precipitation and SWE gauge data suggested that hydrological trends shown by the ERA-Interim/Land dataset were relatively closer to the observations. The overall results indicated no widespread and strong hydrological trends throughout the country from 1979 to 2010, despite the strong warming trends observed for the same period.
Another recent study that investigated the long-term behavior of seasonal snowpack in the eastern parts of Anatolia comprehensively was performed by Yılmaz et al. [33]. The study geographically covered the land area confined between the Mediterranean Sea, Black Sea, Caspian Sea, Arabian Sea, and Red Sea, i.e., the Near East. The study employed several remote sensing products (GRACE: liquid water equivalent thickness anomaly for, MODIS Aqua/Terra: snow-covered area, AMSR-E: SWE, AMSR2: SWE and snow depth, SRTM30: elevation) in combination with atmospheric reanalysis datasets (ERA5: 2 m air temperature, precipitation, snow energy, and mass balance) to reveal the relationship between the terrestrial water storage anomalies and the mountain snowpack over the four important snow-fed river basins of the Near East region, i.e., Euphrates and Tigris basin, Kura-Araks basin, Çoruh basin, and the Van Lake basin. The GRACE dataset covered the period between 2002 and 2017, whereas MODIS Aqua and Terra snow-related datasets spanned 2002–2018 and 2000–2018, respectively. SWE data from AMSR-E between 2002 and 2011, and from AMSR2 between 2012 and 2018 were used. The parameters retrieved from the ERA5 product were from 2002 to 2018. Monthly water storage anomalies derived from the GRACE dataset indicated an increasing trend in the water loss in the whole Near East region, especially after the severe drought in 2007. Results of the analysis on the terrestrial water storage anomalies over these four basins showed relatively higher negative water storage trends at higher altitude ranges (above 1000–1500 m). Snow-covered day analyses from MODIS showed negative trends over high mountainous areas in all basins with an average rate of ~4 weeks/decade. No direct relationship was observed between the seasonal temperature climatology and rainfall/snowfall events. Instead, the rate of change in snowfall events showed seasonal and regional variations, indicating a difference in the response patterns of the snowpack in the Mediterranean mountains to the changing climate.
There are also several studies that put emphasis on similar declining trends on the snow cover extend over the US. Pederson et al. [34] conducted an analysis of the snow water equivalent (SWE) in the western United States. Their investigation revealed that, commencing from 1980, there has been a synchronous and overall diminishing trend in both the northern and southern Rocky Mountains, which can be attributed to the increasing springtime temperatures. In the period preceding 1980, the snowpack had typically displayed a dipole pattern, characterized by opposing anomalies in the northern and southern regions. Lute and Abatzoglou [35] investigated the role of specific extreme snowfall events in influencing the seasonal SWE in the western United States. They characterized snowfall events as the cumulative accumulation of SWE over 3-day periods. Their research revealed that the highest decile of these events accounted for a substantial 69% of the inter-annual variation in snowfall water equivalent. In the study conducted by Harpold et al. [36], an analysis of the SNOTEL SWE data for the central and southern Rocky Mountains spanning the years 1984 to 2009 was undertaken. The findings of this study unveiled extensive reductions in both the maximum SWE values and the duration of snow cover in the region. Taken together, these studies consistently demonstrate a decline in snow cover on the ground, with some of the most extreme reductions observed within the past decade to 15 years. This aligns with the anticipated outcomes resulting from the direct impact of rising temperatures.
The MODIS snow cover product is a vital component of remote sensing technology designed to monitor and analyze snow cover extent and the changes on the Earth’s surface. Onboard NASA’s Terra and Aqua satellites, MODIS captures high-quality imagery with moderate spatial resolution, allowing for the accurate assessment of snow-covered regions. By utilizing different spectral bands, the MODIS snow cover product can distinguish between snow, ice, and other land cover types, enabling researchers and decision-makers to track the dynamic variations in snow cover over time. Recently developed MODIS snow cover frequency maps at ~5 km spatial resolution for the 20-year period (i.e., 2001–2020) provide a unique source of information on snow climatology [37].
In this study, in order to understand the spatial and temporal variation in snow cover in Turkey, the temporal and spatial dynamics of snow cover in the country was analyzed during the latest and longest period from 1970 to 2022 from ERA5-Land reanalysis products. It is aimed (1) to show SCA, snow duration, and snow depth trends over the country; (2) to examine the altitudinal difference of snow phenology response to climate change; and (3) to evaluate the Snow Cover Frequency Maps from MODIS Snow Cover Products with the reanalysis snow depth data.

2. Materials and Methods

2.1. Study Area

Most of the country is situated on the Anatolian plateau, and it is bordered by the Mediterranean Sea to the south, the Aegean Sea to the west and the Black Sea to the north. The country has a total of 783,562 km2 land surface area and lies between 36°–42° N latitudes and 26°–45° E longitudes. In addition to its typical mild mid-latitude Mediterranean climate, dramatically different climate conditions (dry mid-latitude steppe, temperate continental, and oceanic) prevail due to the presence of complex morphology and high-mountain ridges. The mean elevation is 1132 m, whereas the maximum elevation is 5137 m (Figure 1). In general, elevation is high, and altitude differences are large in the north-east, east, and south Anatolia. The west and south-east have lower altitudes. The coastal areas possess milder climates, but North Anatolian and Taurus mountains prevent marine effects penetrating to the inland areas by positioning parallel to the sea [38]. Therefore, the Anatolian plateau receives limited precipitation and has a continental climate with hot and dry summers and cold and snowy winters [39]. The annual average temperature and precipitation values of Turkey for 1970–2022 are 13.3 °C and 618.9 mm, respectively [40,41]. The Köppen climate classification map and the main land use/cover maps are presented in Figure 1b,c. The majority of the land use/cover is shrubland, grassland, and woodland covering the mountainous regions. The high altitudes of eastern part of country, Anatolian plateau is covered with grassland. At lower altitudes, cropland is seen.

2.2. ERA5-Land Snow Depth Data

ERA5-Land [20] is a climate reanalysis product generated by ECMWF, and it is the successor of ERA5 [42] with a long temporal coverage from 1950 to present. It provides hourly data on various atmospheric, land-surface, and sea-state parameters together with estimates of uncertainty. As compared to ERA5, ERA5-Land is superior with its enhanced 9 km spatial resolution, whereas the former is at 31 km. ERA5 employs an advanced land data assimilation system (LDAS) based on a two-dimensional optimal interpolation scheme to analyze snow-related parameters (i.e., density and depth). Additionally, in situ observations from the global SYNOP network are used in ERA5 to retrieve snow depth information [42]. In ERA5, snow cover information at a 4 km resolution over the Northern Hemisphere provided by the Interactive Multi-sensor Snow and Ice Mapping System (IMS) of NOAA/NESDIS (i.e., National Environmental Satellite, Data, and Information Service) is used for regions below 1500 m [43]. On the other hand, ERA5-Land product generation is initialized with the meteorological fields from ERA5 (i.e., humidity, precipitation, temperature, etc.). So, in that sense, ERA5-Land does not assimilate any observations directly, and no direct assimilation of IMS data either. In Muñoz-Sabater et al. [20], two main strengths of ERA5-Land are described as: (i) the horizontal resolution (i.e., 9 km) to accurately simulate the spatial and temporal evolution of the hydrological cycle, and (ii) the production speed and the consistency presented over multidecadal time scales, together with an emphasis on the necessity for further detailed assessment and research on the individual components by the scientific community. The snow depth data provided in ERA5-Land hourly data are downloaded from the associated web page of Copernicus (https://cds.climate.copernicus.eu (accessed on 1 October 2023)), and then re-projected to GCS/WGS84 coordinate system.

2.3. MODIS Snow Cover Frequency (MOD10C1_CGF) Data

A new MODIS snow product developed by Riggs et al. [37] globally provides the frequency of snow-covered days on the ~0.05° (~5 km) MODIS climate modelling grid between years 2001 and 2020 on a per-grid cell basis for each day of the year. These new MODIS snow cover frequency (SCF) maps were generated using the cloud-gap-filled version of MODIS Terra L3 daily snow cover product, i.e., MOD10C1 [44]. The MODIS SCF maps are realized through a two-stage process. In the first stage, a cloud-gap-filled daily product is obtained by applying the methodology described in Hall et al. [45] to the corresponding MOD10C1 product based on the Northern Hemisphere water year as from 1st of October to 30th of September. On the cloud-gap-filled MOD10C1 product, an additional 5 × 5 spatial filter is applied to minimize the potential “false snow” or otherwise spurious snow detections by labelling the center pixel of the filter as “not snow” if less than one third of the filter’s cells are snow, otherwise the label of the center pixel remains as “snow”. Then, in the second stage, the resultant cloud-gap-filled MOD10C1 data are used as input, and the MODIS SCF maps are obtained by calculating the number of years that snow was detected in a grid cell on each day of a year over the 20-year period. The MODIS SCF dataset is available at: https://zenodo.org/record/7113761#.Y4YAonZByUk (accessed on 22 November 2022).

2.4. DEM and Other Used Data

Digital Elevation Model (DEM) [46] with a spatial resolution of 30 m was employed. This data can be obtained from https://earthdata.nasa.gov (accessed on 1 October 2023). Additionally, we utilized the Köppen–Geiger climate classification system developed by German botanist–climatologist Wladimir Köppen that takes into account local vegetation and seasonality of monthly air temperature and precipitation [47]. The description of the classes is given in Table 1. MODIS Land use/cover information is retrieved from the MCD12Q1.061 product, in which the land cover types are derived based on the International Geosphere-Biosphere Programme (IGBP) [48].

2.5. Snow Cover Statistics Obtained from ERA5-Land

According to the characteristics of snow cover over Turkey, we defined the snow hydrological year from the previous year 1st October to the current year 30th September as the hydrological year in the Northern Hemisphere. The snow depth > 5 cm is taken as the standard to determine the snow cover day, which is marked as 1 for snow covered day, otherwise it is 0. The 5 cm threshold is taken in accordance with WMO-No.8 (2018). The snow cover duration days (SCD), the snow cover starting date (SSD), and the snow cover melt date (SMD) in each hydrological year are calculated pixel by pixel. The algorithm assumes that snow cover stays on the ground continuously from falling to melting, ignoring the influence of instantaneous snowfall.
The Sen slope method was used to calculate the time series trends in each snow cover parameter (SCD, SSD, SMD, and SDmax). The significance of trends was tested by Mann–Kendall (M-K) test [49]. Throughout the study, some thresholds for minimum number of yearly data were tried to find the optimum number of yearly data to conclude convenient statistical results. As the minimum threshold of snow depth for snow cover is 5 cm, some regions at lower elevation zones do not have proper number of yearly data to conclude convenient Sen’s slope and M-K statistics for snow start, snow melt, and snow duration analysis. After a trial-and-error process, it was concluded that at least 3 years of observations (i.e., snow existence) must be obtained. Therefore, the pixels having lower than 10 years of observations were automatically eliminated in the analysis.

2.6. Comparison of ERA5-Land and MODIS Snow Cover Frequency Data

The MOD10C1_CGF Snow Cover Frequencies were compared with the ones retrieved from the ERA5-Land climate data. As mentioned, MOD10C1_CGF product depicts 20 years of snow cover information starting from 2000. As the spatial resolutions are not the same (i.e., 5 km for MOD10C1_CGF and 9 km for ERA5-Land), upscaling methodologies were utilized for MOD10C1_CGF product. Inverse distance weighting was selected to apply so that uncertainties of sudden increase in the resolution due to the topographic changes (such as height and slope) could be decreased. After the upscaling, a pre-defined 5 cm snow threshold was applied to create a binary snow cover for each day for the time interval on ERA5-Land reanalysis product. The total values of snow cover for each day were evaluated on ERA5-Land to obtain 20 years snow cover frequencies just as MOD10C1_CGF products. As ERA5-Land data includes the leap year data as well, necessary corrections for additional days were carried out, and the same extents with the same time intervals were created.

2.7. Performance Measures

Evaluation of the products was accomplished by employing the following four basic statistical measures: Root-mean-square error (RMSE), Pearson’s correlation coefficient (R), Probability of Detection (POD), and False Alarm Rate (FAR), and they are briefly explained in Table 2.

3. Results and Discussions

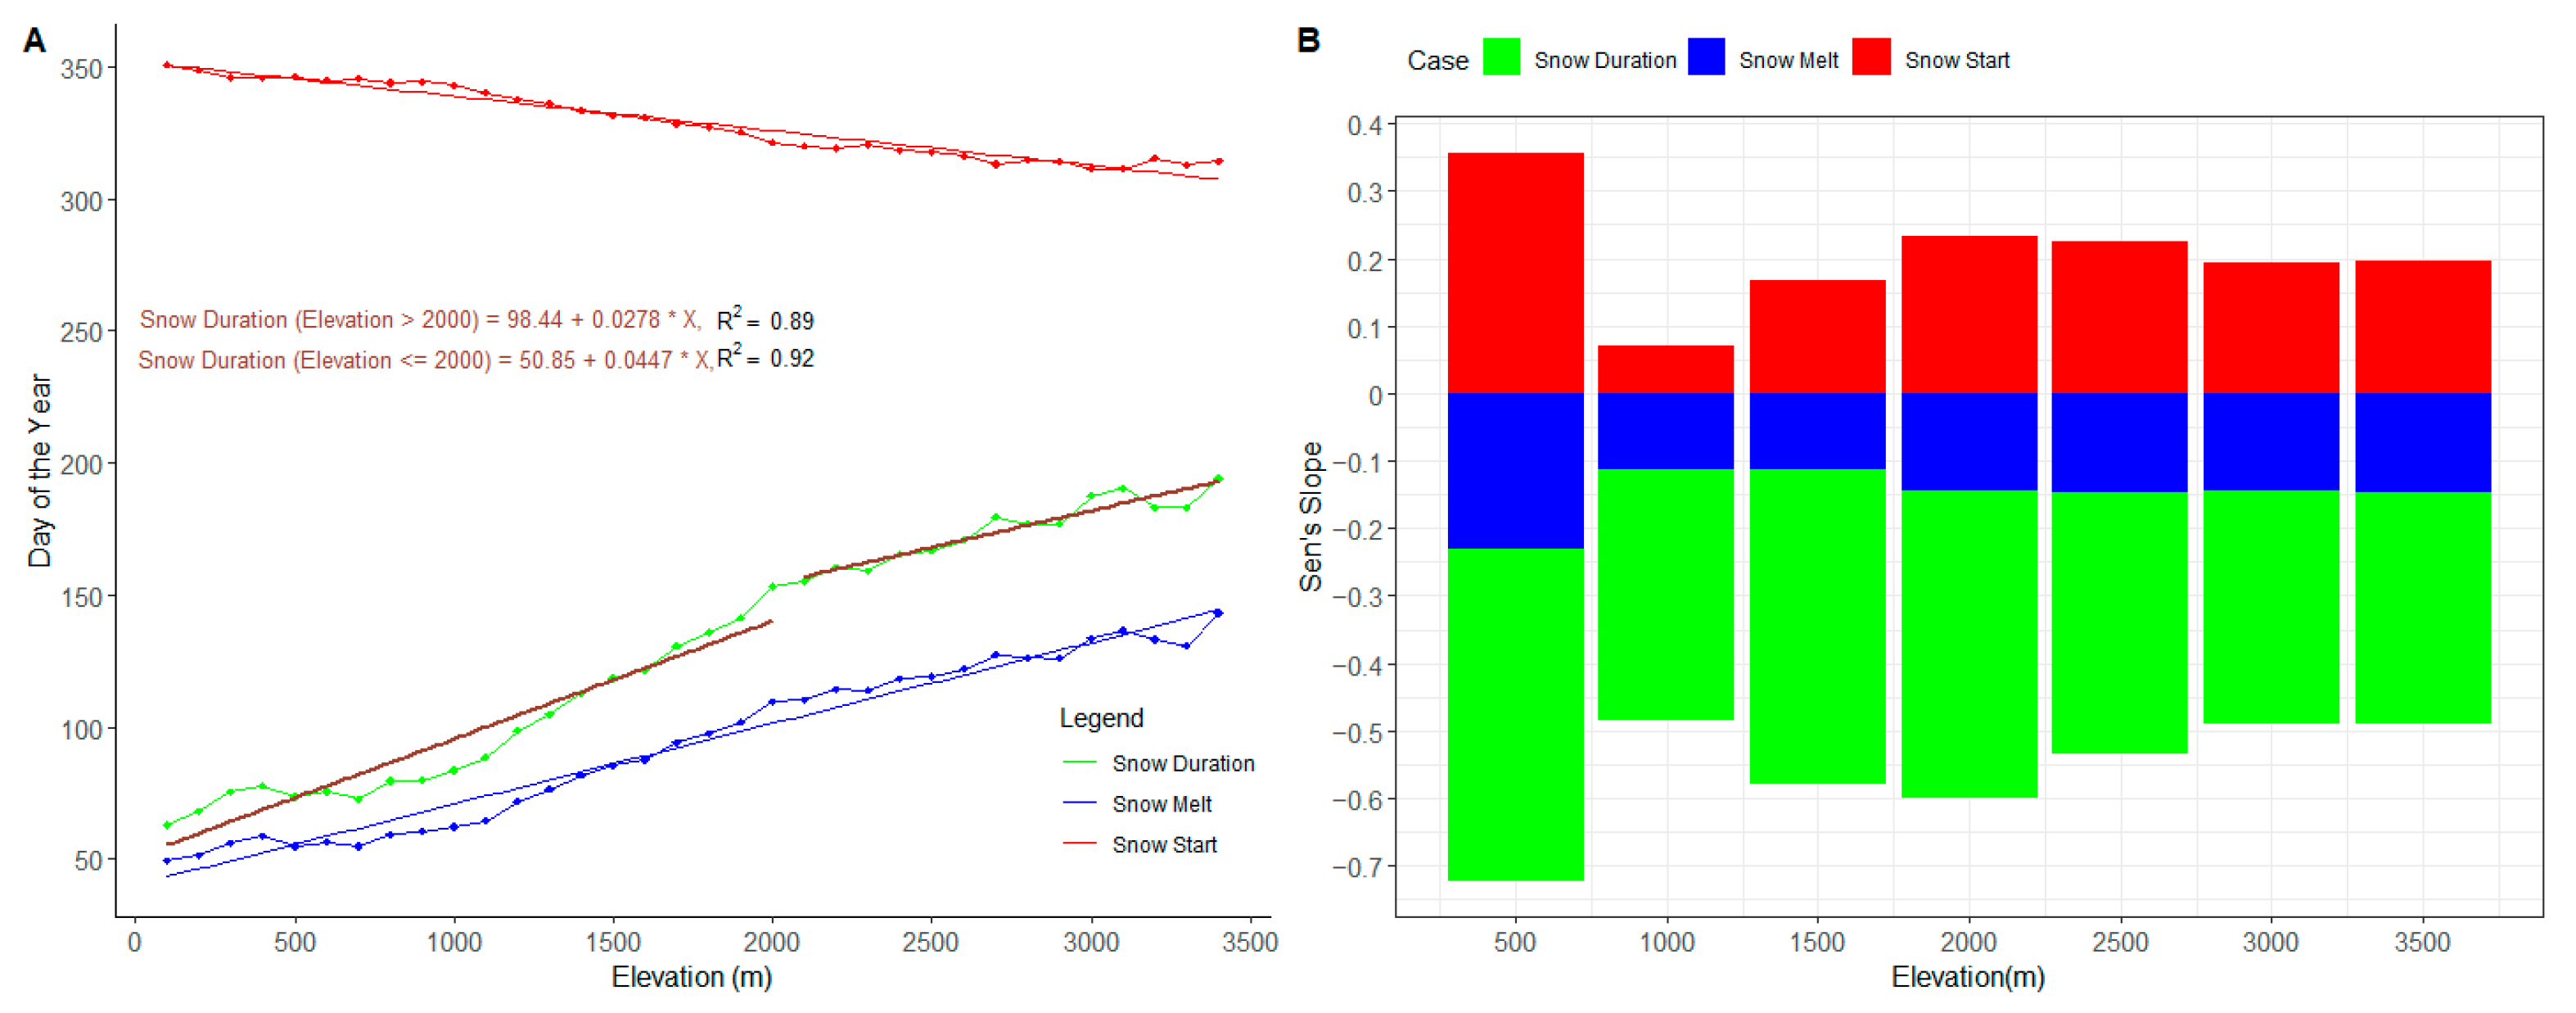
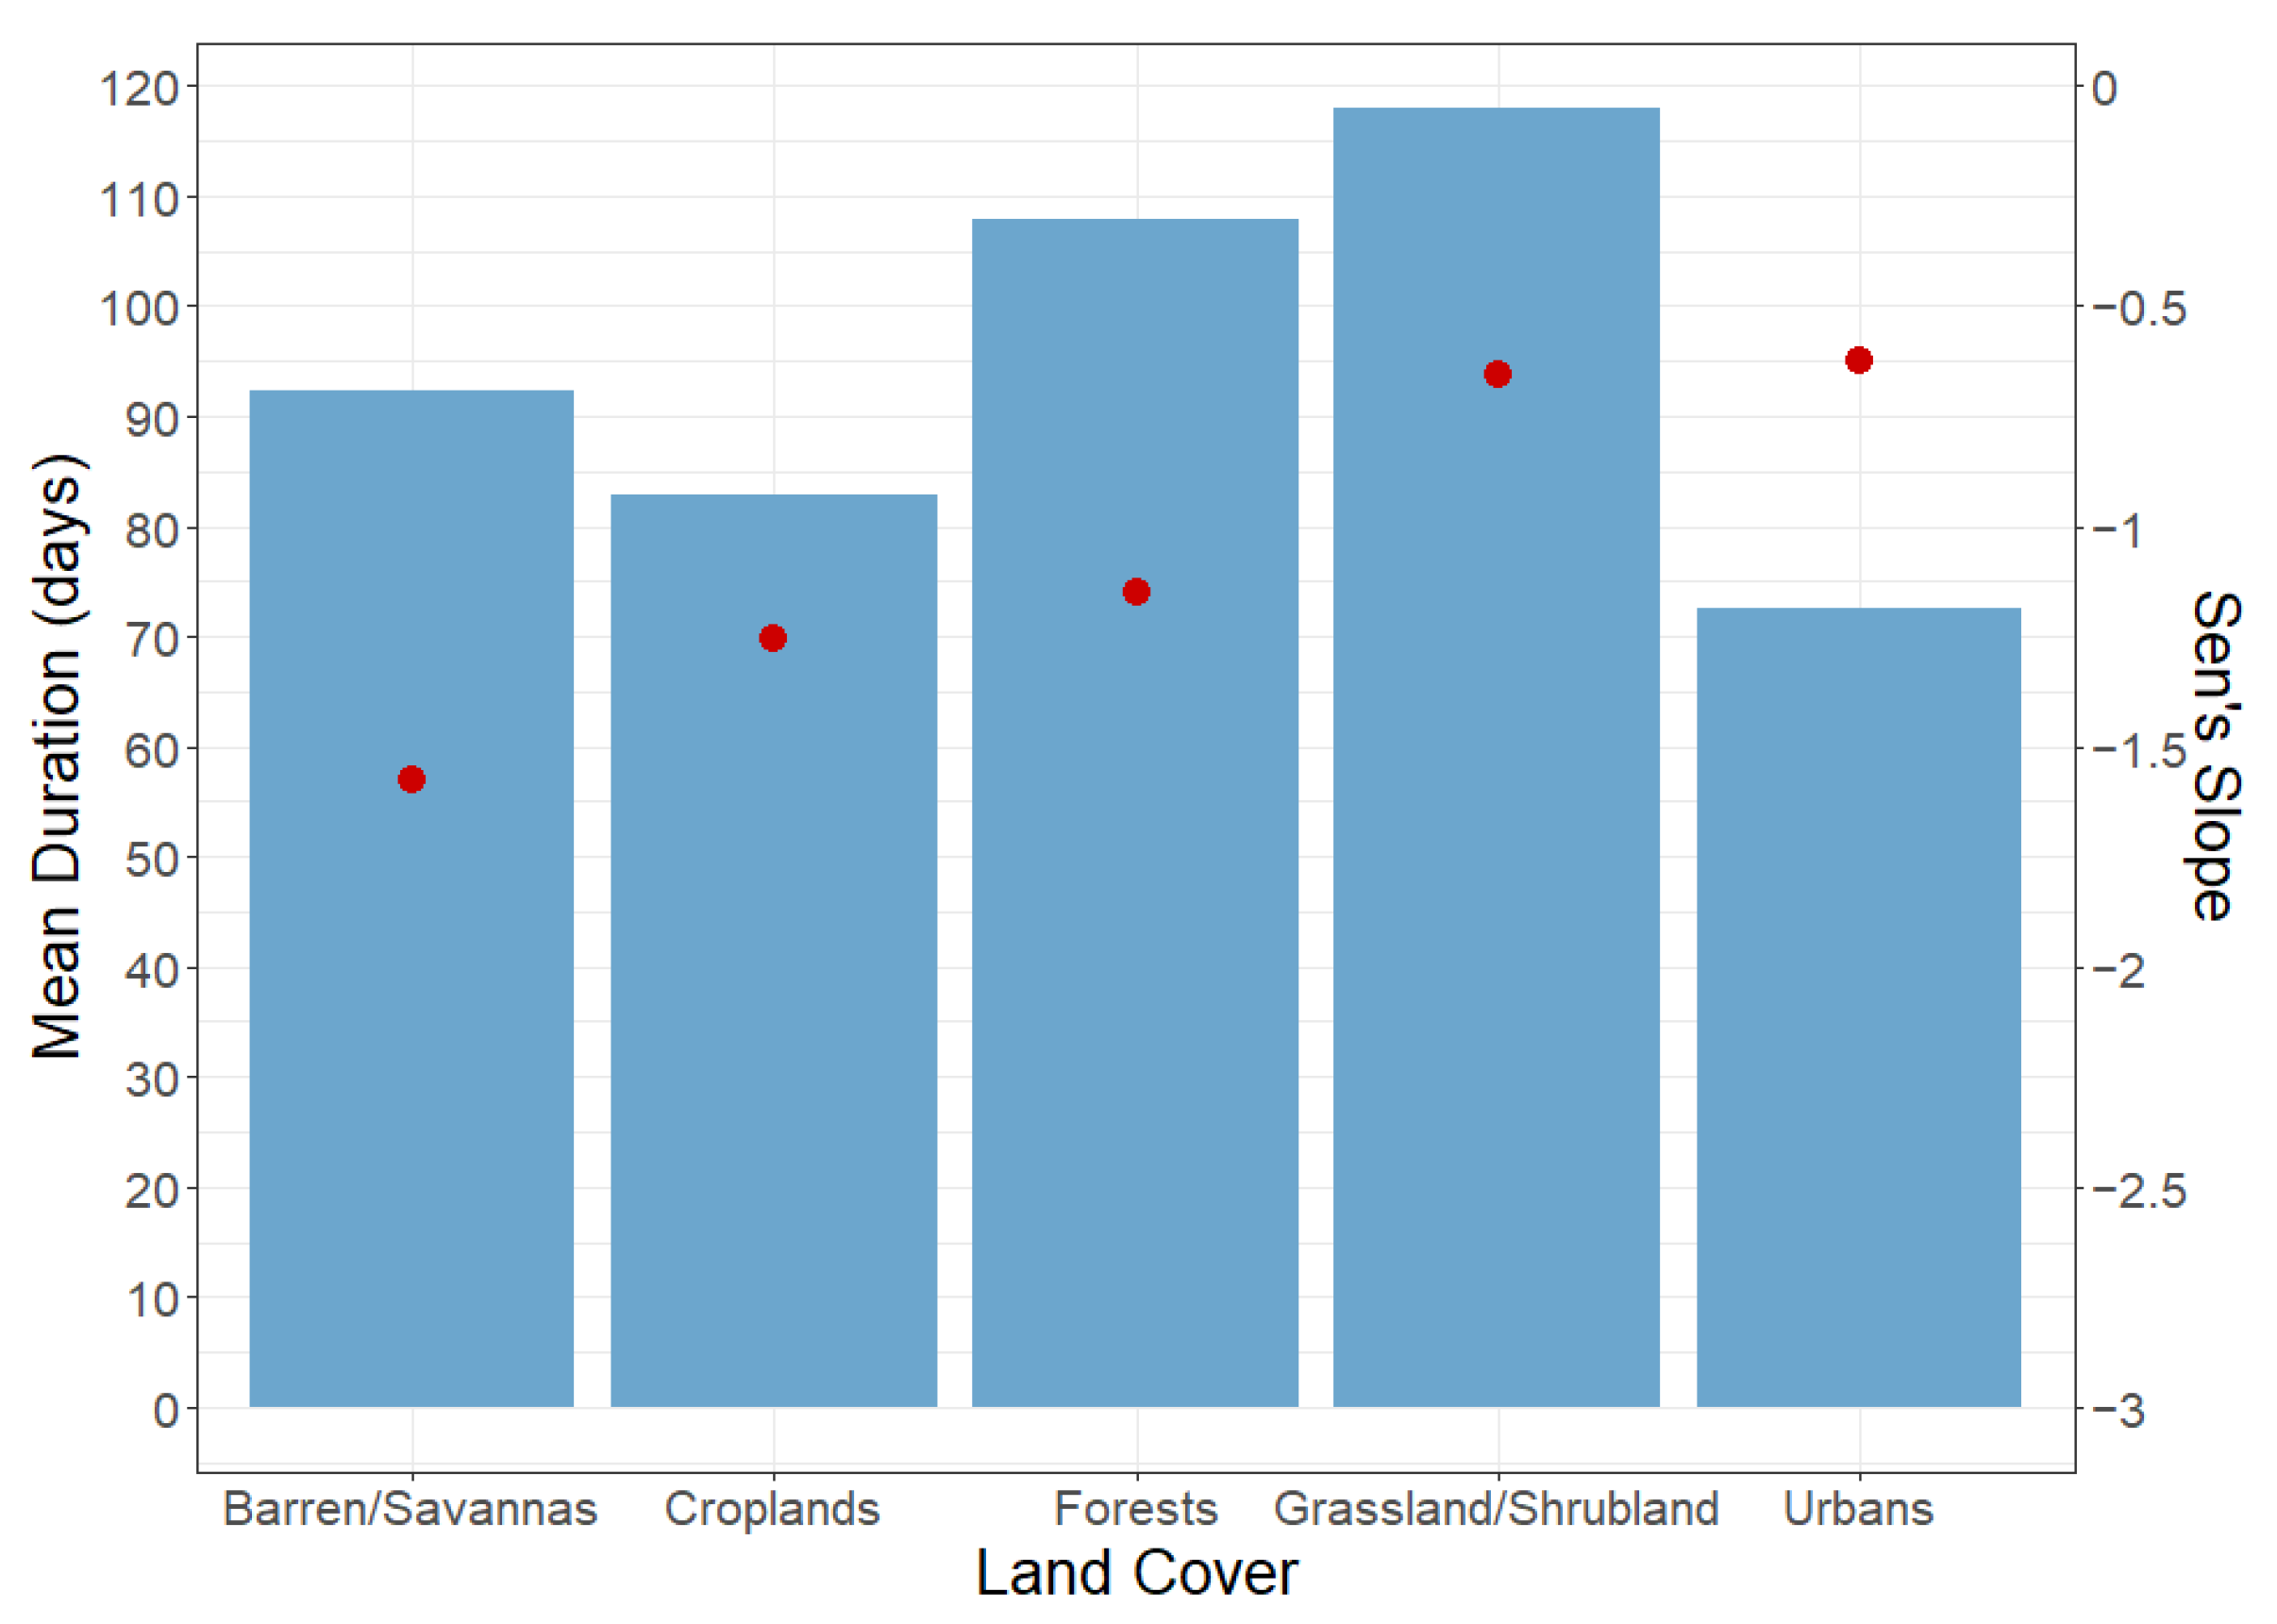
3.1. Snow Cover Statistics

The mean SCD, SSD, SMD, and maximum snow depth maps obtained according to the methodology explained in Section 2.5 are presented in Figure 2. The trends from Sen’s slope are calculated and presented in Figure 3.
The average elevation of the country stands at 1132 m, with an elevation increase from the western to the eastern regions. The mean number of days with snow cover corresponds to the altitude. Higher altitudes exhibit the highest count of snow cover days, averaging around 54 days. The maximum snow depth reaches 350 cm, with an average of 79 cm. The earliest average start of snowfall occurs on day 292 (19 October), whereas the latest start is on day 360 (26 December). The variability is lower at lower altitudes, around 5 days, but it rises to approximately 21 days at higher altitudes. In regions of higher elevation, snow remains on the ground for over three months. The timing of snowmelt aligns with altitude, as snow accumulation forms layers over time, forming a snowpack. At elevated locations with prolonged cold temperatures, the snowpack becomes denser and deeper. This results in a slower melting process due to the need for heat to penetrate through multiple snow layers. Nighttime temperatures at higher altitudes are typically colder, causing melted snow to freeze again and further delaying overall melting. The earliest melting day is day 22 (22 January) at lower altitudes, whereas, at higher altitudes, the latest melting day is day 166 (15 June). The variation in snowmelt timing is minimal at around 8 days for the minimum standard deviation, and up to 30 days for the maximum. Sen’s slope analysis indicates a declining trend in both snow cover days and snow depth. Snow start day does not exhibit a significant trend, whereas snowmelt day shows a clear decrease, implying an earlier melting season and shorter snow duration. This trend is more noticeable at elevations below 2000 m (Figure 4). Throughout the country, there’s a decreasing trend in snow-covered days, but this reduction is more prominent at higher altitudes with a cold dry summer and hot summer climate class. Declining trend in snow depth is at a maximum rate of 10.23 cm/decade. While the first day of snowfall does not show a strong trend, the last day of snow cover displays a decreasing trend, suggesting a shorter duration of snow coverage. This could be linked to the rising temperature trend. According to M-K statistics, there is a noteworthy upward trend in the average temperature within the country. An increasing trend of 0.4 °C/decade is found for the period of 1970 and 2022. A positive trend in annual precipitation around Eastern Black Sea Mountains and Kackar Mountains region is found. The mean decreasing trend in annual precipitation is obtained as 13.6 mm/decade. Certain altitudes are more vulnerable to changes in snow availability. Analyzing the first day of snowfall, snowmelt day, and snow cover duration in relation to elevation, a clear decreasing trend is observed up to 2000 m. Beyond 2000 m, there’s seasonal fluctuation, but no significant trend. Consistent with Mediterranean snowpack characteristics, temporal variability is evident [51]. Similarly, Alonso-González et al. [52] revealed four distinct snowpack types based on depth, duration, and interannual variability, spanning different elevation bands across various ranges, highlighting the variability of snowpack in Iberia. In altitudes below 500 m, snow duration displays a decreasing trend, indicating a shift from snow to rain for precipitation types. Laternser and Schneebeli [53] also reported a shift from snow to rain in the Swiss Alps obtained from ground station snow depth observations between 1931 and 1999, primarily below 650 m above sea level, reflecting changing winter precipitation patterns.
Yucel et al. [54] detected an increasing trend of 1.3 °C between 1970 and 2010 (0.33 °C/decade) in eastern Anatolia. Gokmen [30] also indicated relatively lower warming (about 0.3 °C/decade). In this study, we found an increasing trend of 0.4 °C/decade, and snow duration had a decreasing trend due to early melting between 1970 and 2022. This trend is more noticeable at elevations below 2000 m. This is important for the operations of the dams depending on snow melting. There are several big dams located in the east part of the country, some of which, namely, Keban, Karakaya, and Ataturk, are designed for flood control, hydropower generation, irrigation, and water supply (Figure 1). Thus, accurate snowmelt runoff estimation is very important for this area of interest as it constitutes 60–70% in volume of the total yearly runoff during spring and early summer months [55]. In previous studies, decreases in the peak discharges and early occurrences of the peak discharges were observed due to the increase in the mean temperature and the decrease in the precipitation in the month of April for a basin located in the east part of the country [56]. The findings in this study support the previous results, and it presents that the shortening in the snow season continues.
The average duration of snow coverage among different land cover/use categories reveals that grassland/scrubland experiences the longest period of snow cover (Figure 5). As indicated by Sen’s slope analysis, barren land exhibits the most pronounced decline in snow cover duration. Notably, the reduction in snow cover duration is particularly significant in croplands and forested areas. However, it should be noted that achieving accurate snow cover mapping in forested areas using optical remote sensing is a complex and ongoing challenge. Researchers are continually working on refining methods to enhance the accuracy of snow cover retrievals, taking into account the multifaceted issues related to canopy interference, sensor characteristics, and variations in land cover. Traditional snow maps only depict the extent of snow cover that is observable by satellite sensors. Optical sensors, the primary tools for this purpose, are restricted to certain conditions [57,58]. These sensors can effectively identify snow in areas where it is visible, such as beneath deciduous tree stands (e.g., aspen) during leafless periods, within openings in coniferous forests (e.g., pine, spruce, fir), and in areas with sparse foliage or needle-like vegetation. They can also detect snow intercepted by the forest canopy. However, two main challenges complicate this process. Firstly, the forest floor is often concealed directly by the canopy or tall understory shrubs, obstructing the satellite’s view of the ground snow from a nadir perspective. Secondly, whiskbroom sensors like MODIS, known for their wide swath widths, introduce an oblique perspective as off-nadir satellite angles increase. This perspective diminishes the viewable gap fraction (VGF) and distorts the pixel’s representation as the viewing zenith angle (VZA) rises. Vertical features like trees become projected, obscuring the sensor’s view at oblique angles.
These limitations result in viewable snow cover maps that often do not accurately represent the true extent of snow cover in forested regions. Researchers are actively developing methods to address these challenges and enhance the precision of snow cover mapping in forested areas by considering the complexities introduced by the forest canopy and the satellite sensor’s perspective.
Additionally, snow cover mapping faces issues related to canopy interference, sensor parameters, and land cover variations. The presence of tree canopies and tall vegetation obscures ground snow from satellite observations, rendering it invisible in the nadir view. Moreover, an increase in the sensor’s VZA reduces the observable proportion of forest gaps and elongates the pixels, further complicating the accuracy of snow cover mapping.
Improving the estimation of snow cover in vegetated areas necessitates the development of a robust retrieval model and the incorporation of a canopy adjustment approach. However, adopting a canopy adjustment approach without considering reference fSCA errors may not consistently yield expected improvements across varying VZA-fractional vegetation cover (FVC) conditions. The complexity of applying canopy adjustments is further compounded by the variability in remote sensing observation times.

3.2. Results from the Comparison of ERA5-Land and MODIS Snow Cover Frequency Data

An exemplified pre-resampled and post-resampled MOD10C1_CGF product for January 1 (throughout 20 years) was presented in Figure 6, and the results of RMSE and R values for all pixels were compiled according to elevation classes and presented in Figure 7.
The MODIS snow cover frequency maps, offering spatial resolution of approximately 5 km, present an exclusive data source for snow climatology during the 20-year span from 2001 to 2020. When comparing the MOD10C1_CGF Snow Cover Frequency with ERA5-Land Products spanning from 2001 to 2020, it becomes evident that the correlation coefficient exceeds 0.8 for elevation values ranging from 1000 to 3500 m. The weakest correlation is observed at elevations around 500 m. Elevations below 1000 m in the region typically experience transient snow cover. Within the elevation range of 1500 to 2500 m, RMSE hovers around 3 days. The RMSE increases above 2500 m. This is due to spatial upscaling of MOD10C1_CGF product to ERA5-Land product.
Spatially, the correlation coefficient distribution illustrates strong correspondence between the two products, except along the Aegean and Mediterranean coastlines, at altitudes lower than 1000 m during accumulation and melting periods. POD and FAR values present the locations where the correspondence is not good (Figure 8 and Figure 9).
The high FAR values indicate the “false snow” remaining in the MOF10C1_CGF maps. Riggs et al. [37] stated the reason for this “false snow” as the cloud/snow confusion at the fringes of some cloud formations or mixed pixels along the edges of water bodies. Although they applied a filter by discarding the observations of snow cover extent < 10% in a grid cell and a spatial box filter of 5 × 5 to MOD10C1_CGF map. It is observed from the FAR maps the filters do not work well in some locations in Turkey, especially during melting period. Therefore, outliers are obtained and discarded from the data. An example for May is presented in Figure 10.
By plotting the monthly distribution of snow frequency across different elevation zones (as shown in Figure 11), quartiles are calculated using the R package GGPlot2. Whiskers extending beyond a certain range, namely, the first and third quartiles, are identified as potential outliers. These plots depict the snow seasons at various altitudes. Below 500 m, snow is seen in January, but it occurs less frequently, with a frequency of less than 20%. As it is moved to elevations between 500 and 1000 m, the duration of snow-covered days increases. In the elevation range of 1000–1500 m, snow is observed from December to March. Considering the country’s mean elevation of 1132 m, it is highly likely to experience snow during the winter season (December to March) in the majority of the country. The most extended snow season is observed at elevations surpassing 2500 m. January exhibits the least snow variation in altitude ranges exceeding 2000 m, whereas significant variation occurs in April for the 2000–2500 m elevation zone and in May for the 2500–3000 m elevation zone.

4. Conclusions

This study has shown that MOD10C1_CGF Snow Cover Frequency maps, one for each day of the year, can be used to retrieve the snow climatology over a complex terrain. The validation of the maps was performed with the ERA5-Land reanalysis dataset, which covers the latest and longest period from 1970 to 2022. Although MOD10C1_CGF Snow Cover Frequency maps were derived from the coarse resolution ~5 km daily MODIS CMG cloud-gap-filled and “false snow” filtered product, with an additional spatial filter, the “false snow” mapping problem is still persistent. After deleting the outliers, the maps present the snow climatology well.
Knowing the discrepancies in the reanalysis products, namely, ERA5 and ERA5-Land with the satellite-based datasets, both are able to capture the interannual variability quite accurately. ERA5-Land reanalysis product is found to be valuable to understand the spatial and temporal variation in snow cover in Turkey. The temporal and spatial dynamics of snow cover in the country was analyzed during the latest and longest period from 1970 to 2022.

Author Contributions

Conceptualization, Z.A. and S.K.; methodology, Z.A., S.K., Ç.H.K. and B.A.; analysis, S.K., Ç.H.K. and B.A.; writing—original draft preparation, Z.A.; writing—review and editing, Z.A., S.K., Ç.H.K. and B.A. All authors have read and agreed to the published version of the manuscript.

Funding

This research received no external funding.

Data Availability Statement

The historical Snow-Cover Frequency Maps (MOD10C1_CGF) data on which this article is based on are available at https://zenodo.org/record/7113761. The historical Snow Cover Data (ERA5-Land reanalysis) data is available through the Copernicus Climate Data Store (CDS) https://cds.climate.copernicus.eu/. Digital Elevation Model (DEM) is based on The Shuttle Radar Topography Mission (SRTM) and accessible at https://earthdata.nasa.gov/. The land cover dataset is accessible at https://appeears.earthdatacloud.nasa.gov. Köppen-Geiger climate classification is accessible at https://www.gloh2o.org/koppen/ (all accessed on 1 October 2023).

Conflicts of Interest

The authors declare no conflict of interest.

References

  1. Armstrong, R.L.; Brodzik, M.J. Recent northern hemisphere snow extent: A comparison of data derived from visible and microwave satellite sensors. Geophys. Res. Lett. 2001, 28, 3673–3676. [Google Scholar] [CrossRef]
  2. Pulliainen, J.; Luojus, K.; Derksen, C.; Mudryk, L.; Lemmetyinen, J.; Salminen, M.; Ikonen, J.; Takala, M.; Cohen, J.; Smolander, T.; et al. Patterns and trends of Northern Hemisphere snow mass from 1980 to 2018. Nature 2020, 581, 294–298. [Google Scholar] [CrossRef] [PubMed]
  3. Xiao, X.; Zhang, T.; Zhong, X.; Li, X. Spatiotemporal Variation of Snow Depth in the Northern Hemisphere from 1992 to 2016. Remote Sens. 2020, 12, 2728. [Google Scholar] [CrossRef]
  4. Barnett, T.P.; Adam, J.C.; Lettenmaier, D.P. Potential impacts of a warming climate on water availability in snow-dominated regions. Nature 2005, 438, 303–309. [Google Scholar] [CrossRef] [PubMed]
  5. Rango, A.; Martinec, J. Application of a Snowmelt-Runoff Model Using Landsat Data. Hydrol. Res. 1979, 10, 225–238. [Google Scholar] [CrossRef]
  6. Maurer, E.P.; Rhoads, J.D.; Dubayah, R.O.; Lettenmaier, D.P. Evaluation of the snow-covered area data product from MODIS. Hydrol. Process. 2003, 17, 59–71. [Google Scholar] [CrossRef]
  7. Bormann, K.J.; Brown, R.D.; Derksen, C.; Painter, T.H. Estimating snow-cover trends from space. Nat. Clim. Chang. 2018, 8, 924–928. [Google Scholar] [CrossRef]
  8. Sturm, M.; Goldstein, M.A.; Parr, C. Water and life from snow: A trillion dollar science question. Water Resour. Res. 2017, 53, 3534–3544. [Google Scholar] [CrossRef]
  9. Stone, R.S.; Dutton, E.G.; Harris, J.M.; Longenecker, D. Earlier spring snowmelt in northern Alaska as an indicator of climate change. J. Geophys. Res. Atmos. 2002, 107, ACL 10-11–ACL 10-13. [Google Scholar] [CrossRef]
  10. Déry, S.J.; Brown, R.D. Recent Northern Hemisphere snow cover extent trends and implications for the snow-albedo feedback. Geophys. Res. Lett. 2007, 34, L22504. [Google Scholar] [CrossRef]
  11. Mote, P.W. Climate-Driven Variability and Trends in Mountain Snowpack in Western North America. J. Clim. 2006, 19, 6209–6220. [Google Scholar] [CrossRef]
  12. Mote, P.W.; Hamlet, A.F.; Clark, M.P.; Lettenmaier, D.P. Declining Mountain Snowpack in Western North America*. Bull. Am. Meteorol. Soc. 2005, 86, 39–50. [Google Scholar] [CrossRef]
  13. Stewart, I.T.; Cayan, D.R.; Dettinger, M.D. Changes toward Earlier Streamflow Timing across Western North America. J. Clim. 2005, 18, 1136–1155. [Google Scholar] [CrossRef]
  14. Wang, Y.; Huang, X.; Liang, H.; Sun, Y.; Feng, Q.; Liang, T. Tracking Snow Variations in the Northern Hemisphere Using Multi-Source Remote Sensing Data (2000–2015). Remote Sens. 2018, 10, 136. [Google Scholar] [CrossRef]
  15. Allchin, M.I.; Déry, S.J. A spatio-temporal analysis of trends in Northern Hemisphere snow-dominated area and duration, 1971–2014. Ann. Glaciol. 2017, 58, 21–35. [Google Scholar] [CrossRef]
  16. Chen, X.; Liang, S.; Cao, Y.; He, T.; Wang, D. Observed contrast changes in snow cover phenology in northern middle and high latitudes from 2001–2014. Sci. Rep. 2015, 5, 16820. [Google Scholar] [CrossRef]
  17. Dye, D.G. Variability and trends in the annual snow-cover cycle in Northern Hemisphere land areas, 1972–2000. Hydrol. Process. 2002, 16, 3065–3077. [Google Scholar] [CrossRef]
  18. Peng, S.; Piao, S.; Ciais, P.; Friedlingstein, P.; Zhou, L.; Wang, T. Change in snow phenology and its potential feedback to temperature in the Northern Hemisphere over the last three decades. Environ. Res. Lett. 2013, 8, 014008. [Google Scholar] [CrossRef]
  19. Chen, X.; Yang, Y.; Ma, Y.; Li, H. Distribution and Attribution of Terrestrial Snow Cover Phenology Changes over the Northern Hemisphere during 2001–2020. Remote Sens. 2021, 13, 1843. [Google Scholar] [CrossRef]
  20. Muñoz-Sabater, J.; Dutra, E.; Agustí-Panareda, A.; Albergel, C.; Arduini, G.; Balsamo, G.; Boussetta, S.; Choulga, M.; Harrigan, S.; Hersbach, H.; et al. ERA5-Land: A state-of-the-art global reanalysis dataset for land applications. Earth Syst. Sci. Data 2021, 13, 4349–4383. [Google Scholar] [CrossRef]
  21. Varga, Á.J.; Breuer, H. Evaluation of snow depth from multiple observation-based, reanalysis, and regional climate model datasets over a low-altitude Central European region. Theor. Appl. Climatol. 2023, 153, 1393–1409. [Google Scholar] [CrossRef]
  22. Kouki, K.; Luojus, K.; Riihelä, A. Evaluation of snow cover properties in ERA5 and ERA5-Land with several satellite-based datasets in the Northern Hemisphere in spring 1982–2018. Cryosphere Discuss. 2023, 2023, 1–33. [Google Scholar] [CrossRef]
  23. Lei, Y.; Pan, J.; Xiong, C.; Jiang, L.; Shi, J. Snow depth and snow cover over the Tibetan Plateau observed from space in against ERA5: Matters of scale. Clim. Dyn. 2023, 60, 1523–1541. [Google Scholar] [CrossRef]
  24. Sahu, R.; Gupta, R.D. Snow cover area analysis and its relation with climate variability in Chandra basin, Western Himalaya, during 2001–2017 using MODIS and ERA5 data. Environ. Monit. Assess. 2020, 192, 489. [Google Scholar] [CrossRef] [PubMed]
  25. Haag, I.; Kassam, K.-A.; Senftl, T.; Zandler, H.; Samimi, C. Measurements meet human observations: Integrating distinctive ways of knowing in the Pamir Mountains of Tajikistan to assess local climate change. Clim. Chang. 2021, 165, 5. [Google Scholar] [CrossRef]
  26. Gao, L.; Bernhardt, M.; Schulz, K.; Chen, X. Elevation correction of ERA-Interim temperature data in the Tibetan Plateau. Int. J. Climatol. 2017, 37, 3540–3552. [Google Scholar] [CrossRef]
  27. Ma, Q.; Keyimu, M.; Li, X.; Wu, S.; Zeng, F.; Lin, L. Climate and elevation control snow depth and snow phenology on the Tibetan Plateau. J. Hydrol. 2023, 617, 128938. [Google Scholar] [CrossRef]
  28. Li, Q.; Yang, T.; Li, L. Evaluation of snow depth and snow cover represented by multiple datasets over the Tianshan Mountains: Remote sensing, reanalysis, and simulation. Int. J. Climatol. 2022, 42, 4223–4239. [Google Scholar] [CrossRef]
  29. Alonso-González, E.; Gutmann, E.; Aalstad, K.; Fayad, A.; Bouchet, M.; Gascoin, S. Snowpack dynamics in the Lebanese mountains from quasi-dynamically downscaled ERA5 reanalysis updated by assimilating remotely sensed fractional snow-covered area. Hydrol. Earth Syst. Sci. 2021, 25, 4455–4471. [Google Scholar] [CrossRef]
  30. Giorgi, F.; Lionello, P. Climate change projections for the Mediterranean region. Glob. Planet. Chang. 2008, 63, 90–104. [Google Scholar] [CrossRef]
  31. Lelieveld, J.; Hadjinicolaou, P.; Kostopoulou, E.; Chenoweth, J.; El Maayar, M.; Giannakopoulos, C.; Hannides, C.; Lange, M.A.; Tanarhte, M.; Tyrlis, E.; et al. Climate change and impacts in the Eastern Mediterranean and the Middle East. Clim. Chang. 2012, 114, 667–687. [Google Scholar] [CrossRef] [PubMed]
  32. Gokmen, M. Spatio-temporal trends in the hydroclimate of Turkey for the last decades based on two reanalysis datasets. Hydrol. Earth Syst. Sci. 2016, 20, 3777–3788. [Google Scholar] [CrossRef]
  33. Yılmaz, Y.A.; Aalstad, K.; Sen, O.L. Multiple Remotely Sensed Lines of Evidence for a Depleting Seasonal Snowpack in the Near East. Remote Sens. 2019, 11, 483. [Google Scholar] [CrossRef]
  34. Pederson, G.T.; Betancourt, J.L.; McCabe, G.J. Regional patterns and proximal causes of the recent snowpack decline in the Rocky Mountains, U.S. Geophys. Res. Lett. 2013, 40, 1811–1816. [Google Scholar] [CrossRef]
  35. Lute, A.C.; Abatzoglou, J.T. Role of extreme snowfall events in interannual variability of snowfall accumulation in the western United States. Water Resour. Res. 2014, 50, 2874–2888. [Google Scholar] [CrossRef]
  36. Harpold, A.; Brooks, P.; Rajagopal, S.; Heidbuchel, I.; Jardine, A.; Stielstra, C. Changes in snowpack accumulation and ablation in the intermountain west. Water Resour. Res. 2012, 48, W11501. [Google Scholar] [CrossRef]
  37. Riggs, G.; Hall, D.; Vuyovich, C.; DiGirolamo, N. Development of Snow Cover Frequency Maps from MODIS Snow Cover Products. Remote Sens. 2022, 14, 5661. [Google Scholar] [CrossRef]
  38. Sensoy, S.; Demircan, M.; Ulupınar, Y. Climate of Turkey. Available online: https://mgm.gov.tr/FILES/genel/makale/31_climateofturkey.pdf (accessed on 18 August 2023).
  39. Amjad, M.; Yilmaz, M.T.; Yucel, I.; Yilmaz, K.K. Performance evaluation of satellite- and model-based precipitation products over varying climate and complex topography. J. Hydrol. 2020, 584, 124707. [Google Scholar] [CrossRef]
  40. Mean Temperature of Turkey. Available online: https://www.mgm.gov.tr/FILES/resmi-istatistikler/parametreAnalizi/2022-ortalama-sicaklik.pdf (accessed on 30 August 2023).
  41. Mean Precipitation of Turkey. Available online: https://www.mgm.gov.tr/FILES/resmi-istatistikler/parametreAnalizi/2022-yagis.pdf (accessed on 30 August 2023).
  42. Hersbach, H.; Bell, B.; Berrisford, P.; Hirahara, S.; Horányi, A.; Muñoz-Sabater, J.; Nicolas, J.; Peubey, C.; Radu, R.; Schepers, D.; et al. The ERA5 global reanalysis. Q. J. R. Meteorol. Soc. 2020, 146, 1999–2049. [Google Scholar] [CrossRef]
  43. Orsolini, Y.; Wegmann, M.; Dutra, E.; Liu, B.; Balsamo, G.; Yang, K.; de Rosnay, P.; Zhu, C.; Wang, W.; Senan, R.; et al. Evaluation of snow depth and snow cover over the Tibetan Plateau in global reanalyses using in situ and satellite remote sensing observations. Cryosphere 2019, 13, 2221–2239. [Google Scholar] [CrossRef]
  44. Hall, D.K.; Riggs, G.A. MODIS/Terra Snow Cover Daily L3 Global 0.05 Deg CMG, Version 61. Available online: https://nsidc.org/sites/default/files/mod10c1-v061-userguide_0.pdf (accessed on 28 November 2022).
  45. Hall, D.K.; Riggs, G.A.; Foster, J.L.; Kumar, S.V. Development and evaluation of a cloud-gap-filled MODIS daily snow-cover product. Remote Sens. Environ. 2010, 114, 496–503. [Google Scholar] [CrossRef]
  46. Farr, T.G.; Rosen, P.A.; Caro, E.; Crippen, R.; Duren, R.; Hensley, S.; Kobrick, M.; Paller, M.; Rodriguez, E.; Roth, L.; et al. The Shuttle Radar Topography Mission. Rev. Geophys. 2007, 45, RG2004. [Google Scholar] [CrossRef]
  47. Köppen, W. Das Geographische System der Klimate; Gebrüder Borntraeger: Berlin, Germany, 1936. [Google Scholar]
  48. Friedl, M.A.; Sulla-Menashe, D.; Tan, B.; Schneider, A.; Ramankutty, N.; Sibley, A.; Huang, X. MODIS Collection 5 global land cover: Algorithm refinements and characterization of new datasets. Remote Sens. Environ. 2010, 114, 168–182. [Google Scholar] [CrossRef]
  49. Gocic, M.; Trajkovic, S. Analysis of changes in meteorological variables using Mann-Kendall and Sen’s slope estimator statistical tests in Serbia. Glob. Planet. Chang. 2013, 100, 172–182. [Google Scholar] [CrossRef]
  50. Doswell, C.A., III; Davies-Jones, R.; Keller, D.L. On summary measures of skill in rare event forecasting based on contingency tables. Weather. Forecast. 1990, 5, 576–585. [Google Scholar] [CrossRef]
  51. Fayad, A.; Gascoin, S.; Faour, G.; López-Moreno, J.I.; Drapeau, L.; Page, M.L.; Escadafal, R. Snow hydrology in Mediterranean mountain regions: A review. J. Hydrol. 2017, 551, 374–396. [Google Scholar] [CrossRef]
  52. Alonso-González, E.; López-Moreno, J.I.; Navarro-Serrano, F.; Sanmiguel-Vallelado, A.; Revuelto, J.; Domínguez-Castro, F.; Ceballos, A. Snow climatology for the mountains in the Iberian Peninsula using satellite imagery and simulations with dynamically downscaled reanalysis data. Int. J. Climatol. 2020, 40, 477–491. [Google Scholar] [CrossRef]
  53. Laternser, M.; Schneebeli, M. Long-term snow climate trends of the Swiss Alps (1931–99). Int. J. Climatol. 2003, 23, 733–750. [Google Scholar] [CrossRef]
  54. Yucel, I.; Güventürk, A.; Sen, O.L. Climate change impacts on snowmelt runoff for mountainous transboundary basins in eastern Turkey. Int. J. Climatol. 2015, 35, 215–228. [Google Scholar] [CrossRef]
  55. Şorman, A.A.; Şensoy, A.; Tekeli, A.E.; Şorman, A.Ü.; Akyürek, Z. Modelling and forecasting snowmelt runoff process using the HBV model in the eastern part of Turkey. Hydrol. Process. 2009, 23, 1031–1040. [Google Scholar] [CrossRef]
  56. Akyurek, Z.; Surer, S.; Beser, Ö. Investigation of the snow-cover dynamics in the Upper Euphrates Basin of Turkey using remotely sensed snow-cover products and hydrometeorological data. Hydrol. Process. 2011, 25, 3637–3648. [Google Scholar] [CrossRef]
  57. Rittger, K.; Raleigh, M.S.; Dozier, J.; Hill, A.F.; Lutz, J.A.; Painter, T.H. Canopy Adjustment and Improved Cloud Detection for Remotely Sensed Snow Cover Mapping. Water Resour. Res. 2020, 56, e2019WR024914. [Google Scholar] [CrossRef]
  58. Xiao, X.; He, T.; Liang, S.; Liu, X.; Ma, Y.; Liang, S.; Chen, X. Estimating fractional snow cover in vegetated environments using MODIS surface reflectance data. Int. J. Appl. Earth Obs. Geoinf. 2022, 114, 103030. [Google Scholar] [CrossRef]
Figure 1. DEM of Turkey with major mountains and dams (a), Köppen climate classification, (b) and MODIS land use/cover map (c).
Geosciences 13 00311 g001
Figure 2. Snow cover duration days (a), snow depth (b), snow start (c), and melt days (d) obtained for 1970–2022.
Geosciences 13 00311 g002
Figure 3. Trend results in SCD (a), snow depth (b), snow start day (c), snow melt day (d), mean annual temperature (e), and annual precipitation (f).
Geosciences 13 00311 g003
Figure 4. Snow duration, snow start, and melt dates (brown lines indicate the best fit line) (A) and Sen’s slope of snow duration, snow start, and melt dates according to the elevation (B).
Geosciences 13 00311 g004
Figure 5. Snow cover duration trend with respect to land cover/use classes. Red dots are presenting the Sen’s Slope values.
Geosciences 13 00311 g005
Figure 6. Original Snow Cover Frequency for January 1 compiled from 20 years data of MOD10C1_CGF (a) and the Resampled product to 9 km (b).
Geosciences 13 00311 g006
Figure 7. Snow Cover RMSE and R values obtained from MOD10C1_CGF Snow Cover Frequency and ERA5-Land Products for 20 years of data.
Geosciences 13 00311 g007
Figure 8. Monthly POD (left column) and FAR (right column) values for October, November, December, and January (POD: probability of detection, and FAR: false alarm ratio).
Geosciences 13 00311 g008
Figure 9. Monthly POD (left column) and FAR (right column) values February, March, April, and May (POD: probability of detection, and FAR: false alarm ratio).
Geosciences 13 00311 g009
Figure 10. Original MOF10C1_CGF map accumulated for May (a) and the one where the outliers are discarded (b).
Geosciences 13 00311 g010
Figure 11. Monthly distribution of snow frequency at elevation zones 0–500 m (a), 500–1000 m (b), 1000–1500 m (c), 1500–2000 m (d), 2000–2500 m (e), 2500–3000 m (f), and 3000–3500 m (g) (blue stars indicate the mean values).
Geosciences 13 00311 g011
Table 1. Köppen–Geiger climate classification scheme with mean and standard deviation in mean annual temperature and annual total precipitation.
SymbolDescriptionTep (°C)
Mean (std)
Precipitation (mm)
Mean (std)
BShArid steppe hot18.56 (0.08)314.08 (11.59)
BSkArid steppe cold10.55 (1.67)487.06 (128.34)
BWkArid desert cold11.68 (0.76)952.90 (92.53)
CfaTemperate no dry season hot summer12.20 (1.34)1154.13 (496.37)
CfbTemperate no dry season warm summer10.63 (1.14)1197.08 (397.19)
CsaTemperate dry summer hot summer14.65 (2.01)690.10 (181.82)
CsbTemperate dry summer warm summer10.96 (1.20)796.71 (245.90)
DfbCold no dry season warm summer6.30 (2.29)957.46 (375.25)
DfcCold no dry season cold summer2.77 (1.22)1046.94 (376.71)
DsaCold dry summer hot summer9.97 (2.12)826.93 (206.92)
DsbCold dry summer warm summer7.18 (2.20)720.73 (219.34)
DscCold dry summer cold summer3.71 (1.50935.96 (270.06)
Table 2. Statistical performance measures used in the analysis.
AbbrevationExplanationInterpretationFormula
RMSESquare root of the mean-squared errorIt is a measure of how the residuals are spreaded out.   RMSE = 1 N k = 1 N y k y ^ k 2
RLinear relation between observed and predicted responser > 0 indicates a positive association. r < 0 indicates a negative association. Values of r near 0 indicate a very weak linear relationship.   R = 1 N 1 k = 1 N y k y ¯ s y y ^ k y ^ ¯ s y ^
PODLikelihood of correctly identifying or detecting a true positive event (hit) when it occursA higher value indicates a better ability to correctly identify positive cases.   POD = h i t s h i t s + f a l s e   n e g a t i v e s
FARA metric that quantifies the ratio of incorrect alarms to the total number of alarms or warnings given in a specific study or situationA lower value indicates a better ability to avoid producing false alarms.   FAR = f a l s e   p o s i t i v e s h i t s + f a l s e   p o s i t i v e s
Note: N, number of observations;  y k , kth observed response value;  y ^ k , kth predicted (fitted) response value;  y ¯ , mean of observed response values;  y ^ ¯ , mean of predicted response values;  s y , standard deviation of observed response values;  s y ^ , standard deviation of predicted response values. Dichotomous POD and FAR metrics are obtained from the binary error matrix [50].
Disclaimer/Publisher’s Note: The statements, opinions and data contained in all publications are solely those of the individual author(s) and contributor(s) and not of MDPI and/or the editor(s). MDPI and/or the editor(s) disclaim responsibility for any injury to people or property resulting from any ideas, methods, instructions or products referred to in the content.

