Article

The Porosity in Heterogeneous Carbonate Reservoir Rocks: Tectonic versus Diagenetic Imprint—A Multi-Scale Study from the Hyblean Plateau (SE Sicily, Italy)

by
Rosanna Maniscalco
1,*,
Eugenio Fazio
1,
Rosalda Punturo
1,2,
Rosolino Cirrincione
1,
Agata Di Stefano
1,
Salvatore Distefano
1,
Martina Forzese
1,
Gabriele Lanzafame
1,
Giusy Simona Leonardi
1,
Sergio Montalbano
1,
Alessandra Giovanna Pellegrino
1,
Antonino Raele
1 and
Giuseppe Palmeri
3
1
Department of Biological, Geological and Environmental Sciences, University of Catania, 95129 Catania, Italy
2
Institute of Environmental Geology and Geoengineering (IGAG—CNR), 00185 Rome, Italy
3
Maurel & Prom Italia s.r.l., 97100 Ragusa, Italy
*
Author to whom correspondence should be addressed.
Geosciences 2022, 12(4), 149; https://doi.org/10.3390/geosciences12040149
Submission received: 25 February 2022 / Revised: 18 March 2022 / Accepted: 21 March 2022 / Published: 25 March 2022
(This article belongs to the Special Issue Advances in Carbonate Sedimentology)

Abstract

:
The petroleum industry has always been pursuing highly exploitable gas fields, which are often hosted in carbonate rocks. However, carbonates are highly heterogeneous and show different fabrics and structures as the result of sedimentation in various environments, and subsequent diagenesis and deformation. In this study, a multi-scale and multidisciplinary approach has been performed on classical reservoir rocks from the subsurface of the Hyblean Plateau (Sicily, Italy). We aim at unravelling the important and debated role of tectonic and diagenetic structures (mainly fractures as well as stylolites) in enhancing or reducing the porosity. Black shales, limestones, and laminites of intertidal environment represent the main lithologies. Structure cross-cutting relationships record different stages of the basin geological history, which are related to the tectonic evolution of the area. Our results show that porosity is uncommonly lightly affected by fractures and faults, because of their mineralization, whereas stylolites, which are often considered as barriers to fluid flow, show a certain porosity. Therefore, we want to highlight the importance of a multi-scale and multidisciplinary approach in the analysis of heterogeneously porous, fractured- and stylolite-rich carbonate rocks, and our study aspires to boost other similar gas reservoir studies in energy transition times.

1. Introduction

For decades, the Hyblean Plateau in south-east Sicily has been the main target for hydrocarbon exploitation, extraction of carbonate stone and ornamental materials impregnated with bitumen, including the so-called “pitch stone” [1,2,3,4,5]. More than 60% of the world’s oil and 40% of gas are found in carbonate reservoirs [6,7]. Such deposits can store huge accumulations of hydrocarbons, and their microstructures can highly influence the porosity of the rock [8,9,10,11,12,13,14,15,16]. The quality of these reservoirs is firstly controlled by petrophysical properties of rocks (from primary processes to diagenesis) and distribution of fractures [16,17]: in fact, networking of fractures usually improves pores interconnectivity by forming paths within the same or different mediums, which is particularly relevant in heterogeneous reservoirs [16,18,19,20,21,22,23,24,25,26,27,28]. The petrophysical characterization of carbonate depositional systems is challenging because of their intrinsic heterogeneity [29]. Additionally, carbonates can be affected or changed with time by diagenesis, structural discontinuities, presence of infilling materials, and pressure/temperature conditions [30]. Therefore, the fracture network can influence the storage, porosity, and flow direction of hydrocarbons, and can sometimes affect other aspects [16,31]. Orientation, length, spacing, and opening of fractures may change the secondary porosity of the medium [32,33]. In carbonates, two different types of porosity can be distinguished: the first (primary), fabric selective, where the fluid can flow through the matrix and, the second (secondary), non-fabric selective, through fractures [16,30,34]. In geology, a fracture is defined as any discontinuity in the rock where cohesion has been lost due to a brittle deformation process [28,35,36,37,38]. Such an event is highly controlled by the mechanical properties of the rocks (e.g., cohesion, shear strength, etc.) and by the stratigraphic records, for example, the thickness of the layers and the layer surfaces [28]. Fractures can cut one or more layer, changing the porosity of carbonate reservoirs [16,39]. Additionally, the permeation of different fluids (hydrocarbons, water) can dissolve the matrix or fill the pores (secondary mineralization), thus reducing the porosity and therefore permeability of the reservoir itself [16,39,40,41].
Other frequent diagenetic features influencing fluid flow within carbonate reservoirs are stylolites [42,43,44,45]: rough dissolution surfaces, due to localized pressure [42,46], surrounded by insoluble material (mainly clay minerals, oxides, and organic material), which progressively accumulates replacing the more soluble portions [42,45,47]. Stylolites have a typical suturing structure with teeth from a few mm to a few cm, which point at the direction of maximum compression [48,49]. Bedding-parallel stylolites typically represent the product of chemical compaction because of the overlying rocks load [42,46,50,51,52,53,54,55], whereas tectonic stylolites, which form perpendicularly to the main compressive stress axis, are predominantly vertical or sub-vertical [48].
The hydrocarbon industry has grown its interest in stylolites because of their anomalous porosity and permeability values compared to the host rock [42,50], which highly affect the hydrocarbons flow. In recent decades, they have been considered either as valid barriers, due to their insoluble clay residues and the surrounded reduced permeability [42,56,57], or as conduits where fluids can flow [22,42,58,59].
Therefore, the study of discontinuities in carbonate reservoirs (such as faults, fractures, veins, and stylolites) is a great challenge for the oil industry [60,61]. Fractures network, their geological history, and their diagenetic evolution are thus fundamental to characterize reservoirs and improve drilling operations and production management [13,16,62,63]. All these factors may change the pore space and fabric of the rock and control the petrophysical properties of carbonates and therefore reservoir quality [64,65].
Several works deal with this topic, but not many focus on micro-scale characterization of gas-producing rocks, now playing a pivotal role in the world energy scenario (e.g., in [29] and the references therein). The main aim of this study is therefore to explore rock fabric and tectonic and diagenetic structures at the multi-scale. Excellent carbonate rocks, that are gas-prone and contain oil, come from the Hyblean Plateau (southern Italy) and provide interesting examples.

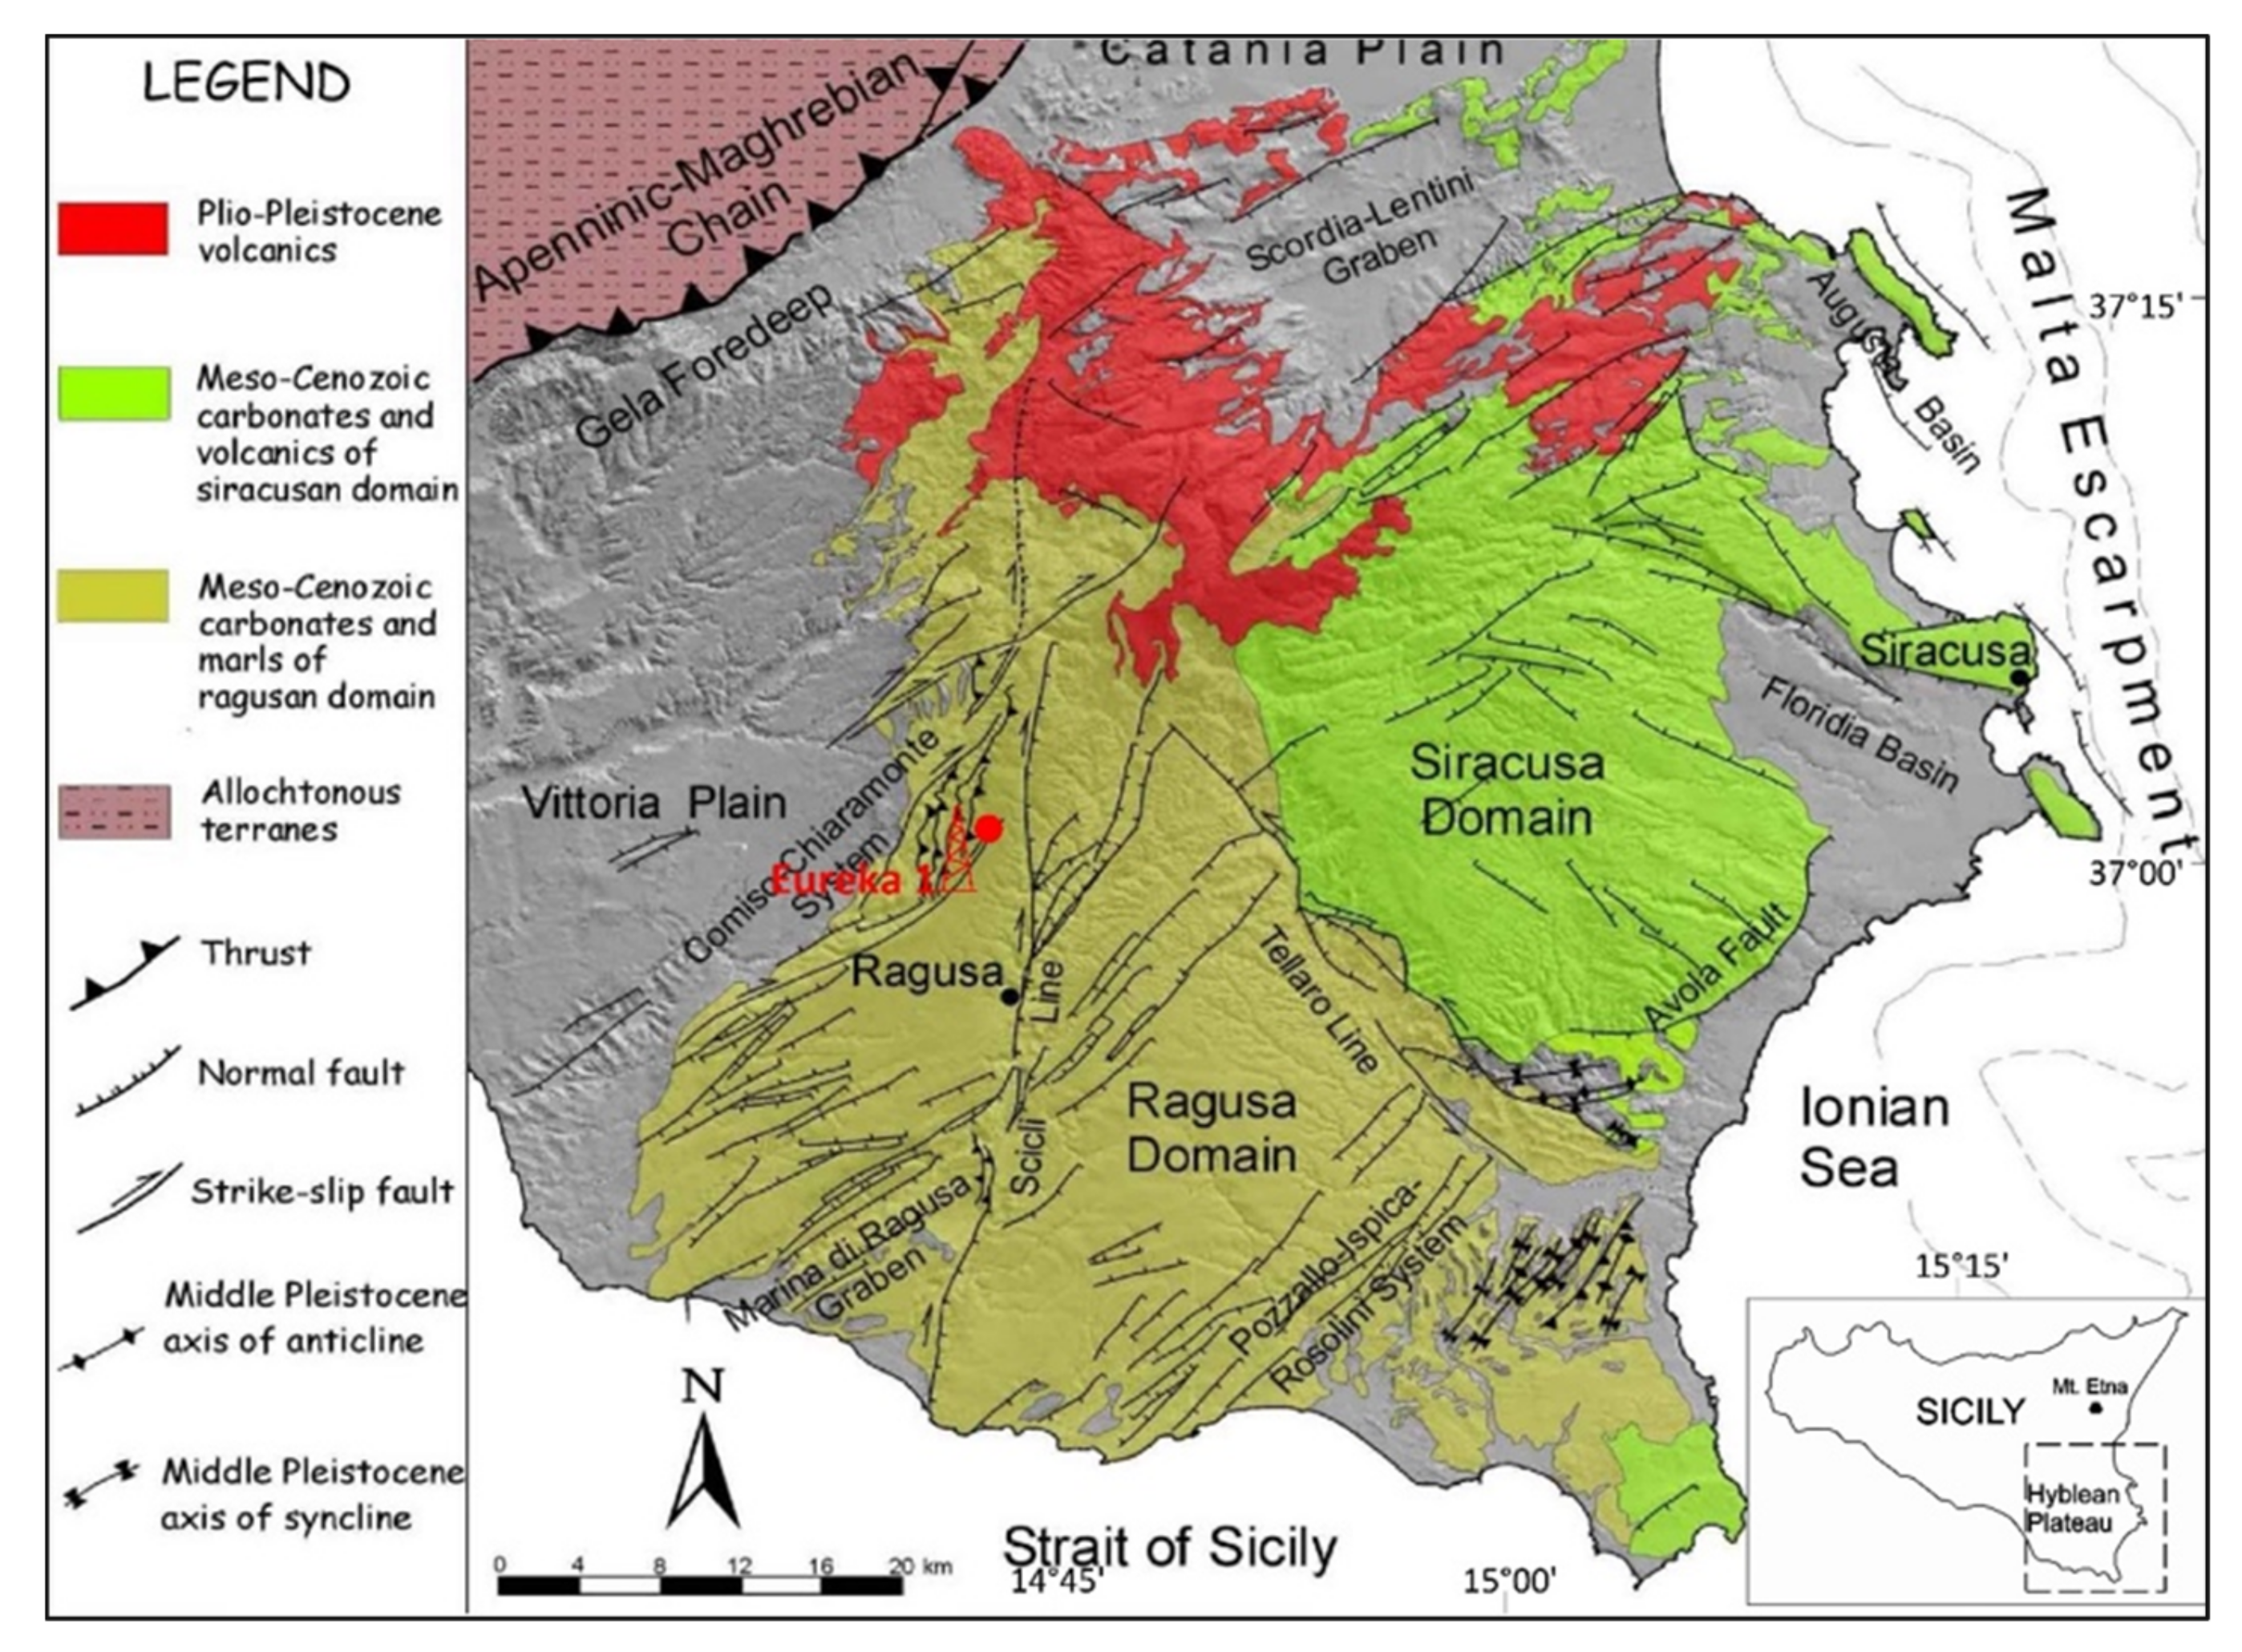
2. Geological and Tectonic Setting of the Hyblean Area

The Hyblean Plateau, in south-eastern Sicily, is the emerged portion of the foreland domain which, together with the allochthonous belt of the Appenninic-Maghrebian chain and the Gela Foredeep, represents one of the main structural domains that control the current orography of south-eastern Sicily (Figure 1) [66]. The Hyblean Plateau is a culmination of the Mesozoic-Cenozoic carbonate sedimentary successions of a larger crustal sector, known as Pelagian Block [66], representing the northernmost margin of the African Plate. Apart from Malta Island [67,68] and the Lampedusa-Lampione Islands [69,70], this plateau is the largest emerged portion of the Pelagian Shelf, which occupies the entire area of the Strait of Sicily.
Although the Hyblean Plateau is a foreland, it is strongly affected by faults. A main system of NE-SW-oriented normal faults with big offset cuts the flexured plateau towards the Gela Foredeep, partially occupied by the allochthonous units of the frontal wedge of the Appenninic-Maghrebian chain, called Gela Nappe [71] (Figure 1).
To the East, the plateau is bordered by the Malta Escarpment, which separates the Pelagian shelf from the abyssal Ionian plain. This crustal sector, during the Mesozoic, underwent a typical evolution of continental rifting, without registering significant crustal shortening during the Alpine compression [72]. From the Late Miocene to Quaternary, extensional oblique and dip-slip structures have been documented along the escarpment [5,73,74]. Additionally, a dextral strike-slip system, the Scicli Line, almost entirely cuts the plateau from north to south, inducing a limited offset of less than 3 km [75,76].
From Cretaceous times, the Hyblean Plateau can be divided into two distinct sectors (Figure 1): the eastern and the western domains, which, respectively, can be approximated with the administrative provinces of Syracuse and Ragusa. The eastern domain is characterized by a Cretaceous-Miocene succession of neritic deposits interbedded with volcanic deposits, while the western domain preserves deep-sea facies [71]. Considering the Mesozoic succession, drilling data show two adjacent domains: the basin and the platform, respectively, represented by the Ragusa and the Siracusa districts [72]. The Siracusa domain hosted a shallow water sedimentation throughout the Triassic-Jurassic interval, with an evolution from carbonate platform to a condensed succession of pelagic platform [71,72]. The Ragusa sector is characterized by carbonate platform deposits evolving into Jurassic basinal successions. A substantial change in paleogeography was linked to the growth of upper Cretaceous volcanic seamounts in the eastern sectors of the plateau including both parts of the ancient Ragusa and Siracusa domains. The growth of volcanoes determined the paleo-bathymetry of the overlying carbonate sequences. According to the existing literature, volcanism, which probably had a prominent role on organic matter maturation, started in Late Triassic in the Hyblean sector. During the Jurassic and the Cretaceous, volcanic activity occurred in the eastern part of the plateau and was probably related to extensional tectonics. Although no volcanic activity is documented in the time interval spanning between approximately 70 and 15 Ma, three major post-Cretaceous cycles have been recognized: (a) Upper Miocene, (b) Pliocene, and (c) late Pliocene–Pleistocene, the latter mainly produced subaerial lava flows [77,78]. The lowermost lithospheric sectors of the Hyblean Plateau have been reconstructed based on deep-seated xenoliths hosted in Miocene tuff breccias and Pleistocene lavas [79,80,81].
The subsidence tectonic history of the Hyblean plateau, as well as other domains in the central and eastern Mediterranean basins [82], may be summarized in four main phases:
(a)
Neotethyan rifting during Late Triassic-Early Jurassic age;
(b)
a slow thermal subsidence from Early Jurassic until Late Cretaceous time, leading to the formation of widespread Mesozoic carbonate platforms;
(c)
compressional phase during Late Cretaceous-Palaeogene time, which resulted in the formation of fold systems;
(d)
uplift and subsidence events during the middle Tertiary, as the result of the continued collision of the European-African plates. After the Early Pleistocene an uplift occurred in the northern Hyblean plateau following the Upper Miocene-Lower Pleistocene massive volcanic activity. This uplift is probably associated with the latest stages of thrusting along the frontal part of the Maghrebian thrust belt.
Figure 1. Geological-structural map of the Hyblean Plateau area modified after the works in [83,84] and location of the Eureka 1 well (red dot).
Geosciences 12 00149 g001

3. Carbonate Reservoirs in the Hyblean Plateau

In Sicily, hydrocarbons have been known for centuries thanks to some superficial manifestations as bitumen-impregnated limestones, highly easy to work, thus employed for constructions in south-eastern Sicily [5,85,86]. Many important hydrocarbon fields in Sicily are stored in structural traps in the Hyblean Plateau subsurface [5].
The subsurface of the Hyblean area has been extensively explored for hydrocarbon research, and numerous wells have gone through complete successions spanning in time from the Miocene to the Late Triassic [72]. The first discovered oil well was Ragusa-1, in 1953, producing a Mesozoic reservoir. Other subsequent wells, from Cenozoic and Mesozoic reservoirs, were Gela, in 1956; Cammarata-Pozzillo in 1959; and the first offshore Gela-21, in 1959. In total, about 350 wells were drilled, of which 21 offshore [5], and just c.170, between oil and gas, are still productive (from UNMIG data).
In the Hyblean Plateau, two lithostratigraphic units, different in age and depositional significance [72], have been distinguished: the lower “Noto Formation” and the upper “Streppenosa Formation”, both recently ascribed to the Rhaetian based on palynofacies association [87]. The Noto Fm. is made of various types of dolomites and dolomitic limestones, deposited in an intertidal organic-rich environment [72,88,89], and is the main reservoir rock for oil [88,90,91,92]. It was initially considered to be part of the Streppenosa Fm. Auct. [72]. The latter is a sequence of upper Triassic-Lower Jurassic basinal organic-rich black shales, deposited adjacent to a Triassic carbonate-dolomite platform, and considered the source rock and seal of the petroleum system.
The Noto Fm. is characterized by two facies: one present in the Hyblean Plateau, composed of laminated black shales, laminated limestones, often recrystallized and with algal mats, recrystallized mudstones and wackestones, and dolomitic breccias; the other found only at the edges of the plateau, composed of packstones, grainstones and wackestones with oolites, and infrequent laminated black shales [72,88]. This formation was deposited during a phase of continental rifting, which affected the carbonate shelf during the opening of the Alpine Tethys [92,93]. The Streppenosa Fm. (meant here as the upper part of the old Streppenosa Fm. Auct.) is also characterized by two facies that have the same areal distribution as the ones of Noto Fm. The first facies is mainly represented by compact and laminated silty clays, mudstones, packstones, and turbiditic wackestones, while the second one is marked by packstones and wackestones (often pyritized, with fragments of fossils, gastropods, and lithic fragments), silt, mudstones with gastropods, and more rarely black shales [72,88].
The latter is considered the source rock of the hydrocarbons of the Hyblean area, but also represents the cap rock of the oil fields of Ragusa and Gela [71]. Its eastwards thinning, until its definitive disappearance, could explain the absence of traps and, therefore, the mineralization in the Siracusa area [71,93]. According to [94,95], hydrocarbon formation could have been favored by circulating hydrothermal fluids in the Hyblean serpentinized peridotite basement.
The boundary between the two formations is diachronous: during the Rhaetian, the deposition of the Streppenosa Fm. had already begun in the deepest part of the basin, while the Noto Fm. continued to accumulate at the edge of the basin [88,96]. The thickness of the Noto Fm. is fairly constant and does not exceed 300 m, while the thickness of the Streppenosa Fm. is extremely variable, especially in the south-eastern part of the basin, where it reaches more than 3000 m in thickness [92].

4. Materials and Methods

We analyzed 165 m of cores intercepted by the Eureka 1 well, located north of Ragusa town, at 37°00′40.050″ N 02°15′55.481″ E geographical coordinates. The multidisciplinary and multiscale approach started with a sedimentological and structural survey carried out on Noto and Streppenosa Fms. from the cored interval between 1992 and 2157 m.

4.1. Mesoscopic and Microscopic Description of Cores

The cores were first described macroscopically (with naked eye and lens). Subsequently, 22 thin sections collected at different depth from representative cores of Streppenosa and Noto Fms. have been obtained from University of Milan and Catania thin section lab and analyzed using a petrographic microscope Zeiss Axiolab at the University of Catania. All thin sections have been half stained with alizarin red to reveal the presence of dolomite. The main macroscopically recognized facies have been later subjected to an accurate petrographic analysis. Dunham classification [97] was used for the identification of textures at the meso-scale. Cores description comprised the following information: sedimentary texture and structures, microstructures, lithology, and color.
The results from direct observations of cores and thin sections, corroborated by data extrapolated from geophysical logs, were used to carry out a detailed description of the rocks and to draw up stratigraphic columns of the interval intercepted by coring.

4.2. Petrophysical and 3D Image Investigation

Direct seismic measurements were carried out on selected cores. On oven-dried specimens, an ultrasonic wave velocity test was carried out at laboratory standard conditions according to the ASTM designation (D2845-00). The device used for measurements of transit time (μs) is the A500UM device MAE, with transducers operating at 55 kHz and an accuracy of ±0.3 μs.
The 3D study of the samples was performed by high-resolution SR-CT in phase-contrast mode at the SYRMEP beamline of the Elettra synchrotron laboratory (Trieste, Italy).
Samples with a parallelepiped shape and size of 4 × 4 × 10 mm3 were illuminated by a polychromatic X-ray beam in transmission geometry. The contribution of low energies in the beam spectrum was suppressed by applying 1 mm Si + 1 mm Al filters. Sample-to-detector distance was set at 200 mm and experiments were done collecting 1800 projections over a total scan angle of 180° with an exposure time of 2 s per projection. The employed detector was a 16 bit, air-cooled, sCMOS camera (Hamamatsu C11440 22C, Hamamatsu, Japan) with a 2048 × 2048 pixel chip and an effective pixel size = 0.9 × 0.9 µm2, yielding a maximum field of view of 3.39 mm2. Scans were acquired in local area mode [98] as the lateral size of the samples was larger than the field of view of the detector. The 2D tomographic slices were reconstructed using the Syrmep Tomo Project (STP) house software suite [99], applying a single-distance phase-retrieval algorithm [100] based on the transport of intensity equation (TIE) to the sample projections to improve the consistency of the morphological analysis. To extract the different phases composing the samples, 3D Volumes of Interest (VOIs) were segmented by manual thresholding using the Fiji freeware software [101], which was employed to quantify the voids/fractures and the impregnation abundance (vol.%) from each sample. Quantitative analysis on the extracted pore and pore + impregnation phases was performed using Pore3D software library [102]. Three-dimensional renderings were obtained by VGStudio Max 2.2 software [103,104].

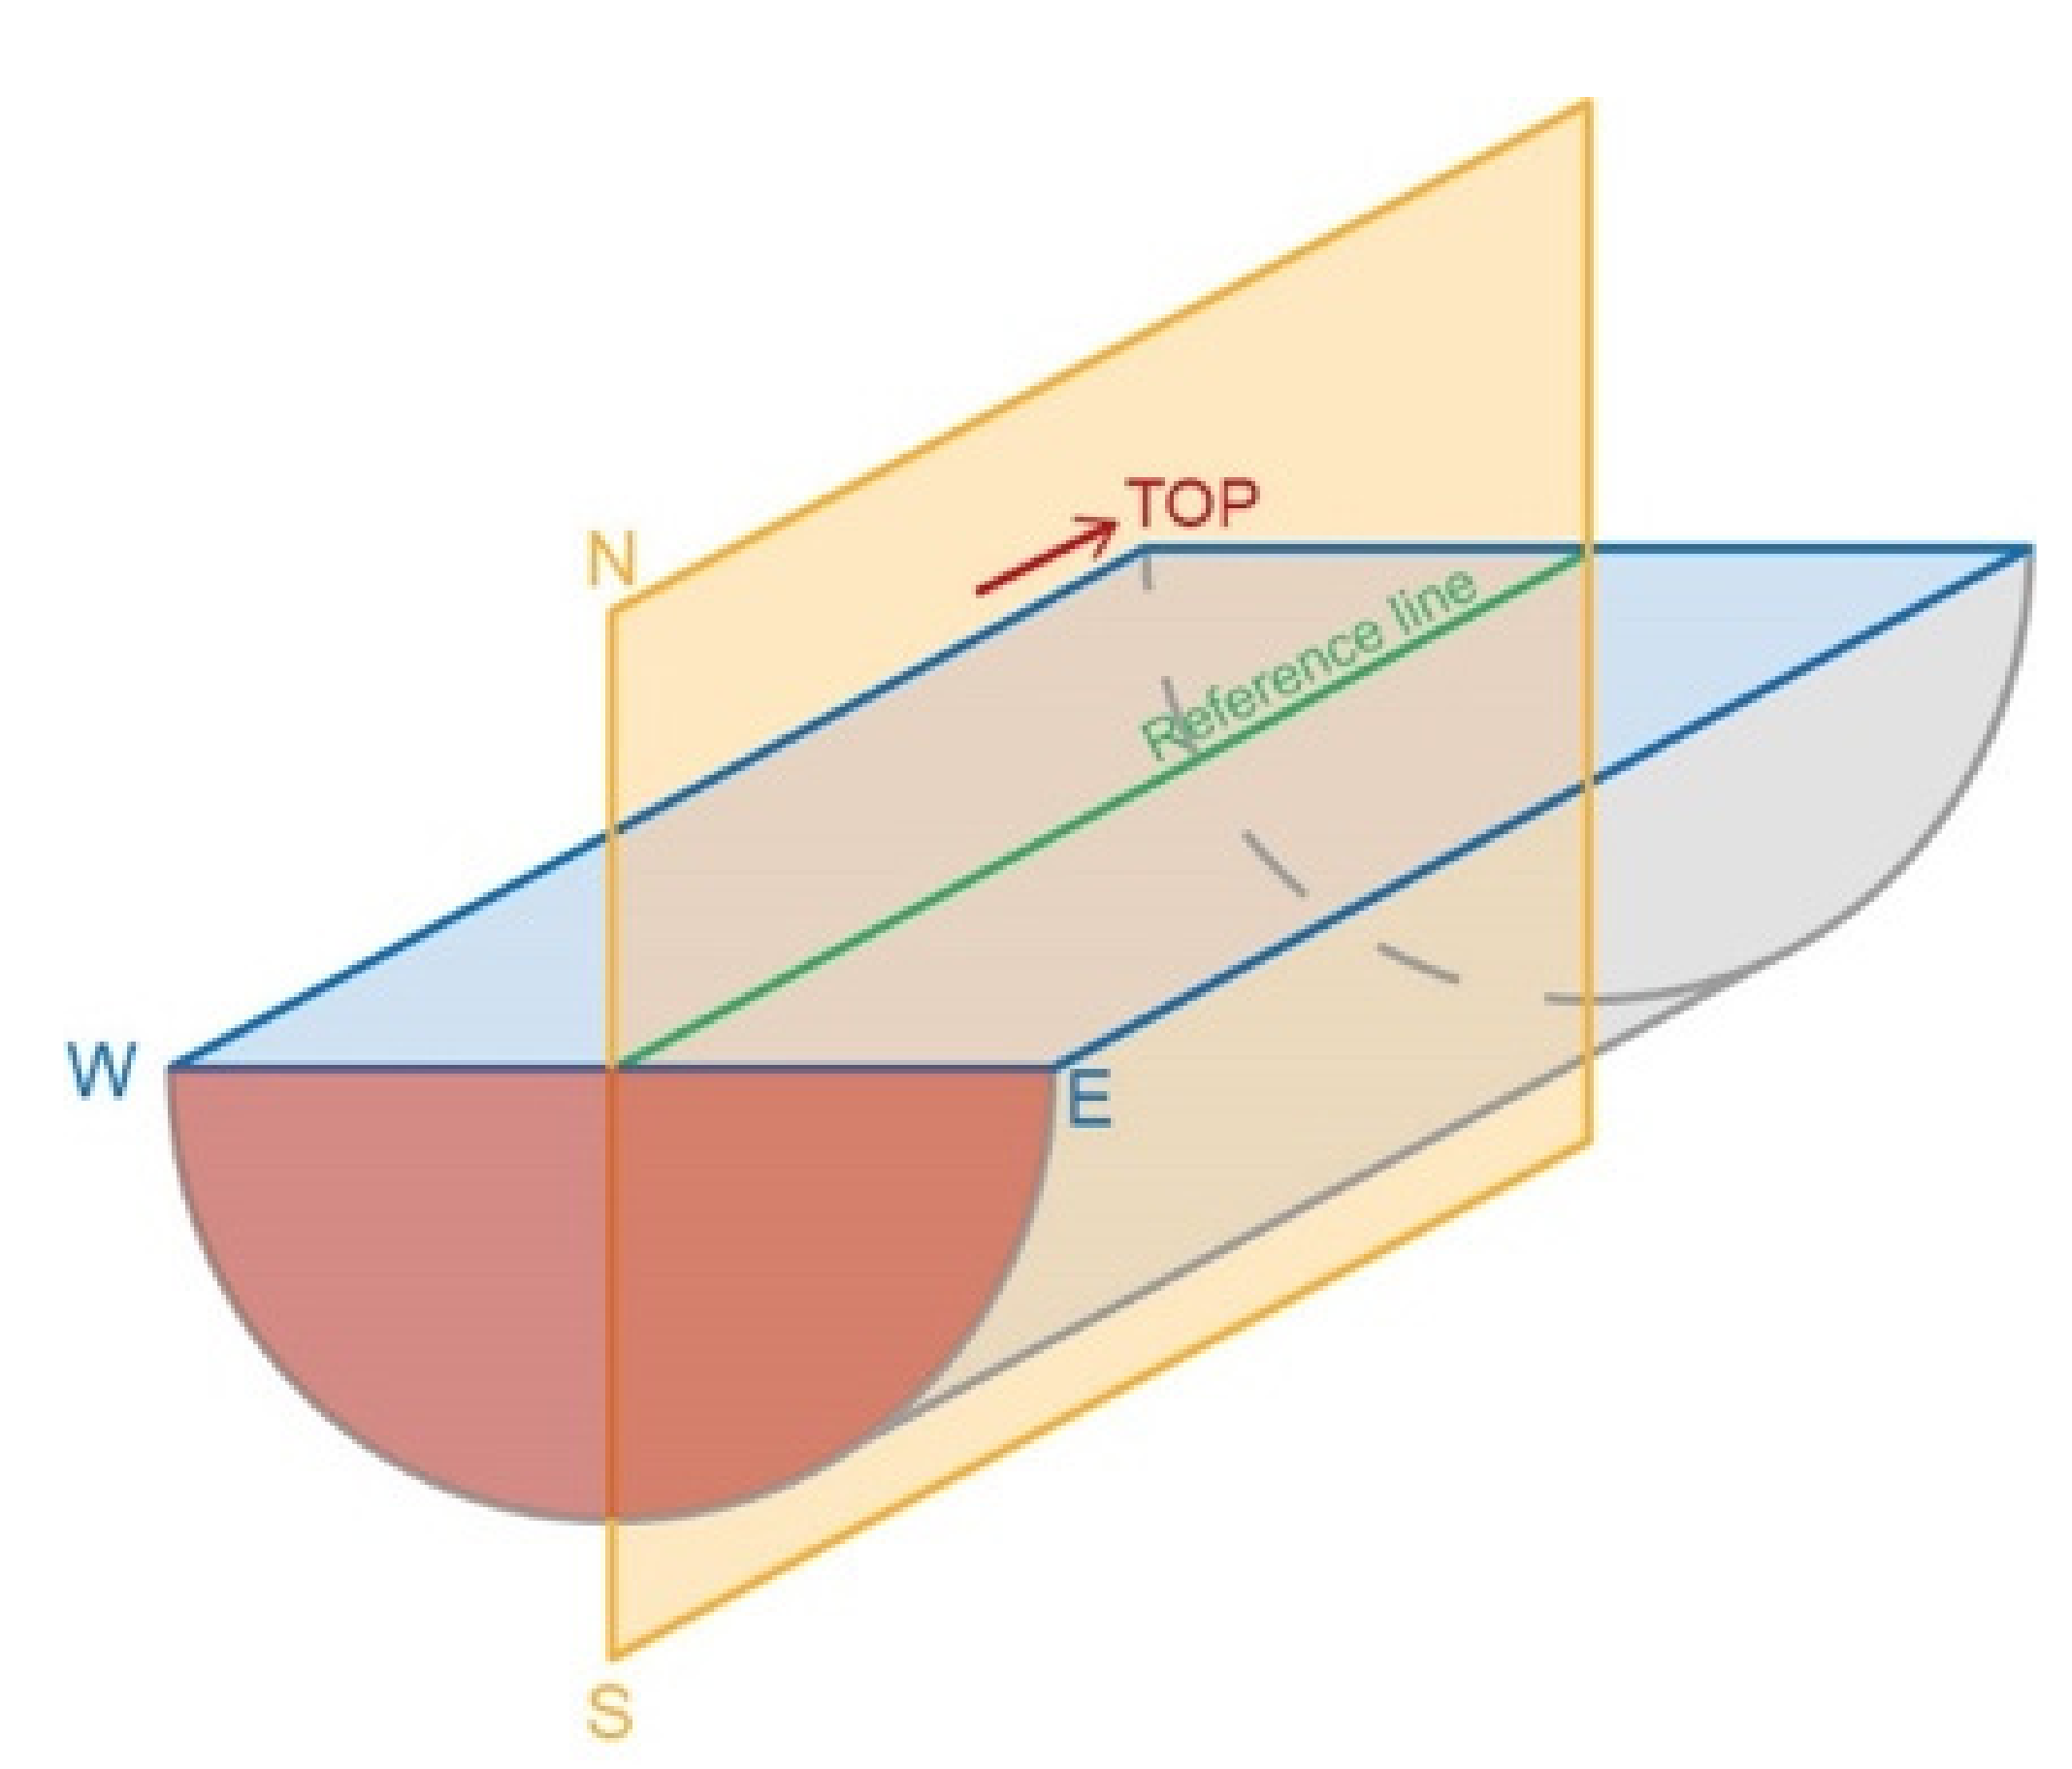
4.3. Microstructural Survey and Reference System of Cores

The data related to sedimentary, tectonic, and diagenetic structures were obtained from direct observation of the cores. Analyses were carried out on the archive-half core, while samples were taken for analyses from the working half.
A line marked along the main axis of each core was used as a reference for the orientation of measurements (Figure 2). Since the cores were not oriented, a reference system was established for the measurements as illustrated in the schematic Figure 2. On the plane orthogonal to the axis of the drilling (vertical plane of light gray color in Figure 2, therefore the plane sub-parallel to the ground level at the well) an angular reference from 0° to 360° as the direction from a “pseudo-north” was considered. Therefore, the cut surface of the half-core constitutes the “east–west” plane (blue in Figure 2), while the plane orthogonal to the latter and containing the reference line is the “north-south” plane (in orange in Figure 2). Then the apparent dip angles of the structures on the cut surface of the half-core were measured, i.e., on the named “east–west” plane. The analysis of the fractures was carried out in selected intervals of the Noto and Streppenosa Fms. crossed by the Eureka 1 well between 2014 and 2149 meters under the ground level. The well is vertical for all its length (Figure 3). A spreadsheet of all measurable parameters (bedding, fractures length, aperture, filling, frequency, and orientation) was created (Supplementary Materials). The measurement methodology takes inspiration from the work in [32], but changing the measurement of the second apparent dip angle: instead of measuring it in a surface parallel to the N-S plane [32], obtained by further cutting the half-core, in this work, when possible, we used as a reference surface the horizontal plane, i.e., the semicircle (red in Figure 2) delimited upwards by the W-E plane, of the several pieces of core. In such way, all clearly visible structures were measured.
The measurement of two different apparent dip angles related to the same plane led to calculate the real orientation of discontinuities (e.g., fractures, joints, and stylolites) planes (and related poles), referred to the reference system described above, through Stereonet software [105]. Then, calculated data from Stereonet were reported on Dips software [106] to generate a rose diagram to represent the dip directions of the various structures, while histograms were used to indicate the frequency of the various dip angles and the number of fractures per linear meter. Other data frequency of the length of the fractures, opening, etc.) were reported in histograms (see Section 5.4).
Fracture density per linear meter and cumulative length of the fractures per meter, measured in this work were correlated with well logs.

4.4. Well Logging Analysis

In this work, we used the available well logging datasets, gently provided by Maurel et Prom, to estimate and compare the petrophysical characteristics obtained with different methodologies and at different scales (micro-CT, P-wave velocity on core specimens).
The analysis of the available well-logging dataset has been aimed at estimating the main petrophysical features and, especially, to draw the porosity variation with depth, and relate it to the above-mentioned tectonic or diagenetic features within selected intervals of the Noto and Streppenosa Fms.
The spontaneous potential (SP), gamma ray (GR), density (D), porosity (P), and sonic (S) logs are the main inputs in this analysis. A velocity log (Vp) was added as a “log derived” from the Sonic log, to compare it with the Vp values measured in laboratory on about 20 samples along the entire section studied. In fact, the sonic value—called interval transit time (Δt)—was used to calculate the Velocity per meter, as reciprocal of Δt. Considering that 1 microsecond µs = 1 × 10⁻⁶, the necessary conversions have been made to extract the metric velocity, thus
Vp = 1/(Δt × 10−6)
Furthermore, the number of fractures (per meter) and cumulative length of fractures (per meter) provide further constraints to improve the precision and accuracy of the petro-structural characterization of the section studied. To highlight the correspondence of this petro-physical variability with the main significant lithological variations, the volumetric ratio between shale and limestone (per meter) was calculated applying Steiber’s 1970 empirical equation [107]:
V shale = I GR 3 2 × I GR
I GR = GR log GR min GR max GR min
where GRlog is the gamma-ray reading of a given point, and GRmin and GRmax are the minimum and maximum gamma-ray values in the measured interval.

5. Results

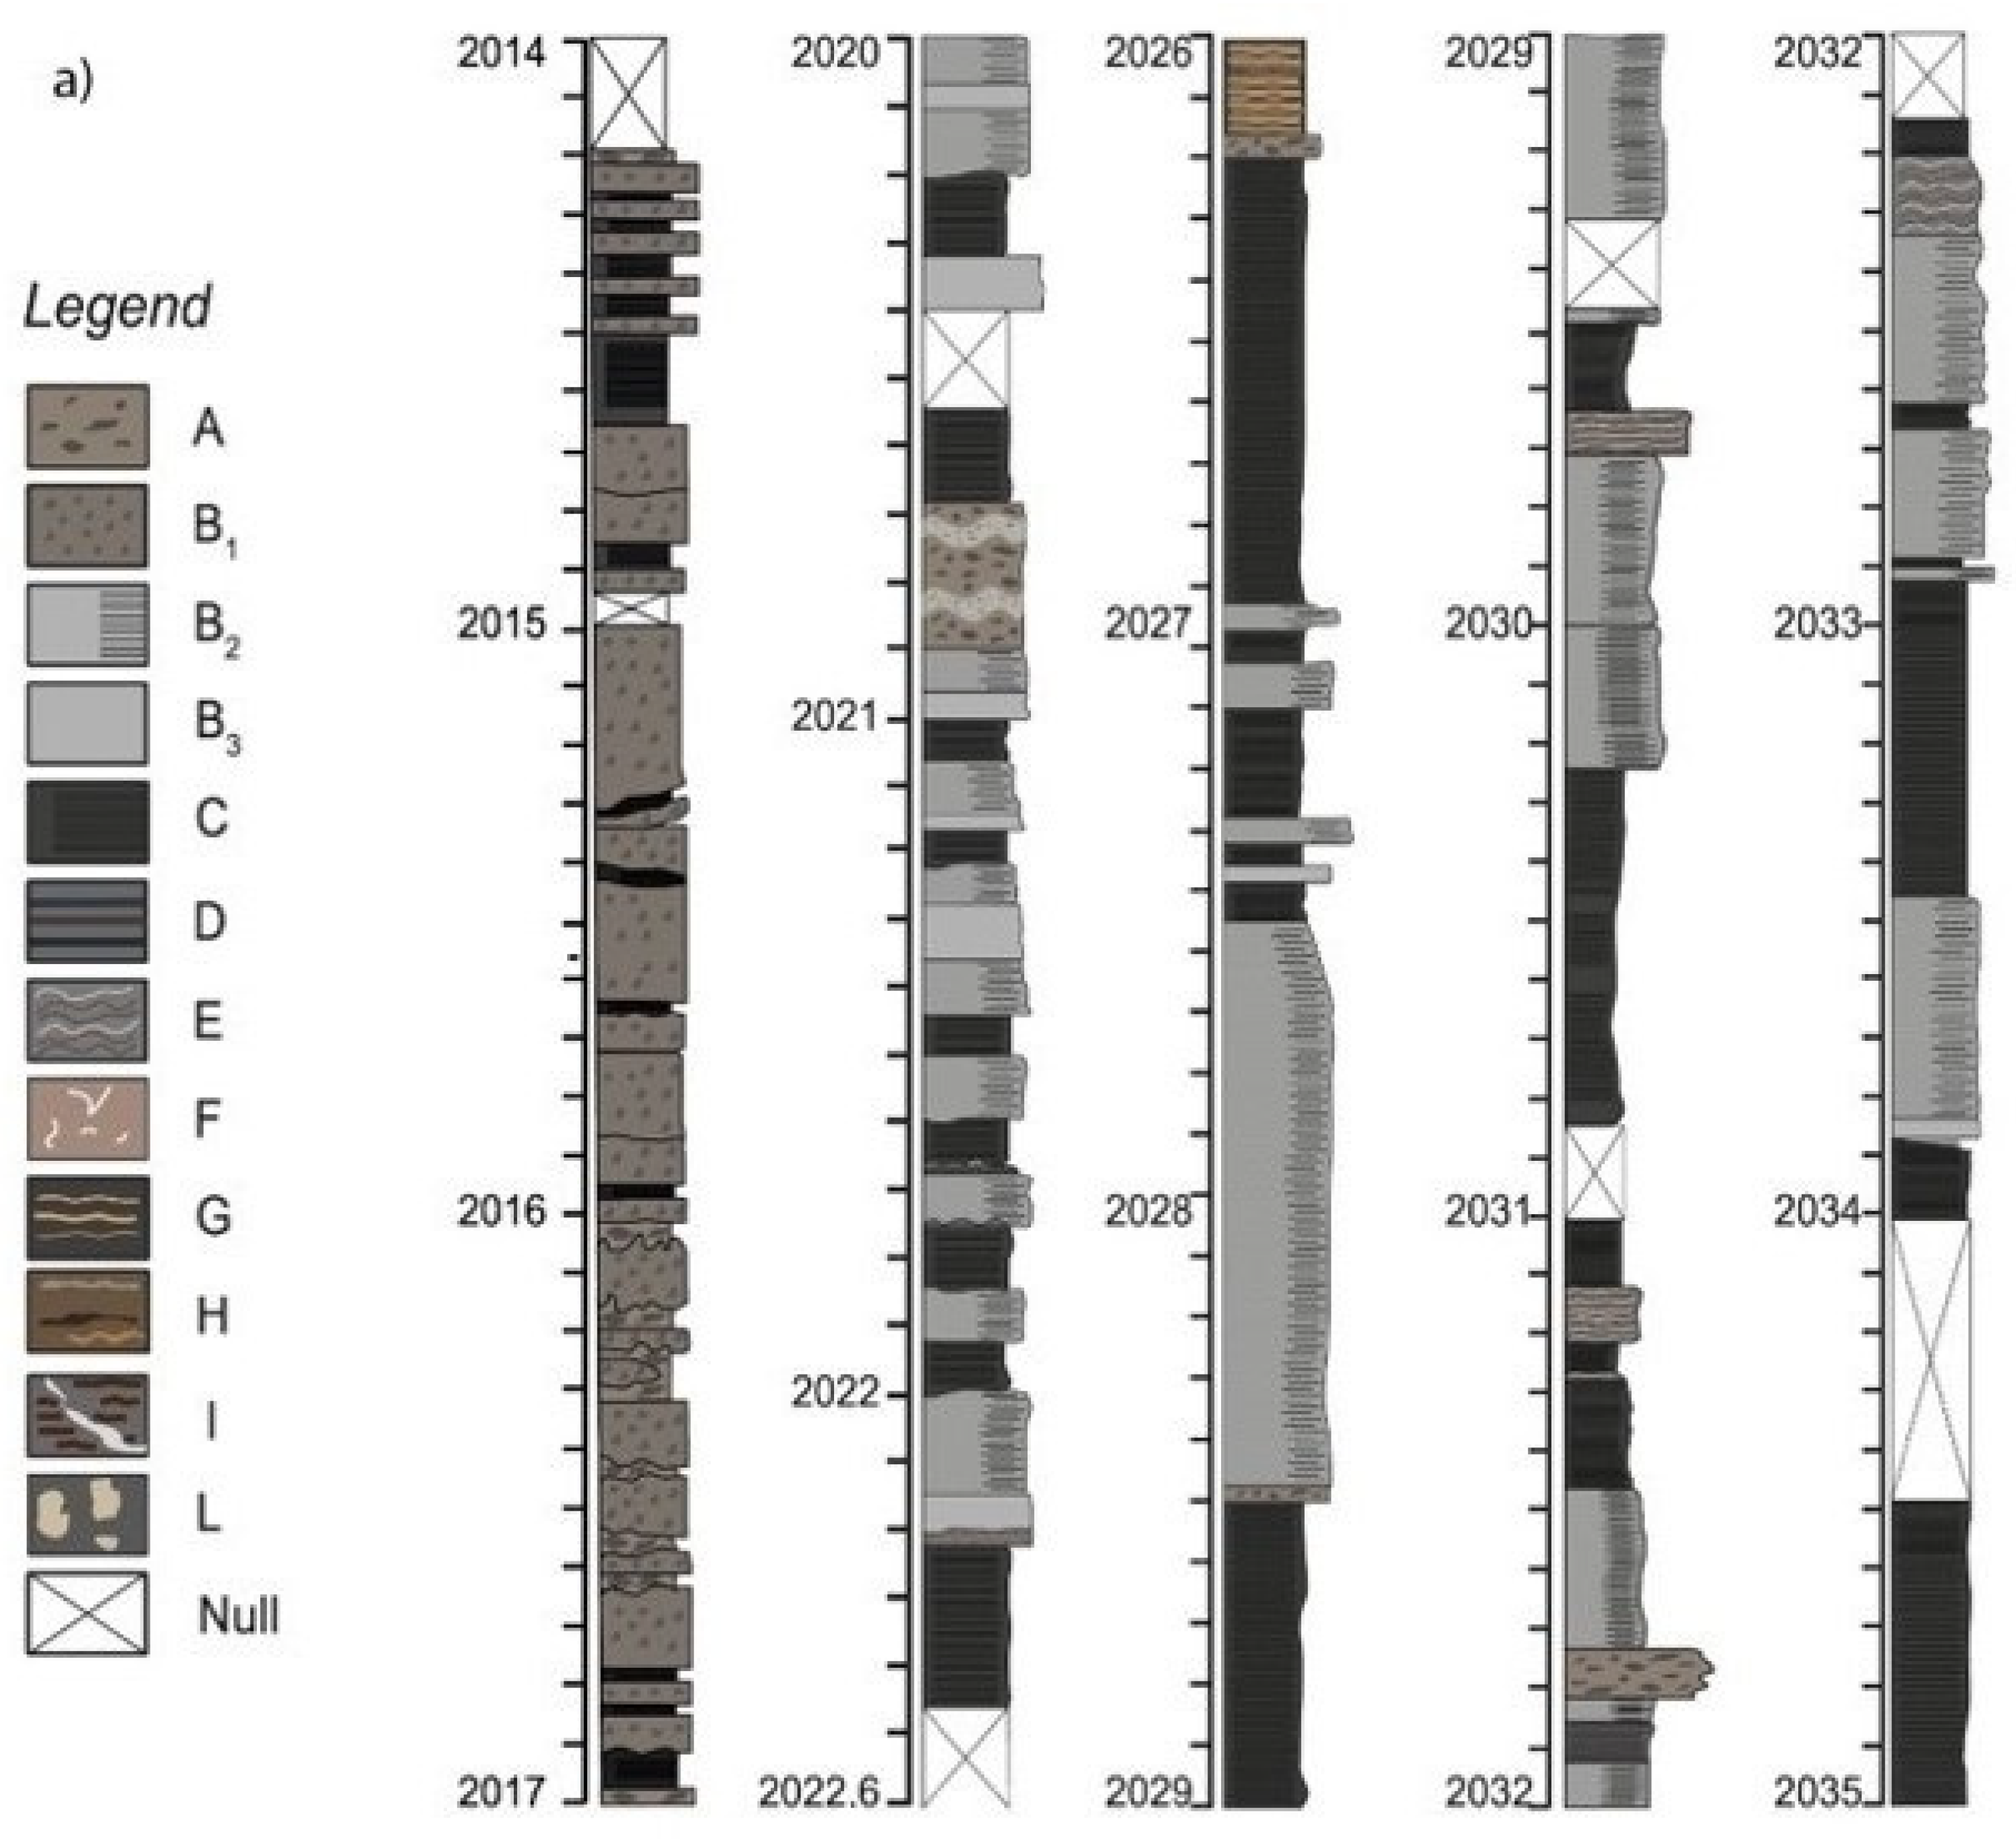
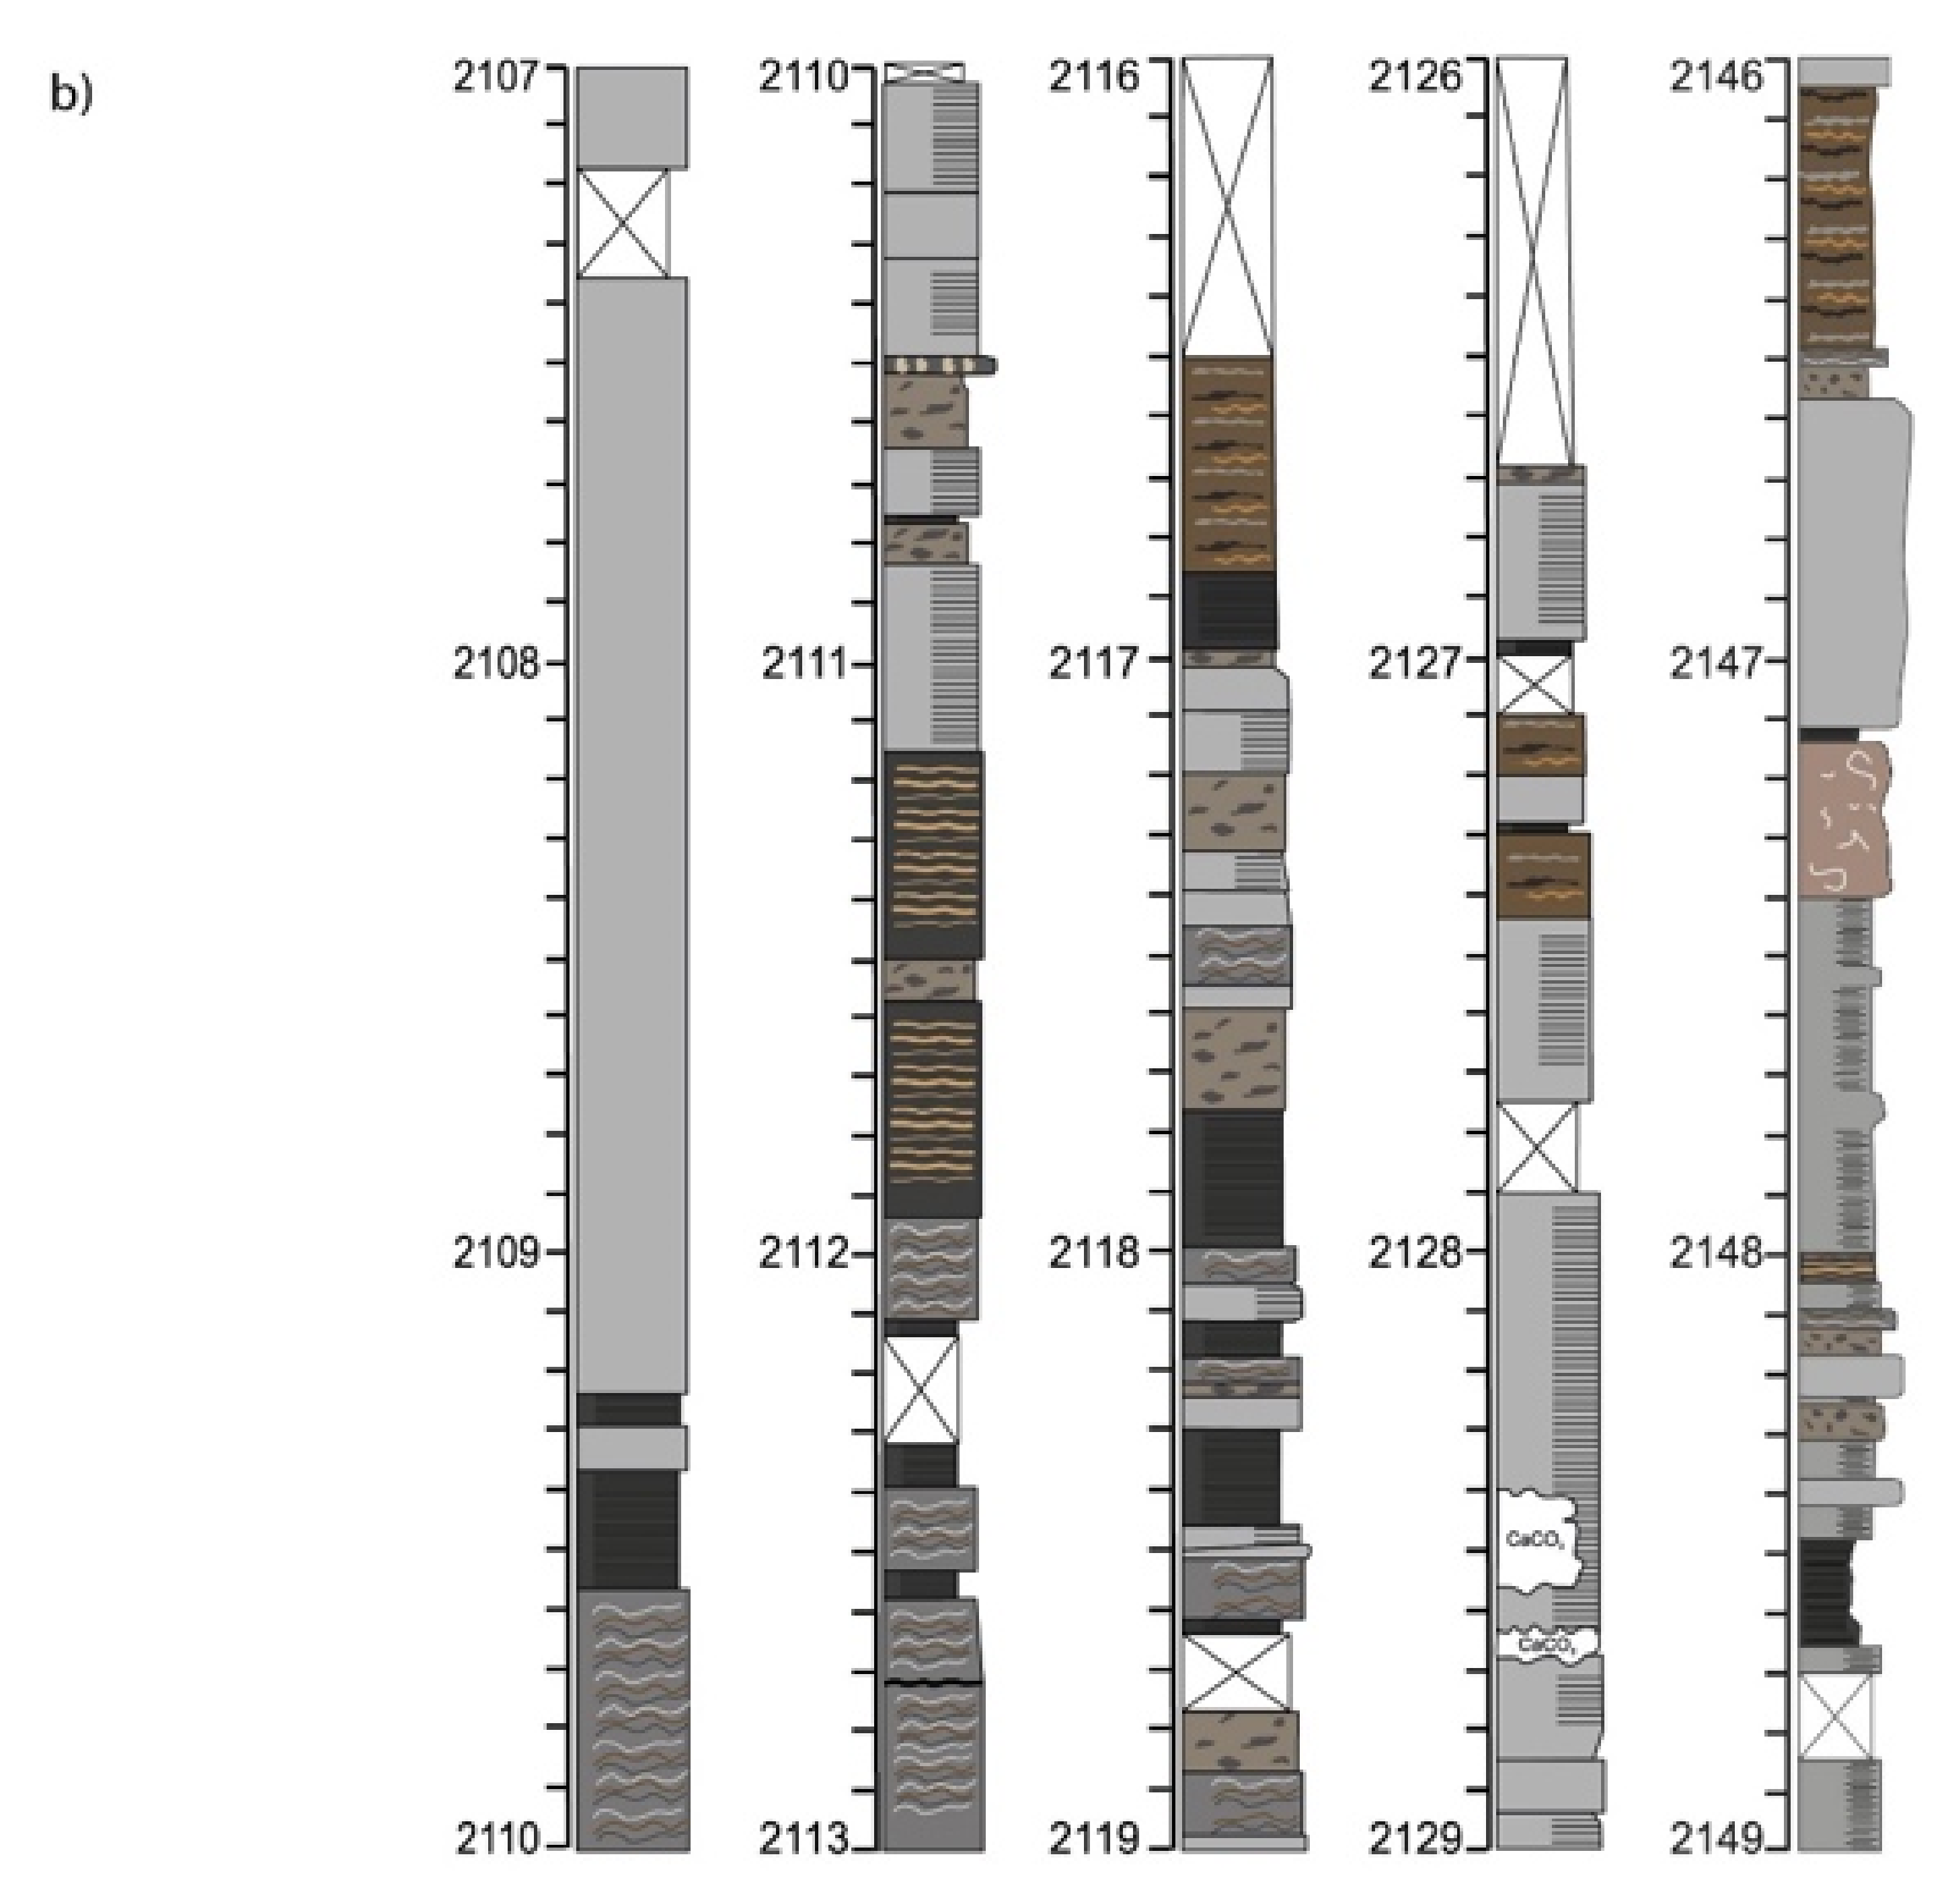
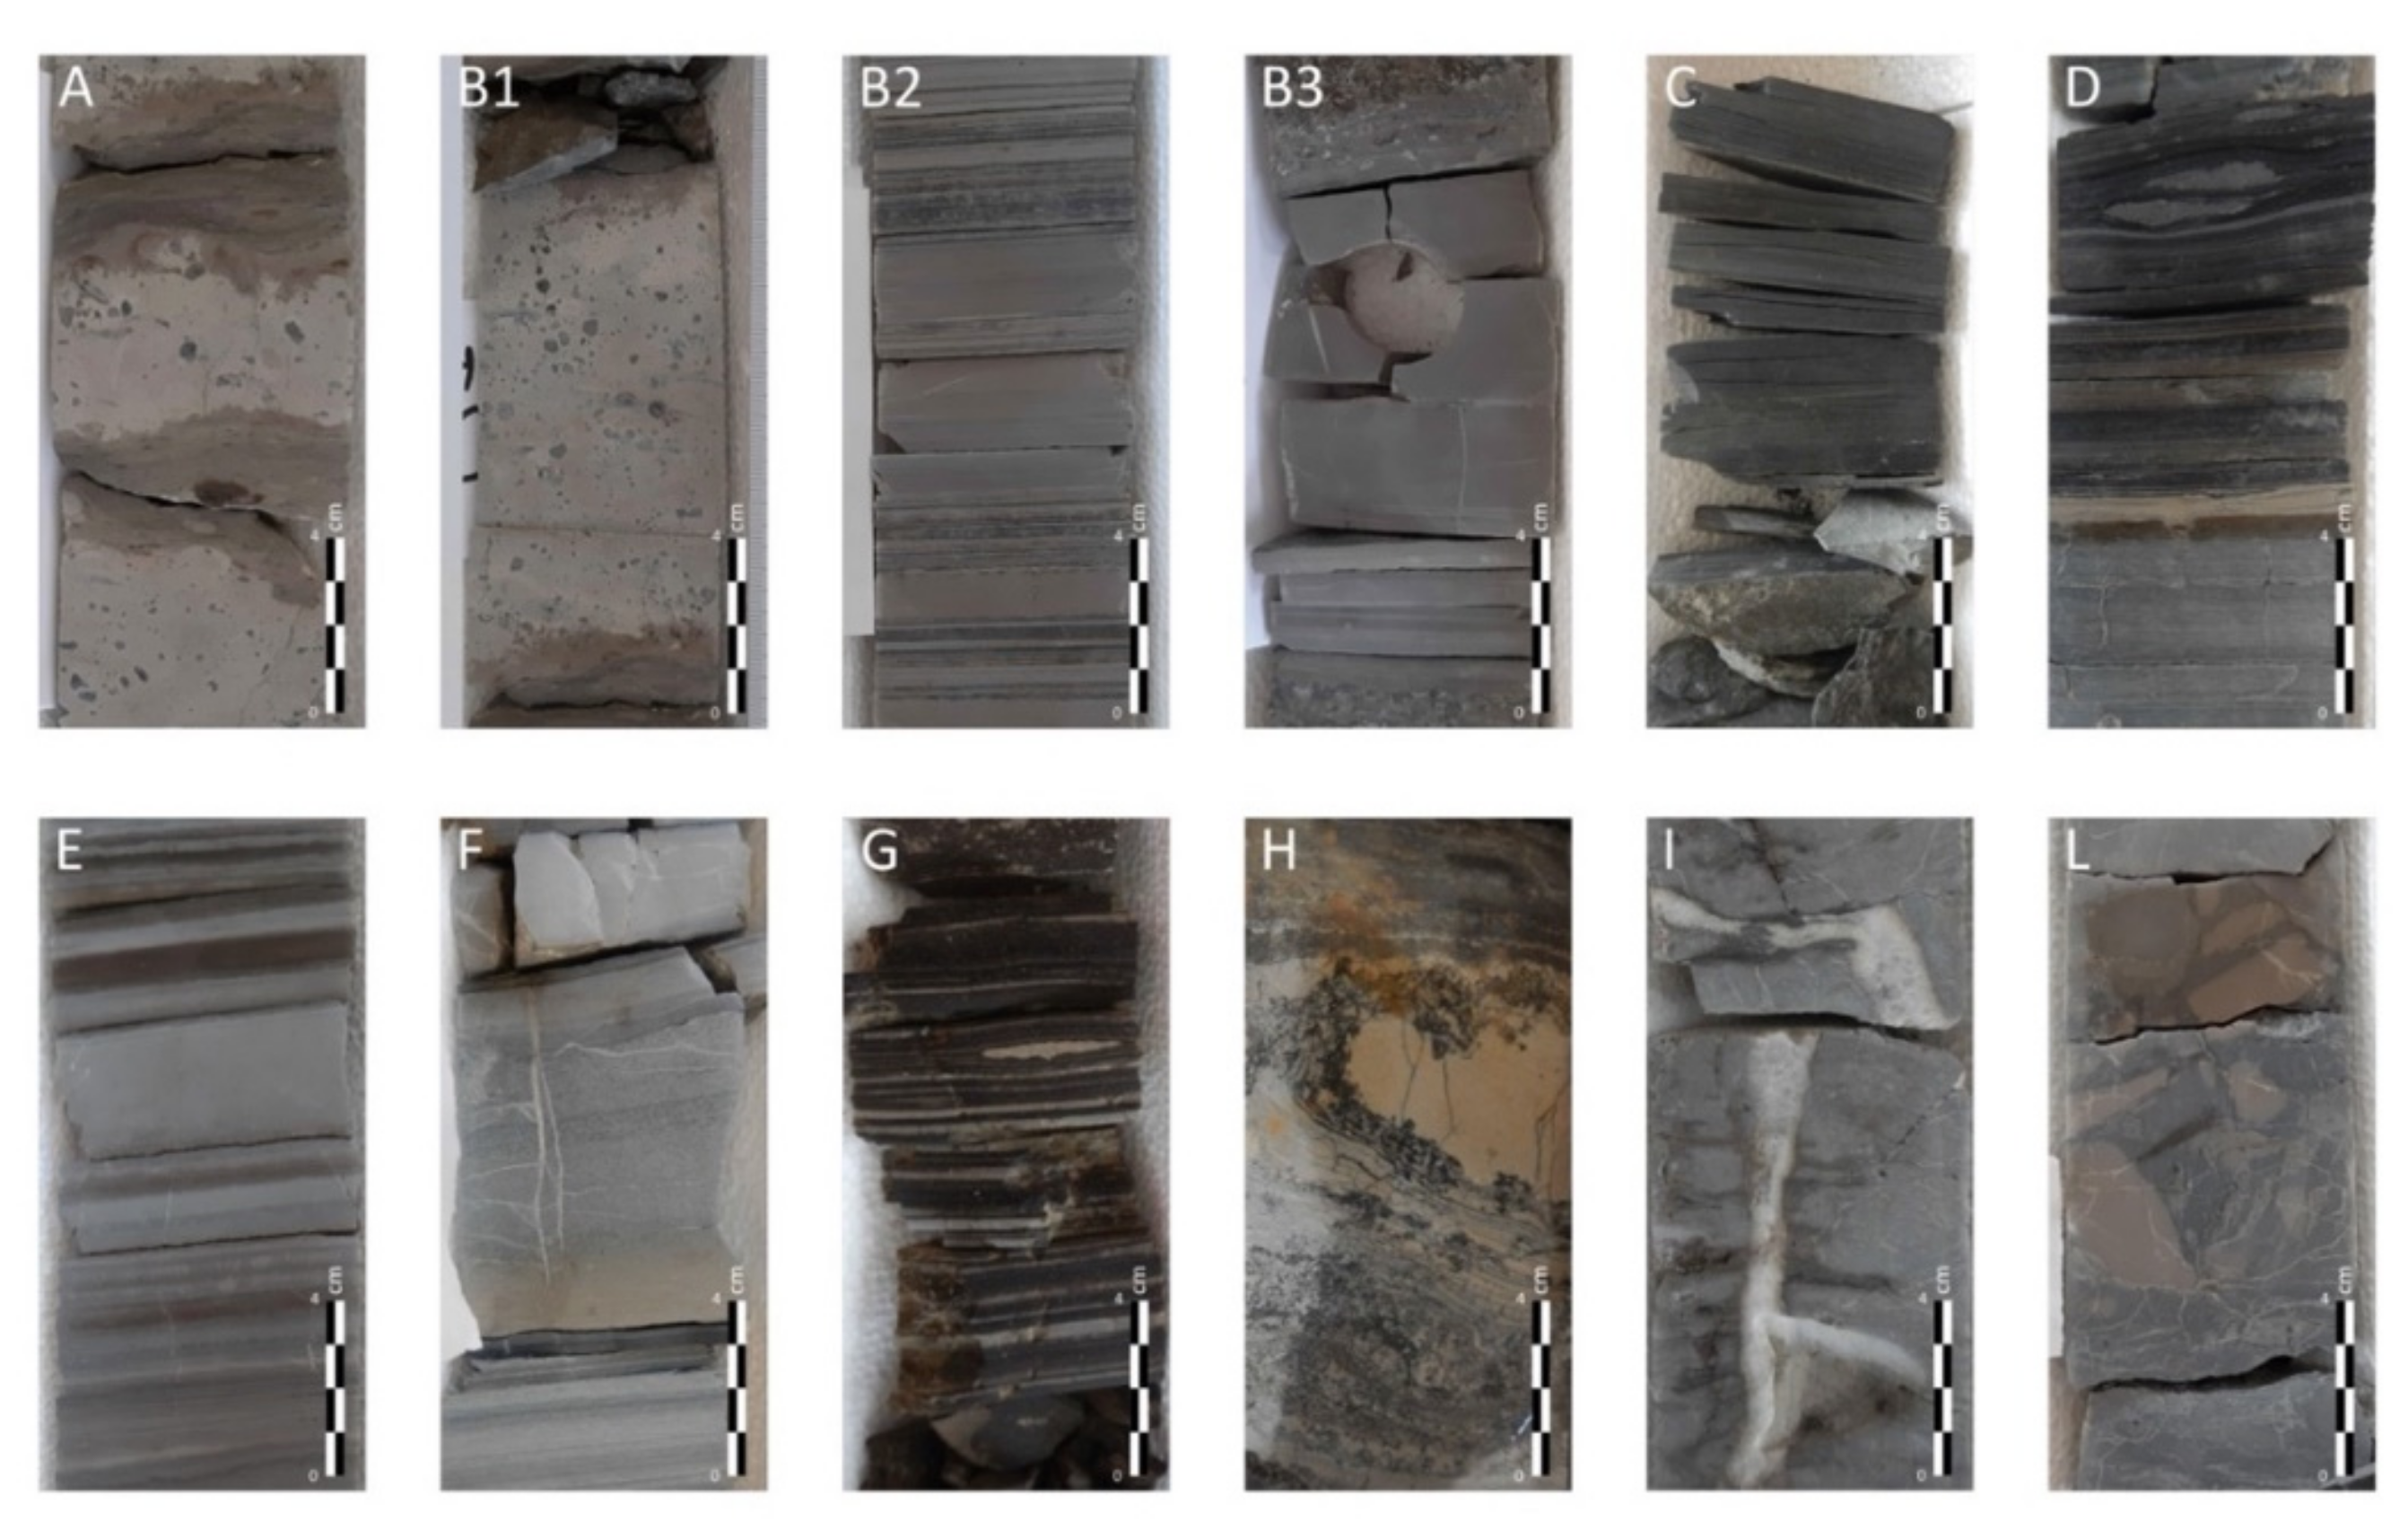
5.1. Description of Facies

Eureka 1 well crossed the Streppenosa Fm. from 1992 to 2035 m below the ground level (thickness 43 m) and Noto Fm. from 2035 to 2157 m (thickness 123 m), although drilling did not reach the base of Noto Fm. The cored interval of the Streppenosa Fm. consists mainly of an alternation of black shales (facies C), laminated limestones (facies B2), wackestones with gastropods (facies B1), and laminated wackestones (facies A, Figure 3).
Conversely, Noto Fm. shows a higher facies variability: it is made of laminated limestones and massive limestones (facies B3), stromatolites (facies G), black shales (facies C), algal laminated limestones (facies E), microbialites (facies B2–D), and grainstones (Facies F). Facies are reported in detail on cores photographs (Figure 4) and on Table 1 for depositional environment interpretation.
In detail, macroscopic observations of the cores permitted distinguishing the following different facies from Streppenosa and Noto Fms. (Figure 4 and Table 1):
Facies A, typical of Streppenosa Fm., consists of beige claystones, with disk-shaped bioclasts up to 5 mm in diameter. Upper and lower boundaries are irregular and locally with flame structures. Facies A passes up and downwards to Facies B1, made of light-gray limestones (wackestones-mudstones) with scattered sub-angular intraclasts (average diameter: 1 cm; maximum diameter: 5 cm) and fossils’ fragments (mainly mollusk, dwarfed gastropods). Facies B2, typical of both formations, is made of light-gray, finely laminated limestones (wackestones-mudstones). Lamina-set are mainly plane-parallel and occasionally inclined to form cross-stratifications. Facies B3, typical of Noto Fm., are light-gray, structureless limestones (wackestones-mudstones). Facies C, common in both formations, are dark gray-black laminated mudstones. Lamina-set are locally undulated with flame structures. Facies D–I are common in Noto Fm. Facies D is given by convoluted beige siltstones in beds up to 2 cm thick. Facies E consists of brownish, undulated algal-mat laminae. In some samples, it is possible to see big (up to 1–1.5 cm) crystals deforming the laminae. Facies F is represented by grainstones. Facies G is made of microbial-algal mats with planar lamina sets. In some samples it is also possible to observe calcite crystals (probably evaporite pseudomorphs) interspersed with the laminae and swallow-tail gypsum crystals. Facies H consists of convoluted algal laminae. Pervasive voids are filled with calcite and large carbonatic clasts up to 5 cm in diameter are present. Facies I is represented by limestones (wackestones-mudstones) with rare convoluted algal laminae. Facies L is a matrix-supported breccia, with sub-angular clasts ranging for 1 to 5 cm in diameter, floating in carbonate mudstones.

5.2. Facies Interpretation

The described facies point out a shallow water intertidal carbonate environment rich in algal mats and stromatolites, subjected to tidal currents (Table 1). The presence of gypsum swallow tail crystals (Figure 5e), in association with algal and microbial mats, probably indicate a supratidal-intertidal lagoon sabkha environment, like modern supratidal–intertidal sabkha of the Al-Kharrar area, Red Sea Coast, Saudi Arabia [108]. In modern tidal flats pools and lagoons, microbial mats usually flourish next to sabkha evaporites. Evaporite minerals may thus precipitate through displacive, inclusive, and replacive growth within mud and microbial/algal mats.

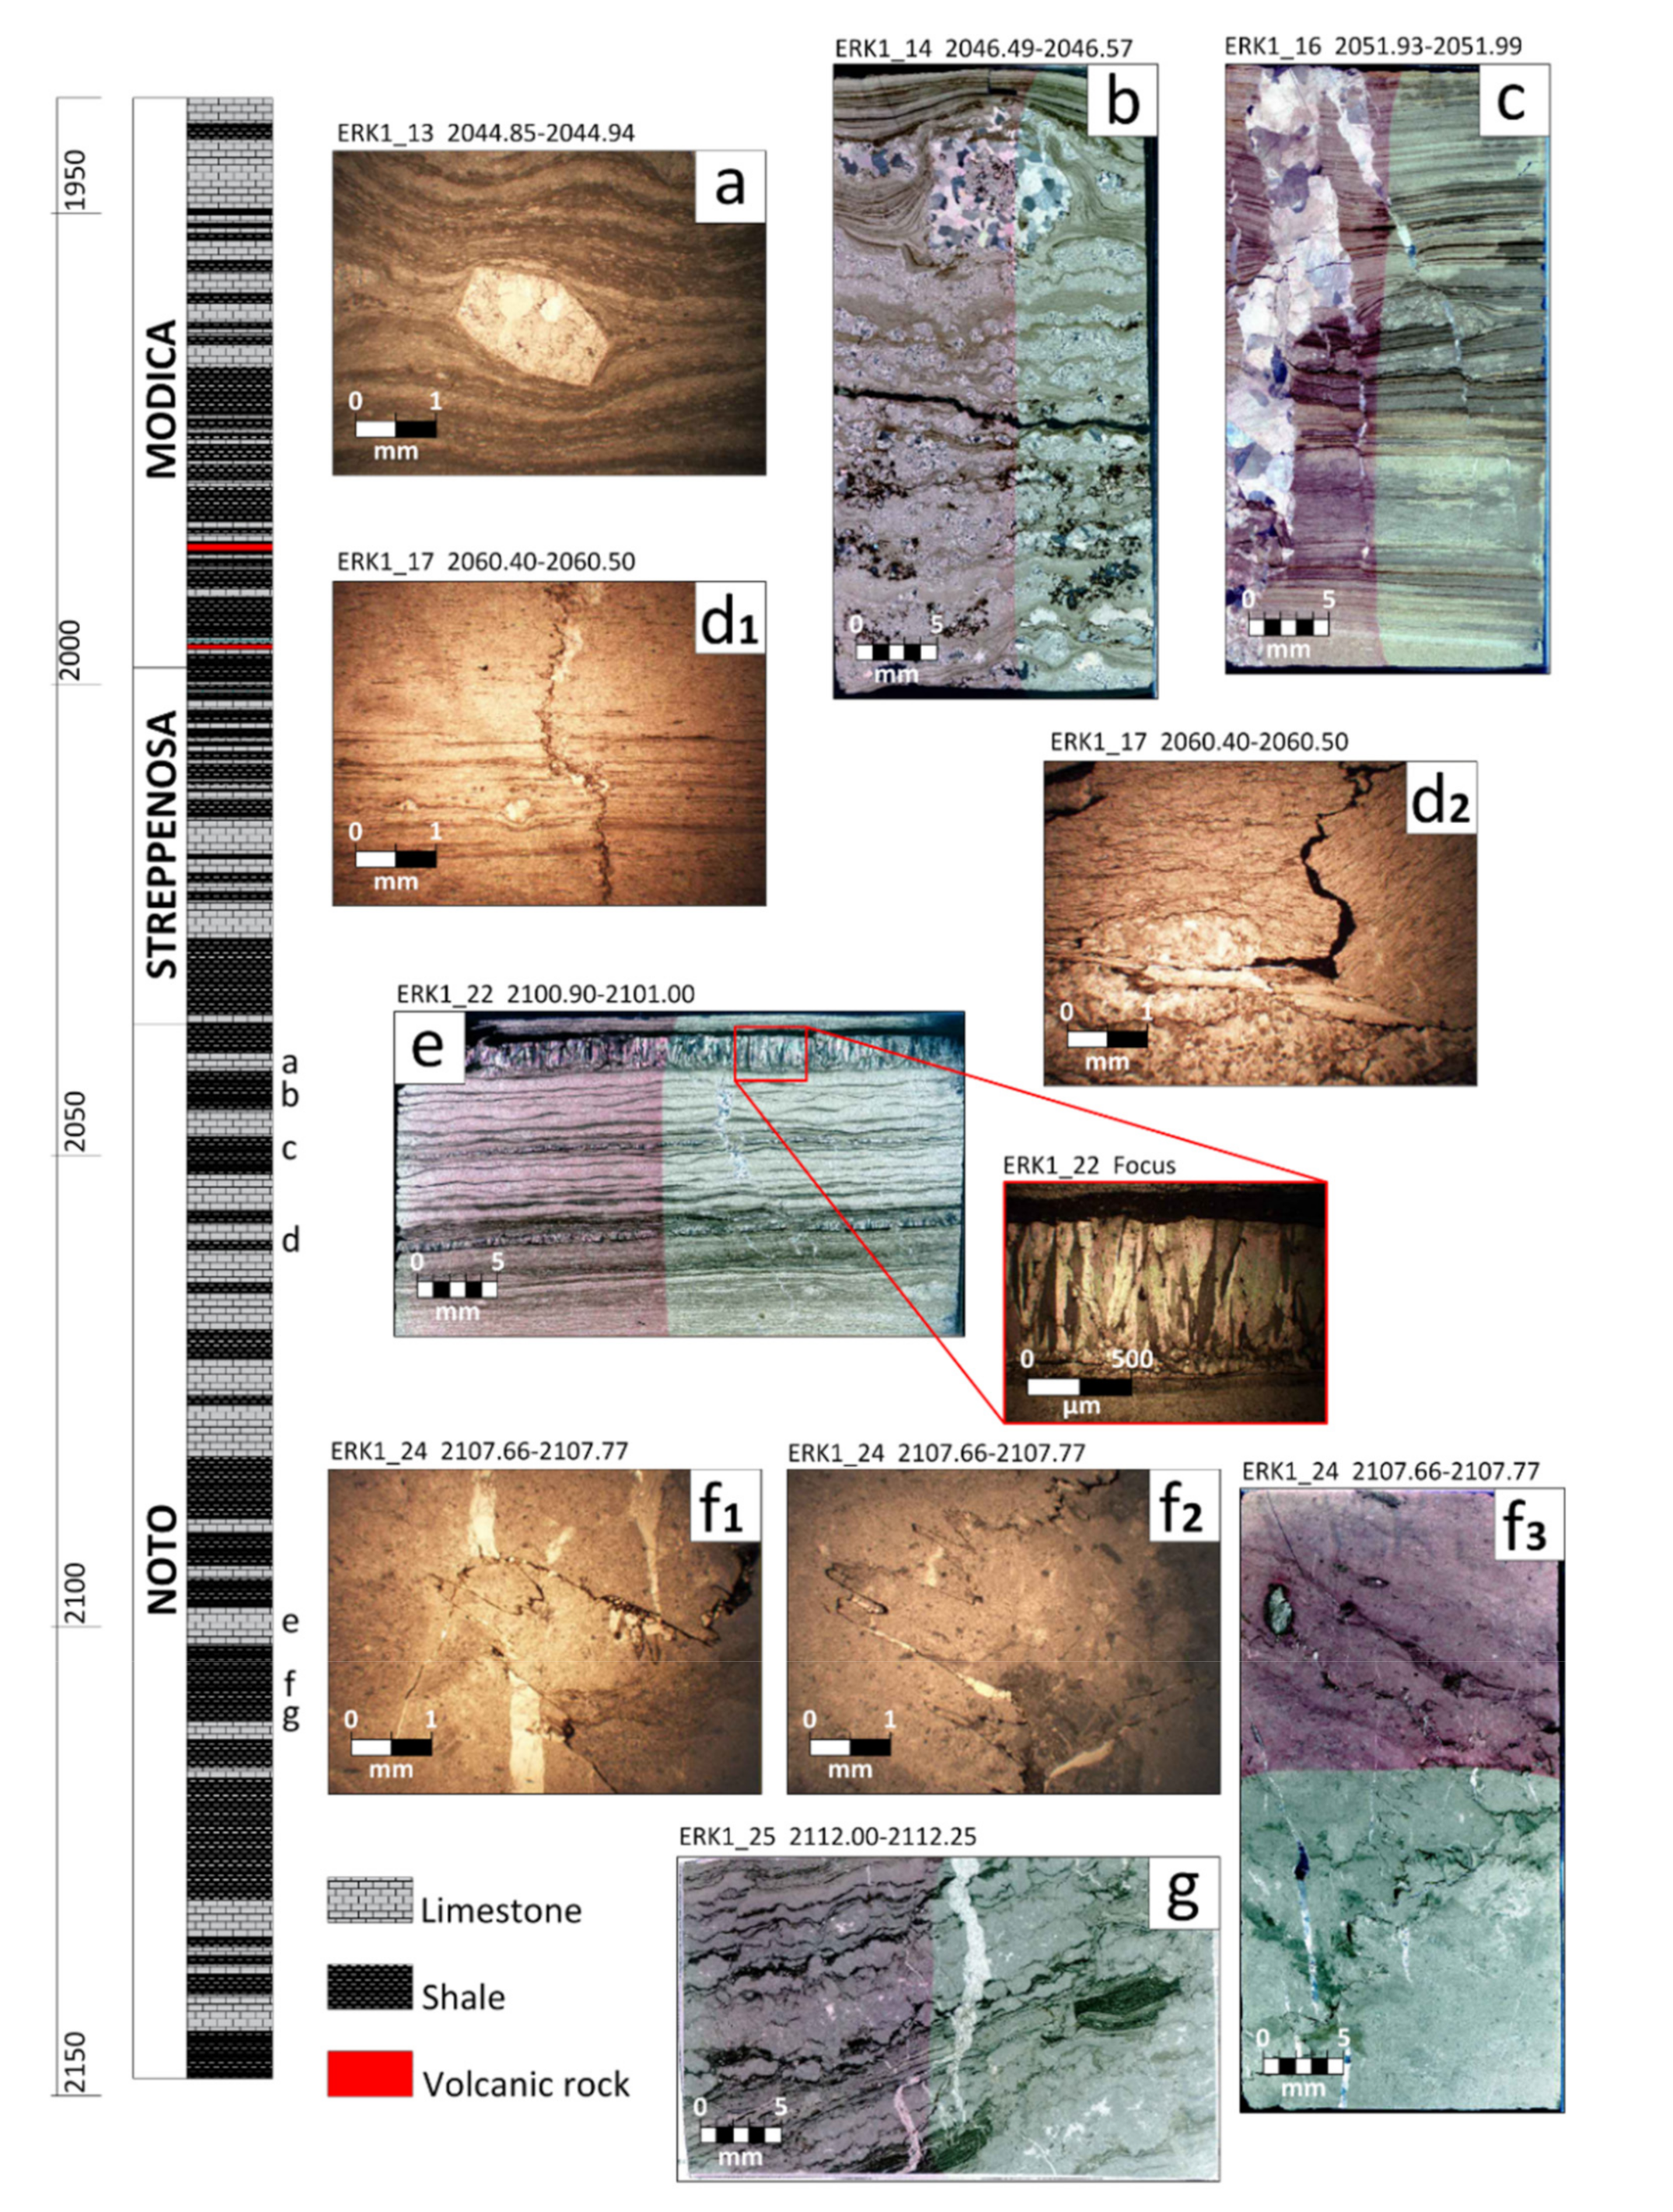
5.3. Thin Section Analysis

5.3.1. Microstructure

The facies description from thin sections has revealed similar findings of the works in [88,92]. In particular, the main facies are characterized by beds of massive gray to light brown carbonates (mudstones or wackestones) alternated with dark to black marls or shales; laminites are represented by decimetric beds of purely carbonate laminites (light brown) alternating with dark brown laminites, rich in organic matter (Figure 4 and Figure 5). Carbonate facies include some syn-sedimentary breccias. The carbonate laminites are characterized by regular alternating light (sparitic) and dark (micritic) laminae and by the presence of probable cellular alignments (Figure 5d, Sample ERK1-17). A second type of carbonate laminites are algal mats with the occurrence of swallow-tail gypsum (Figure 5e, Sample ERK1_22), but also pseudomorphosed evaporite crystals (probably gypsum), which are replaced by polycrystalline calcite (Figure 5a, Sample ERK1-13). Sulfate crystals are supposed to grow within the soft sediment being indicative of prolonged emergence in a lagoonal/shallow water environment. These microbial laminites and algal mats interbedded with evaporites confirm the interpretation, obtained by core sedimentological description, of a supratidal-intertidal sabkha environment [108].

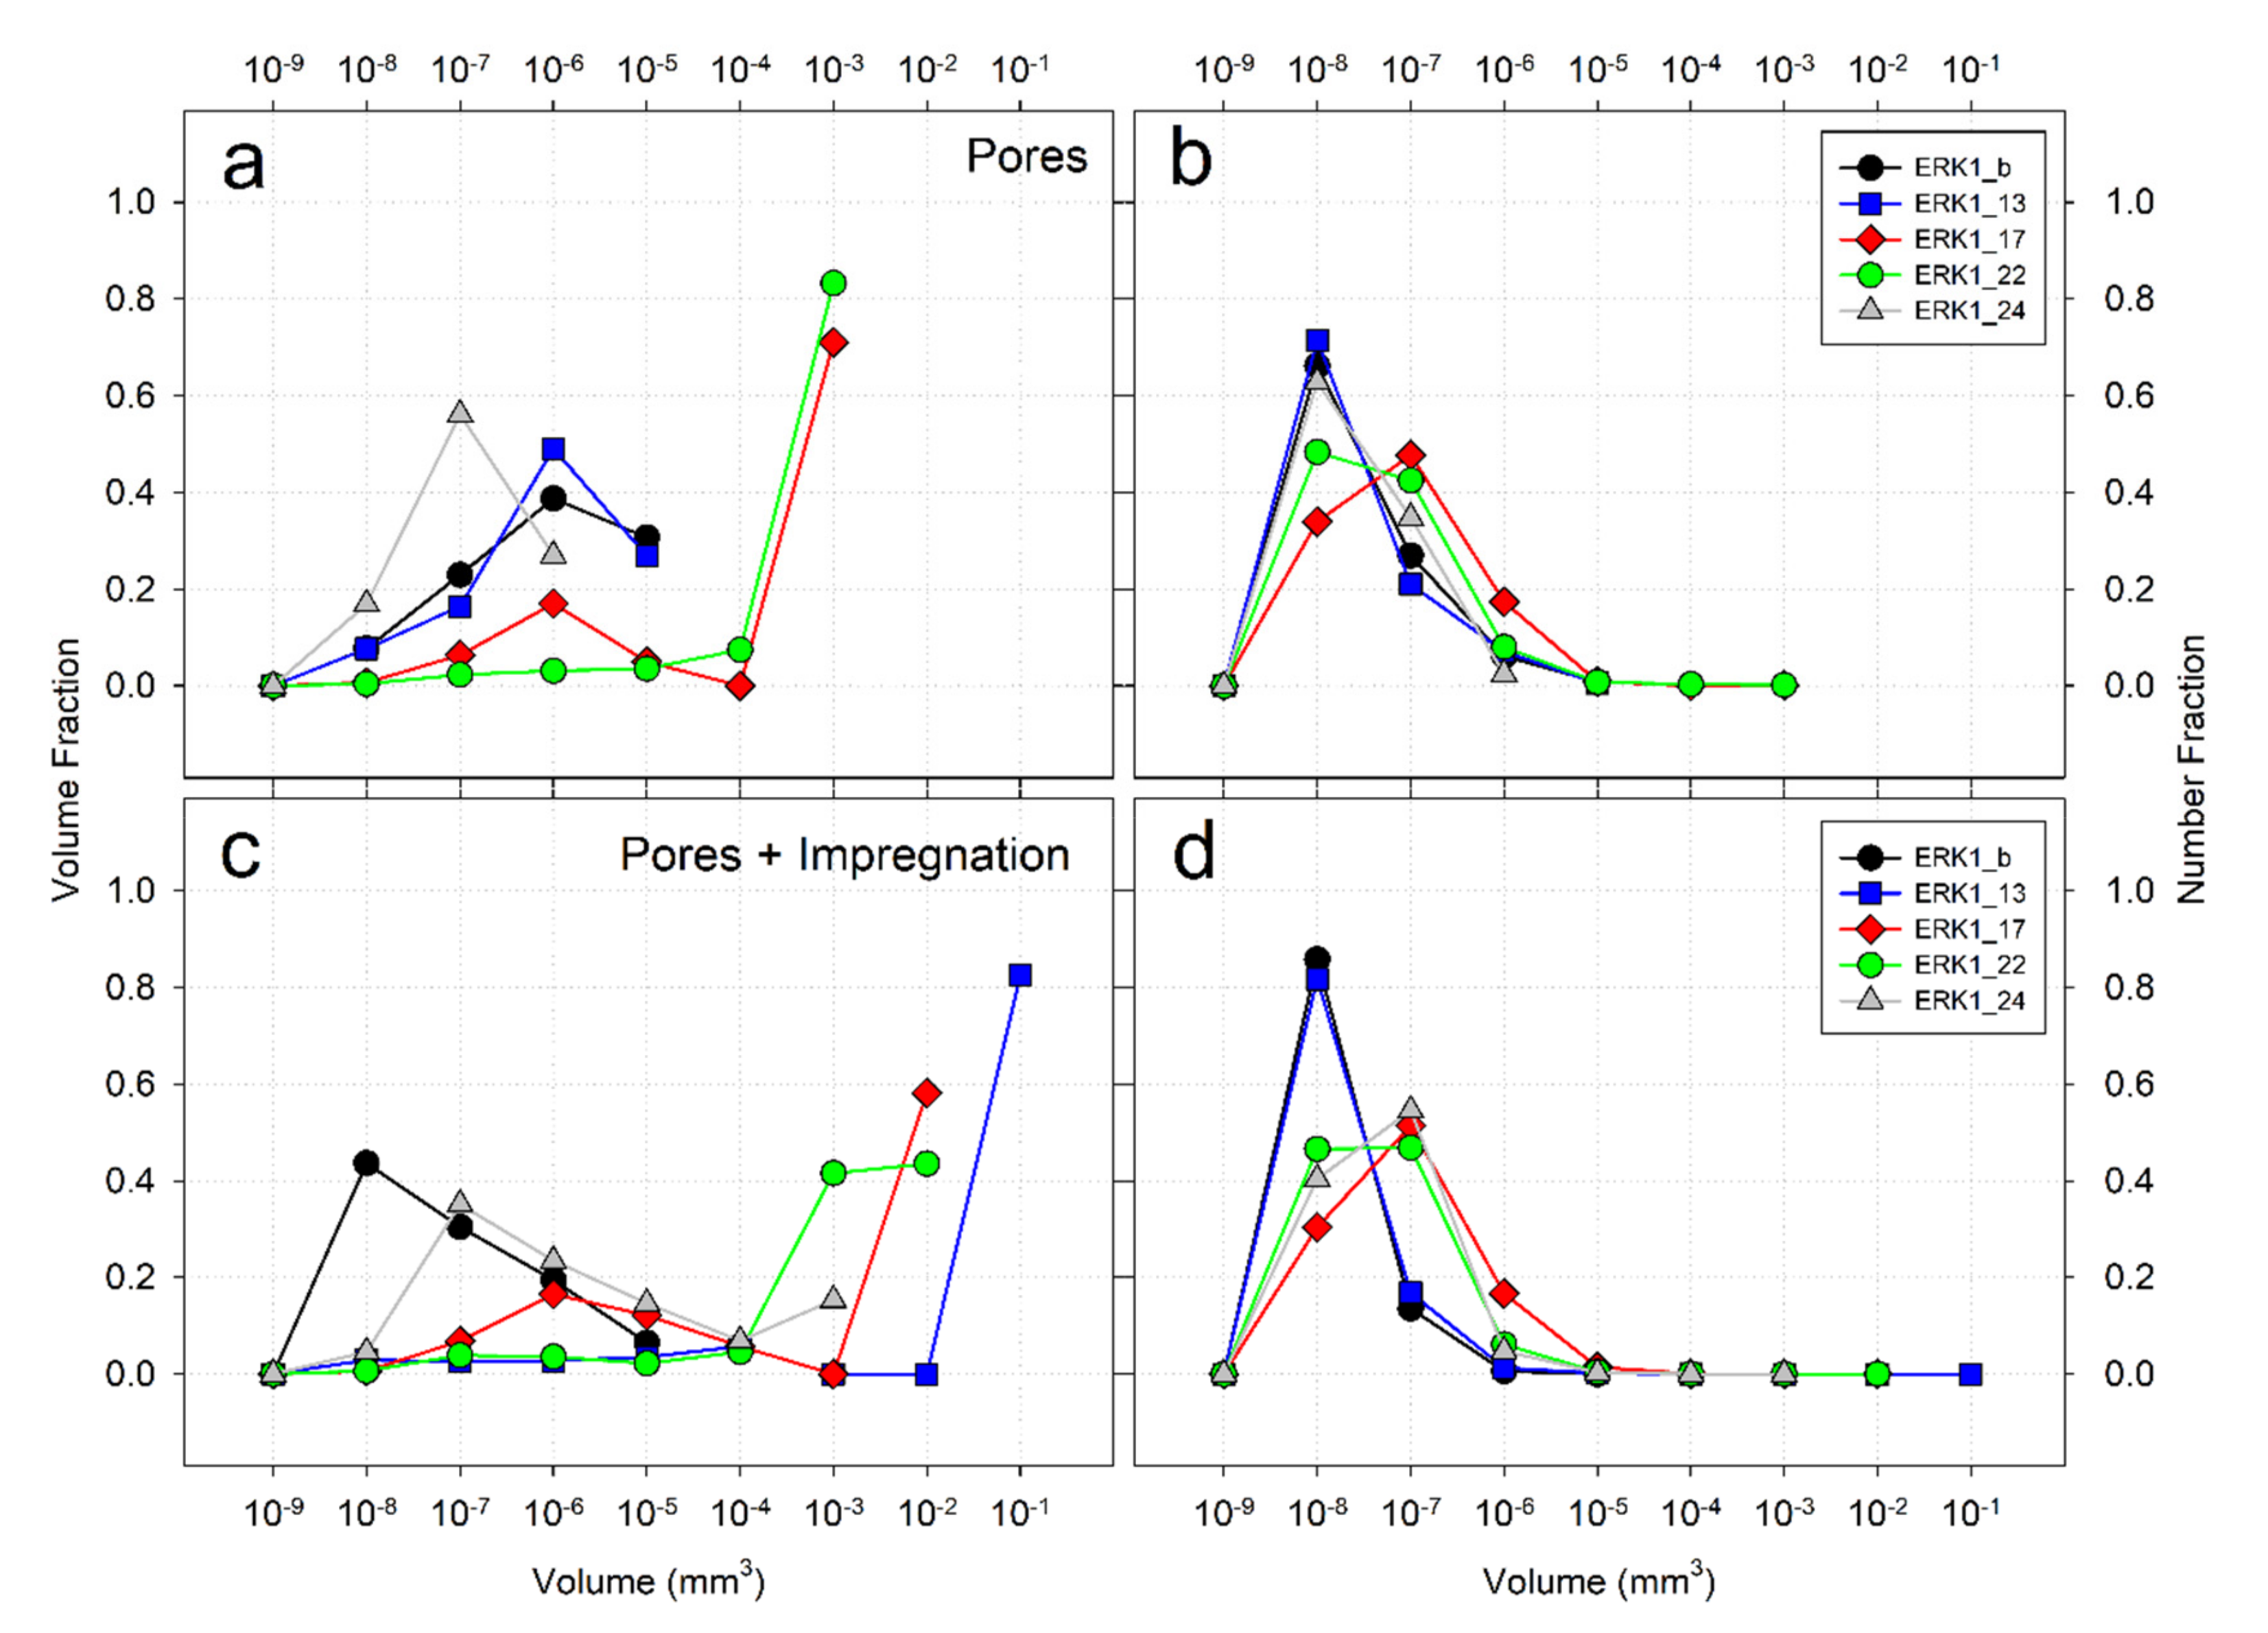
5.3.2. Porosity Types

Two main porosity types have been recognized:
  • Fabric selective (primary porosity)
Grains and crystals control the porosity, and the pores are restricted to grain boundaries. This kind of porosity is the image of different possible depositional environments and biological imprints.
To obtain a complete characterization of pore system, the use of multiple methodologies is here required [29]. This can be obtained through 2D (thin sections) and 3D (CT) image analysis, the latter based on the electron densities difference in the porous material.
2.
Non-fabric-selective (secondary porosity)
Secondary porosity, in the Noto Fm., is mainly due to fractures and joints. The brittle nature of the carbonates is evident in their inclination to fracturing, which, however, is higher in some intervals (see next paragraph). Fracture porosity is evident in most of the thin section examples (Figure 5c) but also from core pictures (Figure 4). Micro-fractures are both extensional and compressional, often filled with secondary polycrystalline calcite. Joints, with no offset are also present.

5.3.3. Diagenetic Features

Diagenetic features include (1) calcite cementation infilling fractures (Figure 5c), (2) compaction and tectonic stylolites, and (3) residual hydrocarbons and secondary calcite along stylolites. Diagenetic features are compaction and tectonic stylolites (Figure 5(d1–f2)). Compaction stylolites are common in laminites and stromatolites, and generally follow the same plane of lamination that is created by alternating layers of spar and micrite (Figure 5(d2)). However, tectonic stylolites, cutting lamination, are also present (Figure 5(d1,f1,f2)). The shape of stylolites varies from rectangular, seismogram type, suture, and sharp-peak type. Stylolites often bear clay minerals, bitumen, and secondary calcite (Figure 5(d1,f1–f3)).

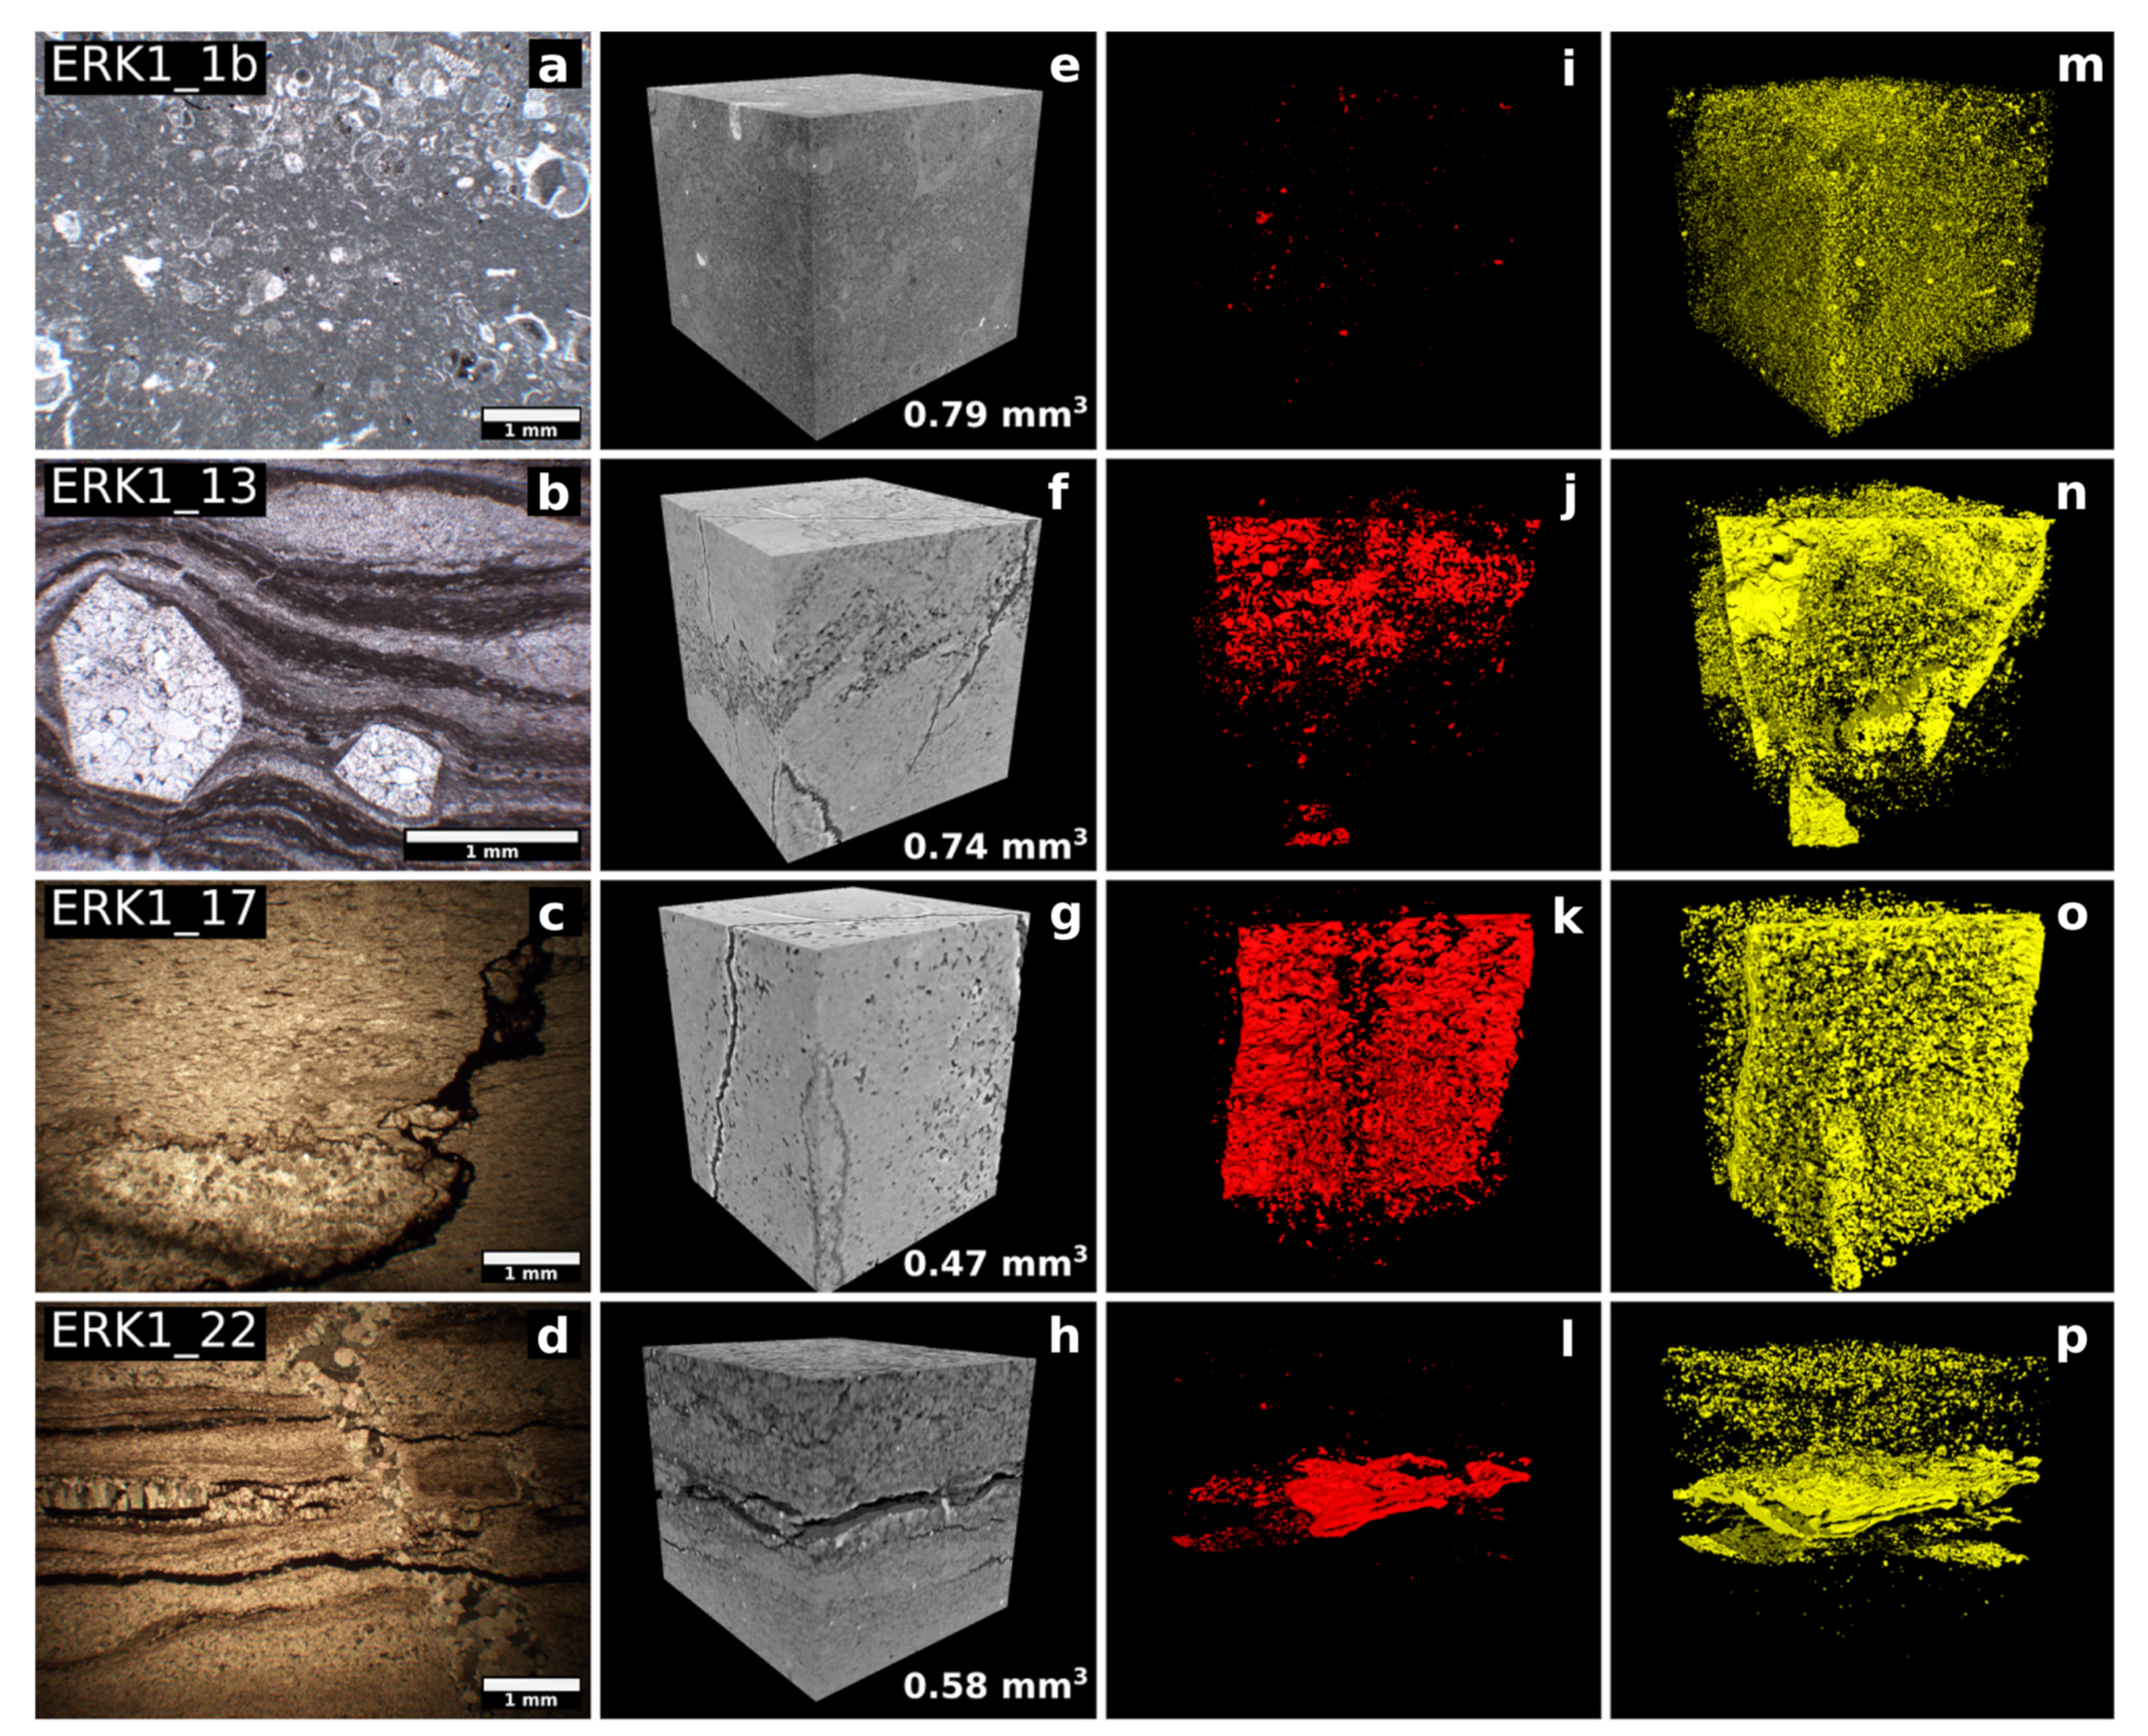
5.3.4. 3D Image Investigation

Fabric and Primary and Secondary Porosity

The image analysis of 3D volumes (by SR-μCT) allowed to visualize the three-dimensional distribution of pores, fractures, mineralization, bitumen impregnation within selected samples and facies. Quantitative analysis was performed to retrieve the abundance of these phases. Pores display a wide size range, from few cubic microns (minimum observable size by employed μCT technique) to 0.0035 mm3. Their distribution is linked to facies, fabric, lamination, diagenetic, and tectonic features. Qualitative visualization of the void phase shows that it is mainly constituted by fractures, whereas isolate voids (pores) are rare and dispersed within the investigated volumes (Figure 6 and Figure 7). Quantitative analysis was performed to retrieve the abundance of the pore and pore + impregnation phases, so as to evaluate the volume of each pore and of the sum of pores + impregnation (Table 2 and Table 3). The sum of volume occupied by pores and fractures ranges between 0.01 and 1.13 vol.%. Although pores + impregnation is generally present within the whole volume, and ranges between 0.66 and 20 vol.%, it is particularly abundant within layers, parallel to stromatolitic laminae (Figure 7, Sample ERK1_22).
The size distribution for selected samples is shown in Figure 6 where volume distribution and number distribution [109] are reported for both pore and pore + impregnation phase.
In particular, pore phase volume in ERK1_b, ERK1_13, and ERK1_24 is mainly given by small voids (<10−5 mm3), whereas the majority (>70%) of ERK1_17 and ERK1_22 pore volume is constituted by voids of 10−3 mm3 (Figure 6a). The same trend is confirmed by the pores number density diagram (Figure 6b), indicating that ERK1_b, ERK1_13 and ERK1_24 have a high number of small pores, whereas the other samples increase their number of large ones. The pore + impregnation distributions (Figure 6c,d) indicate a similar trend except for ERK1_13, that was most likely interested by large voids that where massively filled by impregnation.
The pore + impregnation is often distributed along planes that can be mineralized micro-faults and veins (Figure 7 Samples, ERK1-17 and ERK1-22).
The porosity type is mainly interparticle, but also intraparticle in the wackestone with dwarfed gastropods of Noto Formation (Sample ERK 1_1 of Streppenosa Fm.). Porosity is also due to cracks and joints, stylolites, and vugs in microbial and algal laminites with evaporite crystals (calcite pseudomorphs after gypsum, sample ERK1_22). Stylolites seem not acting as fluid barriers, as they are filled not only with clay, but in part with bitumen and secondary calcite.

5.4. Petrophysics: Seismic Wave Measured on Cores

The compressional wave velocities, measured on cores specimens, assigned to both the Streppenosa and the Noto Fms., respectively, the seal and reservoir rocks, show some noticeable variations, generally regardless of depth (Table 3).
Samples from the Streppenosa Fm. (Facies B1) show compressional wave velocities values of 6 km/s. In the Noto Fm., velocities range from 1.96 to 5.62 km/s, showing a heterogeneous distribution of elastic properties. Such variations are likely related to facies and type of porosity that affect at various extents the studied cores. This is also confirmed by microtomography investigation. Bitumen impregnation, particularly relevant at certain intervals, may also determine the decrease of P-wave velocity. Comparing the porosity results, obtained by micro-CT, and the measured Vp velocity on the same samples, a good match is achieved. In fact, Samples ERK1_1 and ERK 1_24 with low values of pores (between 0.00 and 0.04%) record high Vp velocities (5.62–6 km/s). The increase of pores and pores + impregnation in other samples lowers the P waves propagation velocities.

5.5. Sedimentary, Diagenetic, and Tectonic Structures and Their Depth Distribution on Cores

A detailed analysis, considering bedding, joints, faults, veins, load stylolites, and tectonic stylolites, was carried out on cores.
Bedding and load stylolites are mainly sub-horizontal with an apparent dip angle between 0° and 25°, but on average 3°. The dip angle of the load stylolites is between 0° and 25°, but on average 5.5°. Load stylolites are bedding-parallel, and amplitude varies between 1 mm and 5 mm, with an average of about 2.5 mm.
Most lithofacies are cut by fractures, identified along all the studied interval. Black shales are characterized by very low competence, and they appear highly broken with perforation induced bedding parallel fractures.
The analysis of the fracture planes highlights essentially bidirectional azimuths, with poles concentrated approximately towards “east” and “west” (referring to the interim reference system described previously) (Figure 8a,b).
The dip angles of fractures are between 0° and 90°, with an average of 79°. Most of the fractures and veins are therefore vertical or sub-vertical (Figure 9a).
The maximum fracture opening is 28 mm, while the minimum is 0 mm, when completely closed, and less than 1 mm for open or cemented ones. Openings smaller than 1 mm are by far the most abundant, while only 21 fractures showing an opening greater than 5 mm (Figure 10a). On average, fractures are approximately 33 mm long. The minimum length is 2 mm, while the maximum length is 350 mm. (Figure 10b). On average, the fracture density is approximately 30.8 fractures per linear meter. The maximum density is 144 in the 2070–2071 depth interval and the minimum is 2 in the 2045–2046 depth interval.
Most fractures do not have offset: in fact, only 1% of total fractures show it. Extensional structures are fifteen, whereas just five are compressional (examples in Figure 11). The minimum measured offset is 1 mm, the maximum is 18 mm, with an average of 4 mm. Among normal structures, offset is between 1 mm and 10 mm, with 4 mm average; among the reverse ones it is between 2 mm and 18 mm, with an average of about 6 mm. Four extensional structures form small centimetric horst and grabens (Figure 11a), with an offset ranging from 3 mm to 10 mm, with 5 mm average. A single large sub-vertical fracture, in the depth interval 2111–2112, shows a significant offset, not measurable on the core as it is larger than the core itself. Considering the high angle, it is probably a normal micro-fault, with an azimuth towards ESE and a dip angle of 90°. This fault is 320 mm long and has a maximum opening of 28 mm. Furthermore, it is cemented by calcite and angular clasts, recalling the morphology of a damage zone (Figure 11c).
The orientation of the best-fitting planes containing tectonic stylolites also shows bidirectional azimuths, with poles concentrated mainly towards WNW and ESE of the reference axis (Figure 8d,e). Dip angles of the tectonic stylolites are between 40.4° and 90°, with an average of 78.4° (Figure 9b), therefore they are sub-vertical. This indicates a sub-horizontal and towards WNW-ESE of the reference system major stress axis (σmax). The amplitudes of these tectonic stylolites vary between 1 mm and 13 mm, with an average of 5 mm, while lengths are between 10 mm and 150 mm, with an average of 52 mm. Cross-cutting relationships (Figure 11d,e) show that tectonic stylolites cut fractures and veins, while fractures and veins cut load stylolites. Therefore, compressional micro-structures are younger than extensional ones.

5.6. Well Logging Analysis

All previously obtained data have been plotted against V Shale (%) per meter, SP, Gamma-Ray, limestone porosity, formation density, delta t from Master Log, Vp from Master Log and from cores, and number of fractures per meter. The comparison between all the available logs has allowed to identify four clusters, whose boundaries represent the most important variations in the general trend (Figure 12). Starting from top to base, cluster 1 (C1) and cluster 2 (C2) were recognized within the Streppenosa Fm., while cluster 3 (C3) and cluster 4 (C4) were identified within the Noto Fm.
A detailed description of the logs for each cluster is shown below.
Cluster 1 (C1)—From 2000 m to 2016 m:
C1 is bounded to the top from the highest value of SP (119.2 MV), medium-high values of GR (90.18 GAPI) and medium-low values of p (23.18 PU), D (2.49 g/cm3) and S (83.5 µ/ft). Downward, the SP, GR, S and p trend is markedly descending and reaches the minimum value (SP = 75.3 MV; GR = 32.63 GAPI; p = 8.6 PU; S = 64.31 µ/ft) in proximity of the base of C1. High Gamma ray values (up to 150 GAPI) are related to high organic content (black shales). Conversely, the D trend is weakly increasing (2.62 g/cm3), and, in accordance with the estimated Vshale (from 46.9% to 6.1%), it highlights a gradual increasing of the carbonate component downwards. This is linked to a deepening upwards trend of Streppenosa Fm.
Cluster 2 (C2)—From 2016 m to 2036 m:
The upper portion of C2 shows a sudden variation in the trend of all logs. SP, S, GR and p values increase, reaching, respectively, SP = 100.6 MV; GR = 97.64 GAPI; p = 19.76 PU; S = 92.89 µ/ft; instead, the D value weakly decrease, reaching 2.48 g/cm3. At the depth of 2019 m, the trend reverses and reaches low values at about 2028 m (SP = 74.8 MV; GR = 59.42 GAPI; p = 15.43 PU; S = 83.62 µ/ft; D = 2.56 g/cm3) in proximity of the C2 base, showing a good correspondence with the estimated shale volumes, which are increasing downwards (Vshale top C2 = 7.1%; Vshale base C2 = 73.9%).
Cluster 3 (C3)—From 2036 m to 2099 m:
The upper portion of C3 shows the transition from Streppenosa Fm. (greater volume of shales, seal) to Noto Fm. (lower volume of shales, reservoir), as evidenced by the decrease in SP values (21.1 MV), p (11.54 PU), and S (61.2 µ/ft), and roughly constant D values (D = 2.55 g/cm3). C3 represents the largest portion of available data characterized by a medium regular trend with medium value in the Vshale (27.7%) that shows overall a predominance of carbonate component. However, locally C3 is interrupted by some spiky SP, GR and p positive values and some spiky D and S negative values. In particular, at 2060 m: PS = 30 MV, GR = 95 GAPI; p = 14.39 PU; D = 2.51 g/cm3; S = 63.9 µ/ft; at 2067 m: SP = 37.9 MV, GR = 94.96 GAPI; p = 22.45 PU; D = 2.49 g/cm3; S = 57.76 µ/ft; at 2084 m: SP = 30.7 MV, GR = 101.7 GAPI; p = 12.75 PU; D = 2.49 g/cm3; S = 68.07 µ/ft; at 2096 m: SP = 23.09 MV, GR = 115.76 GAPI; p = 35.79 PU; D = 2.45 g/cm3; S = 63.28 µ/ft.
These peaks mostly coincide with depths of the well where the shales are volumetrically more abundant Vshale (75%).
Cluster 4 (C4)—From 2099 m to 2148 m:
At 2099 m, the Noto Fm. shows an abrupt variation in the logs trend. Especially, in the upper portion the PS shows the lowest values of the whole analyzed section (PS = −55.4 MV) and low GR (40.48 GAPI) and S (65.2 µ/ft) values, which fit well with a low amount of Vshale (9%). Downwards, these values remain roughly constant. In fact, C4 represents the portion of Noto Fm. with the maximum amount of carbonate. Only at 2106 m and 2118 m there is a significant increase in p (respectively, p = 28.42 PU and p = 19.03 PU) and GR (respectively GR = 113.16 GAPI and GR = 90.19 GAPI) and a decrease in D (respectively, D = 2.37 g/cm3 and D = 2.53 g/cm3), which coincide with two isolated peaks in the Vshale (respectively Vshale = 100% and Vshale = 95.6%).
The Vp log trend, derived from the Sonic log, matches well the same four clusters (Figure 12). However, as shown on Figure 12, the compressional wave velocity (Vp) measured in laboratory on core specimens (13 samples, from ERK1_1 to ERK1_27) shows generally lower values (on average about 2.8 km /sec) and, therefore, located outside the Vp log curve. The difference between the values of Vp measured in the samples (Vpcore) and the Vplog shows an average value of about 1.65 km/sec and a significant increasing value with the depth (Figure 13; R2 ≅ 0.5). This marked and constant decrease in the Vp values is ascribed to the fact that cores are not subject to overburden pressure.
In synthesis, C1 is characterized by highest SP, GR, and p values that gradually decrease with depth and is interpreted as a portion of the Streppenosa Fm. with a progressive decrease of the shale content downwards (deepening upwards).
C2 is characterized by increasing SP, GR, p values, and medium S and D values and is interpreted as a portion of the Streppenosa Fm. with a progressive increase in the shale portion downward. In general, C2 represents the range of the entire section with the lowest volumetric content of the carbonate portion.
C3 is characterized by a general decreasing of SP value and a constant response of others logs associated locally to spiky GR, D, p, and S values. Overall, C3 is interpreted as a large interval within the Noto Fm. characterized by a high average volume of the carbonate portion with the presence of numerous shale intercalations.
Finally, C4 is characterized by lowest SP, GR and p response and medium S and D values and is interpreted as a sector of the Noto Fm. characterized by a further increase in the carbonate portion, whose continuity is sporadically interrupted by some shale intercalations.

6. Discussion

6.1. Different Stages in Diagenetic versus Tectonic Structures Formation

Most of high-angle analyzed fractures and joints, as well as micro-faults, relate to the extensional event. The small reverse-faults and tectonic stylolites, on the other hand, formed during one compressive event. Examining the cross-cutting relationships, the compressive structures are younger than the extensional ones. Consequently, we can establish the relative age of the two tectonic events: an older extensional one; a younger compressive one. The first is linked to the Late Triassic-Early Jurassic rifting event, coeval with the opening of Tethys. It led to the subsidence and high sedimentation rates in the area, also determining the formation of compaction stylolites [71,72,82], whereas reverse faults and tectonic stylolites indicate a change in the stress field regime: the onset of the continental convergence and collision between Africa and Europe and the beginning of the Alpine orogeny in the Mediterranean area [82,110], during Late Cretaceous-Paleogene up to the middle Tertiary. Bedding parallel joints may be related to unloading following erosion. Vertical ones, abutting against layer boundaries and dissecting layered rocks in blocky elements, may be due to decompression, too.
The load and tectonic stress can be reconstructed using the amplitude of the stylolites (i.e., the distance between peaks of the longest “tooth” in both directions), according to some studies [49,51,111,112]. In this study, amplitudes of tectonic stylolites are approximately the double of loading stylolites, which means that the continental collision stress was higher than the lithostatic one. However, such evaluation may result unprecise if considering the non-linearity in stylolite “teeth” growth and the reliability of numerical simulations, according to [112]. Only a minimal part of the contractional deformation [49], i.e., less than 20% [113], evaluated by measuring the amplitudes of stylolites, is accommodated by their formation. This means that most of the deformation is accommodated by other processes [113] such as fractures, joints, and faults at regional scale (i.e., the Scicli Line).

6.2. The Impact of Fracturing and Diagenetic Features on Porosity

Primary porosity depends mainly on lithology (Volume of shale%): along the studied section, the Vshale, indeed, linearly correlates to porosity (R2 ≅ 0.6; Figure 14). High porosity values (>50%) are related to high Vshale (volume up to 100%). Looking at Figure 14, porosity ranges from 0% to 53%, however, a cluster with low porosity (between 0% and 20%) is related to a low Vshale content (<30%) and higher carbonate fraction. Despite a small number of cases, the greatest variability of porosity (between 5% and 53%) occurs at intermediate Vshale/carbonates values (ca. 40% < Vshale < 70%), where highly fractured shales alternate to carbonate rocks. This large variability (between 2.2 and 2.6 gr/cm3) is also observed on the density graph (R2 ≅ 0.5; Figure 14).
Our results are in good agreement with other studies showing that porosity in microbial laminites and stromatolites is generally very low. The primary microbial calcite precipitation and its resistance to compaction influence porosity, preserving the native pore system during the burial history [29].
From the integrated analysis, data show that Streppenosa and Noto Fms. are characterized by heterogeneous sedimentary, diagenetic, and tectonic features, which determine characteristic petrophysical properties. This study highlights that fracture properties, including aperture, length, frequency, and secondary mineralization, play an important role in controlling the rocks porosity. Rashid et al. 2020 [16], as well as our study, show that type of fractures and stylolites, and their reciprocal cutting relations, point at two opposite evolutionary stages: one extensional, related to rifting, and the other compressional related to a collisional phase, both linked with the regional geodynamics.
Additionally, it is well known that fractures play a very important role in carbonate reservoirs rocks, as they often act as preferential flow pathways for hydrocarbons [28]. Conversely, our data show that most of fractures (85%) are cemented and, thus, do not enhance the porosity of the rock. Only 15% of fractures are partially cemented with secondary calcite, and/or impregnated with bitumen, especially in the depth range from 2069 to 2072 m. Looking at Figure 12, gamma-ray log and limestone porosity versus the number of fractures per meter, it appears that porosity is not much controlled by density of fractures.
Stylolites as well have been analyzed on cores, thin sections, and, on small representative specimens, on micro-CT: some of them are partly impregnated with bitumen (especially visible under the microscope), partly with secondary calcite and clay minerals. Therefore, like fractures, they exhibit a little residual porosity. According to more recent studies [42,114,115], stylolites have been considered as barriers for hydrocarbon flow, however, these structures are permeable in most cases, [42,115] and they represent a preferential conduit for fluids to flow. Overall, laterally extended load stylolites can play a significant role in controlling the regional fluid flow through relatively slightly deformed fractured carbonate rocks [42,115]. In some case, when enriched with minerals, stylolites represent a barrier, capable of reducing the porosity. The latter can reduce the permeability of the formation and constitute an obstacle for the regional fluid migration [114]. Our data regarding stylolites are, therefore, in good agreement with Heap et al. [114], who noted that the porosity of the samples containing stylolites is nearly higher than their stylolite-free counterparts (see Samples ERK1_17 and 1_24) and that stylolites often serve as conduit for calcium carbonate-rich fluids enhancing later calcite precipitation. Therefore, our data suggest that stylolites may act as partial conduits for fluid flow, while a lack of significant density contrast is registered in thin stylolites. Although the heterogeneity of analyzed rocks may be described by a coefficient of variability and a larger number of samples is recommendable for reservoir characterization and simulation [116], our work successfully characterizes the heterogeneity of Hyblean reservoir rocks and its implications at the pore scale.

7. Conclusions

In this work, our multi-scale and multidisciplinary results on the analysis of well-known reservoir rocks from subsurface of the Hyblean Plateau (Sicily, Italy), can be summarized as it follows:
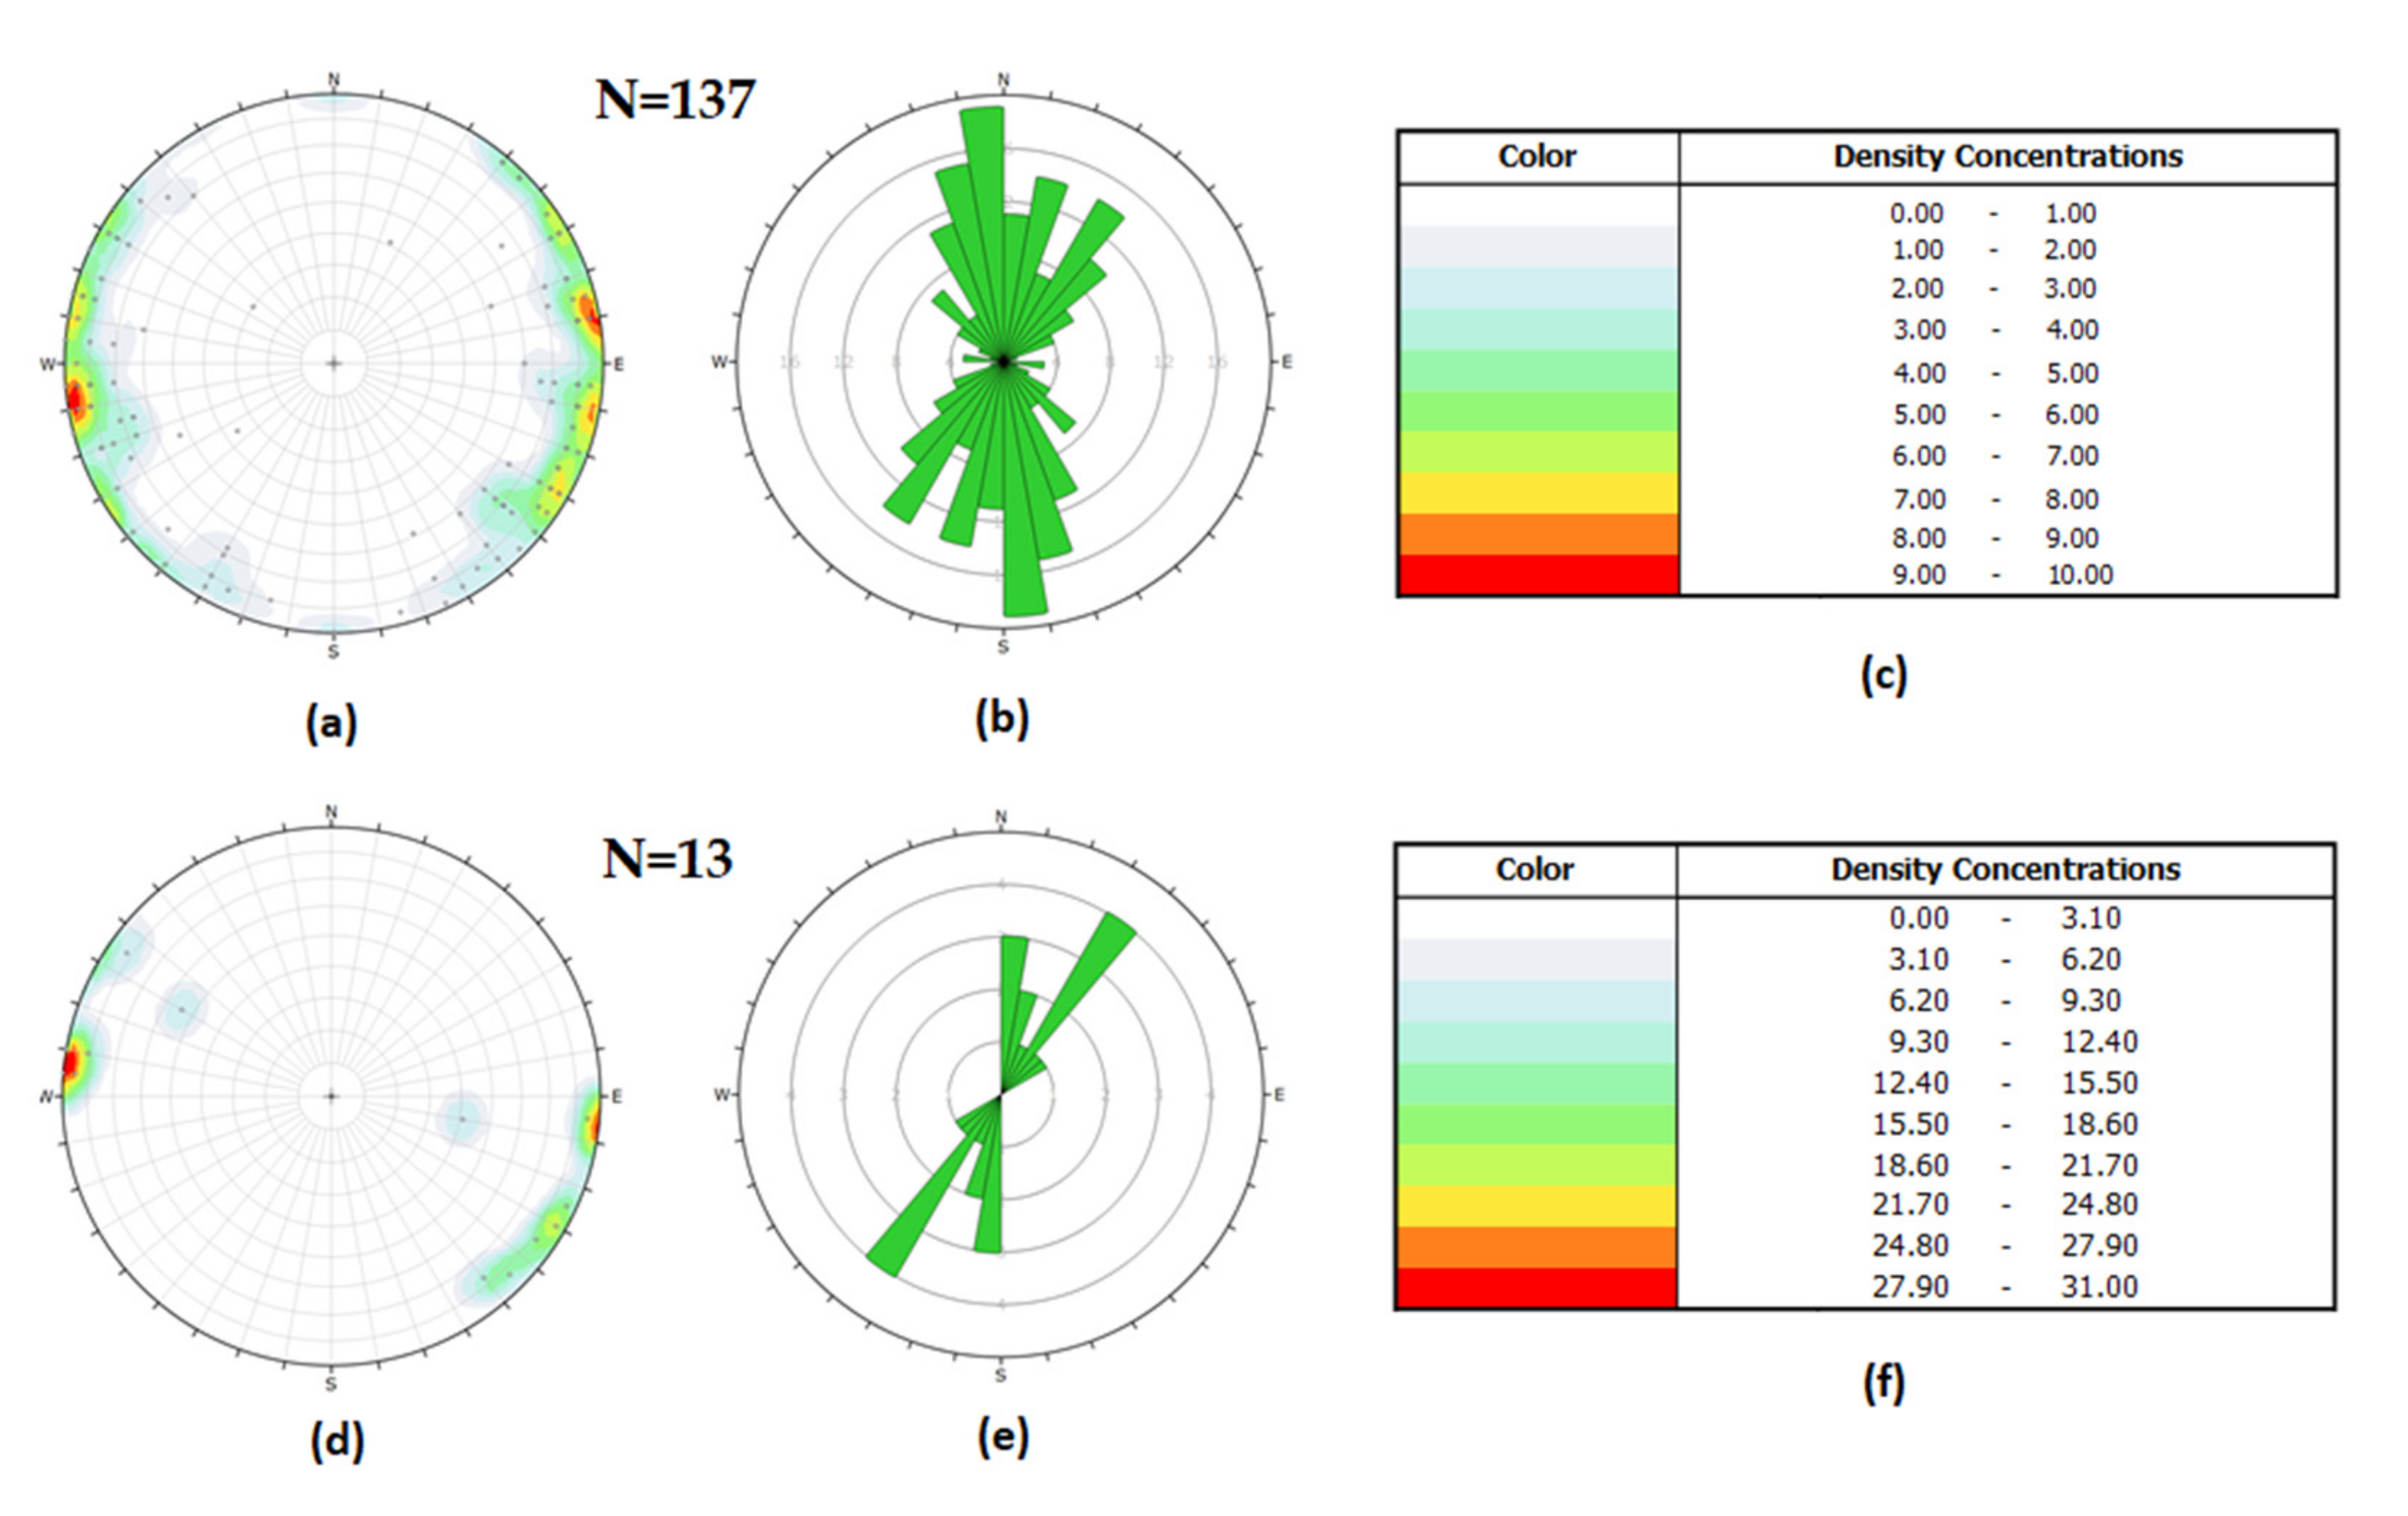
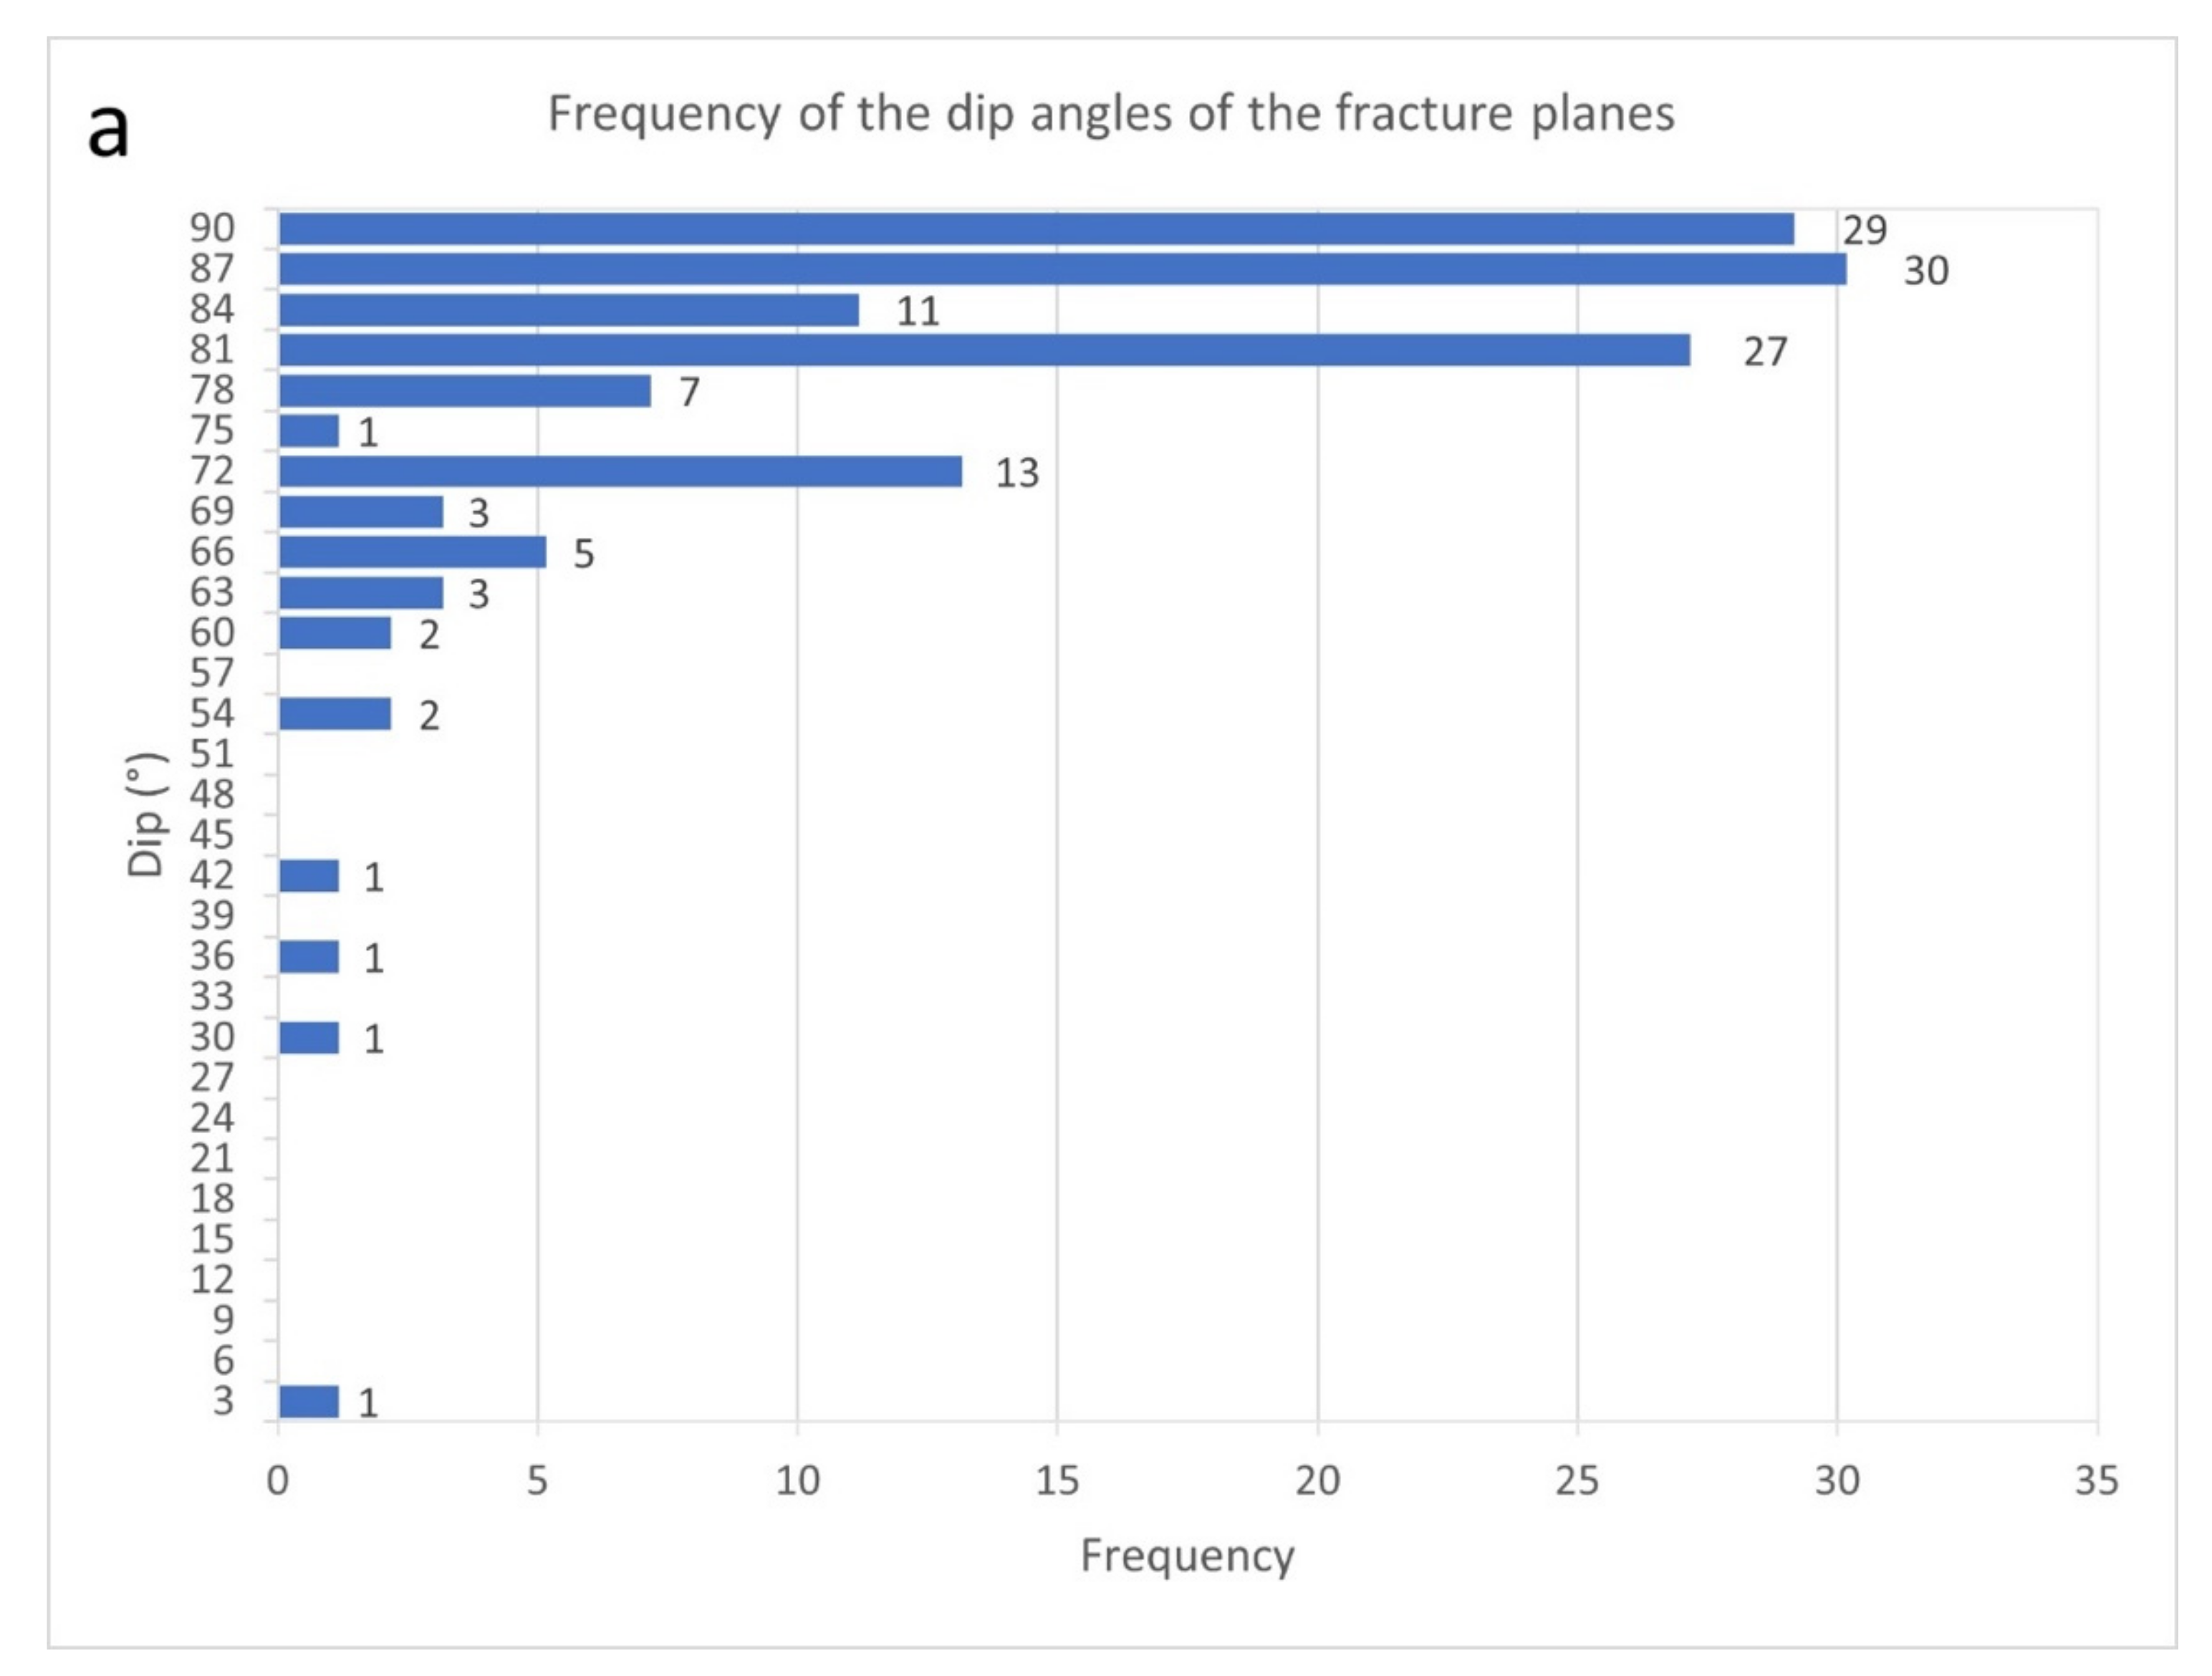
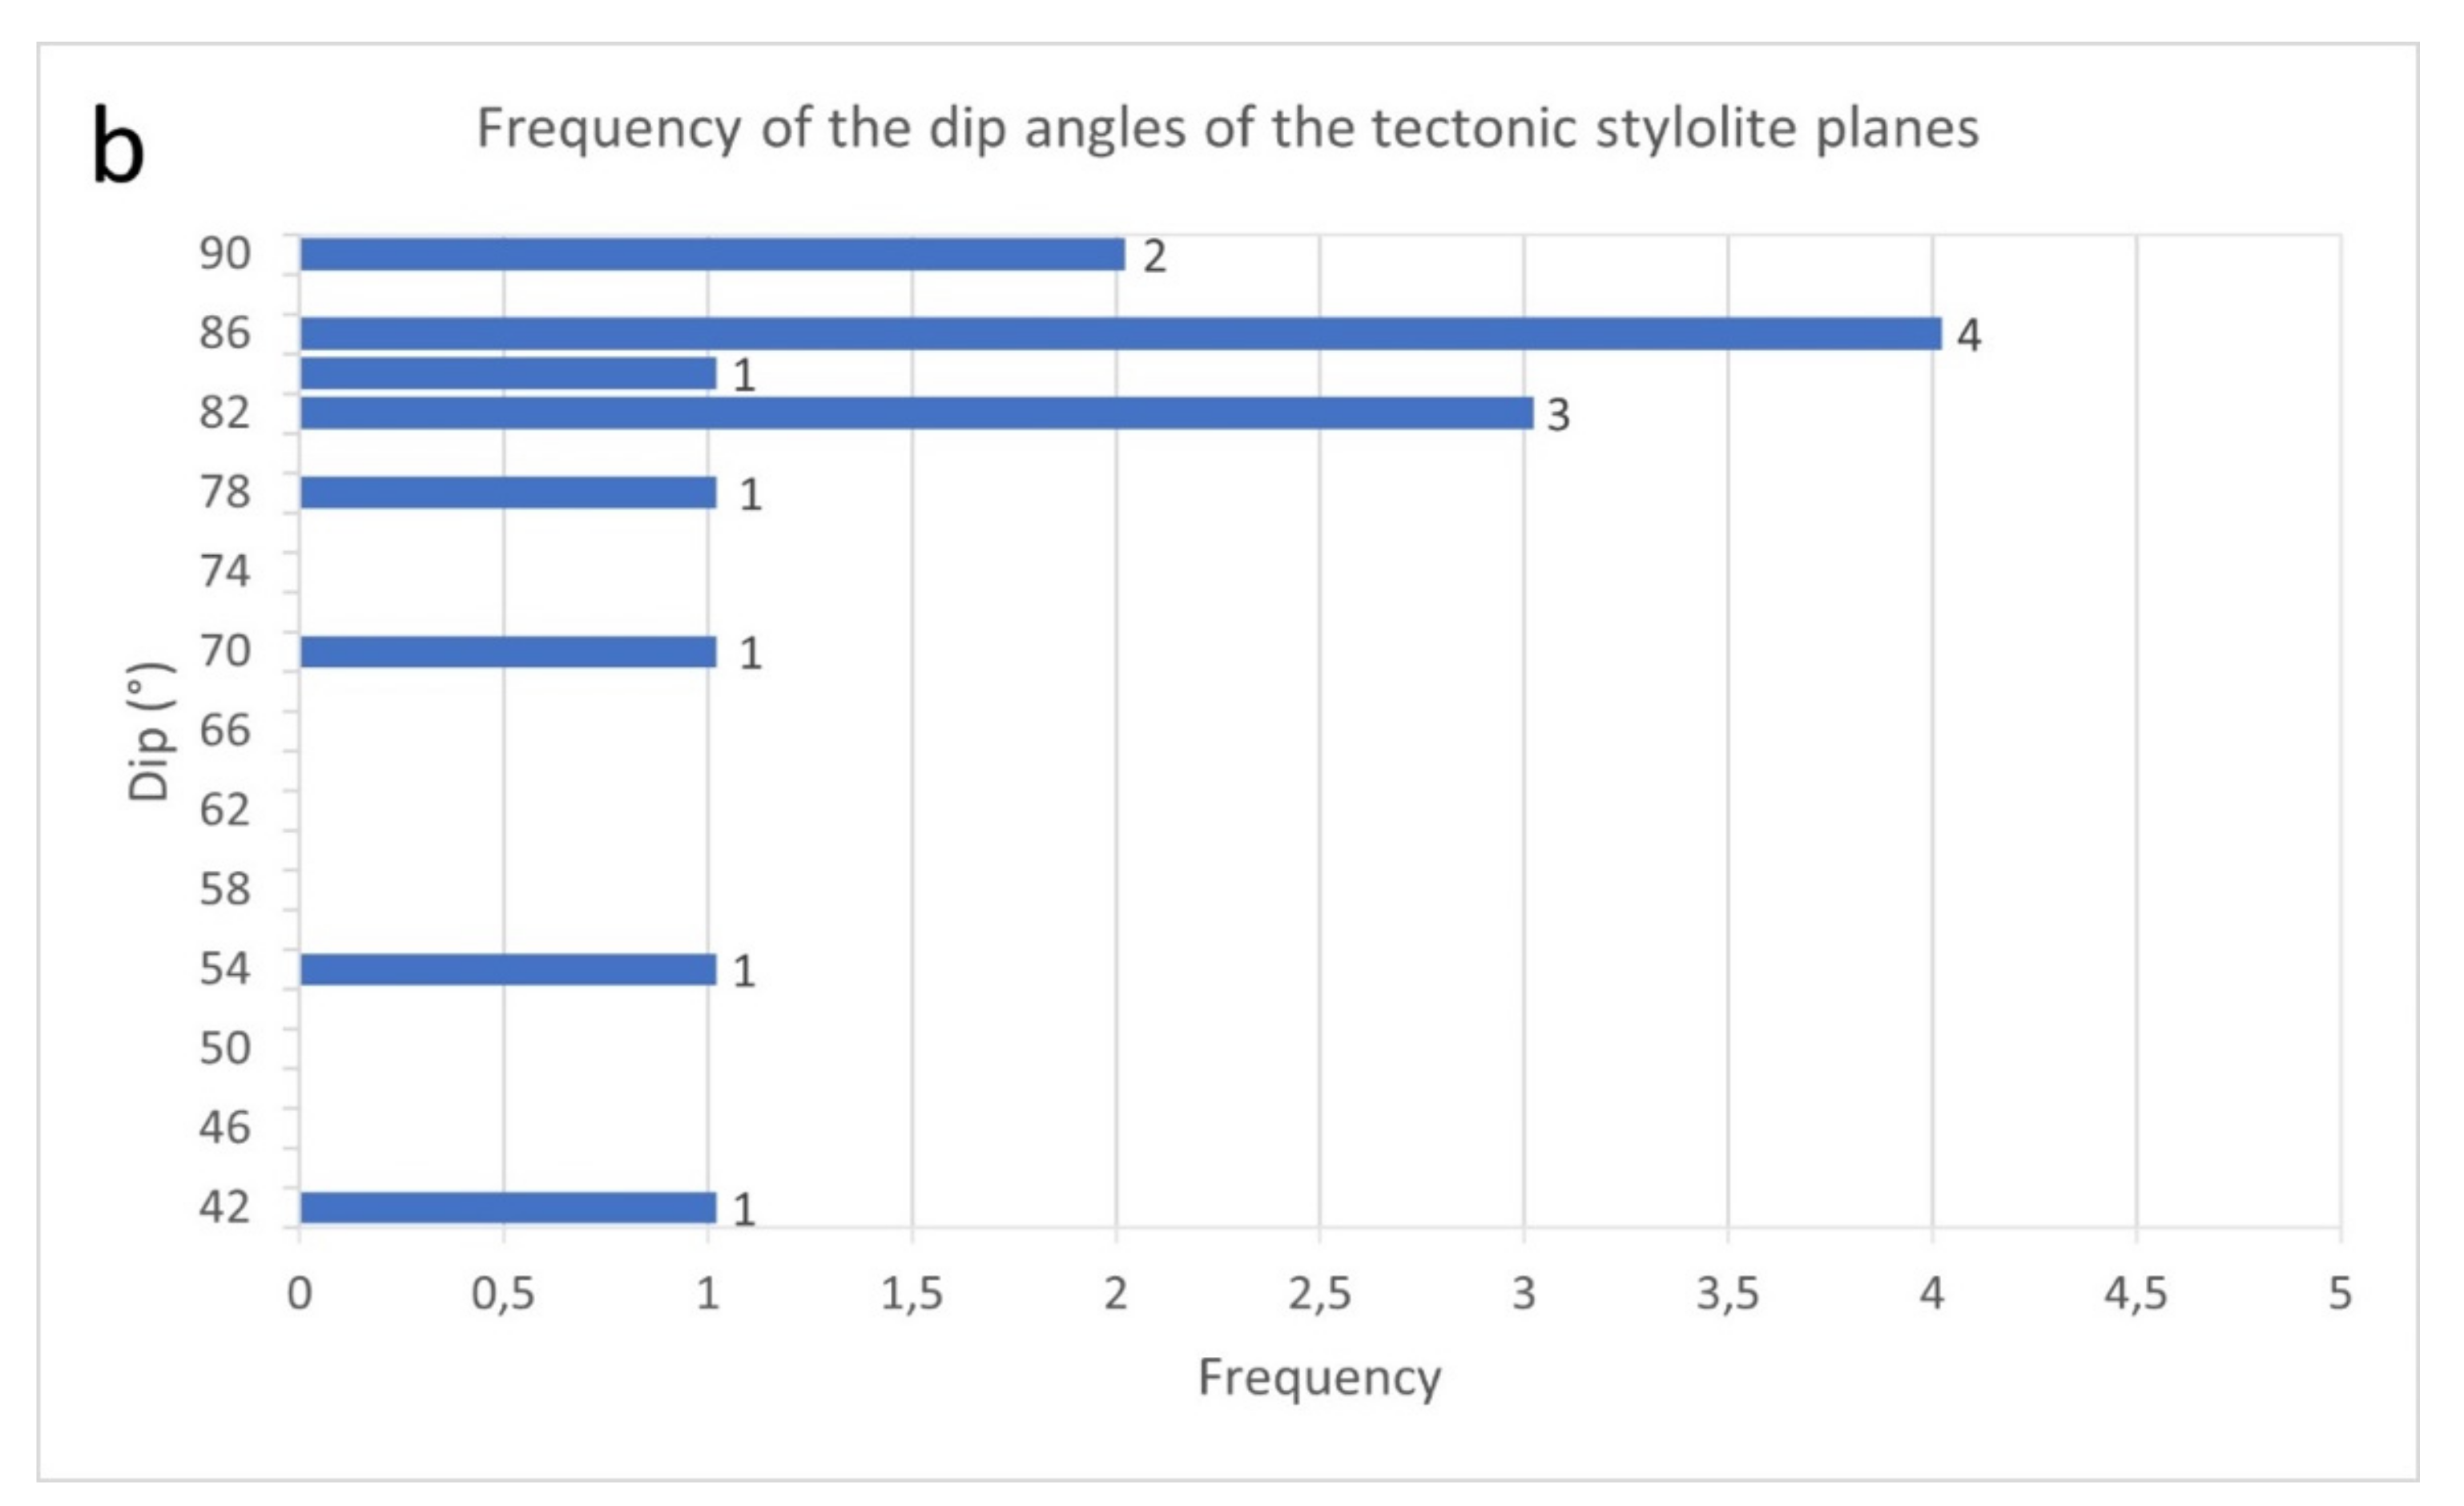
  • The dominant sedimentary and diagenetic features are bedding and burial stylolites. Tectonic features are mainly mineralized fractures, veins, faults, and tectonic stylolites. The dominant extensional tectonic features are steeply inclined fractures and faults related to the main upper Triassic rifting event. Compressional tectonic structures and tectonic stylolites are related to a younger compressional event linked to tectonic inversion and Europe-Africa plate collision;
  • The qualitative analysis of voids shows a dominance of joints, and fractures instead of isolate pores, which are rare and scattered within the investigated volumes;
  • Depositional and diagenetic processes led to the formation of a micro-dominated pore system with a low residual porosity;
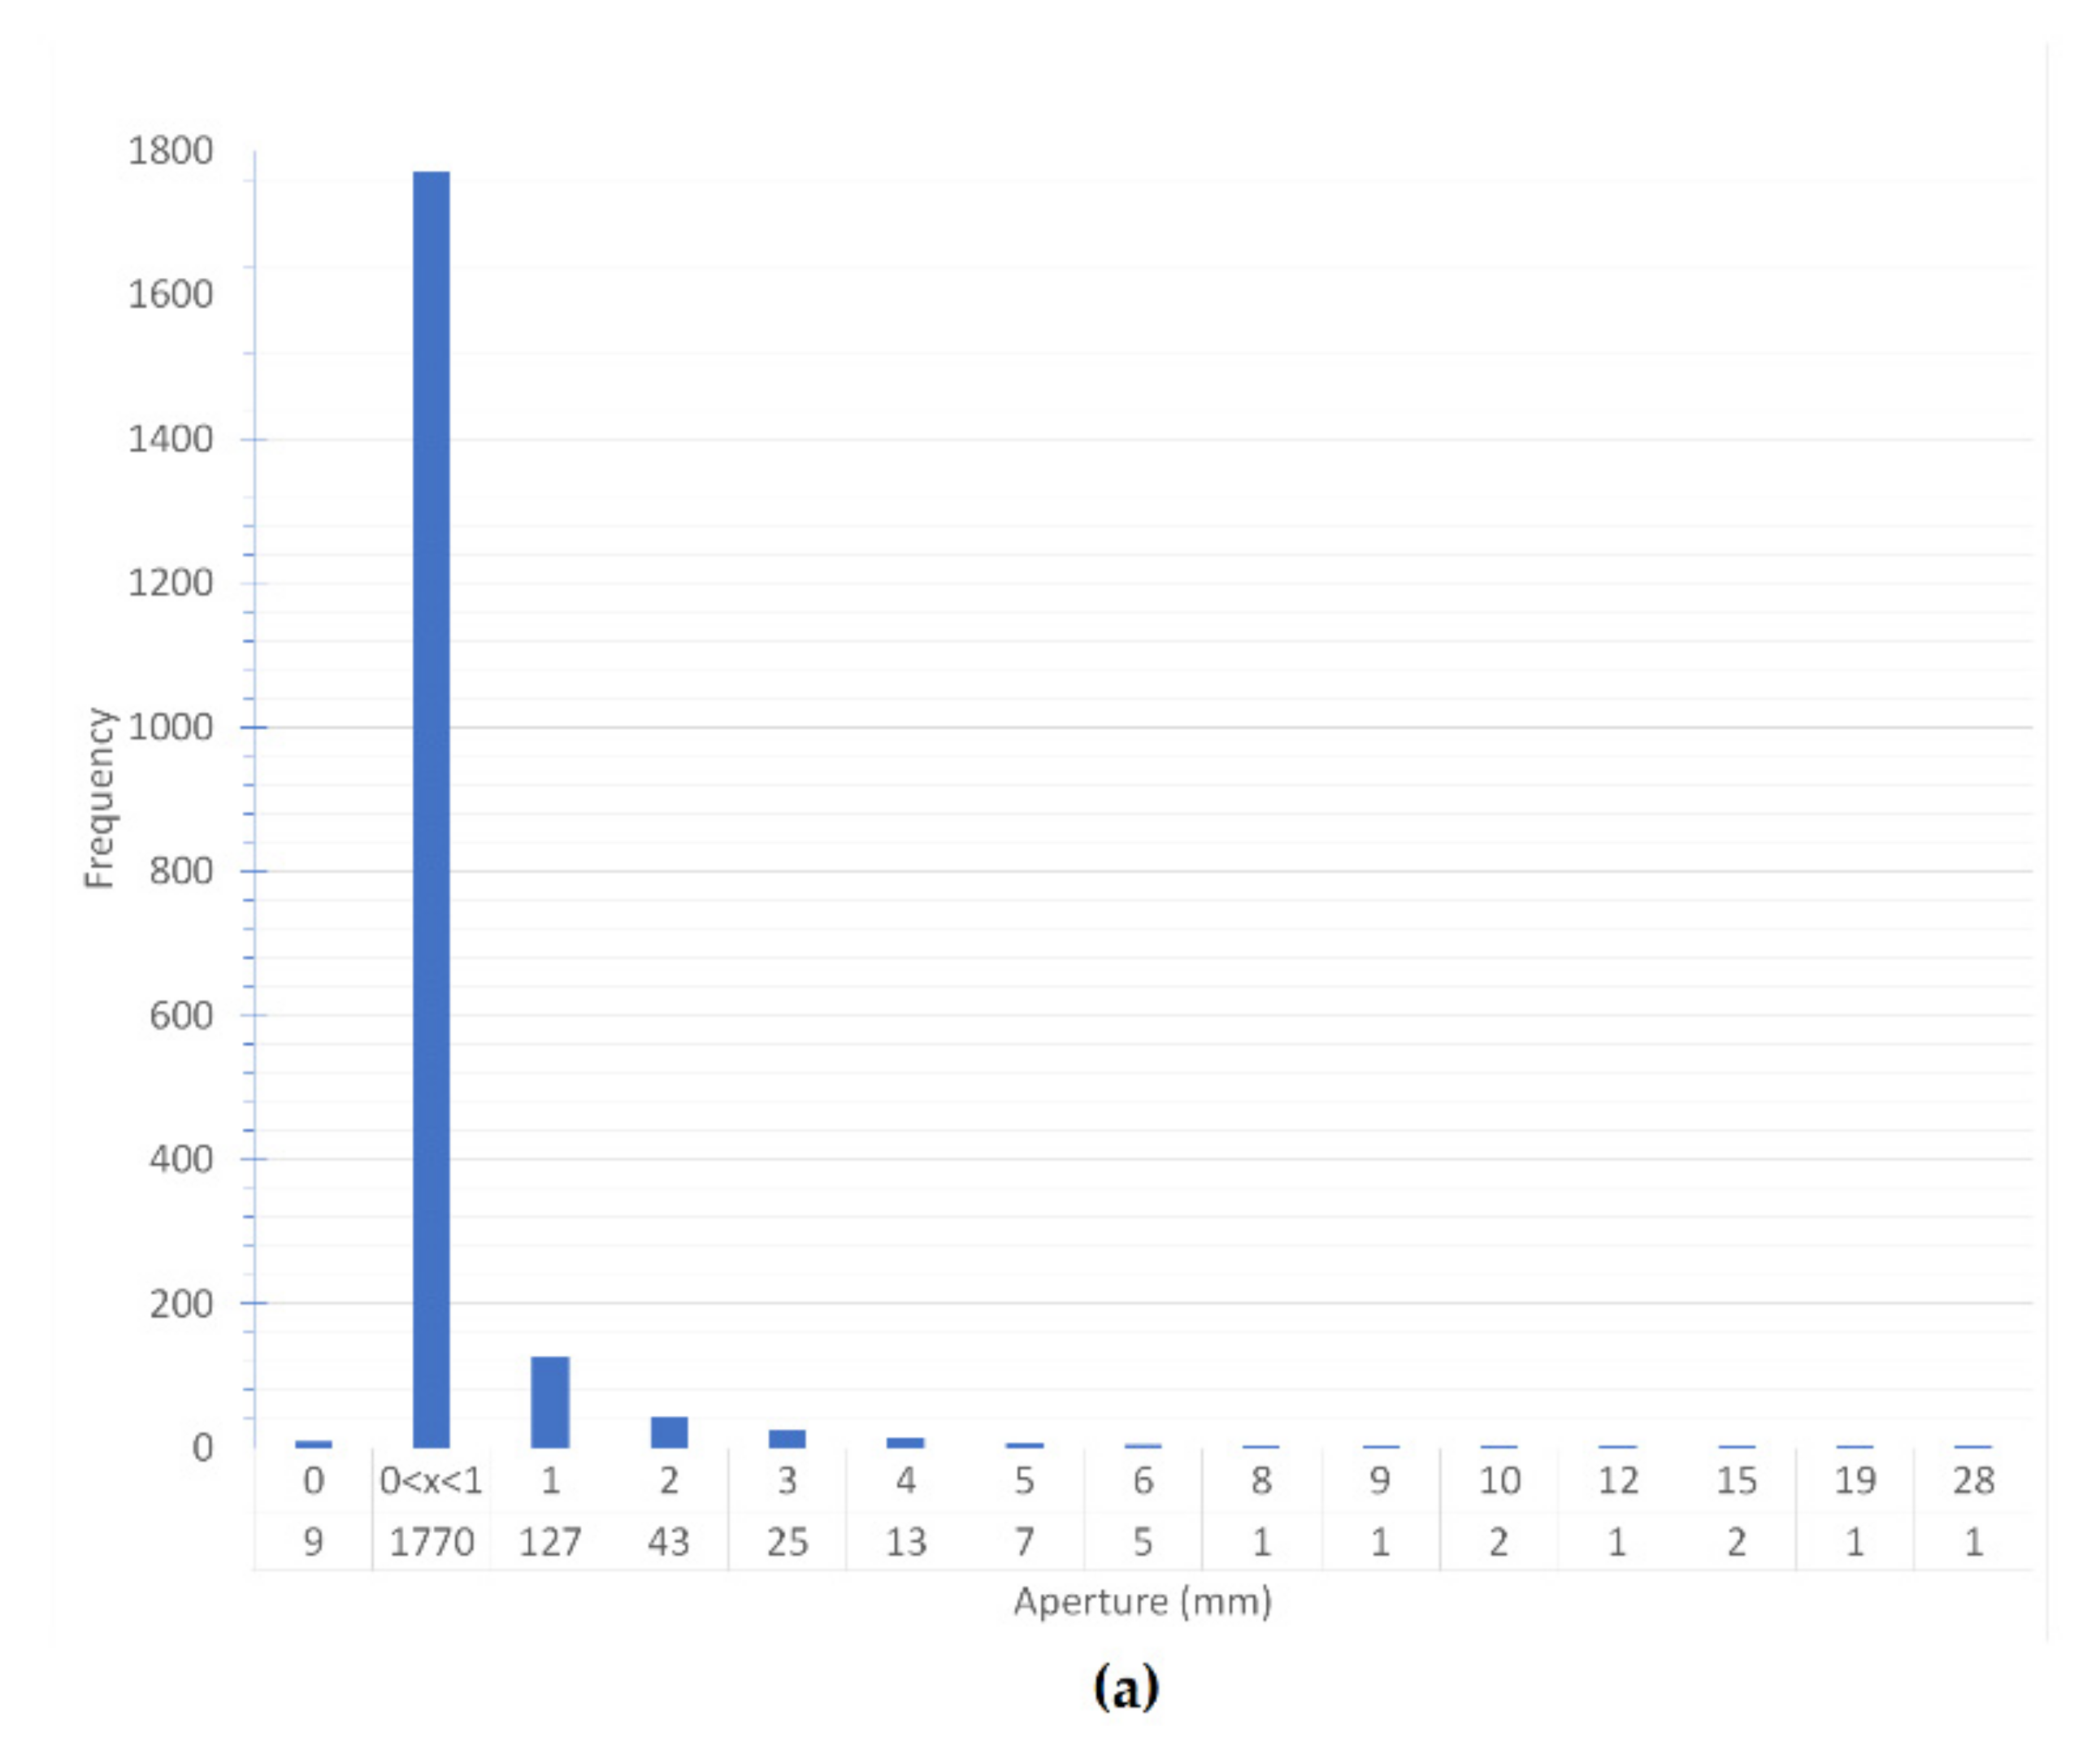
  • Fractures are mainly mineralized (85% of the total amount); thus, they do not contribute to the overall porosity. Stylolites may partially increase it, showing permeation by secondary fluids;
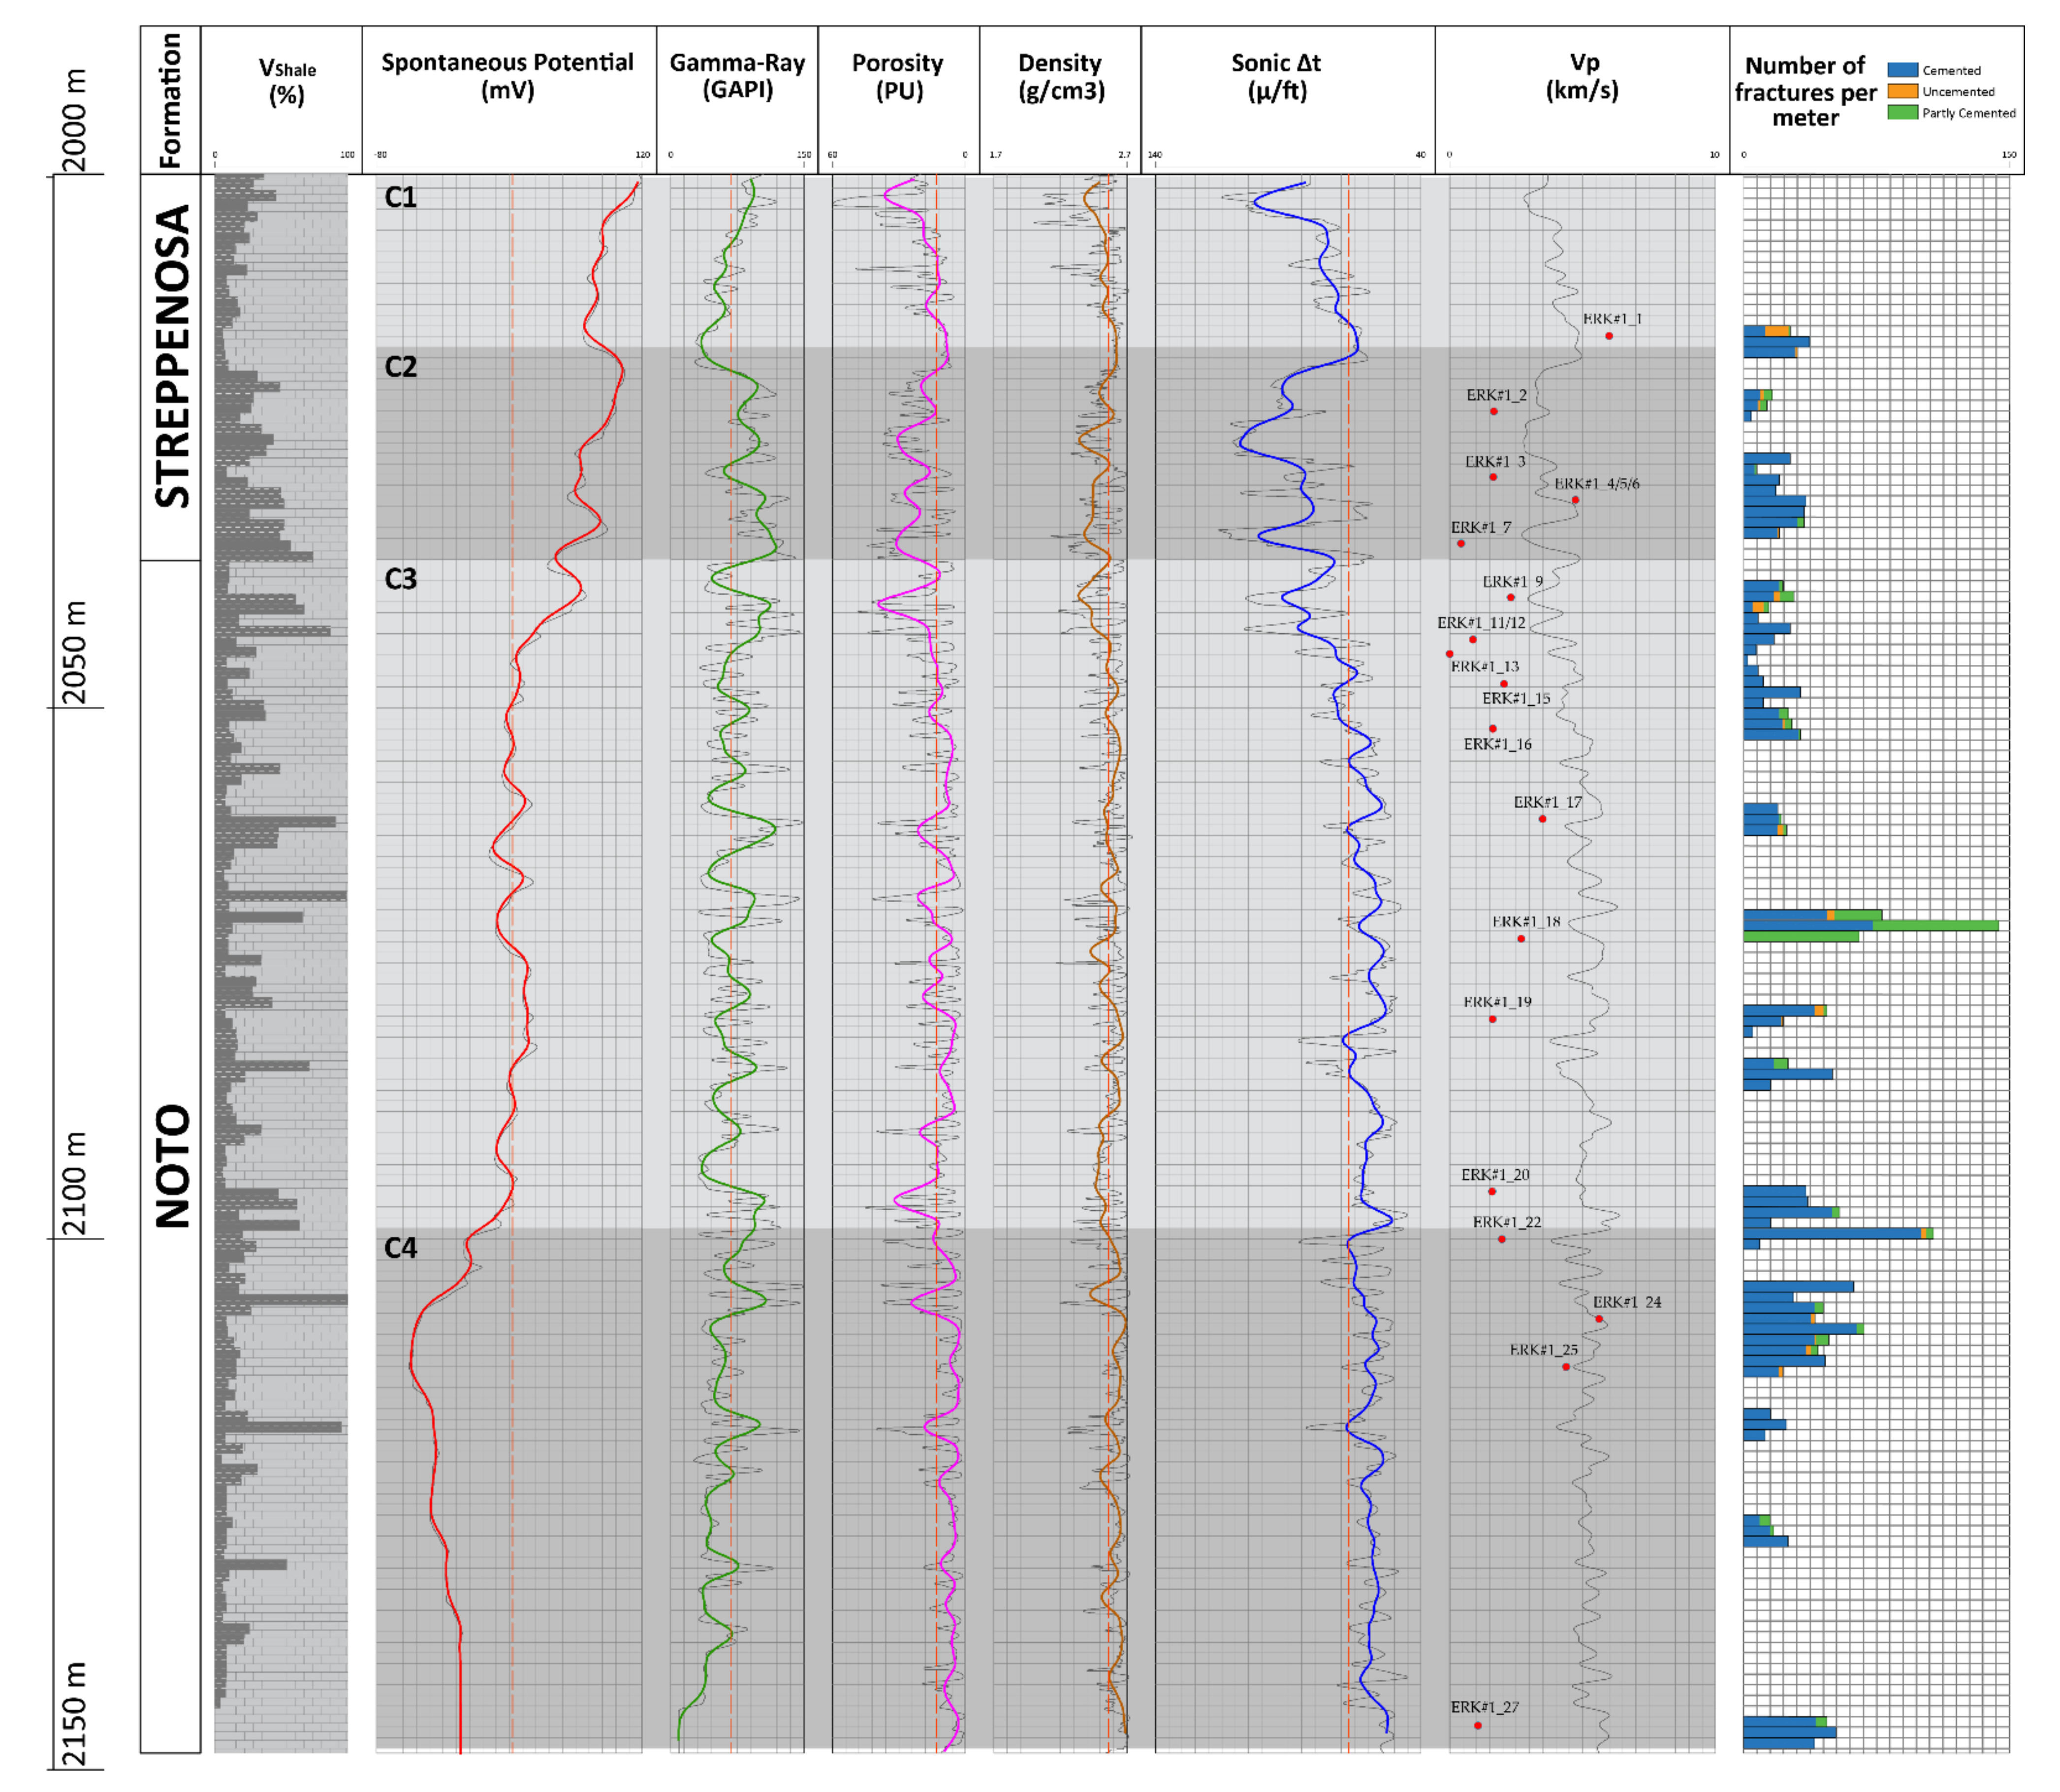
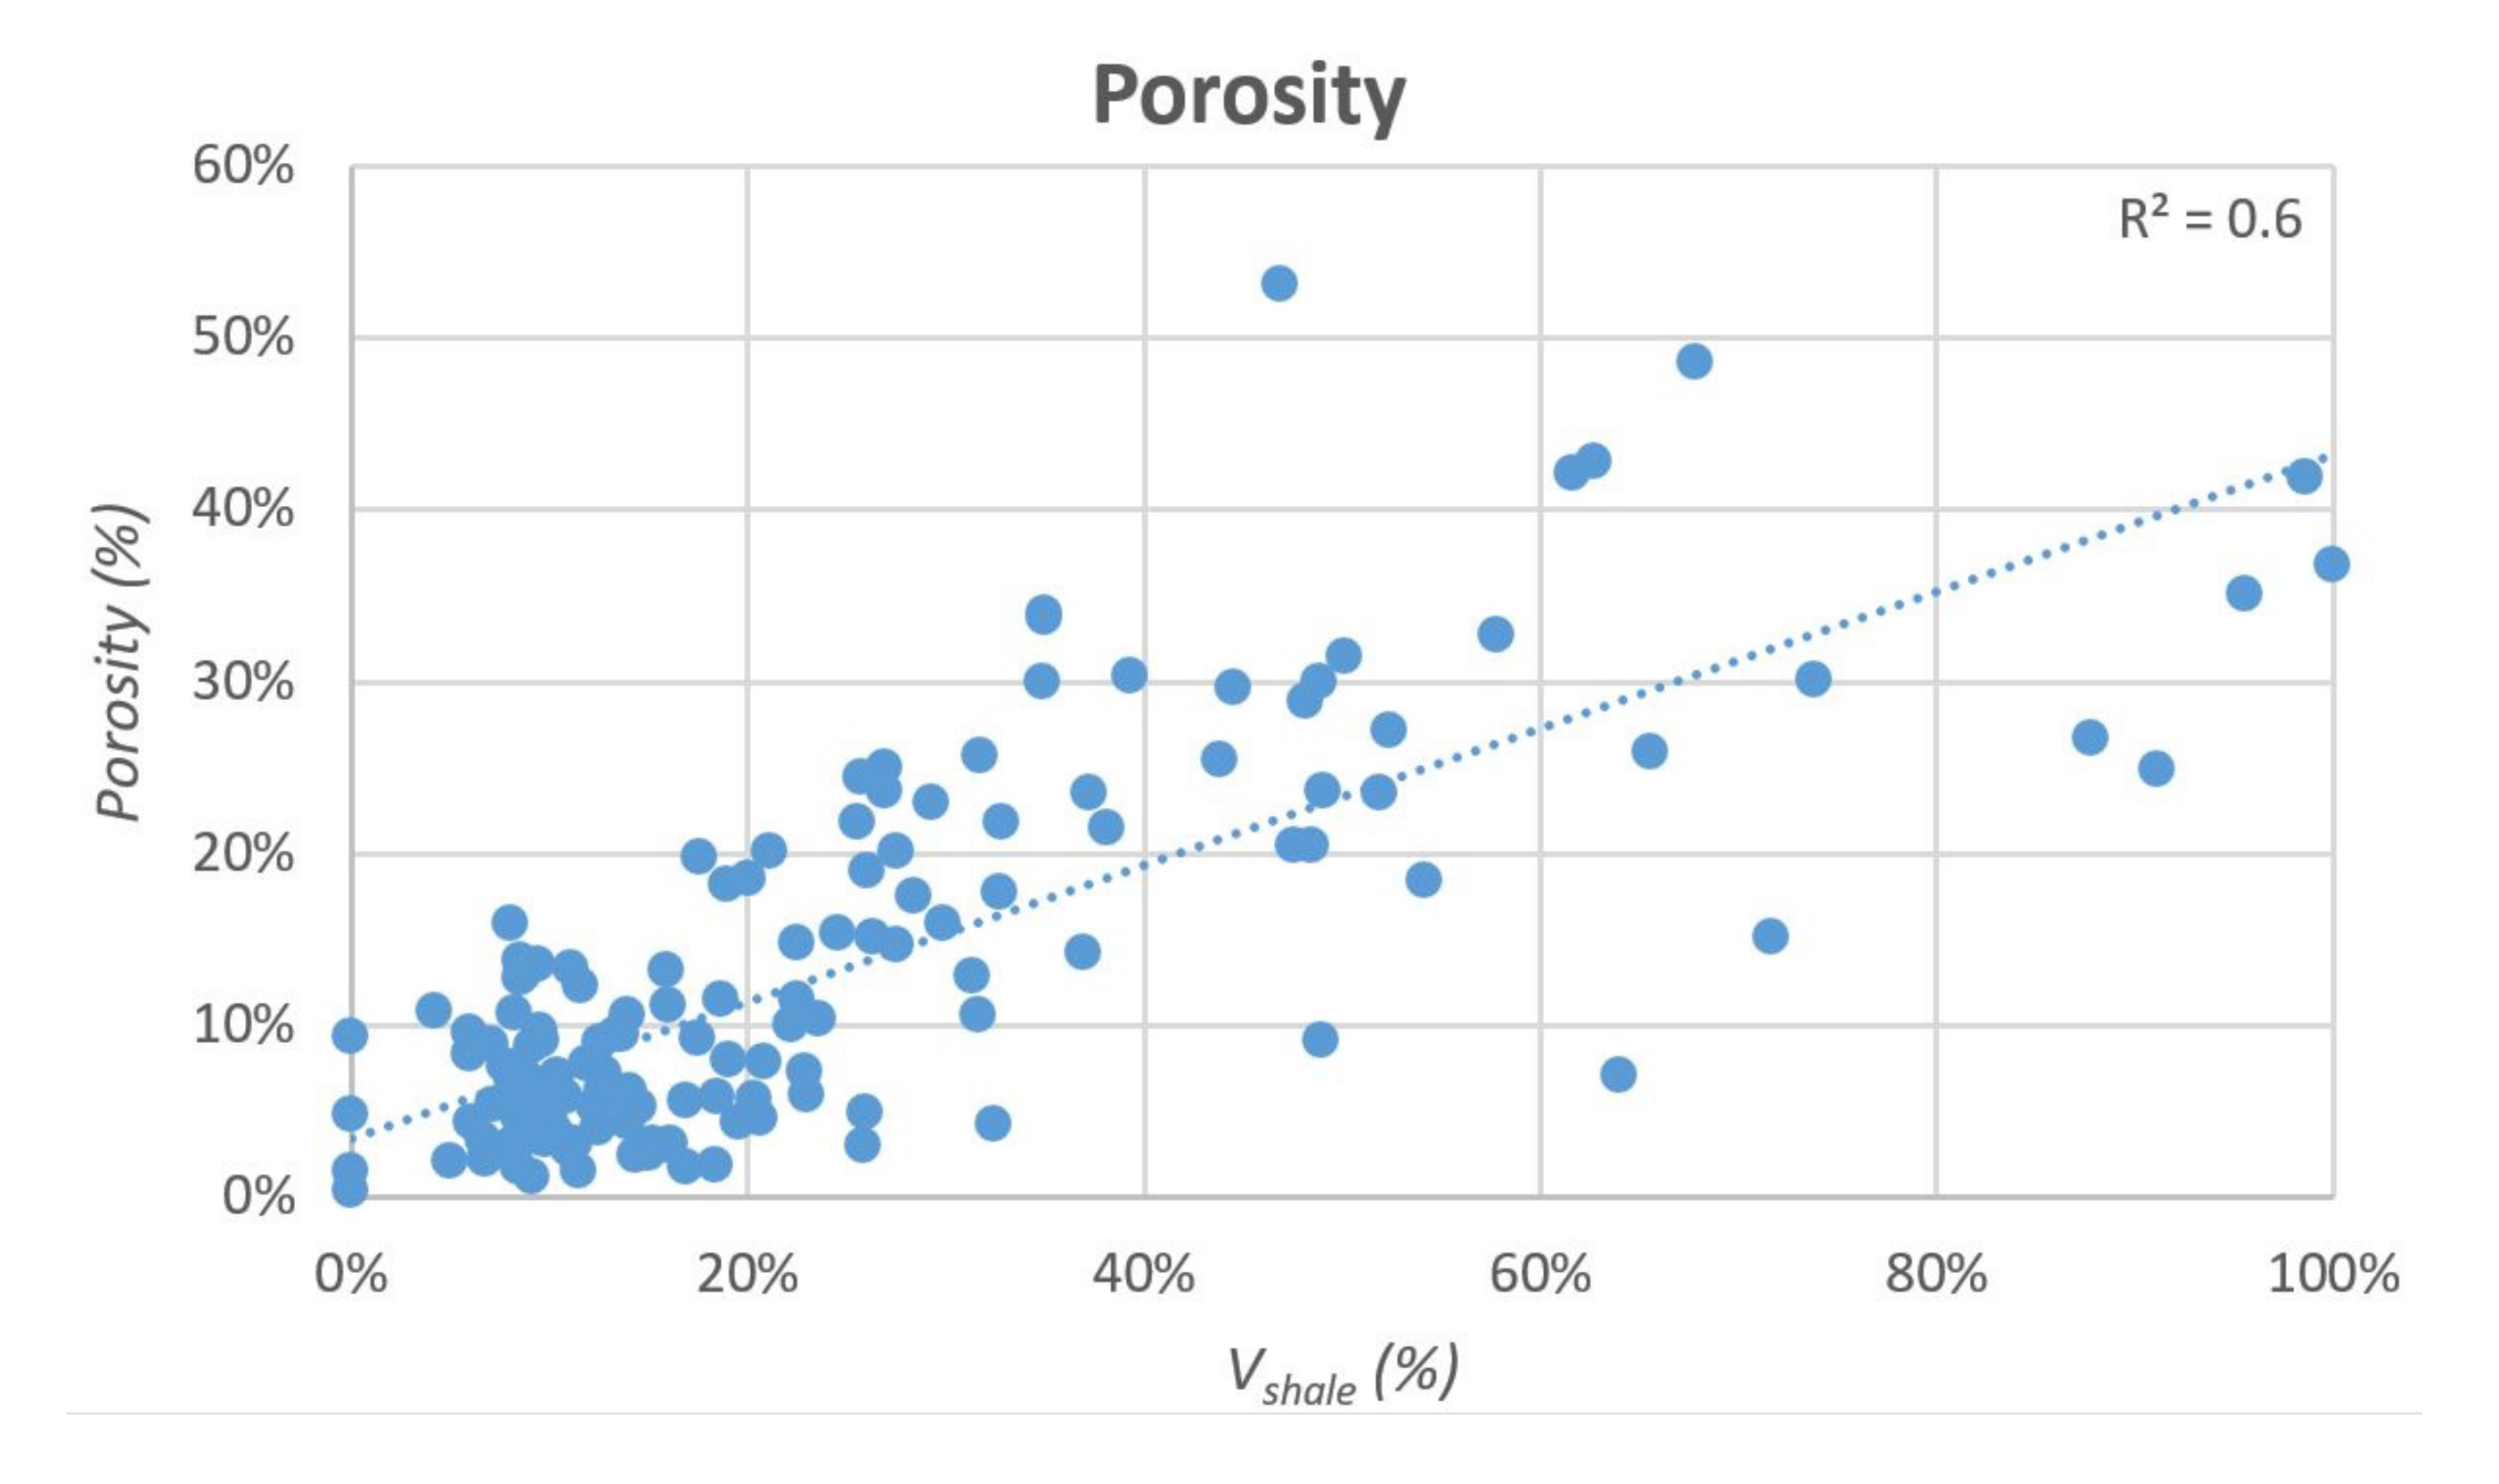
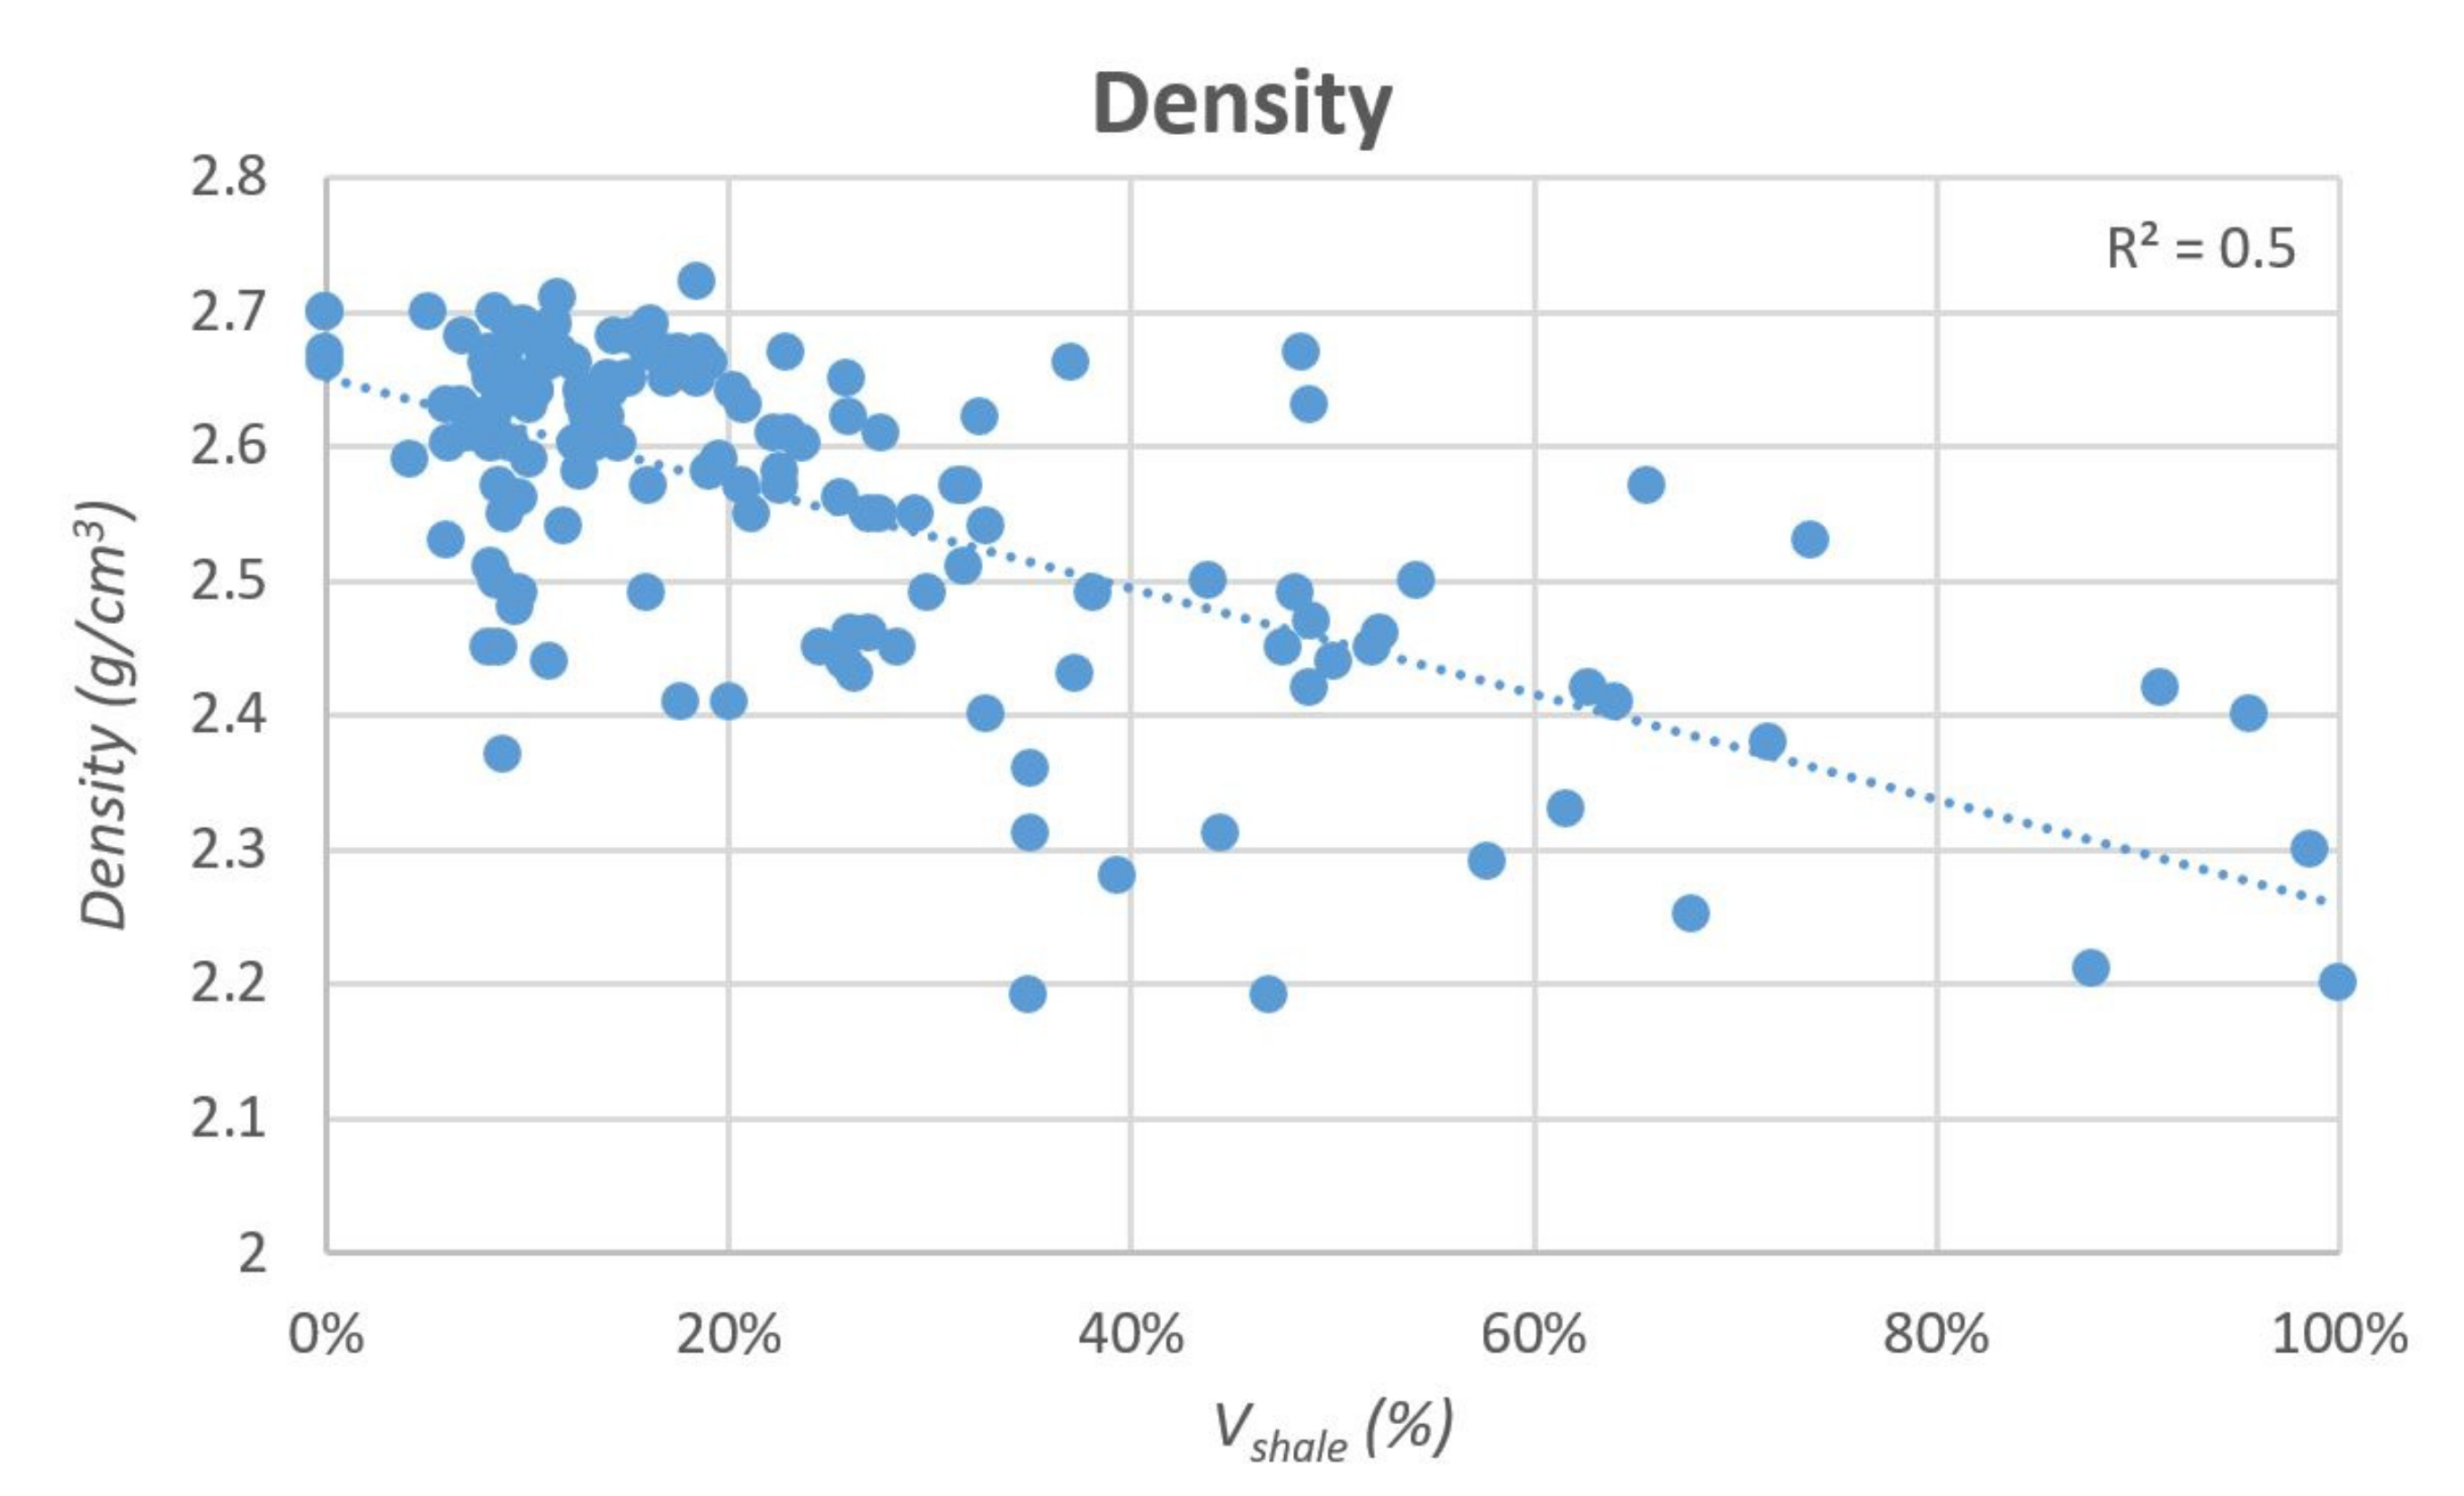
  • Log analysis confirm the good match between Vshale, gamma ray, spontaneous potential, density, Vp measured on core, and sonic log;
  • High gamma-ray values (150 GAPI) are related to high organic content (black shales);
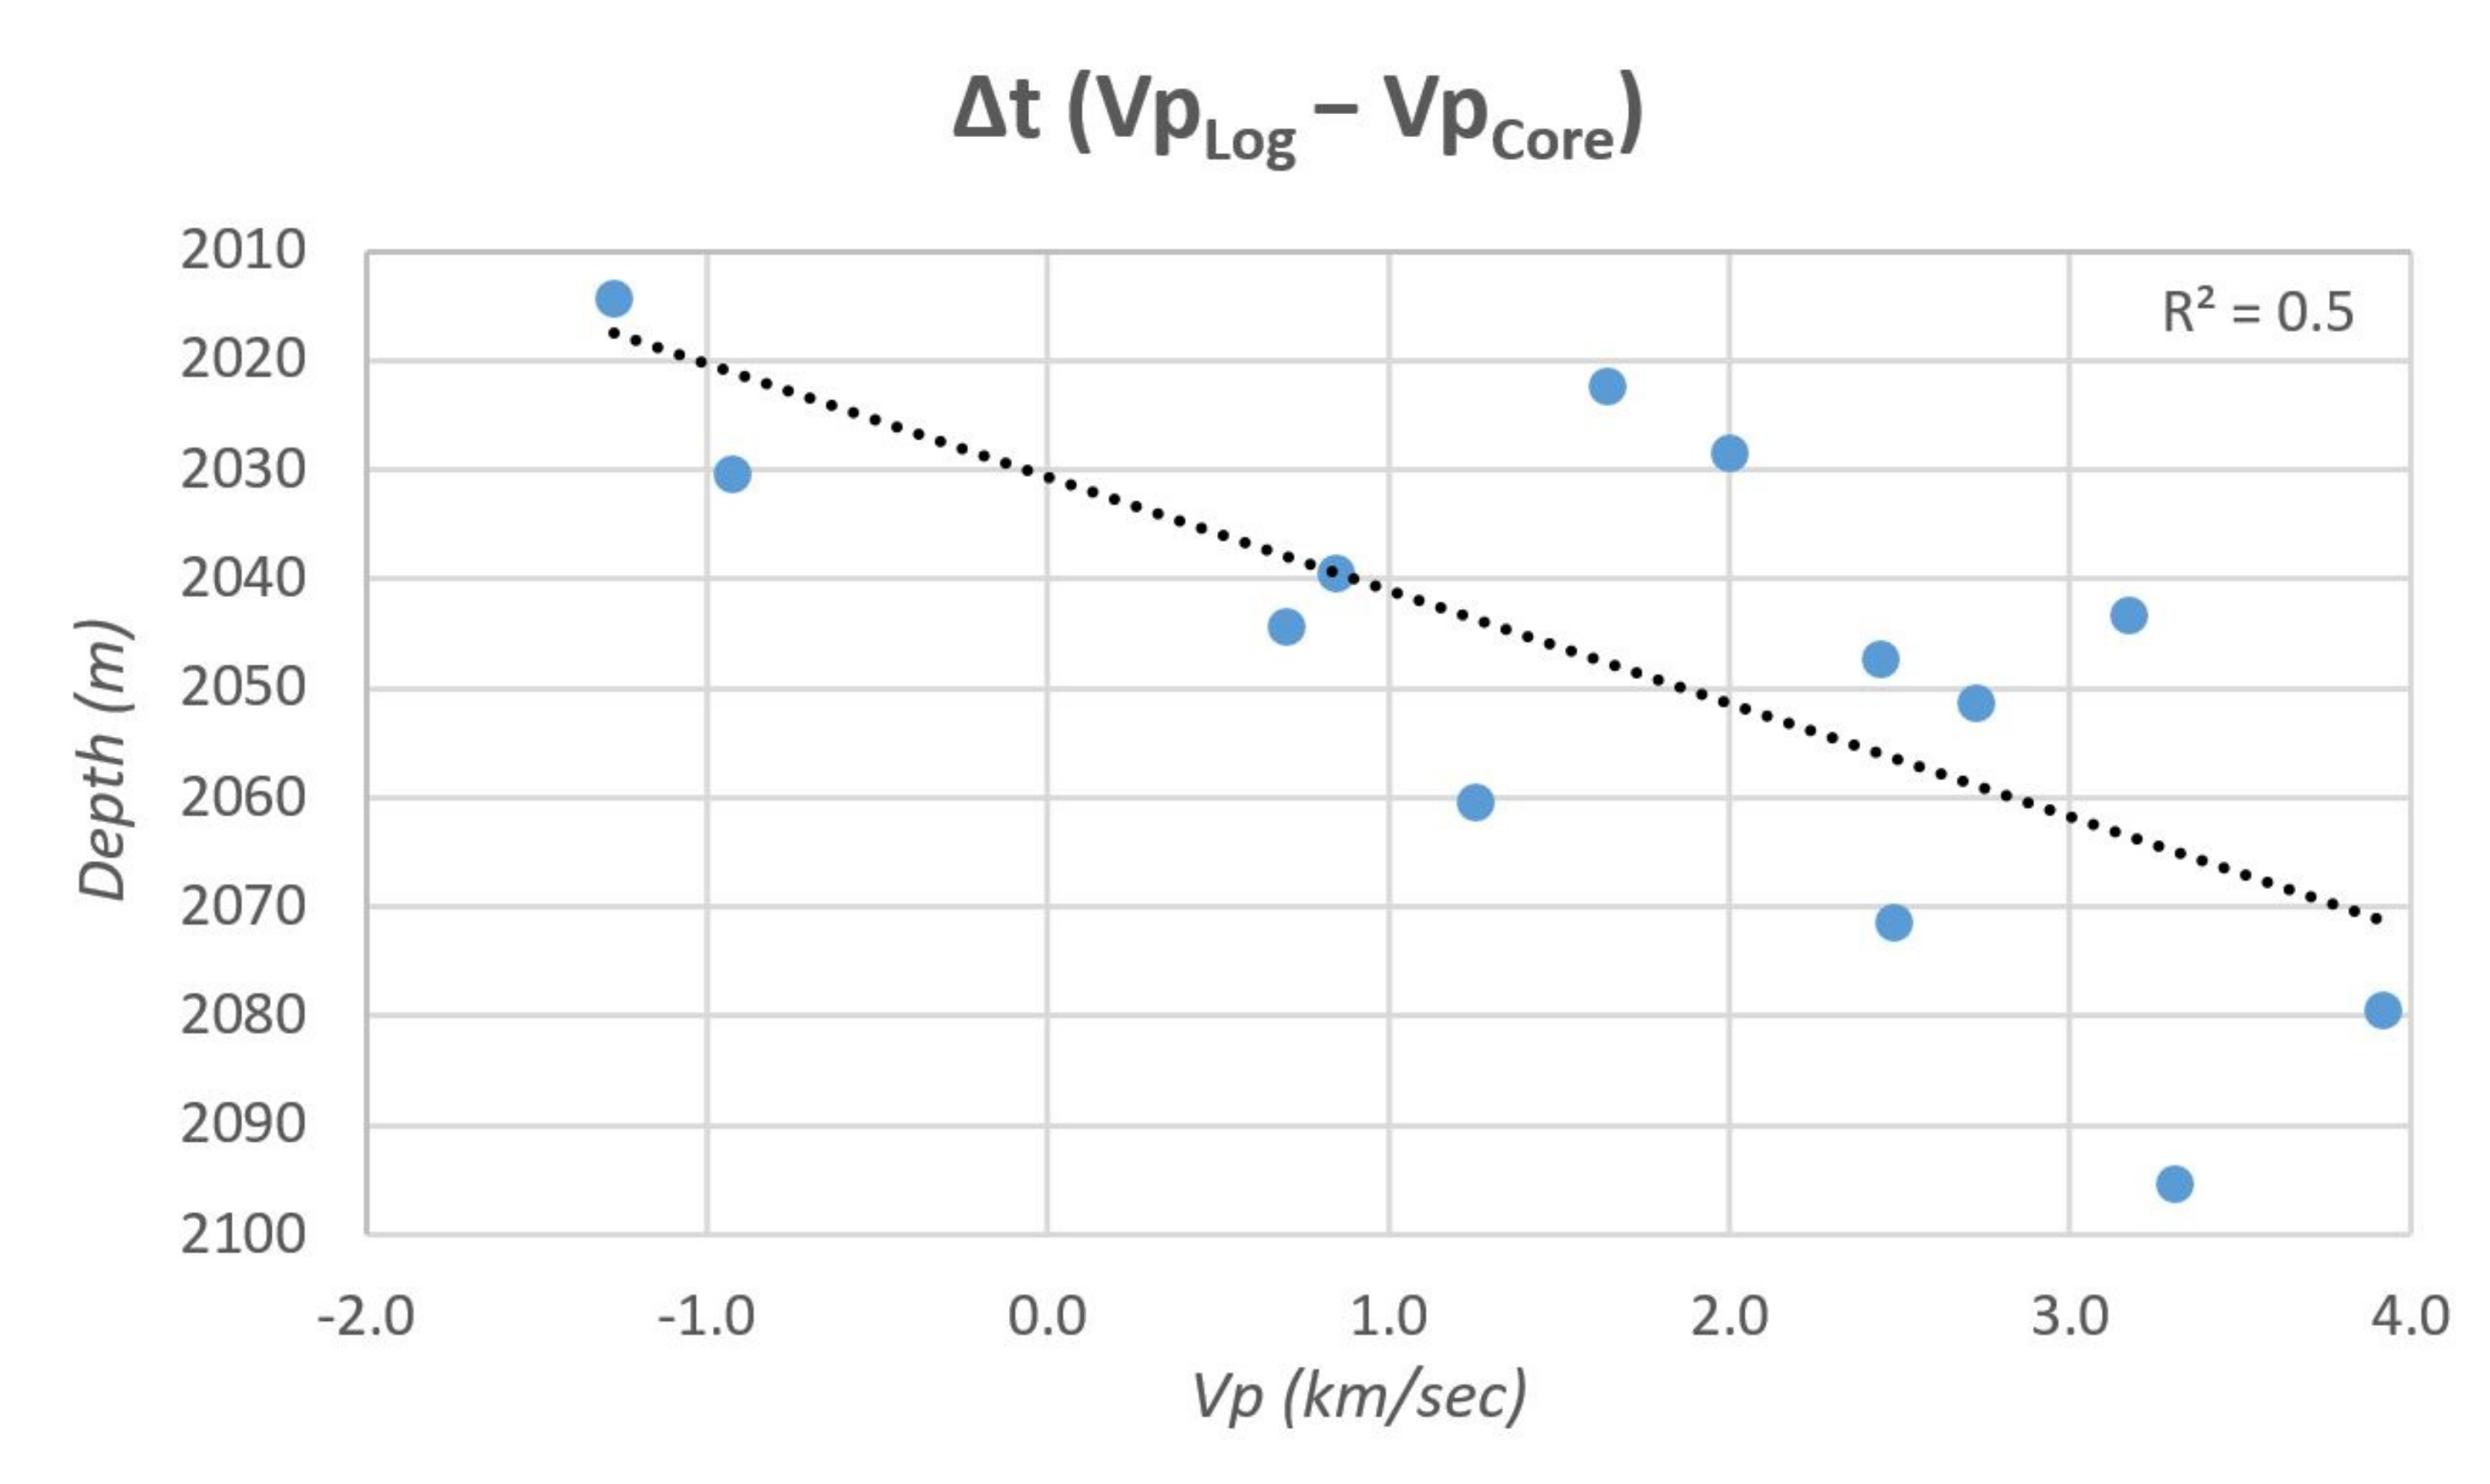
  • Compressional P wave velocity values, measured on cores, are consistently lower than those measured along the well. This is likely due to removal of the overburden and, therefore, lithostatic pressure;
  • Streppenosa and Noto Fms. have been subdivided, respectively, into two main clusters: the Streppenosa Formation, acting as seal, shows higher shale volume and a fining upward trend linked to the flooding of the platform; the Noto Fm. displays two different clusters with higher carbonate content and peaks, related to black shales intercalations.
Finally, in our opinion, our multi-scale, multidisciplinary study was successful in depicting the facies, microstructures, and main petrophysical characteristics of heterogenous carbonate reservoir rocks. Such methodology stresses the significance of investigating the sedimentary, diagenetic, tectonic features, and their genesis and evolution over geological times. This work paves the way for further thorough estimations of permeability and fluid pathways in both fracture- and stylolites-rich rocks. Therefore, it may be adopted by other studies focused on gas reservoirs in energy transition times.

Supplementary Materials

The following supporting information can be downloaded at: https://www.mdpi.com/article/10.3390/geosciences12040149/s1. Measurable parameters: bedding, fractures length, aperture, filling, frequency, and orientation.

Author Contributions

R.M., A.D.S. and A.G.P. described the cores, A.G.P. and M.F. drew the logs; R.M., A.R., R.P., E.F. and R.C. described the thin sections; R.P. and E.F. carried out seismic velocity investigation on cores; A.R. and S.M. described the microstructures and collected structural data; S.D. and S.M. elaborated and interpreted petrophysical data from cores and well logs; G.L., G.S.L., R.P. and E.F. performed micro-CT analyses. G.L. and G.S.L. processed microtomography and made 3D rendering; A.R., E.F., R.M. and S.D. interpreted structural data and wrote the paper; R.M., E.F. and R.P. supervised; R.M., E.F., A.D.S. and R.P. reviewed and edited the paper; R.M., E.F., A.D.S., R.P. and G.P. validated the paper. All authors have read and agreed to the published version of the manuscript.

Funding

This work was supported by a Joint Venture between of University of Catania and Maurel et Prom Italia. This work was also partially funded by the University of Catania, Piano di incentivi per la ricerca di Ateneo 2020/2022 (Pia.ce.ri.) linea 2 (Projects “DATASET”, Scientific Responsible R.M., n. 22722132151 and “GeoPetroMat” n. 22722132153). Thin sections were prepared both at Laboratorio di Sezioni Sottili of the Department of Biological, Geological and Environmental sciences of the University of Catania and University of Milan and provided sample preparation for microtomography analyses. Measurements at Elettra synchrotron were carried out in the frame of the proposal (20195100) entitled: “Investigation on porosity and permeability of asphalt-bearing limestones from the Noto formation (South-East Sicily, Italy)”, Scientific responsible: R.P.

Data Availability Statement

Not applicable.

Acknowledgments

The manuscript benefited of comments and suggestions of the Academic Editor, Michele Morsilli, and two anonymous reviewers. We would like to thank Pablo Liemann, Andang Bachtiar, Frederic Assouline and Emmanuel Couprie (Maurel et Prom, France) for vivid discussions in the fields and the great support for the advancement of the research.

Conflicts of Interest

The authors declare no conflict of interest.

References

  1. Di Grande, A.; Grasso, M.; Romeo, M. Stratigrafia dei terreni affioranti nei dintorni di Ragusa. Riv. Ital. Paleontol. Stratigr. 1977, 83, 137–177. [Google Scholar]
  2. Carbone, S.; Grasso, M.; Lentini, F. Considerazioni sull'evoluzione geodinamica della Sicilia sud-orientale dal Cretaceo al Quaternario. Mem. Soc. Geol. Ital. 1982, 24, 367–386. [Google Scholar]
  3. Carbone, S.; Grasso, M.; Lentini, F. Lineamenti geologici del Plateau Ibleo (Sicilia SE). Presentazione della carta geologica della Sicilia sud-orientale. Mem. Soc. Geol. Ital. 1987, 38, 127–135. [Google Scholar]
  4. Grasso, M.; Pedley, H.M.; Maniscalco, R.; Ruggieri, R. Geological context and explanatory notes of the Carta geologica del settore centro-meridionale dell’altopiano Ibleo. Mem. Soc. Geol. Ital. 2000, 55, 45–52. [Google Scholar]
  5. Granath, J.W.; Casero, P. Tectonic setting of the petroleum systems of Sicily. In Deformation, Fluid Flow, and Reservoir Appraisal in Foreland Fold and Thrust Belts; Swennen, R., Roure, F., Granath, J.W., Eds.; AAPG Hedberg Series; AAPG: Tulsa, OK, USA, 2004; Volume 1, pp. 391–411. [Google Scholar]
  6. Lee, H.; Lee, S.G.; Doyle, P.S. Photopatterned oil-reservoir micromodels with tailored wetting properties. Lab Chip 2015, 15, 3047–3055. [Google Scholar] [CrossRef] [PubMed] [Green Version]
  7. Ezati, M.; Azizzadeh, M.; Riahi, M.A.; Fattahpour, V.; Honarmand, J. Characterization of micro-fractures in carbonate Sarvak reservoir, using petrophysical and geological data, SW Iran. J. Petrol. Sci. Eng. 2018, 170, 675–695. [Google Scholar] [CrossRef]
  8. Aydin, A. Fractures, faults, and hydrocarbon entrapment, migration and flow. Mar. Pet. Geol. 2000, 17, 797–814. [Google Scholar] [CrossRef]
  9. Cooper, M. Structural style and hydrocarbon prospectivity in fold and thrust belts: A global review. Spec. Publ. Geol. Soc. Lond. 2007, 272, 447. [Google Scholar] [CrossRef]
  10. Garland, C.R.; Abalioglu, I.; Akca, L.; Cassidy, A.; Chiffoleau, Y.; Godail, L.; Grace, M.A.S.; Kader, J.H.; Khalek, F.; Legarre, H.; et al. Appraisal and development of the Taq field, Kurdistan region, Iraq. In Geological Society, Petroleum Geology Conference Series; Geological Society of London: London, UK, 2010; Volume 7, pp. 801–810. [Google Scholar]
  11. Al-Qayim, B.; Rashid, F. Reservoir characteristics of the Albian upper Qamchuqa Formation carbonates, Taq Taq oilfield, Kurdistan, Iraq. J. Petrol. Geol. 2012, 35, 317–341. [Google Scholar] [CrossRef]
  12. Al-Qayim, B.; Othman, D. Reservoir characterization of an intra-orogenic carbonates platform: Pila Spi Formation, Taq Taq oil field, Kurdistan, Iraq. Geol. Soc. Lond. Spec. Publ. 2012, 370, 139–168. [Google Scholar] [CrossRef]
  13. Lamarche, J.; Lavenu, A.P.; Gauthier, B.D.; Guglielmi, Y.; Jayet, O. Relationships between fracture patterns, geodynamics and mechanical stratigraphy in Carbonates (South-East Basin, France). Tectonophysics 2012, 581, 231–245. [Google Scholar] [CrossRef]
  14. Lavenu, A.P.; Lamarche, J.; Salardon, R.; Gallois, A.; Marié, L.; Gauthier, B.D. Relating background fractures to diagenesis and rock physical properties in a platform–slope transect. Example of the Maiella Mountain (central Italy). Mar. Petrol. Geol. 2014, 51, 2–19. [Google Scholar] [CrossRef]
  15. Zebari, M.M.; Burberry, C.M. 4-D evolution of anticlines and implications for hydrocarbon exploration within the Zagros Fold-Thrust Belt, Kurdistan Region, Iraq. GeoArabia 2015, 20, 161–188. [Google Scholar] [CrossRef]
  16. Rashid, F.; Hussein, D.; Lawrence, J.A.; Khanaqa, P. Characterization and impact on reservoir quality of fractures in the Cretaceous Qamchuqa Formation, Zagros folded belt. Mar. Petrol. Geol. 2020, 113, 104117. [Google Scholar] [CrossRef]
  17. Ahr, W.M. Geology of Carbonate Reservoirs: The Identification, Description and Characterization of Hydrocarbon Reservoirs in Carbonate Rocks; John Wiley & Sons: Hoboken, NJ, USA, 2011. [Google Scholar]
  18. Gambino, S.; Fazio, E.; Maniscalco, R.; Punturo, R.; Lanzafame, G.; Barreca, G.; Butler, R.W.H. Fold-related deformation bands in a weakly buried sandstone reservoir analogue: A multi-disciplinary case study from the Numidian (Miocene) of Sicily (Italy). J. Struct. Geol. 2019, 118, 150–164. [Google Scholar] [CrossRef] [Green Version]
  19. Neuzil, C.E.; Tracy, J.V. Flow through fractures. Water Resour. Res. 1981, 17, 191–199. [Google Scholar] [CrossRef]
  20. Laubach, S.E. Practical approaches to identifying sealed and open fractures. AAPG Bull. 2003, 87, 561–579. [Google Scholar] [CrossRef]
  21. Barr, D.; Savory, K.E.; Fowler, S.R.; Arman, K.; McGarrity, J.P. Pre-development fracture modelling in the Clair field, west of Shetland. Geol. Soc. Lond. Spec. Publ. 2007, 270, 205–225. [Google Scholar] [CrossRef]
  22. Agosta, F.; Alessandroni, M.; Antonellini, M.; Tondi, E.; Giorgioni, M. From fractures to flow: A field-based quantitative analysis of an outcropping carbonate reservoir. Tectonophysics 2010, 490, 197–213. [Google Scholar] [CrossRef]
  23. Solano, N.; Zambrano, L.; Aguilera, R. Cumulative Gas Production Distribution on the Nikanassin Tight Gas Formation, Alberta and British Columbia, Canada. SPE Res. Eval. Eng. 2011, 14, 357–376. [Google Scholar] [CrossRef]
  24. Korneva, I.; Tondi, E.; Agosta, F.; Rustichelli, A.; Spina, V.; Bitonte, R.; Di Cuia, R. Structural properties of fractured and faulted Cretaceous platform carbonates, Murge Plateau (southern Italy). Mar. Petrol. Geol. 2014, 57, 312–326. [Google Scholar] [CrossRef]
  25. Rashid, F.; Glover, P.W.J.; Lorinczi, P.; Collier, R.; Lawrence, J. Porosity and permeability of tight carbonate reservoir rocks in the north of Iraq. J. Petrol. Sci. Eng. 2015, 133, 147–161. [Google Scholar] [CrossRef] [Green Version]
  26. Rashid, F.; Glover, P.W.J.; Lorinczi, P.; Hussein, D.; Collier, R.; Lawrence, J. Permeability prediction in tight carbonate rocks using capillary pressure measurements. Mar. Petrol. Geol. 2015, 68, 536–550. [Google Scholar] [CrossRef]
  27. Rashid, F.; Glover, P.W.J.; Lorinczi, P.; Hussein, D.; Lawrence, J.A. Microstructural controls on reservoir quality in tight oil carbonate reservoir rocks. J. Petrol. Sci. Eng. 2017, 156, 814–826. [Google Scholar] [CrossRef]
  28. Dashti, R.; Rahimpour-Bonab, H.; Zeinali, M. Fracture and mechanical stratigraphy in naturally fractured carbonate reservoirs—A case study from Zagros region. Mar. Petrol. Geol. 2018, 97, 466–479. [Google Scholar] [CrossRef]
  29. Borrelli, M.; Campilongo, G.; Critelli, S.; Perrotta, D.I.; Perri, E. 3D nanopores modeling using TEM-tomography (dolostones-Upper Triassic). Mar. Petrol. Geol. 2019, 99, 443–452. [Google Scholar] [CrossRef]
  30. Radwan, A.E.; Trippetta, F.; Kassem, A.A.; Kania, M. Multi-scale characterization of unconventional tight carbonate reservoir: Insights from October oil filed, Gulf of Suez rift basin, Egypt. J. Petrol. Sci. Eng. 2021, 197, 107968. [Google Scholar] [CrossRef]
  31. Huntoon, P.W.; Lundy, D.A. Fracture-controlled ground-water circulation and well siting in the vicinity of Laramie, Wyoming. Groundwater 1979, 17, 463–469. [Google Scholar] [CrossRef]
  32. Maarten, V.; Exner, U.; Barnhoorn, A.; Baud, P.; Reuschlé, T. Porosity, permeability and 3D fracture network characterisation of dolomite reservoir rock samples. J. Pet. Sci. Eng. 2015, 127, 1270–1285. [Google Scholar]
  33. Miranda, T.S.; Santos, R.F.; Barbosa, J.A.; Gomes, I.F.; Alencar, M.L.; Correia, O.J.; Falcao, T.C.; Gale, J.F.W.; Neumann, V.H. Quantifying aperture, spacing and fracture intensity in a carbonate reservoir analogue: Crato Formation, NE Brazil. Mar. Petrol. Geol. 2018, 97, 556–567. [Google Scholar] [CrossRef]
  34. Shehata, A.A.; Kassem, A.A.; Brooks, H.L.; Zuchuat, V.; Radwan, A.E. Facies analysis and sequence-stratigraphic control on reservoir architecture: Example from mixed carbonate/siliciclastic sediments of Raha Formation, Gulf of Suez, Egypt. Mar. Petrol. Geol. 2021, 131, 105160. [Google Scholar] [CrossRef]
  35. Price, N.J. Fault and Joint Development in Brittle and Semi-Brittle Rock; Pergamon Press: Oxford, UK, 1966; p. 176. [Google Scholar]
  36. Ramsay, J.G. Folding and Fracturing of Rocks; Mc Graw Hill Book Company: New York, NY, USA, 1967; p. 568. [Google Scholar]
  37. Hancock, P.L. Brittle microtectonics: Principles and practice. J. Struct. Geol. 1985, 7, 437–457. [Google Scholar] [CrossRef]
  38. Ramsay, J.G.; Huber, M.I. The Techniques of Modern Structural Geology: Volume 2 Folds and Fractures; Academic Press: London, UK; Orlando, FL, USA; San Diego, CA, USA; New York, NY, USA; Austin, TX, USA; Boston, MA, USA; Sydney, Australia; Tokyo, Japan; Toronto, ON, USA, 1987. [Google Scholar]
  39. Singh, S.K.; Akbar, M.; Khan, B.; Abu-Habbiel, H.; Montaron, B.; Sonneland, L.; Godfrey, R. Characterizing Fracture Corridors for a Large Carbonate Field of Kuwait by Integrating Borehole Data with the 3-D Surface Seismic; AAPG Search and Discovery Article: Denver, CO, USA, 2009. [Google Scholar]
  40. Dietrich, D.; McKenzie, J.A.; Song, H. Origin of calcite in syntectonic veins as determined from carbon-isotope ratios. Geology 1983, 11, 547–551. [Google Scholar] [CrossRef]
  41. Barker, S.L.; Cox, S.F.; Eggins, S.M.; Gagan, M.K. Microchemical evidence for episodic growth of antitaxial veins during fracture-controlled fluid flow. Earth Planet. Sci. Lett. 2006, 250, 331–344. [Google Scholar] [CrossRef]
  42. Rustichelli, A.; Tondi, E.; Korneva, I.; Baud, P.; Vinciguerra, S.; Agosta, F.; Reuschlé, T.; Janiseck, J.M. Bedding-parallel stylolites in shallow-water limestone successions of the Apulian Carbonate Platform (central-southern Italy). Ital. J. Geosci. 2015, 134, 513–534. [Google Scholar] [CrossRef]
  43. Park, W.C.; Schot, E.H. Stylolites; their nature and origin. J. Sediment. Res. 1968, 38, 175–191. [Google Scholar]
  44. Buxton, T.M.; Sibley, D.F. Pressure solution features in a shallow buried limestone. J. Sediment. Res. 1981, 51, 19–26. [Google Scholar] [CrossRef]
  45. Railsback, L.B. Lithologic controls on morphology of pressure-dissolution surfaces (stylolites and dissolution seams) in Paleozoic carbonate rocks from the mid-eastern United States. J. Sediment. Res. 1993, 63, 513–522. [Google Scholar] [CrossRef]
  46. Tada, R.; Siever, R. Pressure solution during diagenesis. Annu. Rev. Earth Pl. Sci. 1989, 17, 89. [Google Scholar] [CrossRef]
  47. Bathurst, R.J.; Karpurapu, R. Large-scale triaxial compression testing of geocell-reinforced granular soils. Geotech. Test. J. 1993, 16, 296–303. [Google Scholar]
  48. Toussaint, R.; Aharonov, E.; Koehn, D.; Gratier, J.P.; Ebner, M.; Baud, P.; Rolland, A.; Renard, F. Stylolites: A review. J. Struct. Geol. 2018, 114, 163–195. [Google Scholar] [CrossRef] [Green Version]
  49. Koehn, D.; Renard, F.; Toussaint, R.; Passchier, C.W. Growth of stylolite teeth patterns depending on normal stress and finite compaction. Earth Planet. Sci. Lett. 2007, 257, 582–595. [Google Scholar] [CrossRef] [Green Version]
  50. Ben-Itzhak, L.L.; Aharonov, E.; Toussaint, R.; Sagy, A. Upper bound on stylolite roughness as indicator for amount of dissolution. Earth Planet. Sci. Lett. 2012, 337, 186–196. [Google Scholar] [CrossRef] [Green Version]
  51. Fletcher, R.C.; Pollard, D.D. Anticrack model for pressure solution surfaces. Geology 1981, 9, 419–424. [Google Scholar] [CrossRef]
  52. Bathurst, R.G. Burial diagenesis of limestones under simple overburden; stylolites, cementation and feedback. Bull. Soc. Géol. Fr. 1995, 166, 181–192. [Google Scholar]
  53. Rolland, A.; Toussaint, R.; Baud, P.; Schmittbuhl, J.; Conil, N.; Koehn, D.; Renard, F.; Gratier, J.P. Modeling the growth of stylolites in sedimentary rocks. J. Geoph. Res. Solid Earth 2012, 117. [Google Scholar] [CrossRef] [Green Version]
  54. Bathurst, R.G. Diagenetically enhanced bedding in argillaceous platform limestones: Stratified cementation and selective compaction. Sedimentology 1987, 34, 749–778. [Google Scholar] [CrossRef]
  55. Zhang, X.; Spiers, C.J. Compaction of granular calcite by pressure solution at room temperature and effects of pore fluid chemistry. Int. J. Rock Mech. Min. Sci. 2005, 42, 950–960. [Google Scholar] [CrossRef]
  56. Burgess, C.J.; Peter, C.K. Formation, distribution, and prediction of stylolites as permeability barriers in the Thamama Group, Abu Dhabi. In Proceedings of the Middle East Oil Technical Conference and Exhibition, Manama, Bahrain, 11–14 March 1985; Volume 42, pp. 950–960. [Google Scholar]
  57. Koepnick, R.B. Distribution and permeability of stylolite-bearing horizons within a Lower Cretaceous carbonate reservoir in the Middle East. SPE Form. Eval. 1987, 2, 137–142. [Google Scholar] [CrossRef]
  58. Carozzi, A.V.; Bergen, D.V. Stylolitic porosity in carbonates: A critical factor for deep hydrocarbon production. J. Petrol. Geol. 1987, 10, 267–282. [Google Scholar] [CrossRef]
  59. Baron, M.; Parnell, J. Relationships between stylolites and cementation in sandstone reservoirs: Examples from the North Sea, UK and East Greenland. Sediment. Geol. 2007, 194, 17–35. [Google Scholar] [CrossRef]
  60. Lucia, F.J. Rock-fabric/petrophysical classification of carbonate pore space for reservoir characterization. AAPG Bull. 1995, 79, 1275–1300. [Google Scholar]
  61. Cochard, J.; Léonide, P.; Borgomano, J.; Guglielmi, Y.; Massonnat, G.; Rolando, J.P.; Marié, L.; Pasquier, A. Reservoir properties of Barremian–Aptian Urgonian limestones, SE France, Part 1: Influence of structural history on porosity-permeability variations. J. Petrol. Geol. 2020, 43, 75–94. [Google Scholar] [CrossRef]
  62. Narr, W. Estimating average fracture spacing in subsurface rock. AAPG Bull. 1996, 80, 1565–1585. [Google Scholar]
  63. Zeeb, C.; Gomez-Rivas, E.; Bons, P.D.; Blum, P. Evaluation of sampling methods for fracture network characterization using outcrops. AAPG Bull. 2013, 97, 1545–1566. [Google Scholar] [CrossRef]
  64. Eberli, G.P.; Baechle, G.T.; Anselmetti, F.S.; Incze, M.L. Factors controlling elastic properties in carbonate sediments and rocks. Leading Edge 2003, 22, 654–660. [Google Scholar] [CrossRef]
  65. Peacock, D.C.P.; Harris, S.D.; Mauldon, M. Use of curved scanlines and boreholes to predict fracture frequencies. J. Struct. Geol. 2003, 25, 109–119. [Google Scholar] [CrossRef]
  66. Burollet, P.F.; Mugniot, G.M.; Sweeney, P. The geology of the Pelagian Block: The Margins and Basins of Southern Tunisia and Tripolitania. In The Ocean Basins and Margins; Nairn, A., Kanes, W., Stelhi, F.G., Eds.; Plenum Press: New York, NY, USA, 1978; pp. 331–339. [Google Scholar]
  67. Micallef, A.; Foglini, F.; Le Bas, T.; Angeletti, L.; Maselli, V.; Pasuto, A.; Taviani, M. The submerged paleolandscape of the Maltese Islands: Morphology, evolution and relation to Quaternary environmental change. Mar. Geol. 2013, 335, 129–147. [Google Scholar] [CrossRef]
  68. Baldassini, N.; Di Stefano, A. Stratigraphic features of the Maltese Archipelago: A synthesis. Nat. Hazards 2017, 86, 203–231. [Google Scholar] [CrossRef]
  69. Distefano, S.; Gamberi, N.F.; Baldassini, Di Stefano A. Late Miocene to Quaternary structural evolution of the Lampedusa Island offshore. Geogr. Fis. E Din. Quat. 2018, 41, 17–31. [Google Scholar]
  70. Distefano, S.; Gamberi, F.; Baldassini, N.; Di Stefano, A. Neogene stratigraphic evolution of a tectonically controlled continental shelf: The example of the Lampedusa Island. Ital. J. Geosci. 2019, 138, 418–431. [Google Scholar] [CrossRef]
  71. Lentini, F.; Carbone, S.; Catalano, S. Main structural domains of the central Mediterranean region and their Neogene tectonic evolution. Boll. Geofis. Teor. Appl. 1994, 36, 103–125. [Google Scholar]
  72. Lentini, F.; Carbone, S. Geologia della Sicilia—Geology of Sicily. Mem. Descr. Carta Geol. D’ital 2014, 95, 7–414. [Google Scholar]
  73. Patacca, E.; Scandone, P.; Giunta, G.; Liguori, V. Mesozoic paleotectonic evolution of the Ragusa zone (Southeastern Sicily). Geol. Rom. 1979, 18, 331–369. [Google Scholar]
  74. Biju-Duval, B.; Morel, Y.; Baudrimont, A.; Bizon, G.; Bizond, J.J.; Borsetti, A.M.; Burollet, P.F.; Clairefond, P.; Clauzon, G.; Colanton, P.; et al. Exemples de sédimentation condensée sur les escarpements de la mer Ionienne (Méditerranée orientale). Observations à partir du submersible Cyana. Rev. De L'Inst. Fr. Pétrole 1983, 38, 427–438. [Google Scholar] [CrossRef]
  75. Pellegrino, A.G.; Maniscalco, R.; Speranza, F.; Hernandez-Moreno, C.; Sturiale, G. Paleomagnetism of the Hyblean Plateau, Sicily: A review of the existing data set and new evidence for lack of block rotation from the Scicli-Ragusa Fault System. Ital. J. Geosci. 2016, 135, 300–307. [Google Scholar] [CrossRef]
  76. Distefano, S.; Gamberi, F.; Di Stefano, A. Stratigraphic and structural reconstruction of an offshore sector of the Hyblean Foreland ramp (southern Italy). Ital. J. Geosci. 2019, 138, 390–403. [Google Scholar] [CrossRef]
  77. Gambino, S.; Barreca, G.; Gross, F.; Monaco, C.; Krastel-Gudegast, S.; Gutscher, M.A. Deformation Pattern of the Northern Sector of the Malta Escarpment (Offshore SE Sicily, Italy): Fault Dimension, Slip Prediction, and Seismotectonic Implications. Front. Earth Sci. 2021, 8, 613. [Google Scholar] [CrossRef]
  78. Schmincke, H.U.; Behncke, B.; Grasso, M.; Raffi, S. Evolution of the northwestern Iblean Mountains, Sicily: Uplift, Pliocene/Pleistocene sea-level changes, paleoenvironment, and volcanism. Geol. Rundsch. 1997, 86, 637–669. [Google Scholar] [CrossRef]
  79. Punturo, R.; Kern, H.; Scribano, V.; Atzori, P. Petrophysical and petrological characteristics of deep-seated xenoliths from the Hyblean Plateau, south-eastern Sicily, Italy: Suggestions for a lithospheric model. Miner. Petrogr. Acta 2000, 43, 1–20. [Google Scholar]
  80. Punturo, R. Contribution to the knowledge of the Hyblean lithosphere (southeastern Sicily, Italy): The petrophysical approach. Rend. Online Soc. Geol. Ital. 2010, 11, 103–104. [Google Scholar]
  81. Punturo, R. Contribution to a possible reconstruction of the Hyblean lithospheric column on the basis of deep-seated xenoliths from Miocene tuff breccias. Rend. Online Soc. Geol. Ital. 2012, 21, 144–145. [Google Scholar]
  82. Yellin-Dror, A.; Grasso, M.; Ben-Avraham, Z.; Tibor, G. The subsidence history of the northern Hyblean plateau margin, southeastern Sicily. Tectonophysics 1997, 282, 277–289. [Google Scholar] [CrossRef]
  83. Catalano, S.; Romagnoli, G.; Tortorici, G. Kinematics and dynamics of the late Quaternary rift-flank deformation in the Hyblean Plateau (SE Sicily). Tectonophysics 2010, 486, 1–14. [Google Scholar] [CrossRef]
  84. Bonforte, A.; Catalano, S.; Maniscalco, R.; Pavano, F.; Romagnoli, G.; Sturiale, G.; Tortorici, G. Geological and Geodetic Constraints on the Deformation along the Active Northern Margin of the Hyblean Plateau (Se Sicily). Tectonophysics 2015, 640–641, 80–89. [Google Scholar] [CrossRef]
  85. Punturo, R.; Sturiale, G.; Vaccaro, C.; Cirrincione, R.; Mustica, A. Integrated geological and petrographic study supporting the interpretation of ancient artefacts: The case history of Palagonia area (SE Sicily). Ital. J. Geosci. 2013, 132, 263–273. [Google Scholar] [CrossRef]
  86. Kafka, F.T.; Kirkbride, R.K. The Ragusa oil field, Sicily. In Proceedings of the Fifth World Petroleum Congress, New York, NY, USA, 1–5 June 1959; Volume 1, pp. 233–257. [Google Scholar]
  87. Cirilli, S.; Panfili, G.; Buratti, N.; Frixa, A. Paleoenvironmental reconstruction by means of palynofacies and lithofacies analyses: An example from the Upper Triassic subsurface succession of the Hyblean Plateau Petroleum System (SE Sicily, Italy). Rev. Palaeobot. Palynol. 2018, 253, 70–87. [Google Scholar] [CrossRef]
  88. Novelli, L.; Welte, D.H.; Mattavelli, L.; Yalcin, M.N.; Cinelli, D.; Schmitt, K.J. Hydrocarbon Generation in Southern Sicily. A Three-Dimensional Computer Aided Basin Modelling Study. In Organic Geochemistry in Petroleum Exploration; Pergamon: Great Britain, UK, 1988; Volume 13, pp. 153–164. [Google Scholar]
  89. Brosse, E.; Riva, A.; Santucci, S.; Bernon, M.; Loreau, J.P.; Frixa, A.; Laggoun-Defarge, F. Some sedimentological and geochemical characters of the late Triassic Noto formation, source rock in the Ragusa basin (Sicily). Org. Geochem. 1989, 16, 715–734. [Google Scholar] [CrossRef]
  90. Mattavelli, L.; Pieri, M.; Groppi, G. Petroleum exploration in Italy: A review. Mar. Petrol. Geol. 1993, 10, 410–425. [Google Scholar] [CrossRef]
  91. Pieri, M.; Mattavelli, L. Geologic framework of Italian petroleum resources. AAPG Bull. 1986, 70, 103–130. [Google Scholar]
  92. Brosse, E.; Loreau, J.P.; Hue, A.Y.; Frixa, A.; Martellini, L.; Riva, A. The Organic Matter of Interlayered Carbonates and Clays Sediments—Trias/Lias, Sicily. Org. Geochem. 1988, 13, 433–443. [Google Scholar] [CrossRef]
  93. Frixa, A.; Bertamoni, M.; Catrullo, D.; Trinicianti, E.; Miuccio, G. Late NorianHettangian palaeogeography in the area between wells Noto 1 and Polpo 1 (SE Sicily). Mem. Soc. Geol. Ital. 2000, 55, 279–284. [Google Scholar]
  94. Scribano, V.; Simakov, S.K.; Finocchiaro, C.; Correale, A.; Scirè, S. Pyrite and organic compounds coexisting in intrusive mafic xenoliths (Hyblean Plateau, Sicily): Implications for subsurface abiogenesis. Orig. Life Evol. Biosph. 2019, 49, 19–47. [Google Scholar] [CrossRef] [PubMed]
  95. Scirè, S.; Ciliberto, E.; Crisafulli, C.; Scribano, V.; Bellatreccia, F.; Ventura, G.D. Asphaltene-bearing mantle xenoliths from Hyblean diatremes, Sicily. Lithos 2011, 125, 956–968. [Google Scholar] [CrossRef]
  96. Mattavelli, L.; Chilingarian, G.V.; Storer, D. Petrography and diagenesis of the Taormina Formation, Gela oil field, Sicily (Italy). Sediment. Geol. 1969, 3, 59–86. [Google Scholar] [CrossRef]
  97. Dunham, R.J. Classification of carbonate rocks according to depositional textures. AAPG Mem. 1962, 1, 108–121. [Google Scholar]
  98. Cloetens, P.; Pateyron-Salome, M.; Buffiėre, J.Y.; Peix, G.; Baruchel, J.; Peyrin, F.; Schlenker, M. Observation of microstructure and damage in materials by phase sensitive radiography and tomography. J. Appl. Physiol. 1997, 81, 5878–5886. [Google Scholar] [CrossRef]
  99. Maire, E.; Withers, P.J. Quantitative X-ray tomography. Int. Mater. Rev. 2014, 59, 1–43. [Google Scholar] [CrossRef] [Green Version]
  100. Brun, F.; Massimi, L.; Fratini, M.; Dreossi, D.; Billé, F.; Accardo, A.; Pugliese, R.; Cedola, A. SYRMEP Tomo Project: A graphical user interface for customizing CT reconstruction workflows. Adv. Struct. Chem. Imag. 2017, 3, 1–9. [Google Scholar] [CrossRef] [Green Version]
  101. Paganin, D.; Mayo, S.C.; Gureyev, T.E.; Miller, P.R.; Wilkins, S.W. Simultaneous phase and amplitude extraction from a single defocused image of a homogeneous object. J. Microsc. 2002, 206, 33–40. [Google Scholar] [CrossRef]
  102. Brun, F.; Mancini, L.; Kasae, P.; Favretto, S.; Dreossi, D.; Tromba, G. Pore3D: A software library for quantitative analysis of porous media. Nucl. Instrum. Methods Phys. Res. Sect. A Accel. Spectrom. Detect. Assoc. Equip. 2010, 615, 326–332. [Google Scholar] [CrossRef]
  103. Schindelin, J.; Arganda-Carreras, I.; Frise, E.; Kaynig, V.; Longair, M.; Pietzsch, T.; Preibisch, S.; Rueden, C.; Saalfeld, S.; Schmid, B.; et al. Fiji: An open-source platform for biological-image analysis. Nat. Methods 2012, 9, 676–682. [Google Scholar] [CrossRef] [PubMed] [Green Version]
  104. VGStudio Max 2.2 Software; Volume Graphics: Heidelberg, Germany, 2018.
  105. Allmendinger, R.W. Stereonet; for Windows Version 10.2.0. (Free Software); Department of Earth & Atmospheric Sciences, Cornell University: Ithaca, NY, USA, 2018. [Google Scholar]
  106. Rocscience Inc. Dips, version 6.008; Software for Windows: Toronto, ON, Canada, 2002. [Google Scholar]
  107. Asquith, G.; Krygowski, D. Basic Well Log Analysis. AAPG Methods Explor. Ser. 2004, 16, 31–34. [Google Scholar]
  108. Aref, M.A.; Taj, R.J. Recent evaporite deposition associated with microbial mats, Al-Kharrar supratidal–intertidal sabkha, Rabigh area, Red Sea coastal plain of Saudi Arabia. Facies 2018, 64, 1–23. [Google Scholar] [CrossRef]
  109. Lanzafame, G.; Casetta, F.; Giacomoni, P.P.; Donato, S.; Mancini, L.; Coltorti, M.; Ntaflos, T.; Ferlito, C. The Skaros effusive sequence at Santorini (Greece): Petrological and geochemical constraints on an interplinian cycle. Lithos 2020, 362, 105504. [Google Scholar] [CrossRef]
  110. Ragg, S.; Grasso, M.; Müller, B. Patterns of tectonic stress in Sicily from borehole breakout observations and finite element modeling. Tectonics 1999, 18, 669–685. [Google Scholar] [CrossRef]
  111. Rispoli, R. Stress fields about strike-slip faults inferred from stylolites and tension gashes. Tectonophysics 1981, 75, T29–T36. [Google Scholar] [CrossRef]
  112. Koehn, D.; Ebner, M.; Renard, F.; Toussaint, R.; Passchier, C.W. Modelling of stylolite geometries and stress scaling. Earth Planet. Sci. Lett. 2012, 341, 104–113. [Google Scholar] [CrossRef] [Green Version]
  113. Koehn, D.; Rood, M.P.; Beaudoin, N.; Chung, P.; Bons, P.D.; Gomez-Rivas, E. A new stylolite classification scheme to estimate compaction and local permeability variations. Sediment. Geol. 2016, 346, 60–71. [Google Scholar] [CrossRef] [Green Version]
  114. Heap, M.J.; Baud, P.; Reuschlé, T.; Meredith, P.G. Stylolites in limestones: Barriers to fluid flow? Geology 2014, 42, 51–54. [Google Scholar] [CrossRef] [Green Version]
  115. Martín-Martín, J.D.; Gomez-Rivas, E.; Gómez-Gras, D.; Travé, A.; Ameneiro, R.; Koehn, D.; Bons, P.D. Activation of stylolites as conduits for overpressured fluid flow in dolomitized platform carbonates. Geol. Soc. Lond. Spec. Publ. 2018, 459, 157–176. [Google Scholar] [CrossRef] [Green Version]
  116. Zambrano, M.; Tondi, E.; Mancini, L.; Lanzafame, G.; Trias, F.X.; Arzilli, F.; Materazzi, M.; Torrieri, S. Fluid flow simulation and permeability computation in deformed porous carbonate grainstones. Adv. Water Resour. 2018, 115, 95–111. [Google Scholar] [CrossRef] [Green Version]
Figure 2. Schematic drawing of the convention used for the measurement of azimuths and dip angles of the different structures present in the cores and techniques used for the measurement of the structural planes in the three dimensions in the interim reference system in the archive half-cores. On the E-W plane (of the interim reference system), the apparent immersions (0–180°) of the planes of the various structural elements were measured, where 0° referred to a horizontal line, perpendicular to the vertical reference line, and 90° to a vertical line, parallel to the vertical reference line. A second apparent dip angle (90–270°) was measured on the half semicircle of the archive half-core, placed on a horizontal plane perpendicular to both the interim E-W and N-S planes, where 90° referred to a horizontal line, perpendicular to the N-S plane, and 180° to a vertical line, perpendicular to the E-W plane.
Geosciences 12 00149 g002
Figure 3. Representative sedimentary logs of (a) Streppenosa Fm. and (b) Noto Fm. with main sedimentary facies.
Geosciences 12 00149 g003aGeosciences 12 00149 g003b
Figure 4. Core photos of representative facies from the Eureka 1 well (capital letters are referred to the facies described in the text and summarized in Table 1). (A) beige claystones; (B1) Light gray bioclastic limestone; (B2) Light gray microbialite; (B3) Light gray limestone; (C) Dark gray/black shale; (D) Brown microbialite; (E) Brown algal mats; (F) Brown carbonate; (G) Brown algal mats; (H) Brown algal mats; (I) Gray limestone; (L) Light gray/light brown carbonate breccia.
Geosciences 12 00149 g004
Figure 5. (ag) Main microfacies and associated sedimentary, diagenetic and tectonic structures described in thin section. Vertical axis unit is in meters. (a) (ERK1_13): plane-polarized light photomicrograph showing stromatolite laminae and polycrystalline pseudomorph after gypsum; (b) (ERK1_14): crossed nicols thin section scan showing stromatolites convoluted laminae with interspersed polycrystalline calcite (probably pseudomorphs after gypsum) bitumen impregnated; (c) (ERK1_16): crossed nicols thin section scan showing micritic brown algal mat laminae alternated with light brown (sparite) laminae. Micro-extensional faults offsetting laminae, big veins filled with calcite; (d1) (ERK1_17) plane polarized light microphoto showing a tectonic stylolite cutting the laminae; (d2) (ERK1_17): plane polarized light microphoto showing a sub-vertical fracture filled with bitumen and a load stylolite parallel to the bedding; (e) (ERK1_22): crossed nicols thin section scan showing a laminite formed by microbial mats, micritic and microcrystalline layers, calcite veins, and pseudomorphs after gypsum; focus: detail of swallow-tail geminated gypsum layers; (f1) (ERK1_24): plane polarized light photomicrograph showing cross-cutting relationship between tectonic stylolites and calcite veins; (f2) (ERK1_24): plane-polarized light photomicrograph showing a tectonic stylolite partially filled with calcite and bitumen; (f3) (ERK1_24): crossed nicols thin section scan showing a mudstone-wackestone with tectonic and load stylolites partly filled with brown clay, bitumen and calcite. Organic matter is present; (g) (ERK1_25): plane polarized light thin section scan showing microbial algal mat rich layers alternating with carbonate (sparite) rich levels (nodular-boudins), and microfractures and veins filled with calcite.
Geosciences 12 00149 g005
Figure 6. Results of the pores (a,b) and pores + impregnation (c,d) morphology analysis: Volume Fraction (a,c) is calculated as the sum of the volume of the single elements (pores or pores + impregnation) having a given size range over the total volume of the investigated phase; Number Fraction is computed as the number of pores or pores + impregnation having a given size range over the total number of pores.
Geosciences 12 00149 g006
Figure 7. Microstructural features of some representative specimens. From left to right column: (ad) main microstructural features (optical microscope); (eh) volume renderings of extracted Volumes of Interest (VOIs) in grayscale from SR-μCT; (il) segmented pores and fractures from the same VOIs; (mp) mineralization array (yellow) along the fractures. ERK1_1b: bioclastic wackestone; ERK1_13: detail of polycrystalline calcite within algal mats; ERK1_17: load and tectonic stylolites; ERK1_22: swallow tail gypsum interbedded within the laminae and cut by fracture filled with secondary calcite.
Geosciences 12 00149 g007
Figure 8. (a) Stereoplot (lower hemisphere; multiple uniform distribution contouring), (b) rose diagram of the main fracture planes, and (c) the related legend, and (d) stereoplot (lower hemisphere; multiple uniform distribution contouring), (e) rose diagram of the tectonic stylolite planes, and (f) the related legend, measured from the cores extracted from the Eureka 1 DEV well.
Geosciences 12 00149 g008
Figure 9. Frequency of the dip angles (a) of the fracture planes and (b) of the tectonic stylolite planes measured from the cores extracted from the Eureka 1 DEV well.
Geosciences 12 00149 g009aGeosciences 12 00149 g009b
Figure 10. (a) Frequency of fracture opening; (b) frequency of fracture length.
Geosciences 12 00149 g010aGeosciences 12 00149 g010b
Figure 11. Examples of (a) normal micro-faults with small horst and grabens; (b) a reverse micro-fault with an 18 mm offset. Partially cemented fractures are also present; (c) a portion of the 2111–2112 core containing the normal fault, cemented by calcite and angular clasts, reminiscent of a damage zone; (d) a tectonic stylolite cutting a fracture (red arrows indicate stylolites), (e) a fracture cutting a load stylolite (red arrows indicate stylolites), and (f) sub-vertical tectonic stylolites.
Geosciences 12 00149 g011
Figure 12. Evaluation log suite includes spontaneous potential, gamma ray, porosity, density, and sonic curves for the interval 2000–2148 m of the Eureka 1 well. The derived “Vp log” was also added and compared with the Vp values measured on 14 samples (red dots). Contextually to the counting of the fractures for some intervals of the Eureka 1 well, a qualitative estimate (cemented, uncemented, partly cemented) was carried out.
Geosciences 12 00149 g012
Figure 13. Correlation of the difference between the Vp Log values (Vplog) and Vp measured values in 13 samples (Vpcore) of the Eureka 1 well. The R2 values are rounded to the first decimal place.
Geosciences 12 00149 g013
Figure 14. Correlation between the Vshale and Porosity-Density values. The R2 values are rounded to the first decimal place.
Geosciences 12 00149 g014aGeosciences 12 00149 g014b
Table 1. Facies description and depositional environment/process interpretation of Streppenosa and Noto Fms. sampled from the Eureka 1 well.
FaciesDescriptionTexture
(Dunham, 1962) [97]
Main ElementsSedimentary FeaturesDepositional Environment/Process Interpretation
ABeige claystonesMDisk-shaped mud clastsIrregular upper and lower boundariesCarbonate platform subject to tidal currents and drowning
B1Light gray bioclastic limestoneM-WScattered intraclasts and bioclasts (gastropods)No gradationCarbonate platform. Dwarfed gastropods: anoxic conditions?
B2Light gray microbialiteB (framestone)MicrobialiteLaminationTidal flats/Biologically influenced/Biochemical calcification
B3Light gray limestoneM-W--StructurelessCarbonate platform/inorganic
CDark gray/black shaleMOrganic shalesLamina-sets locally undulatedLagoon/organic-rich shale deposition
DBrown microbialiteB (framestone)MicrobialiteConvoluted bedsTidal flats/Biologically influenced/Biochemical calcification
EBrown algal matsM-WStromatolitesUndulated algal laminaeTidal flats/Sediment trapping and precipitation
FBrown carbonateG Graded bedsCarbonate platform/Storm-tide dominated
GBrown algal matsM-WAlgal mats and swallow tail gypsumLocal planar laminasetSupra-inter-tidal lagoon, evaporite precipitation
HBrown algal matsM-WAlgal matsConvoluted laminae, voids filled with polycrystalline calciteTidal flats/Sediment trapping and precipitation
IGray limestoneM-WRare algaeRare convoluted algal laminaeTidal flats/Sediment trapping and precipitation
LLight gray/light brown carbonate brecciaM-WSubangular clasts in mudstoneStructurelessCarbonate platform/re-sedimentation processes
Table 2. Results of quantitative analysis on 3D images from a selection of representative specimens.
PoresPores + Impregnation
SampleInvestigated Volume (mm3)Amount (%)Number Density (#/mm3)Average Volume ** (mm3)Amount (%)Number Density (#/mm3)Average Volume ** (mm3)
ERK1_1b0.790.013861.627 × 1070.66241,4853.755 × 105
ERK1_13 *1.330.11–0.85223794.097 × 1073.45–20.00191,8771.2843 × 106
ERK1_170.471.1355252.044 × 1065.932,3571.9831 ×106
ERK1_22 *1.180.15–1.1218595.754 × 1062.06–2.9012,7643.7138 × 106
ERK1_240.740.0443639.589 × 1083.58103,4001.0217 × 107
* analysis performed on two extracted volumes. ** average volume of pores or pore + impregnation.
Table 3. Porosity results of quantitative analysis, based on 3D images from samples at different depth, versus sedimentary facies, P-waves velocities obtained from core samples, and type of porosity.
SamplesDepth (m)FormationFaciesPores (%)Total porosity (%)Pores + Impregnation (%) Vp (km/s)Porosity Type
ERK1_1b_Z0mm2014.9–2015StreppenosaB10.030.600.576.00Interparticle and intraparticle
ERK1_1b_Z9mm2014.9–2015StreppenosaB10.000.050,056.00Interparticle and intraparticle
ERK1_92039.50–2039.58NotoG0.633.042.412.30Fractures, interparticle
ERK1_13_Z0mm2044.85–2044.94NotoG0.113.563.453.58Fractures, interparticle
ERK1_13_Z2.5mm2044.85–2044.94NotoG0.9020.8719.973.58Fractures, interparticle
ERK1_152047.66–2047.77NotoB20.219.008.792.08Fractures, interparticle
ERK1_172060.40–20,160.50NotoB21.135.714.583.51Fractures, stylolites, interparticle
ERK1_22_Z0mm2100.90–2101.00NotoG0.163.062.901.96Fractures, veins, pseudomorphs after halite, interparticle, vugs
ERK1_22_Z2.5mm2100.90–2101.00NotoG1.123.212.091.96Fractures, veins, pseudomorphs after halite, interparticle, vugs
ERK1_242107.66–2107.77NotoG0.043.623.585.62Stylolite, fractures, interparticle
Publisher’s Note: MDPI stays neutral with regard to jurisdictional claims in published maps and institutional affiliations.

