


Soil Loss Potential Assessment for Natural and Post-Fire Conditions in Evia Island, Greece
 ,
,  ,
,  , ,
, ,
Abstract
:
1. Introduction
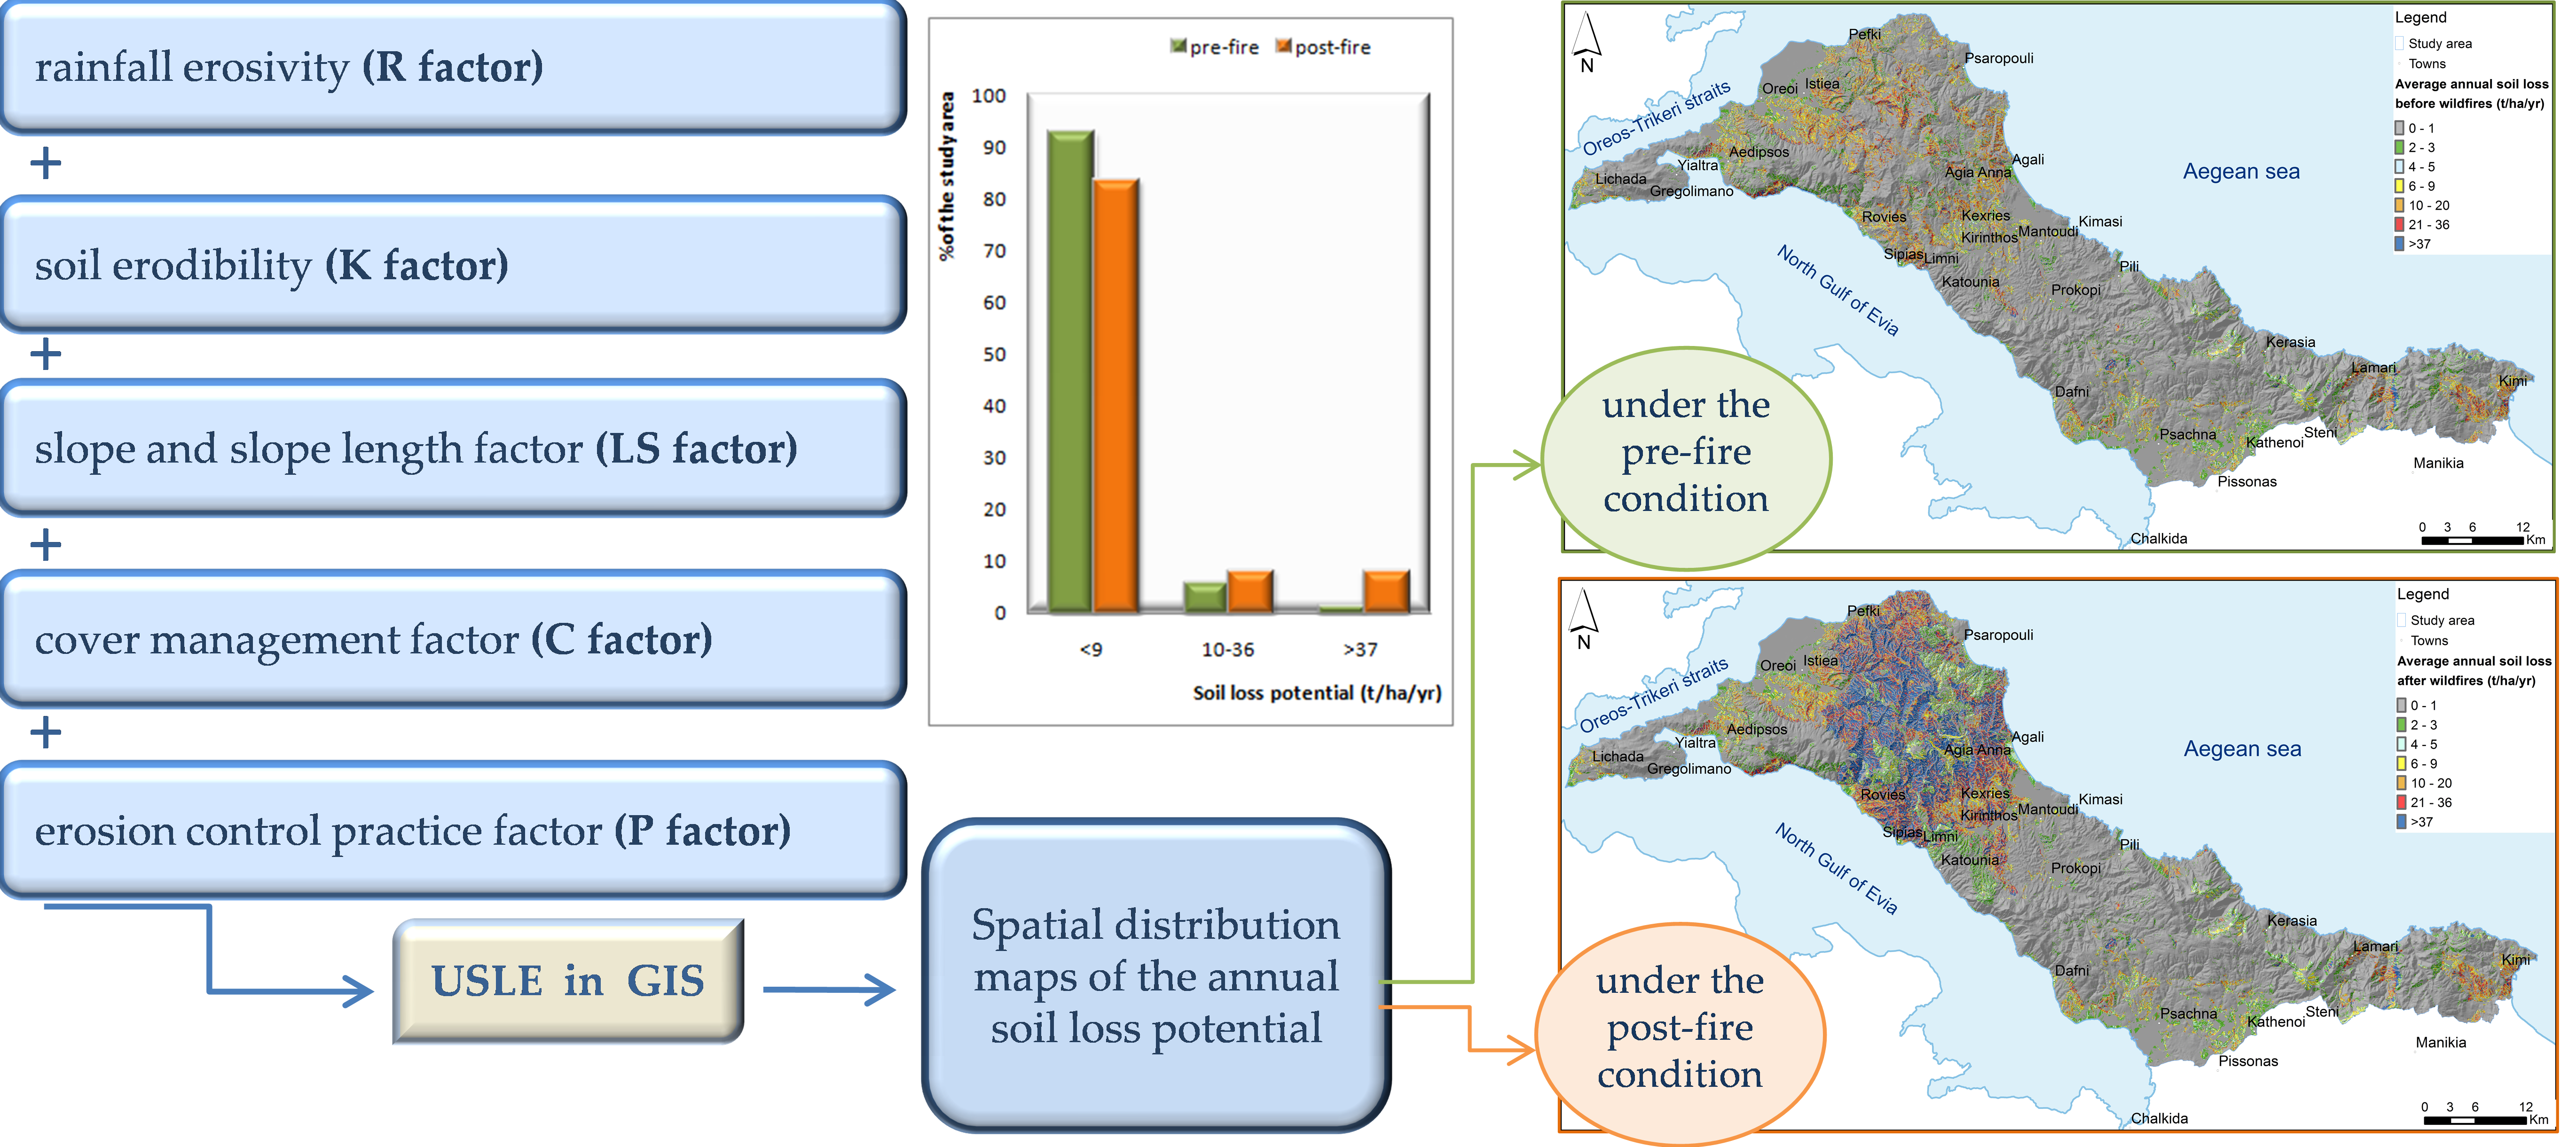
2. Study Area
3. Materials and Methods
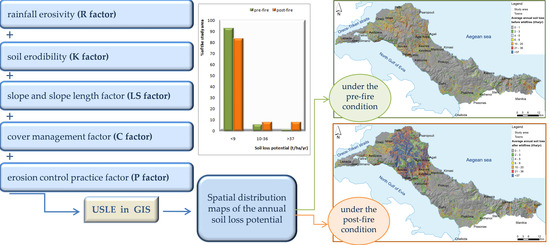
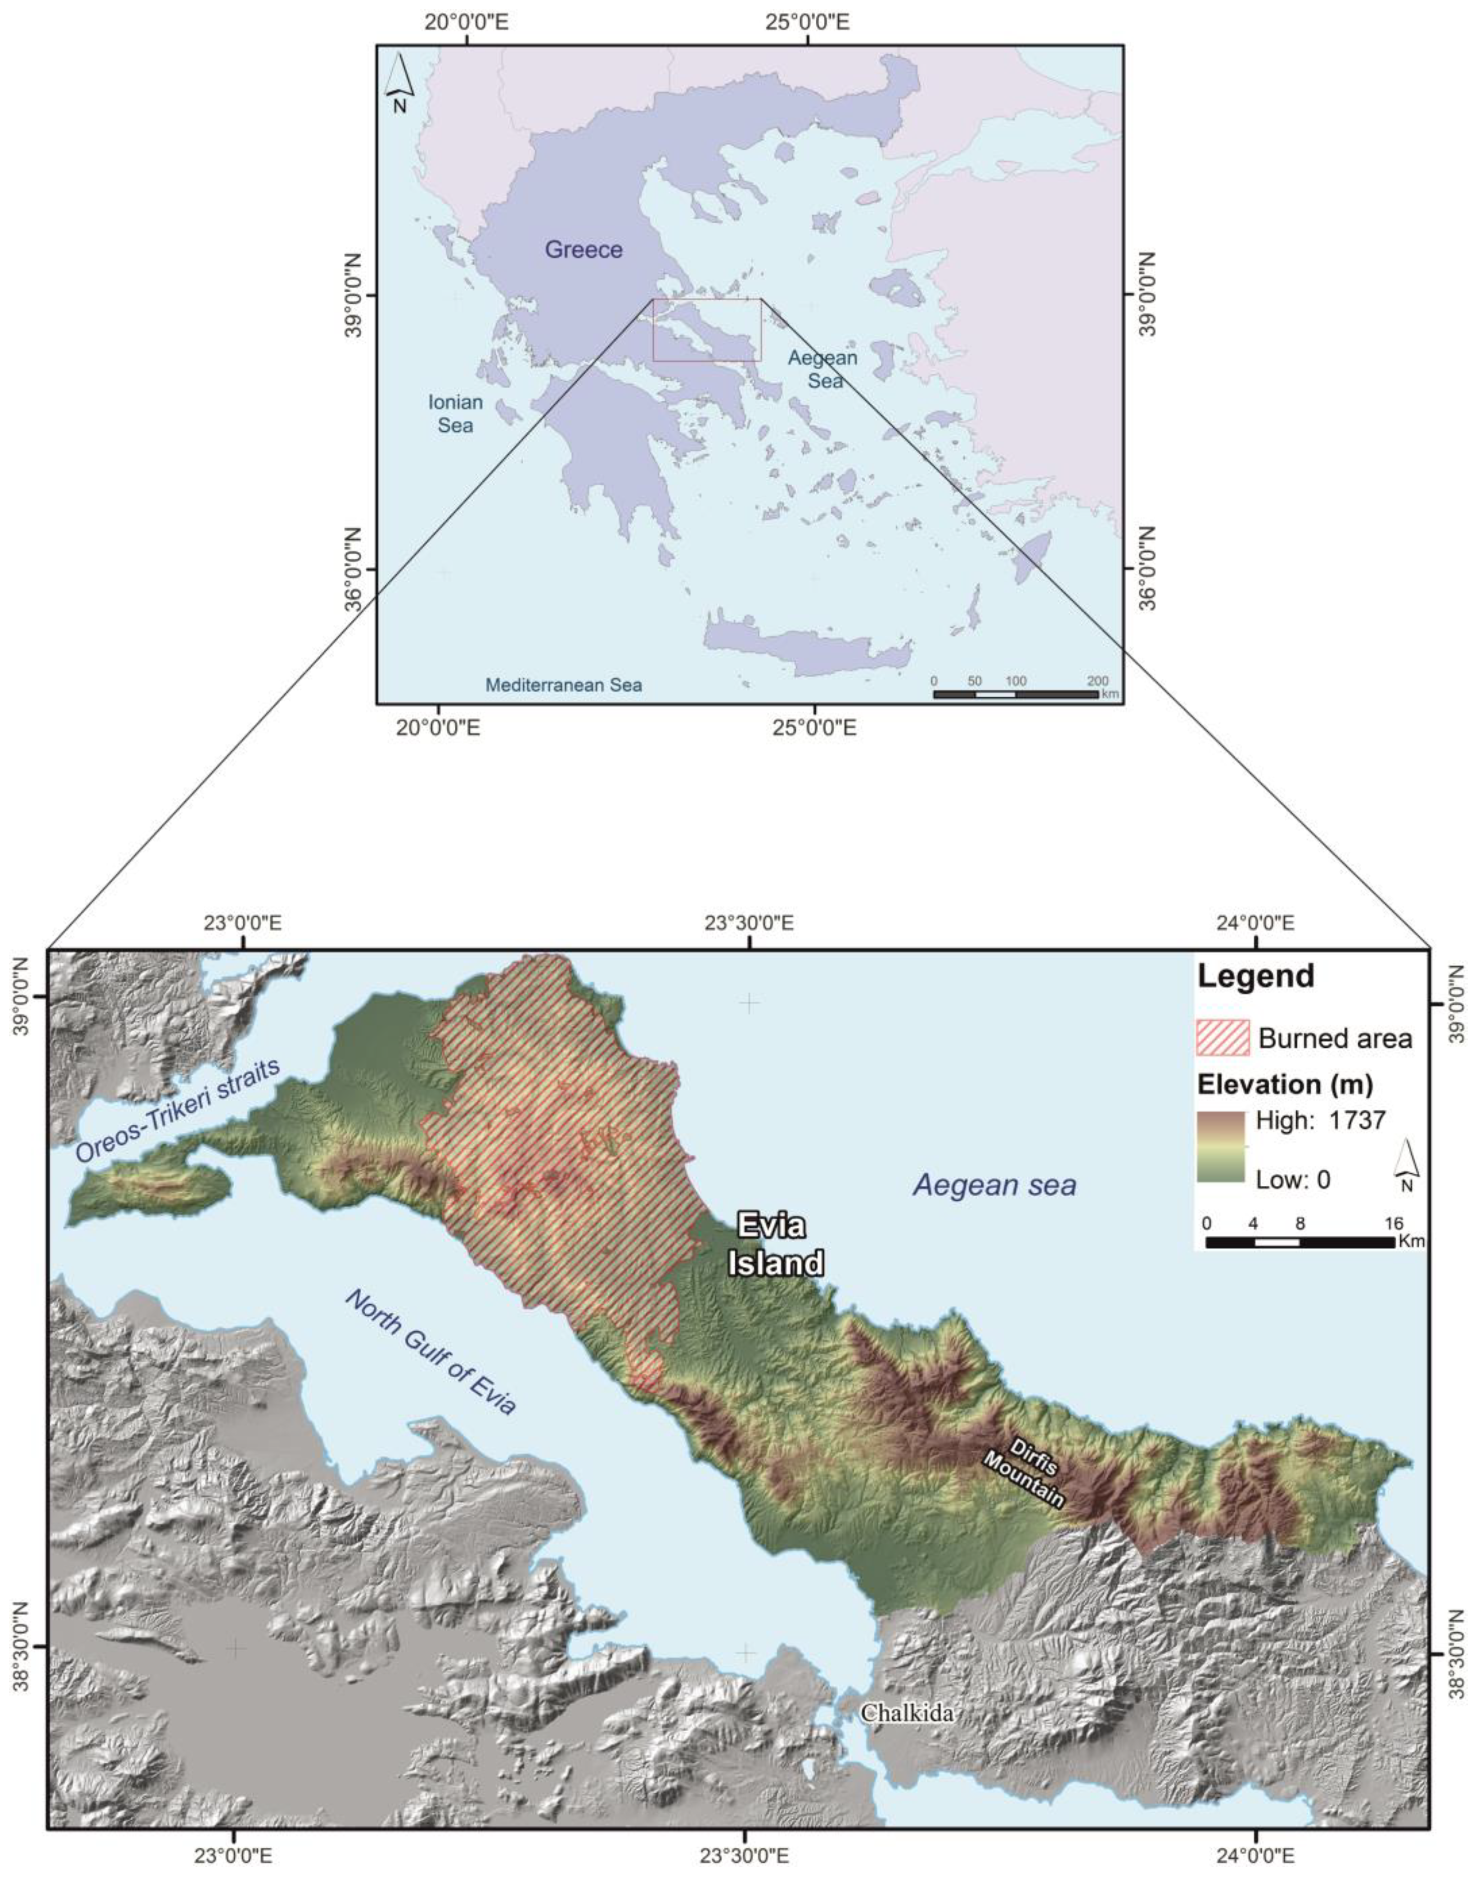
3.1. The Universal Loss Equation
3.2. Data
- Topographic maps of the study area at a 1:50000 scale, published by the Hellenic Military Geographical Service (HMGS).
- EU-DEM 25 m, source: “Copernicus” Land Monitoring Service.
- Geological maps at a 1:50000 scale, published by the Institute of Geology and Mineral Exploration of Greece (IGME), which were used to digitize the boundaries of the geological formations.
- The Climatic Atlas of Greece (1971–2000) developed by the Hellenic National Meteorological Service (HNMS), which was used to digitize the precipitation zones of the study area.
- The CORINE database (Corine Land Cover at scale 1:100000) downloaded by the Hellenic Mapping and Cadastral Organization, which provided the geographic distribution of individual land use classes.
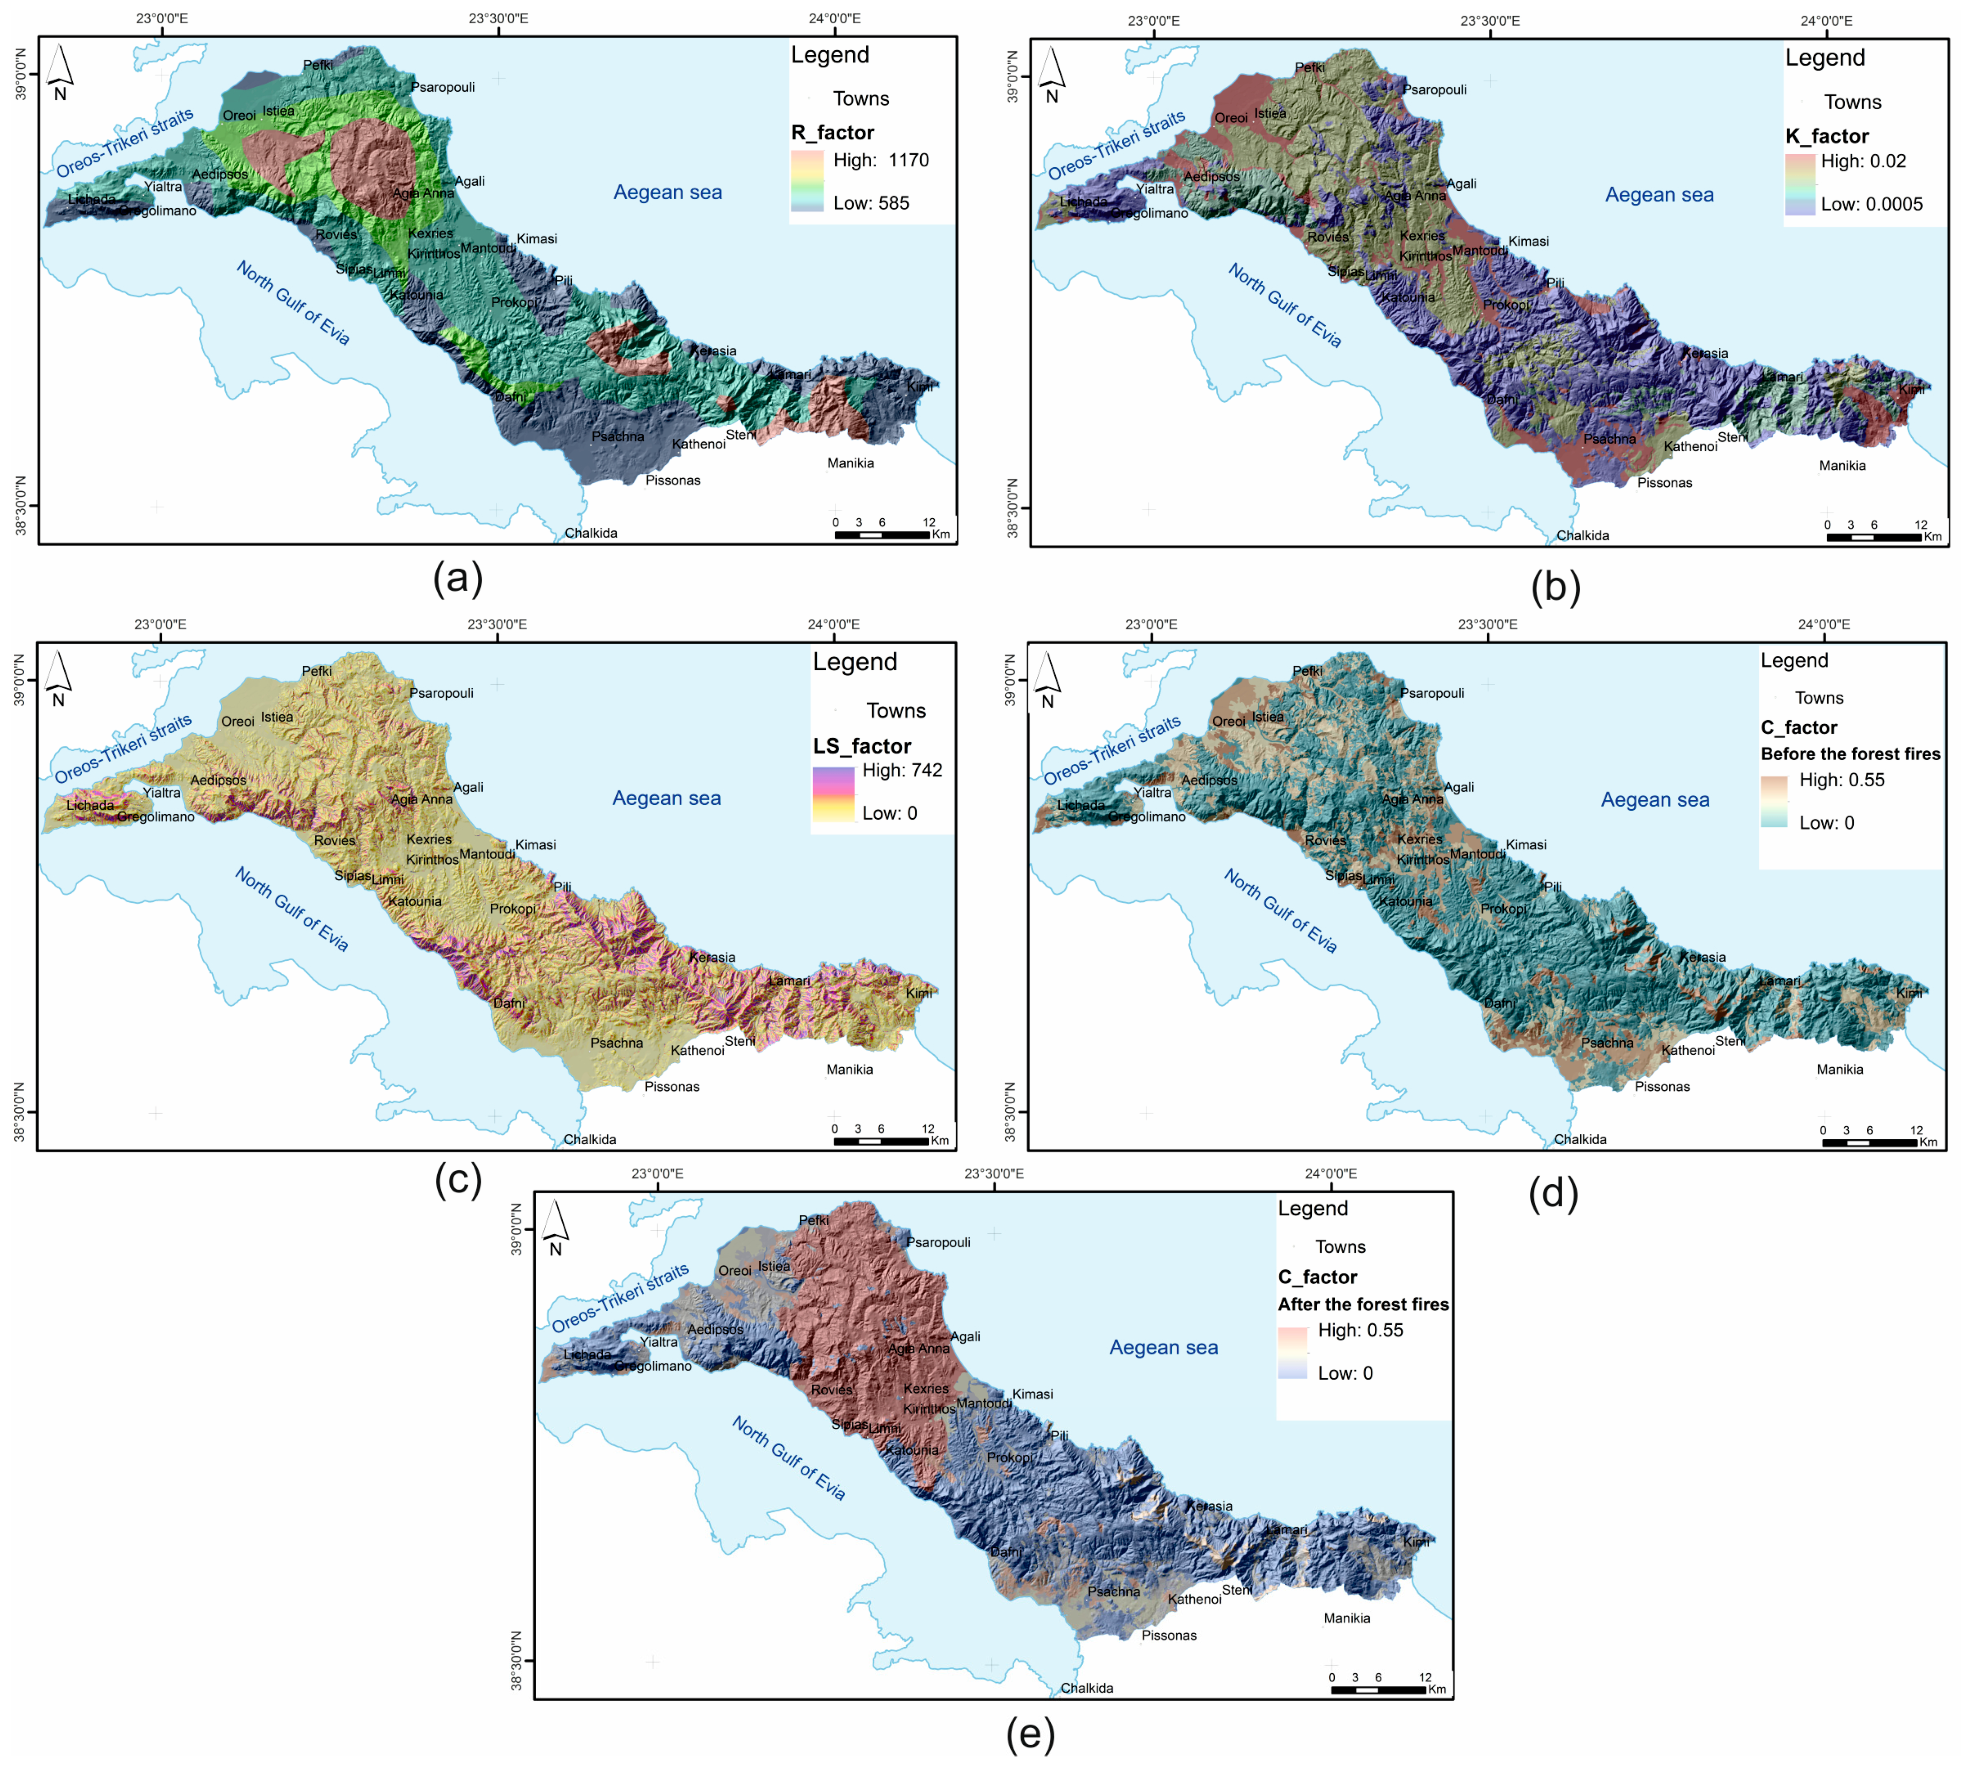
3.3. Estimation of the USLE Factors
3.3.1. Rainfall Erosivity Factor)
3.3.2. Soil Erodibility Factor (K)
3.3.3. Topographic Factor (LS)
3.3.4. Cropping Management Factor (C)
3.3.5. Erosion Control Practice Factor (P)
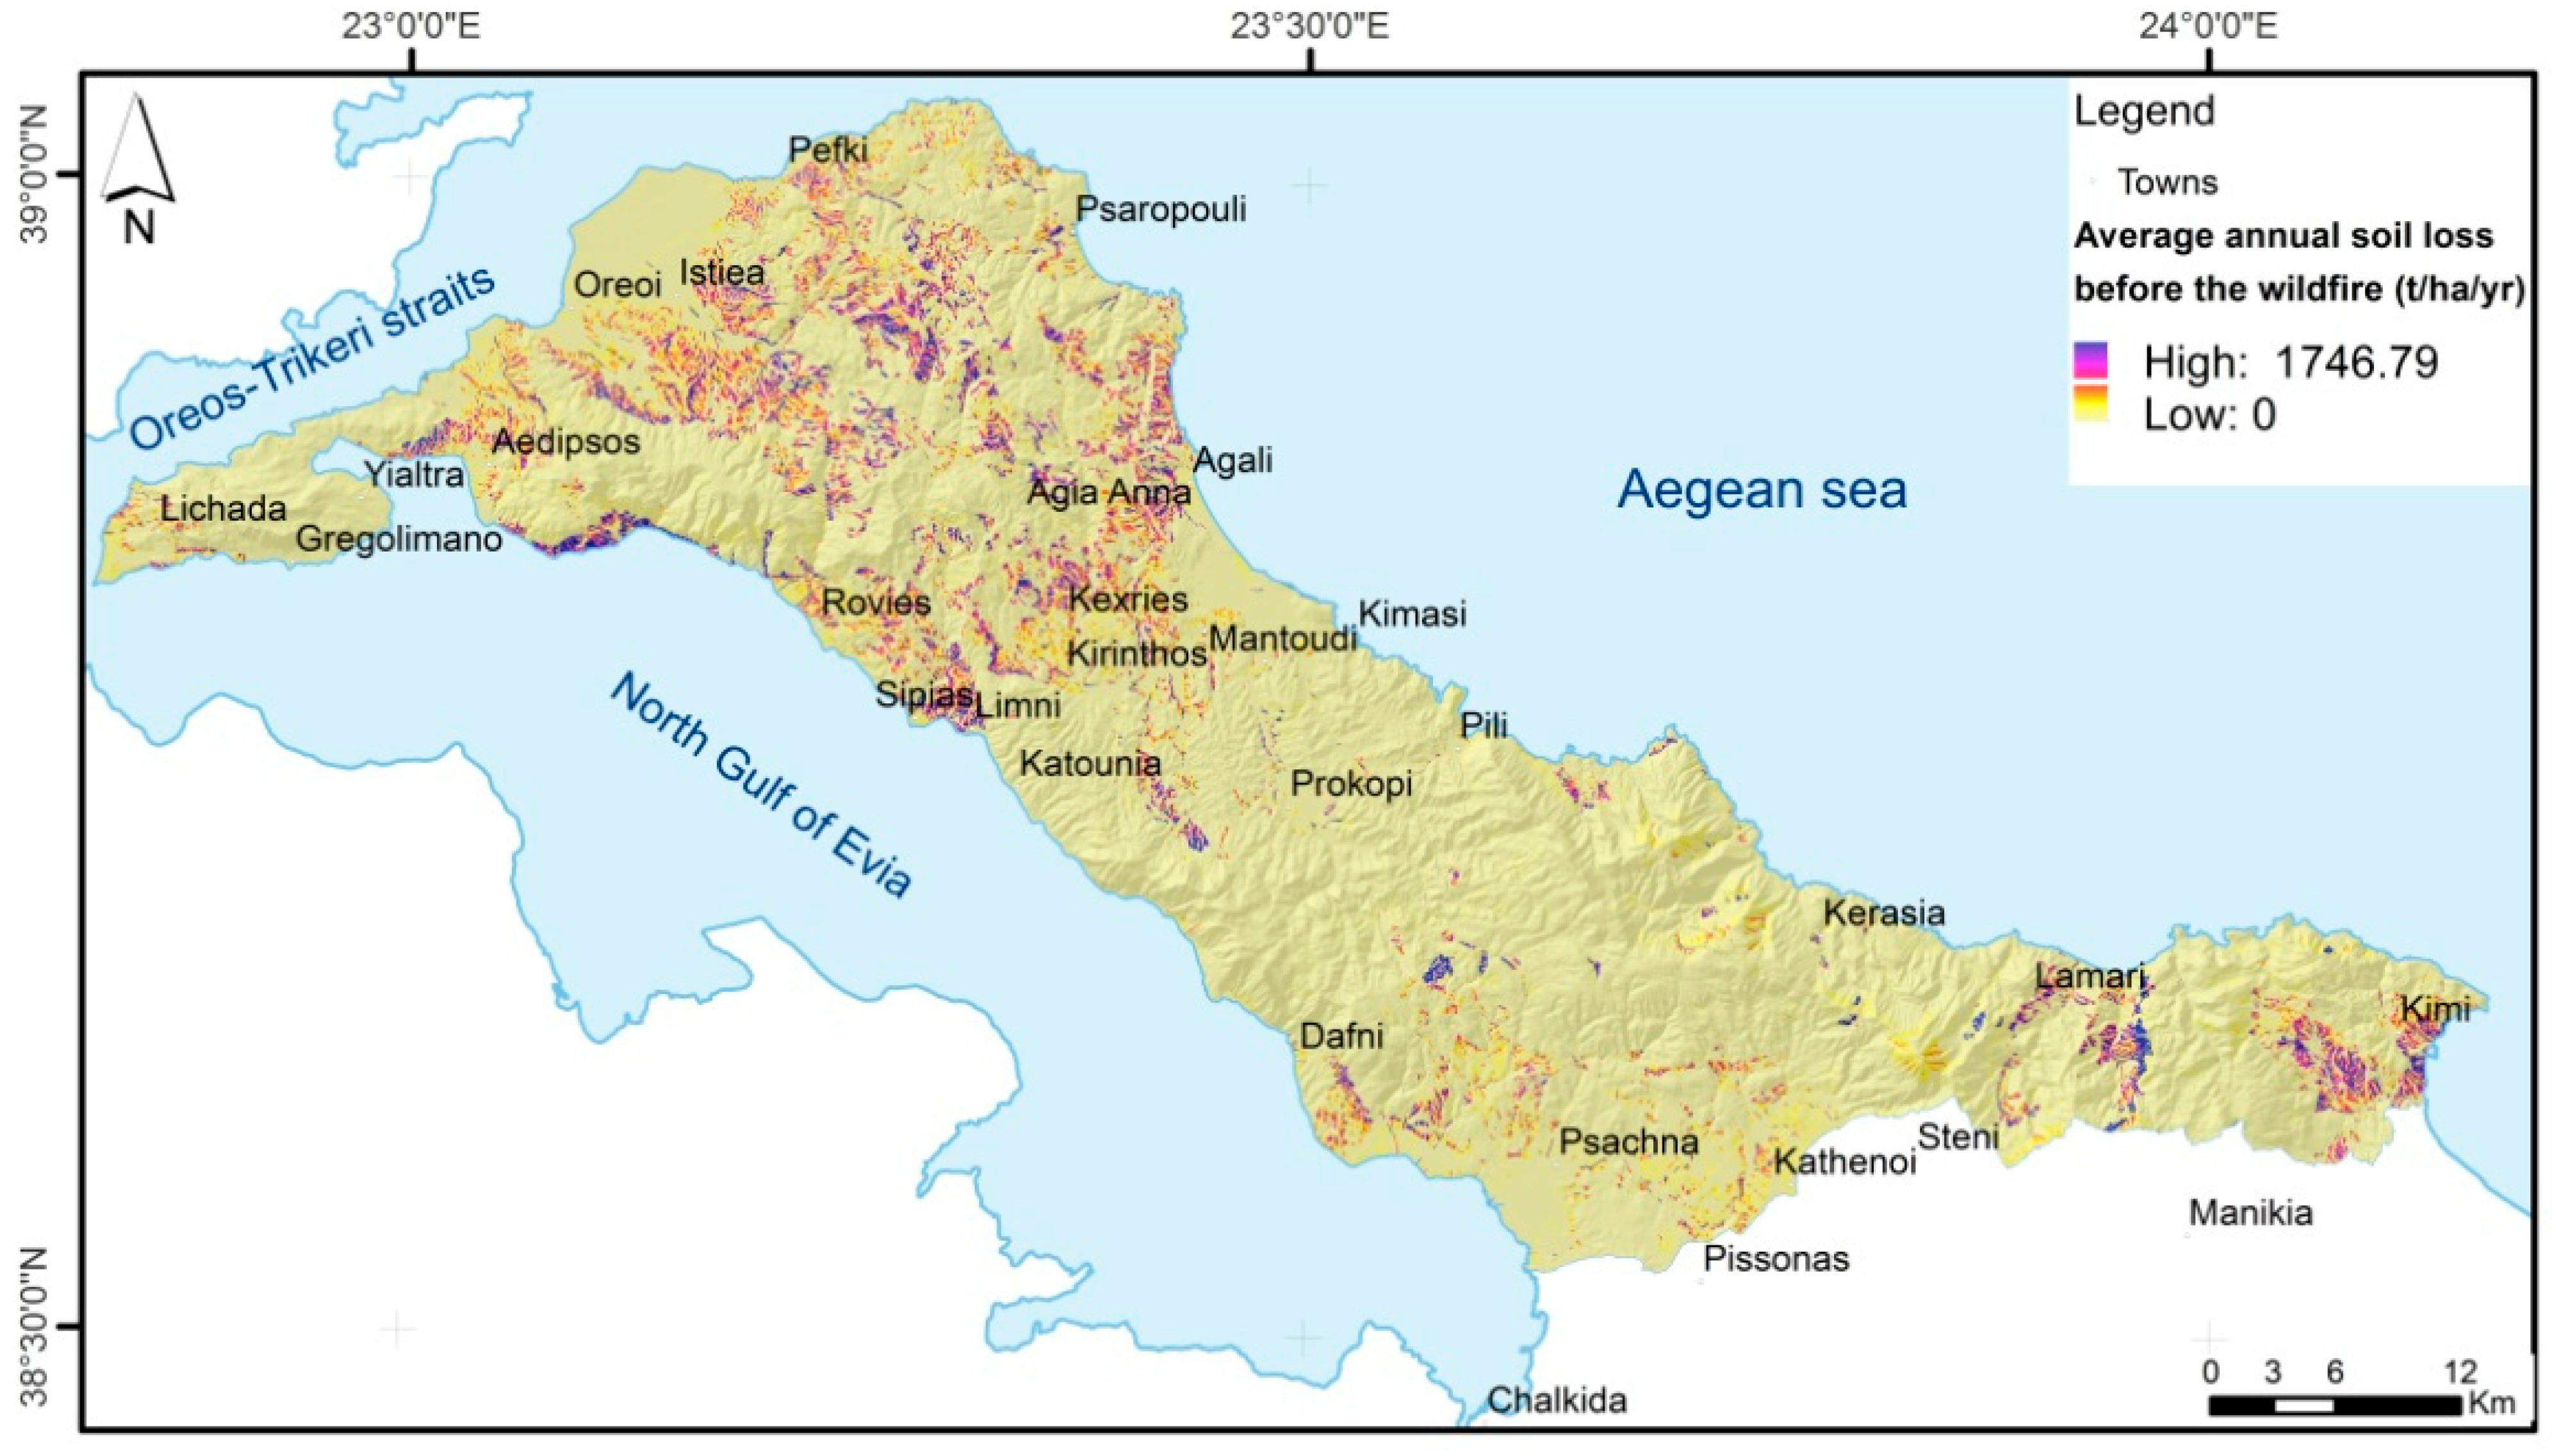
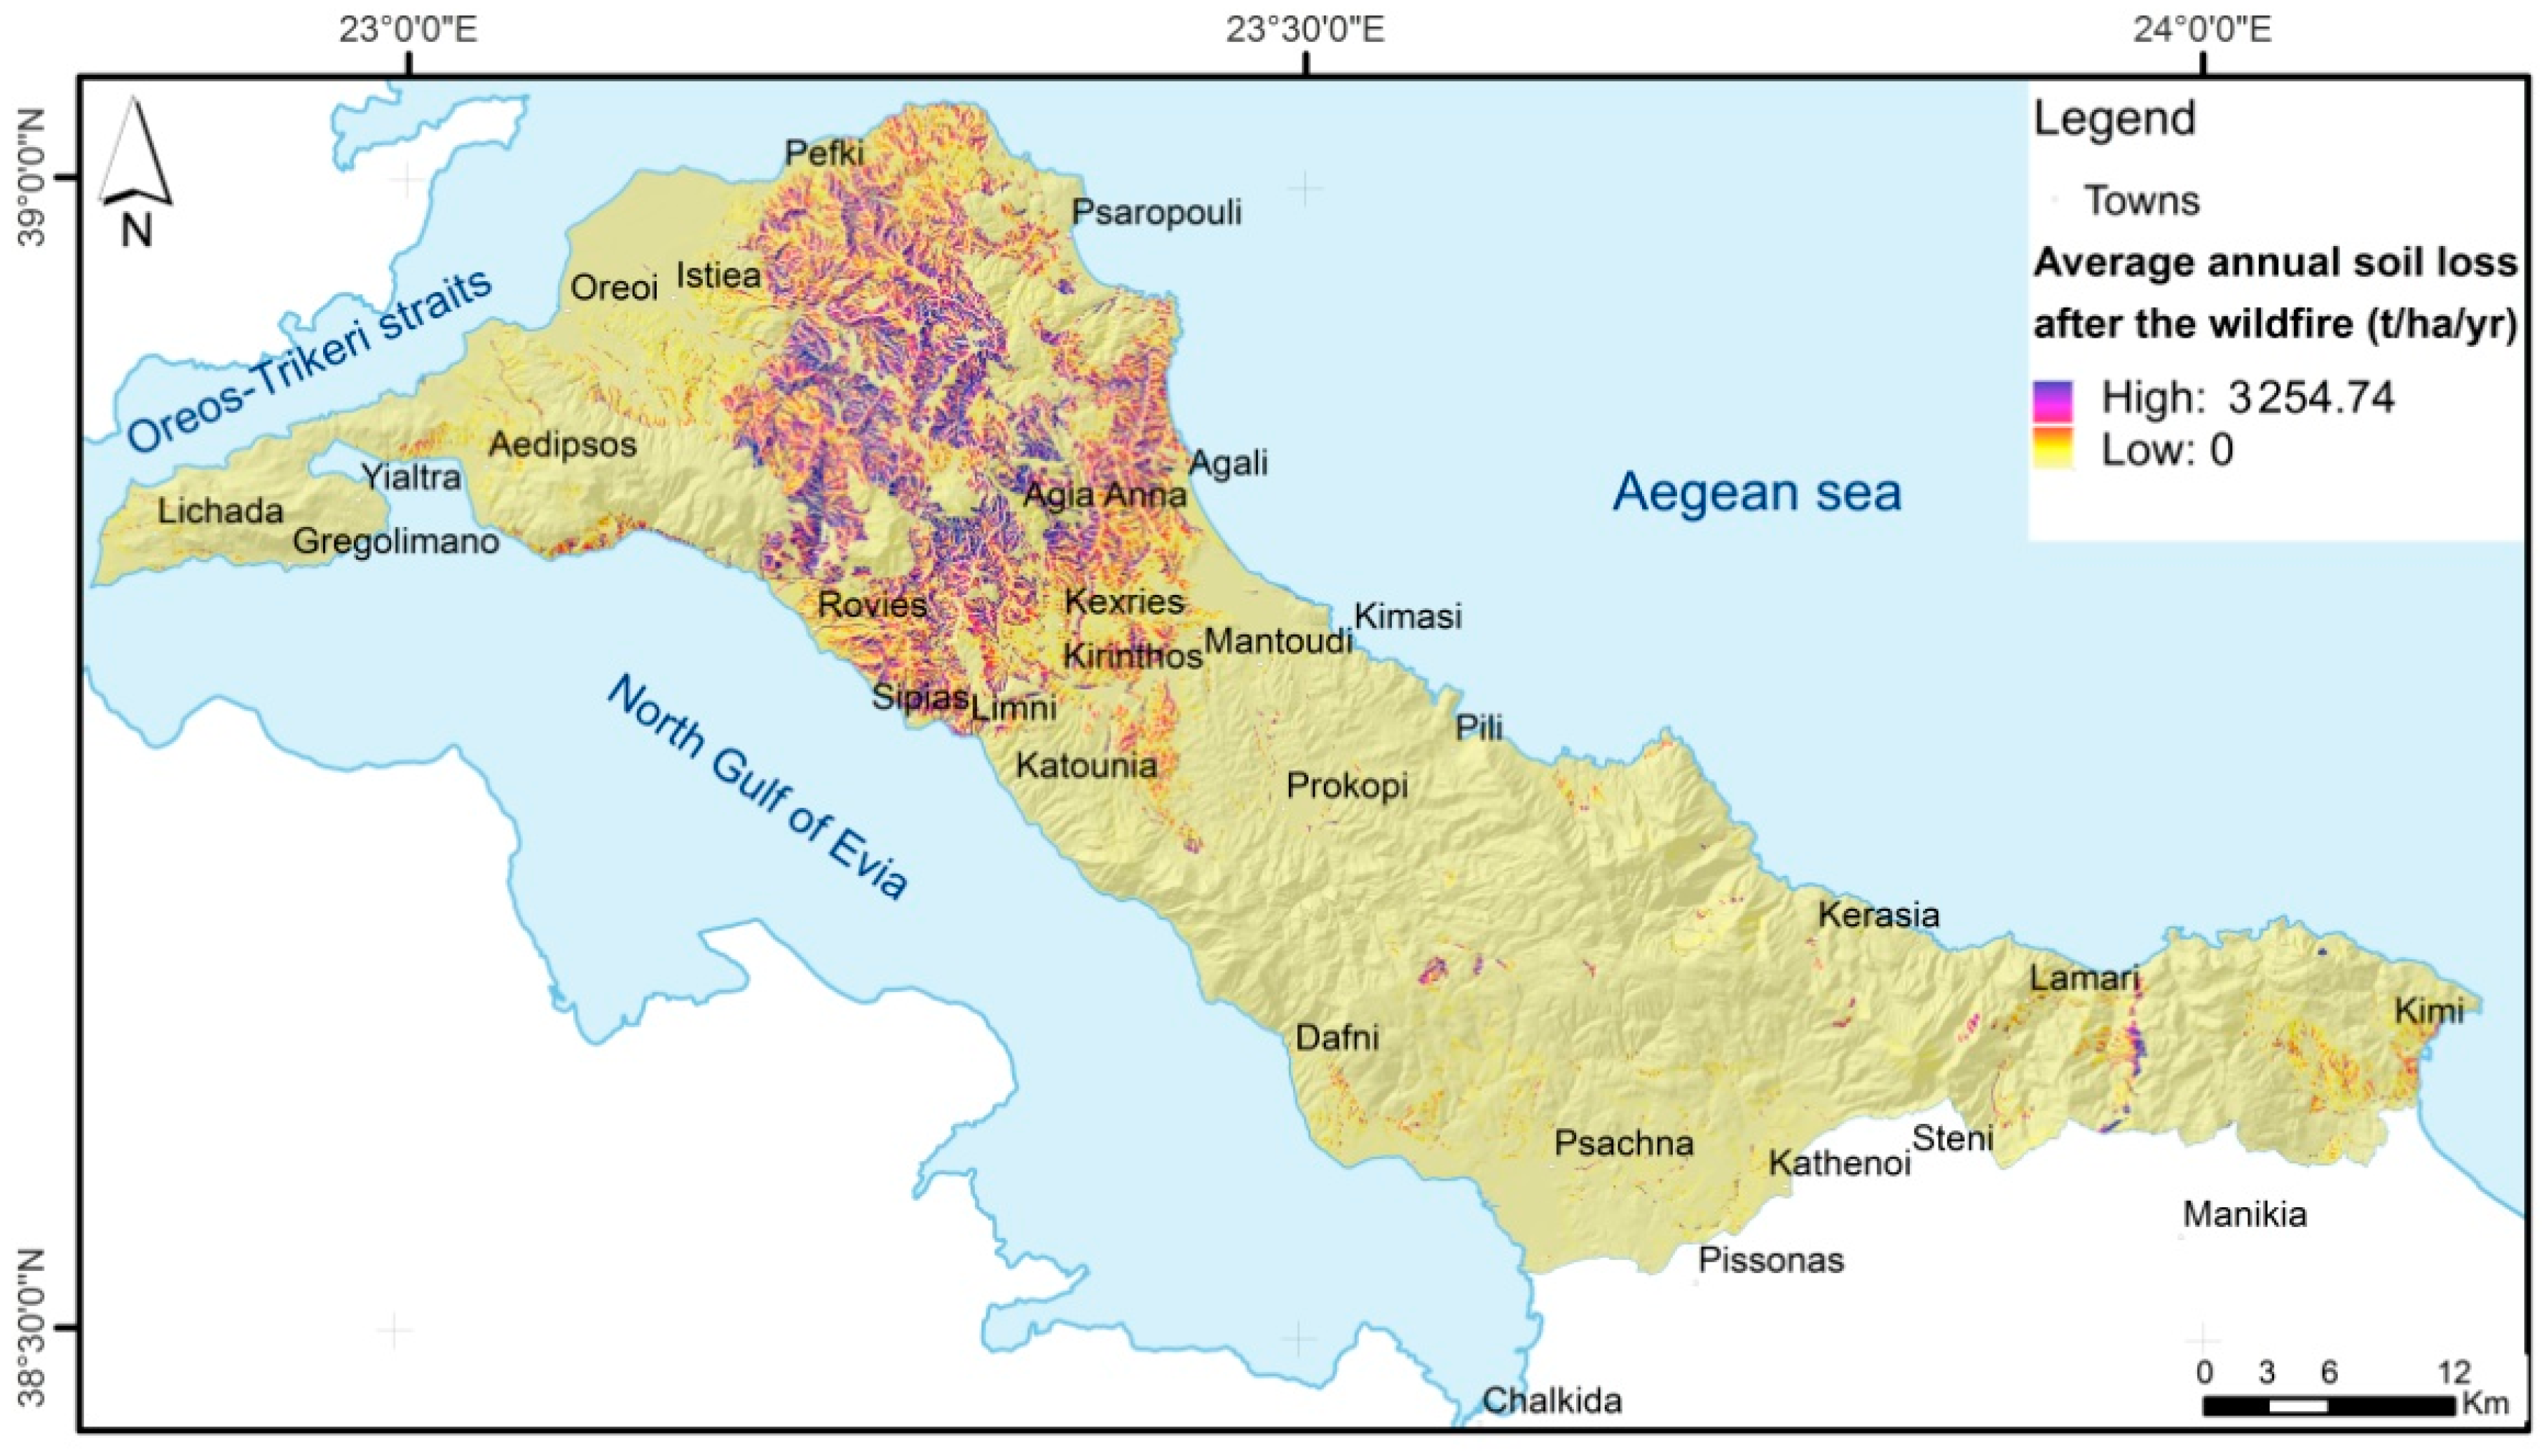
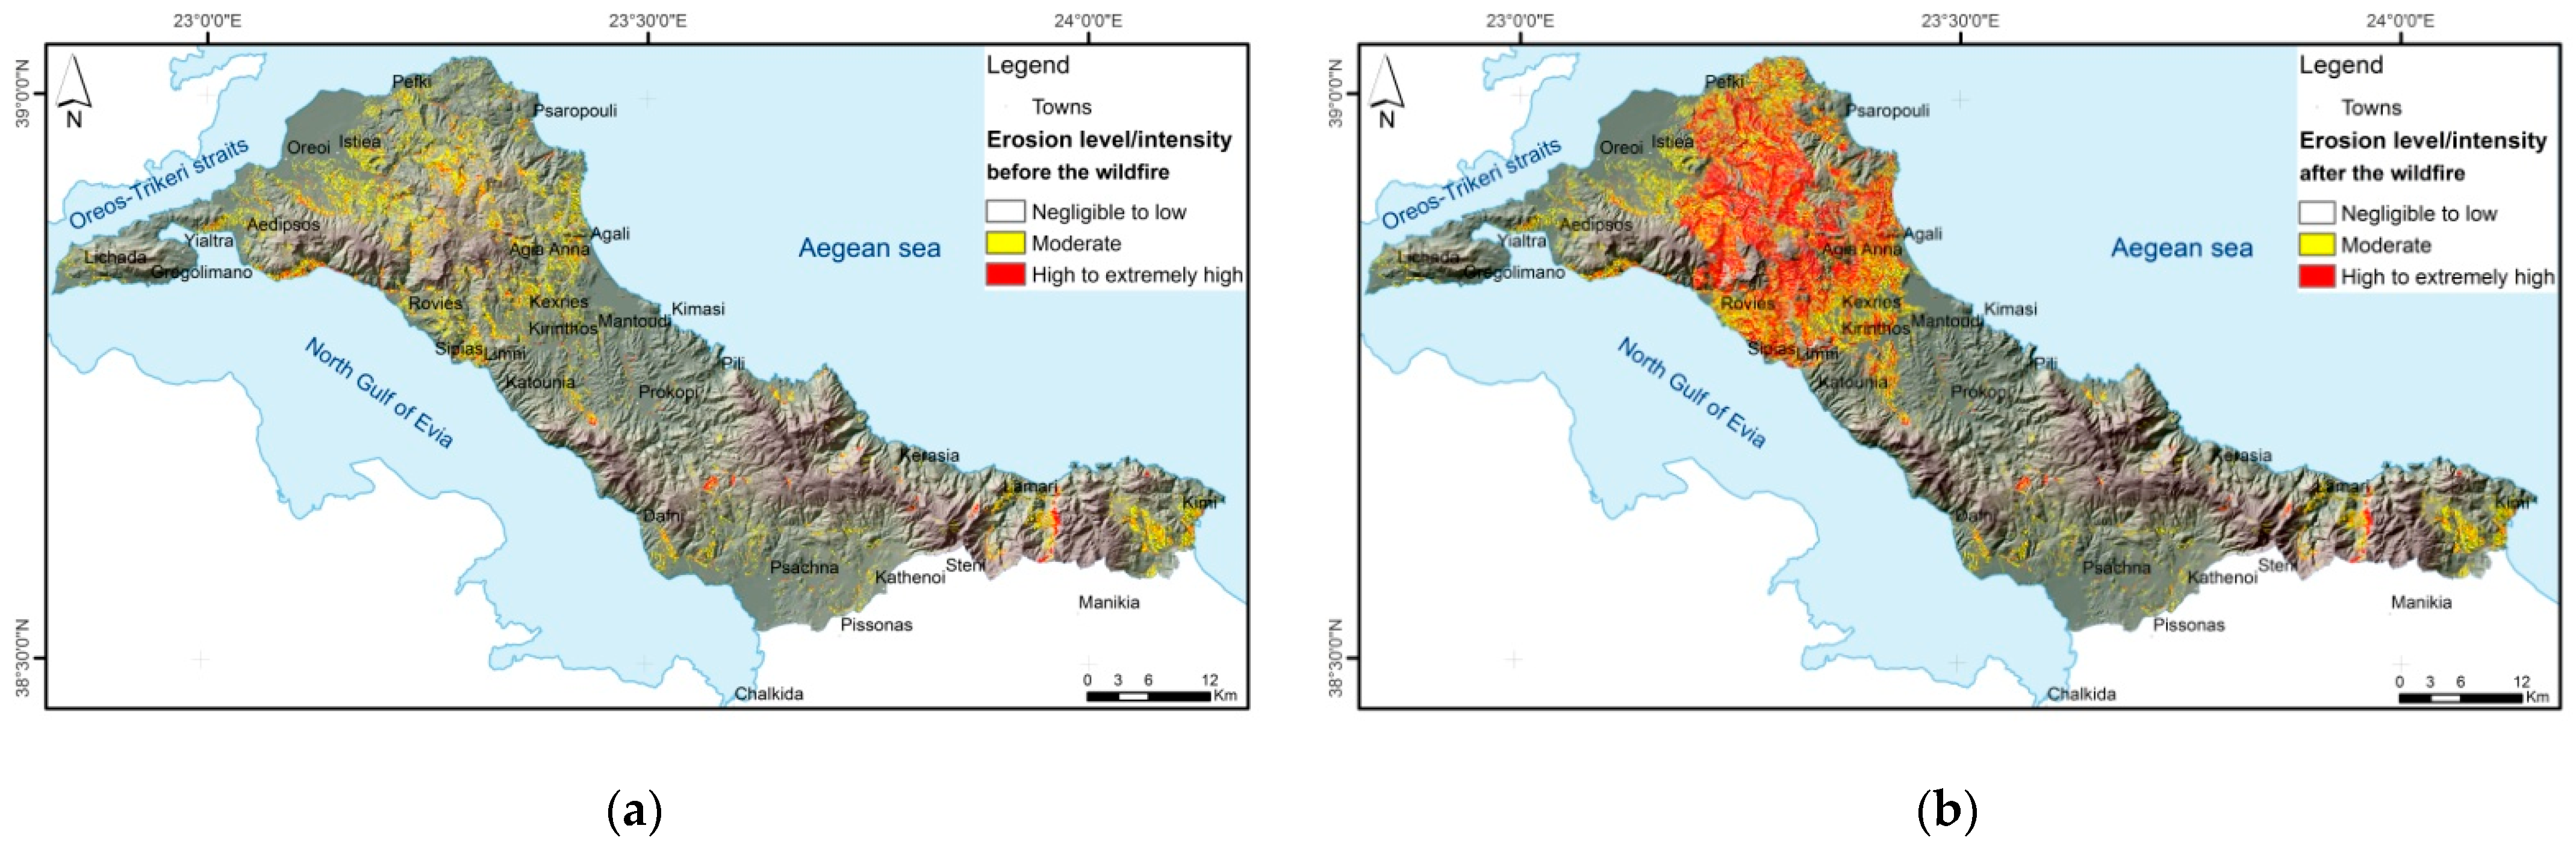
4. Results and Discussion
5. Conclusions
Author Contributions
Funding
Institutional Review Board Statement
Data Availability Statement
Acknowledgments
Conflicts of Interest
References
- Montgomery, D.R. Soil erosion and agriculture sustainability. Proc. Natl. Acad. Sci. USA 2007, 104, 13268–13272. [Google Scholar] [CrossRef]
- Haokip, P.; Khan, M.A.; Choudhari, P.; Kulimushi, L.C.; Qaraev, I. Identification of erosion-prone areas using morphometric parameters, land use land cover and multi-criteria decision-making method: Geo-informatics approach. Environ. Dev. Sustain. 2022, 24, 527–557. [Google Scholar] [CrossRef]
- Orgiazzi, A.; Panagos, P. Soil biodiversity and soil erosion: It is time to get married Adding an earthworm factor to soil erosion modeling. J. Macroecology 2018, 27, 1155–1167. [Google Scholar] [CrossRef]
- Stefanidis, S.; Alexandridis, V.; Spalevic, V.; Mincato, R. Wildfire Effects on Soil Erosion Dynamics: The Case of 2021 Megafires in Greece. J. Agric. For. 2022, 68, 49–63. [Google Scholar] [CrossRef]
- Polykretis, C.; Alexakis, D.D.; Grillakis, M.G.; Manoudakis, S. Assessment of Intra-Annual and Inter-Annual Variabilities of Soil Erosion in Crete Island (Greece) by Incorporating the Dynamic “Nature” of R and C-Factors in RUSLE Modeling. Remote Sens. 2020, 12, 2439. [Google Scholar] [CrossRef]
- Kadam, A.K.; Jaweed, T.H.; Kale, T.H.; Umrikar, B.N.; Sankhua, R.N. Identification of erosion-prone areas using modified morphometric prioritization method and sediment production rate: A remote sensing and GIS approach. Geomat. Nat. Hazards Risk 2019, 10, 986–1006. [Google Scholar] [CrossRef]
- Cerdan, O.; Desprats, J.-F.; Fouché, J.; Le Bissonnais, Y.; Cheviron, B.; Simonneaux, V.; Raclot, D.; Mouillot, F. Impact of global changes on soil vulnerability in the Mediterranean Basin. Proceeding of the International Symposium on Erosion and Landscape Evolution (ISELE), Anchorage, Alaska, 18–21 September 2011; pp. 495–503. [Google Scholar] [CrossRef]
- Aiello, A.; Adamo, M.; Canora, F. Remote sensing and GIS to assess soil erosion with RUSLE3D and USPED at river basin scale in southern Italy. CATENA 2015, 131, 174–185. [Google Scholar] [CrossRef]
- Ahmed, F.; Srinivasa, R.K. Geomorphometric Analysis for Estimation of Sediment Production Rate and Run-off in Tuirini Watershed, Mizoram, India. Int. J. Remote Sens. Appl. 2015, 5, 67. [Google Scholar] [CrossRef]
- Megahan, W.F.; Molitor, D.C. Erosional effects of wildfire and logging in Idaho. In Watershed Management Symposium; American Society of Civil Engineers, Irrigation and Drainage Division: Logan, UT, USA, 1975; pp. 423–444. [Google Scholar]
- Shakesby, R.A.; Doerr, S.H. Wildfire as a hydrological and geomorphological agent. Earth-Sci. Rev. 2006, 74, 269–307. [Google Scholar] [CrossRef]
- Parente, J.; Girona-García, A.; Lopes, A.R.; Keizer, J.J.; Vieira, D.C.S. Prediction, validation, and uncertainties of a nation-wide post-fire soil erosion risk assessment in Portugal. Sci. Rep. 2022, 12, 2945. [Google Scholar] [CrossRef]
- Depountis, N.; Michalopoulou, M.; Kavoura, K.; Nikolakopoulos, K.; Sabatakakis, N. Estimating Soil Erosion Rate Changes in Areas Affected by Wildfires. ISPRS Int. J. Geo-Inf. 2020, 9, 562. [Google Scholar] [CrossRef]
- Myronidis, D.; Emmanouloudis, D.; Mitsopoulos, I.; Riggos, E. Soil Erosion Potential after Fire and Rehabilitation Treatments in Greece. Environ. Modeling Assess. 2010, 15, 239–250. [Google Scholar] [CrossRef]
- Efthimiou, N.; Psomiadis, E.; Panagos, P. Fire severity and soil erosion susceptibility mapping using multi-temporal Earth Observation data: The case of Mati fatal wildfire in Eastern Attica, Greece. CATENA 2020, 187, 104320. [Google Scholar] [CrossRef]
- Kastridis, A.; Kamperidou, V. Evaluation of the post-fire erosion and flood control works in the area of Cassandra (Chalkidiki, North Greece). J. For. Res. 2015, 26, 209–217. [Google Scholar] [CrossRef]
- Richter, G. Aspects and problems of soil erosion hazard in the EEC countries. In Soil Erosion; Prendergast, A.G., Ed.; Commission of the European Communities: Report No. EUR 8427 EN; Office for Official Publications of the European Communities: Luxembourg, 1983; pp. 9–17. [Google Scholar]
- Rulli, M.C.; Rosso, R. Modeling catchment erosion after wildfires in the San Gabriel Mountains of Southern California. Geophys. Res. Lett. 2005, 32, 1–4. [Google Scholar] [CrossRef]
- Fernández, C.; Vega, J.A.; Vieira, D.C.S. Assessing soil erosion after fire and rehabilitation treatments in NW Spain: Performance of RUSLE and revised Morgan-Morgan-Finney models. Land Degrad. Dev. 2010, 21, 58–67. [Google Scholar] [CrossRef]
- Varela, M.E.; Benito, E.; Keijer, J.J. Wildfire effects on soil erodibility of woodlands in NW Spain. Land Degrad. Dev. 2010, 21, 75–82. [Google Scholar] [CrossRef]
- Moody, J.A.; Shakesby, R.A.; Robichaud, P.R.; Cannon, S.H.; Martin, D.A. Current research issues related to post-wildfire runoff and erosion processes. Earth Sci. Rev. 2013, 122, 10–37. [Google Scholar] [CrossRef]
- Evans, R. Factors controlling soil erosion and runoff and their impacts in the upper Wissey catchment, Norfolk, England: A ten year monitoring programme. Earth Surf. Processes Landf. 2017, 42, 2266–2279. [Google Scholar] [CrossRef] [Green Version]
- Karalis, S.; Karymbalis, E.; Mamassis, N. Models for sediment yield in mountainous Greek catchments. Geomorphology 2018, 322, 76–88. [Google Scholar] [CrossRef]
- Shakesby, R.A. Post-wildfire soil erosion in the Mediterranean: Review and future research directions. Earth-Sci. Rev. 2011, 105, 71–100. [Google Scholar] [CrossRef]
- Fernández, C.; Vega, J.A. Evaluation of RUSLE and PESERAmodels for predicting soil erosion losses in the first year after wildfire in NW Spain. Geoderma 2016, 273, 64–72. [Google Scholar] [CrossRef]
- Tselka, I.; Krassakis, P.; Rentzelos, A.; Koukouzas, N.; Parcharidis, I. Assessing Post-Fire Effects on Soil Loss Combining Burn Severity and Advanced Erosion Modeling in Malesina, Central Greece. Remote Sens. 2021, 13, 5160. [Google Scholar] [CrossRef]
- Prats, S.A.; González-Pelayo, O.; Silva, F.S.; Bokhorst, K.J.; Baartman, J.E.M.; Keizer, J.J. Post-fire soil erosion reduction with forest residue mulching at catchment scale. Earth Surf. Processes Landf. 2019, 44, 2837–2848. [Google Scholar] [CrossRef]
- Girona-García, A.; Vieira, D.; Silva, J.; Fernández, C.; Robichaud, P.; Keizer, J. Effectiveness of post-fire soil erosion mitigation treatments: A systematic review and meta-analysis. Earth-Sci. Rev. 2021, 217, 103611. [Google Scholar] [CrossRef]
- Das, D. Identification of Erosion Prone Areas by Morphometric Analysis Using GIS. J. Inst. Eng. India Ser. A 2014, 95, 61–74. [Google Scholar] [CrossRef]
- Singh, W.R.; Barman, S.; Tirkey, G. Morphometric analysis and watershed prioritization in relation to soil erosion in Dudhnai Watershed. Appl. Water Sci. 2021, 11, 151. [Google Scholar] [CrossRef]
- Vafeidis, A.T.; Drake, N.A.; Wainwright, J. A proposed method for modelling the hydrologic response of catchments to burning with the use of remote sensing and GIS. CATENA 2007, 70, 396–409. [Google Scholar] [CrossRef]
- Polykretis, C.; Alexakis, D.D.; Grillakis, M.G.; Agapiou, A.; Cuca, B.; Papadopoulos, N.; Sarris, A. Assessment of water-induced soil erosion as a threat to cultural heritage sites: The case of Chania prefecture, Crete Island, Greece. Big Earth Data 2021. [Google Scholar] [CrossRef]
- Benzougagh, B.; Meshram, S.G.; Dridri, A.; Boudad, L.; Baamar, B.; Sadkaoui, D.; Khedher, K.M. Identification of critical watershed at risk of soil erosion using morphometric and geographic information system analysis. Appl. Water Sci. 2022, 12, 8. [Google Scholar] [CrossRef]
- Rulli, C.M.; Offeddu, L.; Santini, M. Modeling post-fire water erosion mitigation strategies,” Hydrology and Earth System. Science 2012, 17, 2323–2337. [Google Scholar] [CrossRef]
- Samela, C.; Imbrenda, V.; Coluzzi, R.; Pace, L.; Simoniello, T.; Lanfredi, M. Multi-Decadal Assessment of Soil Loss in a Mediterranean Region Characterized by Contrasting Local Climates. Land 2022, 11, 1010. [Google Scholar] [CrossRef]
- Saha, S.; Gayen, A.; Pourghasemi, H.R.; Tiefenbacher, J.P. Identification of soil erosion-susceptible areas using fuzzy logic and analytical hierarchy process modeling in an agricultural watershed of Burdwan district, India. Environ. Earth Sci. 2019, 78, 649. [Google Scholar] [CrossRef]
- Sinshaw, B.G.; Belete, A.M.; Tefera, A.K.; Dessie, A.B.; Bizuneh, B.B.; Alem, H.T.; Atanaw, S.B.; Eshete, D.G.; Wubetu, T.G.; Atinkut, H.B.; et al. Prioritization of potential soil erosion susceptibility region using fuzzy logic and analytical hierarchy process, upper Blue Nile Basin, Ethiopia. Water-Energy Nexus 2021, 4, 10–24. [Google Scholar] [CrossRef]
- Borrelli, P.; Märker, M.; Panagos, P.; Schütt, B. Modeling soil erosion and river sediment yield for an intermountain drainage basin of the Central Apennines, Italy. CATENA 2014, 114, 45–58. [Google Scholar] [CrossRef]
- Phinzi, K.; Ngetar, N.S. The assessment of water-borne erosion at catchment level using GIS-based RUSLE and remote sensing: A review. Int. Soil Water Conserv. Res. 2019, 7, 27–46. [Google Scholar] [CrossRef]
- Brini, I.; Alexakis, D.D.; Kalaitzidis, C. Linking Soil Erosion Modeling to Landscape Patterns and Geomorphometry: An Application in Crete, Greece. Appl. Sci. 2021, 11, 5684. [Google Scholar] [CrossRef]
- Giambastiani, Y.; Giusti, R.; Gardin, L.; Cecchi, S.; Iannuccilli, M.; Romanelli, S.; Bottai, L.; Ortolani, A.; Gozzini, B. Assessing Soil Erosion by Monitoring Hilly Lakes Silting. Sustainability 2022, 14, 5649. [Google Scholar] [CrossRef]
- Van Andel, T.H.; Zangger, E.; Demitrack, A. Land Use and Soil Erosion in Prehistoric and Historical Greece. J. Field Archaeol. 1990, 17, 379–396. [Google Scholar] [CrossRef]
- Zangger, E. Neolithic to Present Soil Erosion in Greece. In Past and Present Soil Erosion, Archaeological and Geographical Perspectives (Oxbow Monograph 22), 1st ed.; Bell, M., Boardam, J., Eds.; Oxford Books: Oxford, UK, 1992; pp. 133–147. [Google Scholar]
- Koutalakis, P.; Zaimes, G.N.; Iakovoglou, V.; Ioannou, K. Reviewing Soil Erosion in Greece, World Academy of Science, Engineering and Technology. Int. J. Geol. Environ. Eng. 2015, 9, 936–941. [Google Scholar] [CrossRef]
- Schismenos, S.; Emmanouloudis, D.; Stevens, G.J.; Katopodes, N.D.; Melesse, A.M. Soil governance in Greece: A snapshot. Soil Secur. 2022, 6, 100035. [Google Scholar] [CrossRef]
- Rozos, D.; Skilodimou, H.D.; Loupasakis, C.; Bathrellos, G.D. Application of the revised universal soil loss equation model on landslide prevention. An example from N. Euboea (Evia) Island, Greece. Environ Earth Sci. 2013, 70, 3255–3266. [Google Scholar] [CrossRef]
- Evelpidou, N.; Tzouxanioti, M.; Gavalas, T.; Spyrou, E.; Saitis, G.; Petropoulos, A.; Karkani, A. Assessment of Fire Effects on Surface Runoff Erosion Susceptibility: The Case of the Summer 2021 Forest Fires in Greece. Land 2022, 11, 21. [Google Scholar] [CrossRef]
- Wischmeier, W.H.; Smith, D.D. Predicting Rainfall Erosion Losses. A Guide to Conservation Planning; Agriculture Handbook No.537; United States Department of Agriculture, Science and Education Administration: Hyattsville, MD, USA, 1978; p. 62. [Google Scholar]
- Roberts, S.; Jackson, J. Active normal faulting in central Greece: An overview. In The Geometry of Normal Faults; Roberts, A.M., Yielding, G., Freeman, B., Eds.; Geological Society, Special Publications: London, UK, 1991; Volume 56, pp. 125–142. [Google Scholar]
- Valkanou, K.; Karymbalis, E.; Papanastassiou, D.; Soldati, M.; Chalkias, C.; Gaki-Papanastassiou, K. Μorphometric Analysis for the Assessment of Relative Tectonic Activity in Evia Island, Greece. Geosciences 2020, 10, 264. [Google Scholar] [CrossRef]
- Valkanou, K.; Karymbalis, E.; Papanastassiou, D.; Soldati, M.; Chalkias, C.; Gaki-Papanastassiou, K. Assessment of Neotectonic Landscape Deformation in Evia Island, Greece, Using GIS-Based Multi-Criteria Analysis. ISPRS Int. J. Geo-Inf. 2021, 10, 118. [Google Scholar] [CrossRef]
- Mountrakis, D.M. Geology of Greece; University Studio Press: Thessaloniki, Greece, 1985. (In Greek) [Google Scholar]
- Mariolopoulos, E.G. The Climate of Greece; Academy of Athens Research Center for Atmospheric Physics and Climatology: Athens, Greece, 1938; No. 7; pp. 79–82. [Google Scholar]
- Mariolopoulos, H.G. Compendium of the Climate of Greece; KEFAK of the Academy of Athens: Athens, Greece, 1982; No. 7; pp. 9–76. [Google Scholar]
- Zerefos, C.; Repapis, C.; Giannakopoulos, C.; Kapsomenakis, J.; Papanikolaou, D.; Papanikolaou, M.; Poulos, S.; Vrekoussis, M.; Philandras, C.; Tselioudis, G.; et al. The climate of the Eastern Mediterranean and Greece: Past, present and future. In The Environmental, Economic and Social Impacts of Climate Changing Greece; Bank of Greece: Athens, Greece, 2011; pp. 50–58. [Google Scholar]
- Giannaros, T.M.; Papavasileiou, G.; Lagouvardos, K.; Kotroni, V.; Dafis, S.; Karagiannidis, A.; Dragozi, E. Meteorological Analysis of the 2021 Extreme Wildfires in Greece: Lessons Learned and Implications for Early Warning of the Potential for Pyroconvection. Atmosphere 2022, 13, 475. [Google Scholar] [CrossRef]
- Gemitzi, A.; Koutsias, N. A Google Earth Engine code to estimate properties of vegetation phenology in fire affected areas–A case study in North Evia wildfire event on August 2021. Remote Sens. Appl. Soc. Environ. 2022, 26, 100720. [Google Scholar] [CrossRef]
- Copernicus Emergency Management Service Mapping (EMS). Available online: https://emergency.copernicus.eu/mapping/ems/forest-fire-evia-island-greece-1 (accessed on 7 September 2022).
- Mwansa, P. Investigating the Impact of Fire on the Natural Regeneration of Woody Species in Dry and Wet Miombo Woodland. Master’s Thesis, Faculty of AgriSciences, Stellenbosch University, Stellenbosch, South Africa, 2018. [Google Scholar]
- Van der Knijff, J.; Jones, R.; Montanarella, L. Soil Erosion Risk Assessment in Europe; European Soil Bureau, Joint Research Centre EUR 19044 EN: Brussels, Belgium, 2000. [Google Scholar]
- Kolli, M.K.; Opp, C.; Groll, M. Estimation of soil erosion and sediment yield concentration across the Kolleru Lake catchment using GIS. Env. Earth Sci. 2021, 80, 161. [Google Scholar] [CrossRef]
- Bathrellos, G.; Skilodimou, H.; Chousianitis, K. Soil Erosion Assesment in Southern Evia Island Using USLE and GIS. Bull. Geol. Soc. Greece 2010, 43, 1572–1581. [Google Scholar] [CrossRef] [Green Version]
- Moore, I.D.; Turner, A.K.; Wilson, J.P.; Jenson, S.K.; Band, L.E. GIS and land-surface-subsurface process modeling. In Environmental Modeling with GIS; Goodchild, M.F.R., Parks, B.O., Steyaert, L.T., Eds.; Oxford University Press: Oxford, UK, 1993; pp. 196–230. [Google Scholar]
- Bathrellos, G.D.; Skilodimou, H.D.; Chousianitis, K.; Youssef, A.M.; Pradhan, B. Suitability estimation for urban development using multi-hazard assessment map. Sci. Total Env. 2017, 575, 119–134. [Google Scholar] [CrossRef]
- Skilodimou, H.D.; Bathrellos, G.D.; Alexakis, D.E. Flood Hazard Assessment Mapping in Burned and Urban Areas. Sustainability 2021, 13, 4455. [Google Scholar] [CrossRef]
- Bathrellos, G.D.; Skilodimou, H.D. Land Use Planning for Natural Hazards. Land 2019, 8, 128. [Google Scholar] [CrossRef] [Green Version]


| Zones | Rainfall (mm) |
|---|---|
| 1 | 400–500 |
| 2 | 500.001–600 |
| 3 | 600.001–700 |
| 4 | 700.001–1100 |
| Group of Formations | K Factor Value |
|---|---|
| Group 1 (alluvial deposits, recent talus cones and scree) | 0.02 |
| Group 2 (marls, sandstones, schists, cherts and travertines) | 0.012 |
| Group 3 (schists and phyllites) | 0.009 |
| Group 4 (limestones, dolomites, greywackes, consolidated conglomerates, peridotites and quartzites) | 0.0005 |
| Land Cover | C Factor Value |
|---|---|
| Scattered urban development, beaches, sand dunes, coastal or inland marshes, industrial or commercial zones and port zones | 0 |
| Coniferous forest, mixed forest and broadleaf forest | 0.001 |
| Transitional wooded scrublands and sclerophyllous vegetation | 0.009 |
| Natural Pastures, grasslands and shrubs | 0.01 |
| Complex cultivation patterns | 0.17 |
| Land occupied by agriculture with significant areas of natural vegetation | 0.2 |
| Non-irrigated arable land | 0.25 |
| Areas of sparse vegetation | 0.35 |
| Olive groves | 0.4 |
| Mining sites | 0.45 |
| Burned areas | 0.55 |
Publisher’s Note: MDPI stays neutral with regard to jurisdictional claims in published maps and institutional affiliations. |
© 2022 by the authors. Licensee MDPI, Basel, Switzerland. This article is an open access article distributed under the terms and conditions of the Creative Commons Attribution (CC BY) license (https://creativecommons.org/licenses/by/4.0/).
Share and Cite
Valkanou, K.; Karymbalis, E.; Bathrellos, G.; Skilodimou, H.; Tsanakas, K.; Papanastassiou, D.; Gaki-Papanastassiou, K. Soil Loss Potential Assessment for Natural and Post-Fire Conditions in Evia Island, Greece. Geosciences 2022, 12, 367. https://doi.org/10.3390/geosciences12100367
Valkanou K, Karymbalis E, Bathrellos G, Skilodimou H, Tsanakas K, Papanastassiou D, Gaki-Papanastassiou K. Soil Loss Potential Assessment for Natural and Post-Fire Conditions in Evia Island, Greece. Geosciences. 2022; 12(10):367. https://doi.org/10.3390/geosciences12100367
Chicago/Turabian StyleValkanou, Kanella, Efthimios Karymbalis, George Bathrellos, Hariklia Skilodimou, Konstantinos Tsanakas, Dimitris Papanastassiou, and Kalliopi Gaki-Papanastassiou. 2022. "Soil Loss Potential Assessment for Natural and Post-Fire Conditions in Evia Island, Greece" Geosciences 12, no. 10: 367. https://doi.org/10.3390/geosciences12100367