1. Introduction
The Siljan Ring is considered to be one of the largest impact structures in the world and has a long history of investigations, for both scientific and applied purposes. A detailed historical overview of this research is given in a report of the 9th WOGOGOB meeting [
1]. The results of geophysical studies, particularly a more detailed recent analysis [
2,
3,
4,
5,
6], provide valuable information about the geological complexity of the area, which includes structural and stratigraphic disturbance. This complexity is a result of the high paleo-tectonic activity in the area and superimposed deformation due to Caledonian orogenic events.
Since the first report of crude oil by Carl von Linné in 1734, the Siljan Ring area has attracted interest as a prospective site for oil and gas exploration [
7,
8,
9].
Petroleum reserves in meteor impact craters possess great potential. Oil and natural gas deposits have been found in an onshore and offshore meteor impact crater, carbonate, sandstone, and granite rocks throughout the world [
10,
11,
12,
13]. Between 1986–1990, two deep wells were drilled in the Siljan Ring area to evaluate this crater for commercial abiogenic gas production as part of the Swedish Deep Gas Drilling project. Although the results of this project were disappointing regarding commercial exploration opportunities, it did not prevent well drilling by the Swedish company, Igrene AB. The published results of two core section investigations (Mora 1 and Solberga 1) [
14] provided important sedimentological and stratigraphic information about the sedimentary cover structure in the western and eastern parts of the Siljan Ring. Recently, comprehensive studies of the Stumsnäs 1 core [
15,
16] highlighted some questions about fracture distribution and mineralization in the basement rocks.
Despite the large number of comprehensive investigations, some key issues are still unresolved, such as the original size of the Siljan structure, the geological settings of the ring basin (depth, tectonic, and stratigraphy), the vertical and lateral extent of impact-related alterations (shock, tectonic, thermal, magnetic) to the occurrence and properties of impact melt rocks [
17].
This study summarizes the results of detailed petrologic investigations of the drill core from a new C-C-1 well drilled in the southwestern part of the Siljan Ring. These results allowed the creation of lithology and petrography columns with descriptions of alteration processes such as fracturing and subsequent mineralization. Taking into account the pore space characteristics and these descriptions, it is possible to highlight reservoir intervals throughout the sedimentary and basement sections. The structure of the Paleozoic sedimentary succession and reservoirs in the basement rocks may be reevaluated with the new information obtained.
These findings are particularly valuable for stratigraphy refinement and tectonic setting reconstructions as well as oil and gas reservoir forecasts.
2. Geological Settings
The Siljan Ring structure is known as a late Devonian (380.9 ± 4.6 Ma) [
18] impact crater and is located in central Sweden. The structure is circular with a central rise of approximately 33 km in diameter (
Figure 1). The central area comprises Proterozoic magmatic, metavolcanic, and metasedimentary rocks. The structure belongs to the Trans-Scandinavian Igneous Belt, and magmatic rocks are predominantly Dala granites (Järna and Siljan types) with sporadically occurring mafic intrusions [
2,
8,
13,
19,
20,
21].
The sedimentary cover is only preserved inside the depression surrounding the central uplift. It comprises a Paleozoic succession of Ordovician to Silurian sediments. The thickness of the sedimentary sequence was estimated at up to 500 m [
22]. In the inner part and outer periphery of the Siljan area, sedimentary strata have opposite dips due to strongly tilting and tectonic deformation, which has been considered to be the consequence of impact [
23].
The Ordovician sedimentary rocks unconformably overlie the Proterozoic basement and predominantly consist of limestones with some shales—Tøyen Formation and Fjäcka Shale (
Figure 2) [
1,
16,
24].
The lower Silurian section (Llandovery–Wenlock) comprises marls, nodular limestones, shales, mudstones, and sandstones [
14,
25].
The established stratigraphy was greatly refined by studies on the new Mora 1 and Solberga 1 drill cores (
Figure 2) [
14]. If compared with the typical Ordovician and Silurian succession of the Siljan region, a considerable part of the section was missing in the Mora area: mostly the Middle and Upper Ordovician carbonates, which are preserved in the eastern part of the impact structure. The upper part of the section contains a Silurian siliciclastic succession which unconformably overlies Middle Ordovician limestones. A classical Ordovician–Silurian carbonate–shale succession has been described from the Solberga 1 drill core, although stratigraphic disturbance by the two thrust planes complicates the geological interpretation. This description was used to support a suggestion about the differentiation of Ordovician–Silurian facies belts. The evolution of facies corresponded to the transition from carbonate platform environments to continental conditions [
14].
The ring structure is identified as a ring graben [
5,
6] divided into mega-blocks by faults with significant horizontal displacements. On seismic reflection, it is clearly visible that basement blocks and sedimentary successions are often sharply inclined or overturned [
2,
3,
4]. Such geological complications are interpreted to be the results of the Caledonian orogeny and the posterior Devonian impact event.
3. Materials and Methods
In 2017, Swedish company Igrene AB drilled the C-C-1 well in the southwestern part of the Siljan Ring close to the Mora 1 site (
Figure 1). The provided core is 602.30 m long, which includes 373.55 m of sedimentary and 228.75 m of basement rock sections. The interval of sedimentary cover ranges from 32.60 to 406.15 m and the basement section from 406.15 to 634.90 m.
Detailed petrologic descriptions were performed on 54 sedimentary and 46 basement rock samples as a result of laboratory investigations, which included structure analysis in samples, texture and mineralogical analysis in thin sections.
Structures were defined by visual examination of samples (approximately 5 × 10 cm in size) and basic assumptions of rock formation conditions were made. Texture and mineralogical analyses were conducted in thin sections using a polarizing microscope (Axio Imager A2m, Carl Zeiss MicroImaging GmbH). The results obtained included the main constituents (minerals and rock fragments), their relations, and alteration processes.
To determine the mineralogy of the basement rock, four samples of the main rock types were analyzed using X-ray diffractometry (XRD system, RIGAKU SmartLab, Japan). The WPPF (Whole Powder Pattern Fitting) method was used for quantitative analysis. This method was considered to be more suitable for the calculation of quantitative values due to mathematical profile fitting based on information about the crystal structure.
The XRD analysis was performed on the bulk mass. The calculation result was given as a percentage of the main mineral phases and used to calibrate the petrologic description of the general mineralogical rock content.
Description of fracturing was based on visual estimation of fracture relationships and dip angle combined with the analysis of fracture mineralization in thin sections. The fracture dip angle was determined assuming a vertical borehole.
Image analysis was conducted to estimate the ratio of open pore space and microporosity zones in the entire volume of rock. Ten samples of basement rock were chosen for this type of analysis. The study included the following stages:
determination of main model components based on petrographic description;
delineation of determined components on photomicrographs as geometrical zones (Adobe Photoshop);
digital analysis of delineated zones in software with percentage results (AxioVision Software).
Based on the petrologic description, four macrocomponents were selected:
The cataclase and zones of calcite filling have mostly developed along the fractures. The segments of each component were marked with different colors. Same-color segments form macrocomponents. Component images were converted into a binary format, in which component pixels were labeled by units, and the remaining pixels were zeros. The binary results were divided into geometric segments by program processing.
Each geometric segment includes a set of morphological attributes such as area, perimeter, form factor, aspect ratio, and orientation of the main axis of inertia.
Statistical processing of the obtained data resulted in a numerical model of the structural and textural features of the rocks, including the percentage of each component in the test image and their geometric parameters.
The obtained data enables an estimation of the ratio of open-pore space to the whole volume of rock, together with the percentages of other important components such as microporosity and zones of calcite filling.
A scanning electron microscope (JEOL 6610, Japan) was used to confirm the presence of microporosity in the cataclase zones.
Laboratory measurements of porosity and permeability were performed for the four whole core samples. The core samples had a diameter of 5.0 cm and a length ranging between 9.0–13.0 cm.
Porosity was defined as open porosity and measured using the liquid saturation method. The saturating fluid was NaCl solution with mineralization of 225 g/L (ρ = 1.146 g/cm3). The whole pore volume was determined by the weight difference between the saturated and dry weight of the sample using electronic scales.
Permeability was defined as absolute permeability and measured using the probe (profile) method and unsteady-state equipment. Nitrogen was used as the test fluid. The probe seal pressure was maintained at 12 atm. Considering pore space heterogeneity, 20 points of measurement were allocated along the long axis of the sample.
The core section was divided into 12 units according to the genetic identity of the rocks. Descriptions of units and rock properties are given in the following sections.
4. Results
4.1. Basement Interval
The basement interval comprises Proterozoic metavolcanic and metasedimentary rocks with a single mafic intrusion (gabbro-dolerite) in the upper part. Mineralogical changes in the rock composition, such as fine-grained sericite and albite neoformation, reveal that the area has gone through the low-grade stage of metamorphism at temperatures presumable up to 200 °C [
26,
27,
28,
29]. However, the rocks often have relict sedimentary structures, such as horizontal and lenticular layering. Thus, it could be possible to suggest that these rocks have been only partially metamorphosed.
Considering the prevalence of a particular rock type, the basement interval was divided into four units (
Figure 3).
The first unit (at a depth of 555.33 to 634.90 m) comprises the intercalation of albite-quartz metasiltstones and metatuff siltstones. There are some layers of sericite-quartz vitric metatuffs in the lower part of the unit, which probably indicate the time of the most active volcanogenic phase.
The second unit (at a depth of 542.81 to 555.33 m) is represented by a transition from albite-quartz metatuffs to sericite-quartz vitric metatuffs.
The third unit (at a depth of 461.43 to 542.81 m) is represented by a transition from sericite-albite-quartz silty metasandstones to albite-quartz metasandstones. There are layers of sericite-quartz vitric metatuffs in the lower part of the unit and sericite-quartz metatuffstones in the upper part of the unit.
The fourth unit (at a depth of 406.15 to 461.43 m) comprises intercalation of sericite-quartz metatuffstones, sericite-quartz vitric metatuffs, and albite-quartz metatuffs. The mafic intrusion (gabbro-dolerite) occurs at a depth of 409.65 to 422.40 m.
A generalized petrologic description of rock samples and thin sections is given in
Table 1. Mineralogical rock content was calibrated using the results of the XRD analysis (
Table 2).
Table 1.
Generalized petrologic description of the main petrotypes.
Table 1.
Generalized petrologic description of the main petrotypes.
| Rock Type | Color | Structure | Texture | Content | Alterations |
|---|
Albite-quartz metasiltstones
(Figure 4a–c) | Brown, wine red, dark-gray, gray | Massive, spotted, rarely—lenticular bedding, poorly distinguished horizontal bedding | Lepidoblastic, relict psammite-silty | Quartz | 80–85% | Calcite replacement of some matrix parts and chloritization of biotite flakes |
| Na-Ca feldspar | 10–15% |
| K-feldspar | 2–3% |
| Micas (muscovite, biotite) | 1–2% |
| Siliceous rock clasts | 1–2% |
| Calcite, chlorite | <1% |
Albite-quartz metatuffs
(Figure 4d–f) | Reddish, greenish-gray | Lenticular, horizontal bedding, spotted | Microgranoblastic, vitric in some parts | Quartz | 45–50% | |
| Na-Ca feldspar | 30–35% |
| K-feldspar | 5–10% |
| Mica (muscovite) | 8–10% |
| Calcite, dolomite, chlorite | <3% |
Sericite-quartz vitric metatuffs
(Figure 4g–i) | Greenish-gray, light-green | Horizontal bedding, spotted, fluidal | Vitric | Quartz | 70–75% | The most of the rock matrix is volcanic glass, which has been almost completely replaced by calcite and sericite in some parts |
| Na-Ca feldspar (albite) | 15–20% |
| Mica (muscovite) | 10–12% |
| K-feldspar | 1–3% |
| Calcite, sericite | <1% |
Sericite-albite-quartz silty metasandstones
(Figure 5a–c) | Brown | Massive, poorly distinguished bedding in some parts | Silty-psammite | Quartz | 80–85% | Calcite and sericite replace the rock matrix in some parts |
| Na-Ca feldspar | 10–12% |
| K-feldspar | 3–5% |
| Mica (muscovite) | 1–2% |
| Calcite, sericite | <1% |
| Albite-quartz metasandstones (Figure 5d–f) | Brown | Massive, poorly distinguished bedding in some parts | Granoblastic, relict psammitic | Quartz | 80–85% | Sericite-feldspar filling in the intergranular space |
| Na-Ca feldspar (albite) | 10–15% |
| K-feldspar | 2–3% |
| Mica (muscovite) | 1–2% |
| Siliceous rock clasts | 1–2% |
| Calcite, chlorite | <1% |
Gabbro-dolerite
(Figure 5g–i) | Black, red, and light gray spots in some parts | Massive, spotted | Poikilitic-ophitic, ophitic with micro-pegmatitic elements | Na-Ca feldspar (labradorite) | 55–60% | |
| Clinopyroxene | 10–15% |
| Orthopyroxene | 5–10% |
| Olivine | 5–7% |
| Micro-Pegmatite | 5–10% |
| Mica (biotite) | 3–5% |
| Quartz | 2–3% |
| Amphibole, volcanic glass clasts, chlorite, sericite, iron hydroxide | <1% |
Table 2.
The result of Quantitative XRD-analysis of Four Basement Rock Samples (bulk mass).
Table 2.
The result of Quantitative XRD-analysis of Four Basement Rock Samples (bulk mass).
| Phase Name | Formula * | Content (%) |
|---|
Albite-Quartz Metasiltstone 621.14 m
(1st unit) | Albite-Quartz Metatuff
551.75 m
(2nd unit) | Sericite-Albite-Quartz Silty Metasandstone
535.75 m
(3rd unit) | Albite-Quartz Metasandstone
469.82 m
(3rd unit) |
|---|
| Quartz | SiO2 | 57.5 | 45.9 | 48.1 | 47.2 |
Na-Ca feldspar
(Albite) | (Na.98 Ca.02) (Si2.98 Al1.02) O8 | 23.6 | 35.2 | 25.6 | 31.3 |
K-feldspar
(Orthoclase
-Microcline) | K[AlSi3O8] | 7.5 | 8.5 | 19.2 | 6.9 |
| Muscovite-2M1 | (K,Na)Al2(Si,Al)4O10 (OH)2 | 6.0 | 8.1 | 6.9 | 7.6 |
| Calcite | Ca (CO3) | 5.0 | 1.3 | 0.2 | 6.5 |
| Pyrite | FeS2 | 0.2 | | | |
| Chlorite | Si3 Al1.2 Mg5 Fe.1 Cr.7 O18 H7.9 | 0.2 | 0.5 | | 0.2 |
| Dolomite | Ca (Ca0.07 Mg0.93)(CO3)2 | | 0.5 | | |
| Anhydrite | CaSO4 | | | | 0.3 |
Sample depth 627.07 m (1st unit): (a) spotted structure and poorly distinguished horizontal lamination in albite-quartz metasiltstones; (b) psammite-silty texture; (c) quartz prevalence.
Sample depth 553.48 m (2nd unit): (d) horizontal lamination in albite-quartz metatuffs; (e) micro-granoblastic and vitric texture; (f) quartz-feldspar prevalence.
Sample depth 547.83 m: (2nd unit): (g) fluidal structure in sericite-quartz vitric metatuffs; (h) quartz grains in vitric mass; (i) calcite zones in the upper and lower parts of the section.
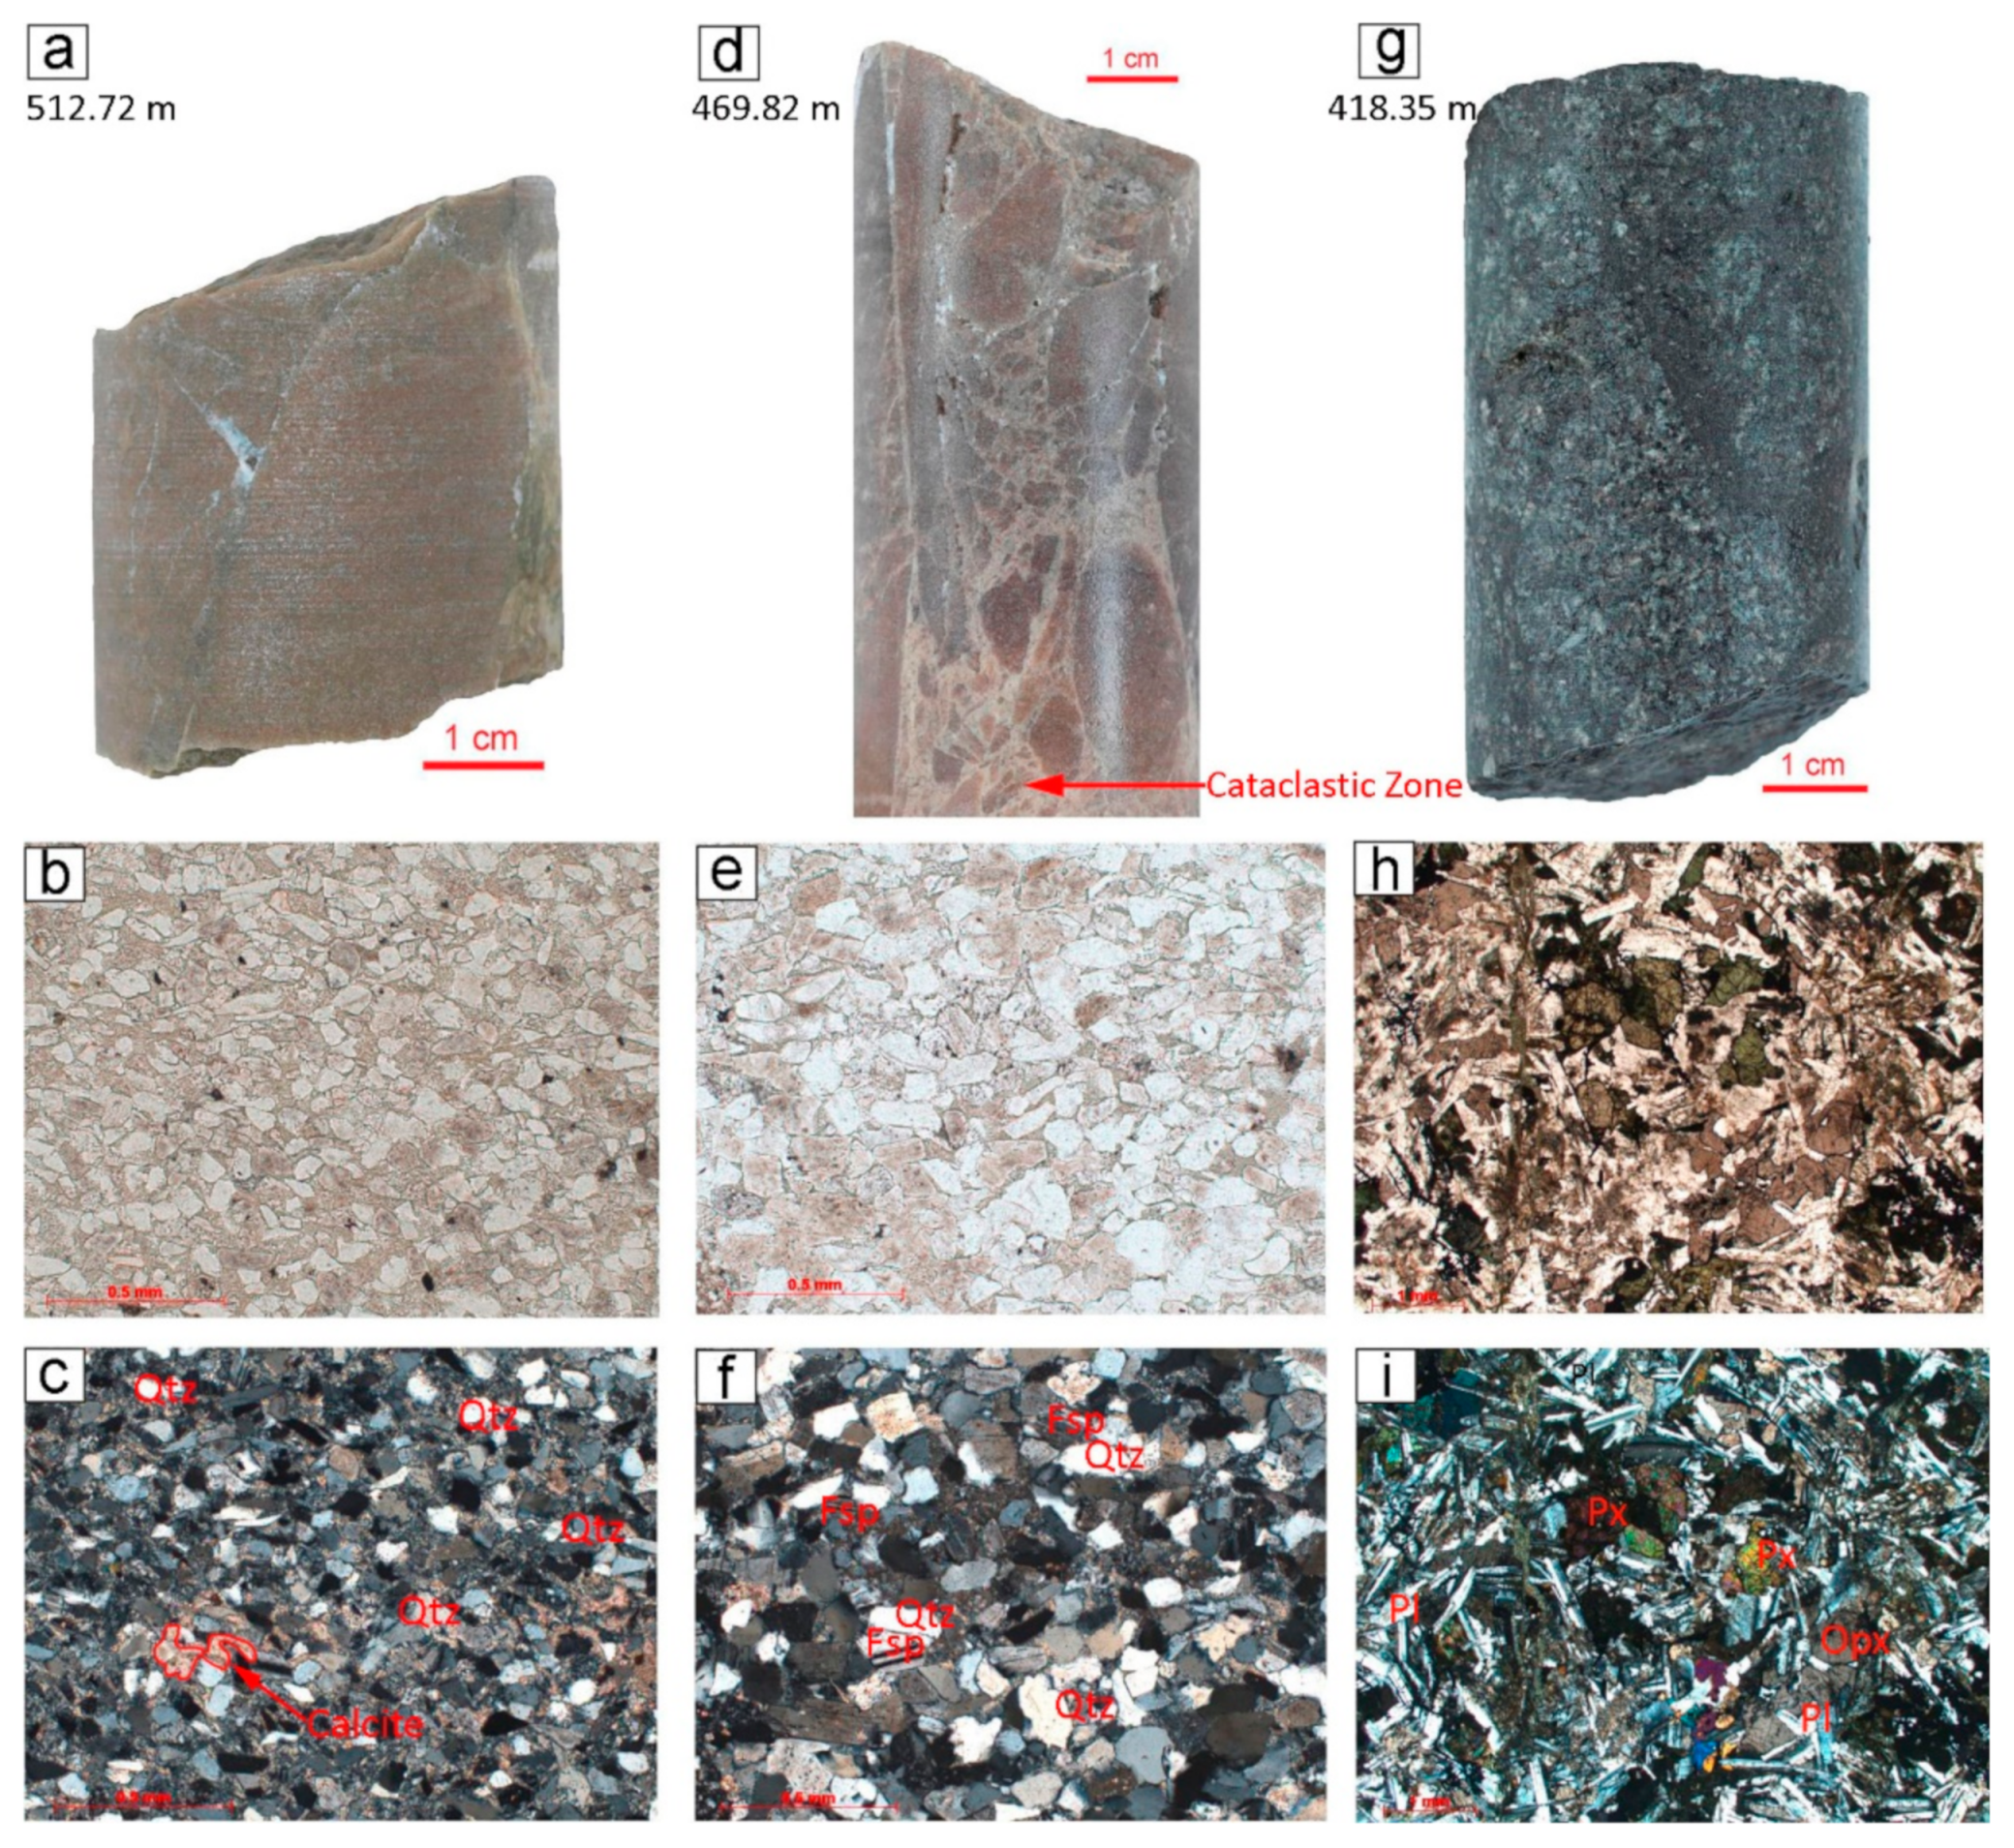
Sample depth 512.72 m (3rd unit): (a) massive structure of sericite-albite-quartz silty metasandstones; (b) silty-psammite texture; (c) quartz prevalence; spots of calcite in gray mass.
Sample depth 469.82 m (3rd unit): (d) cataclastic zone in albite-quartz metasandstones; (e) relict psammite texture; (f) quartz-feldspar prevalence.
Sample depth 418.35 m (4th unit): (g) spotted structure in gabbro-dolerite; (h) poikilitic-ophitic texture; (i) prevalence of Na-Ca feldspar and pyroxenes.
4.2. Sedimentary Cover Interval
A comparison with the results of previous studies and lithological descriptions in the stratigraphic schemes [
17,
22,
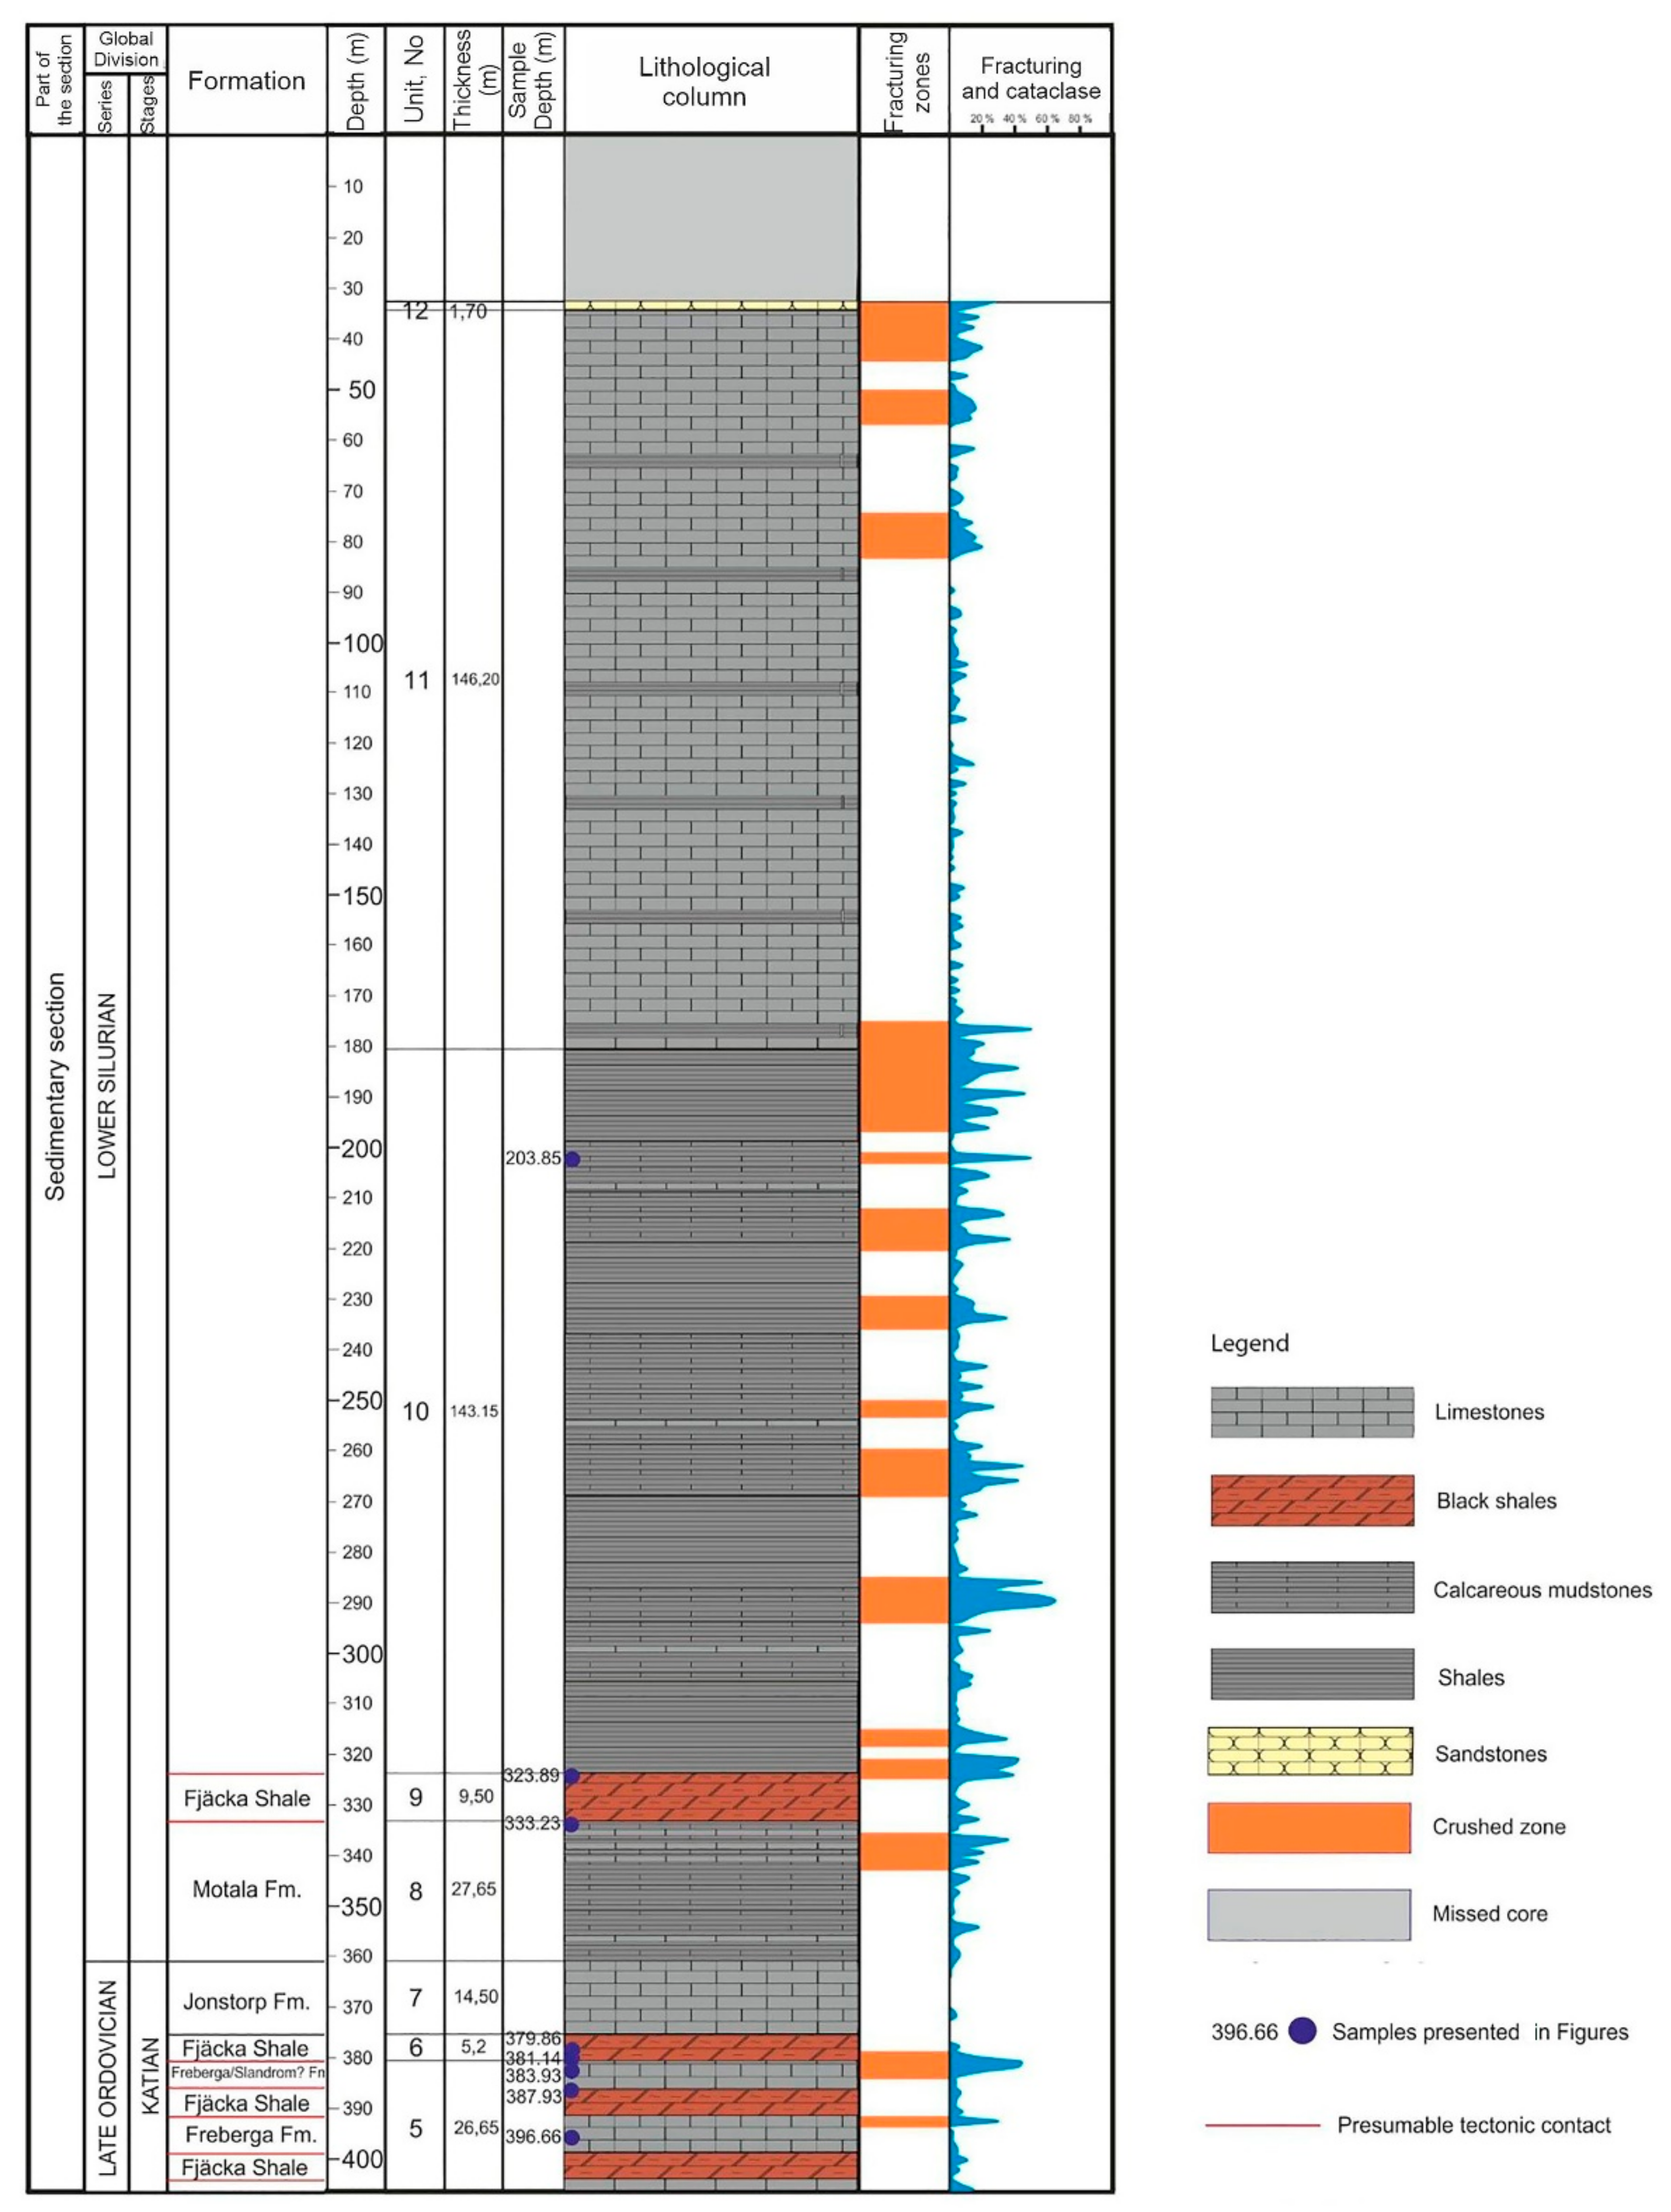
25] allows us to conclude that sedimentary layers represent Upper Ordovician and Silurian sediments, and have disturbed stratigraphic relations (
Figure 6). The interval was subdivided into eight units according to their lithological homogeneity.
The fifth unit (at depth of 380.50 to 406.15 m) is represented by the intercalation of black shales and wackestones. The thickness of the black shale layers varies from 0.2 to 9.0 m, the thickness of wackestones is 0.3–2.0 m.
Wackestones (
Figure 7a,d) are shades of gray and intercalate with dark-gray clayey limestones and calcareous mudstones. Fossils are represented by fragments comprising trilobites, hyolithid, bryozoans, pelmatozoans, ostracodes, brachiopode shells, and, rarely, charophyceae remains.
Black shales (
Figure 7e,f) are dark-brown to black and are predominantly massive; sometimes they are thin laminated. They contain a quartz silt-size admixture of up to 25% and approx. 15–30% dispersed organic matter.
Sample depth 396.66 m (5th unit): (a) spotted structure and intraclasts in gray wackestone; shifting of rock parts along the inclined fracture; (b) detritus and cataclastic zone in wackestone.
Sample depth 387.93 m (5th unit): (c) spotted structure in gray wackestone; (d) trilobites, bryozoan clasts, and charophyceae remains; sub-horizontal fracture.
Sample depth 379.86 m (6th unit): (e) massive structure in black shale; (f) silty black shale; single fragment of a brachiopod (the matrix is brown due to dispersed organic matter).
A comparison with the lithological descriptions published in previous studies [
17,
22,
25,
30] suggests that the wackestones belong to Freberga and Slandrom formations (Upper Ordovician), and the black shales intervals are Fjäcka Shale layers.
The basis for the comparison was rock structure, texture, and fauna assemblage. The Freberga and Slandrom limestones were described in previous works as greenish-gray calcarenites and nodular calcilutites with an abundance of trilobites, ostracodes, and brachiopods. The Fjäcka Shale was defined as brownish to black bituminous shale. The more common fossils in shale were trilobites and brachiopods.
All of the lithological features identified in the new samples have a certain similarity to the previously established rock characteristics. Thus a conclusion has been made about their similarity to the Freberga, Slandrom, and Fjäcka Shale formations.
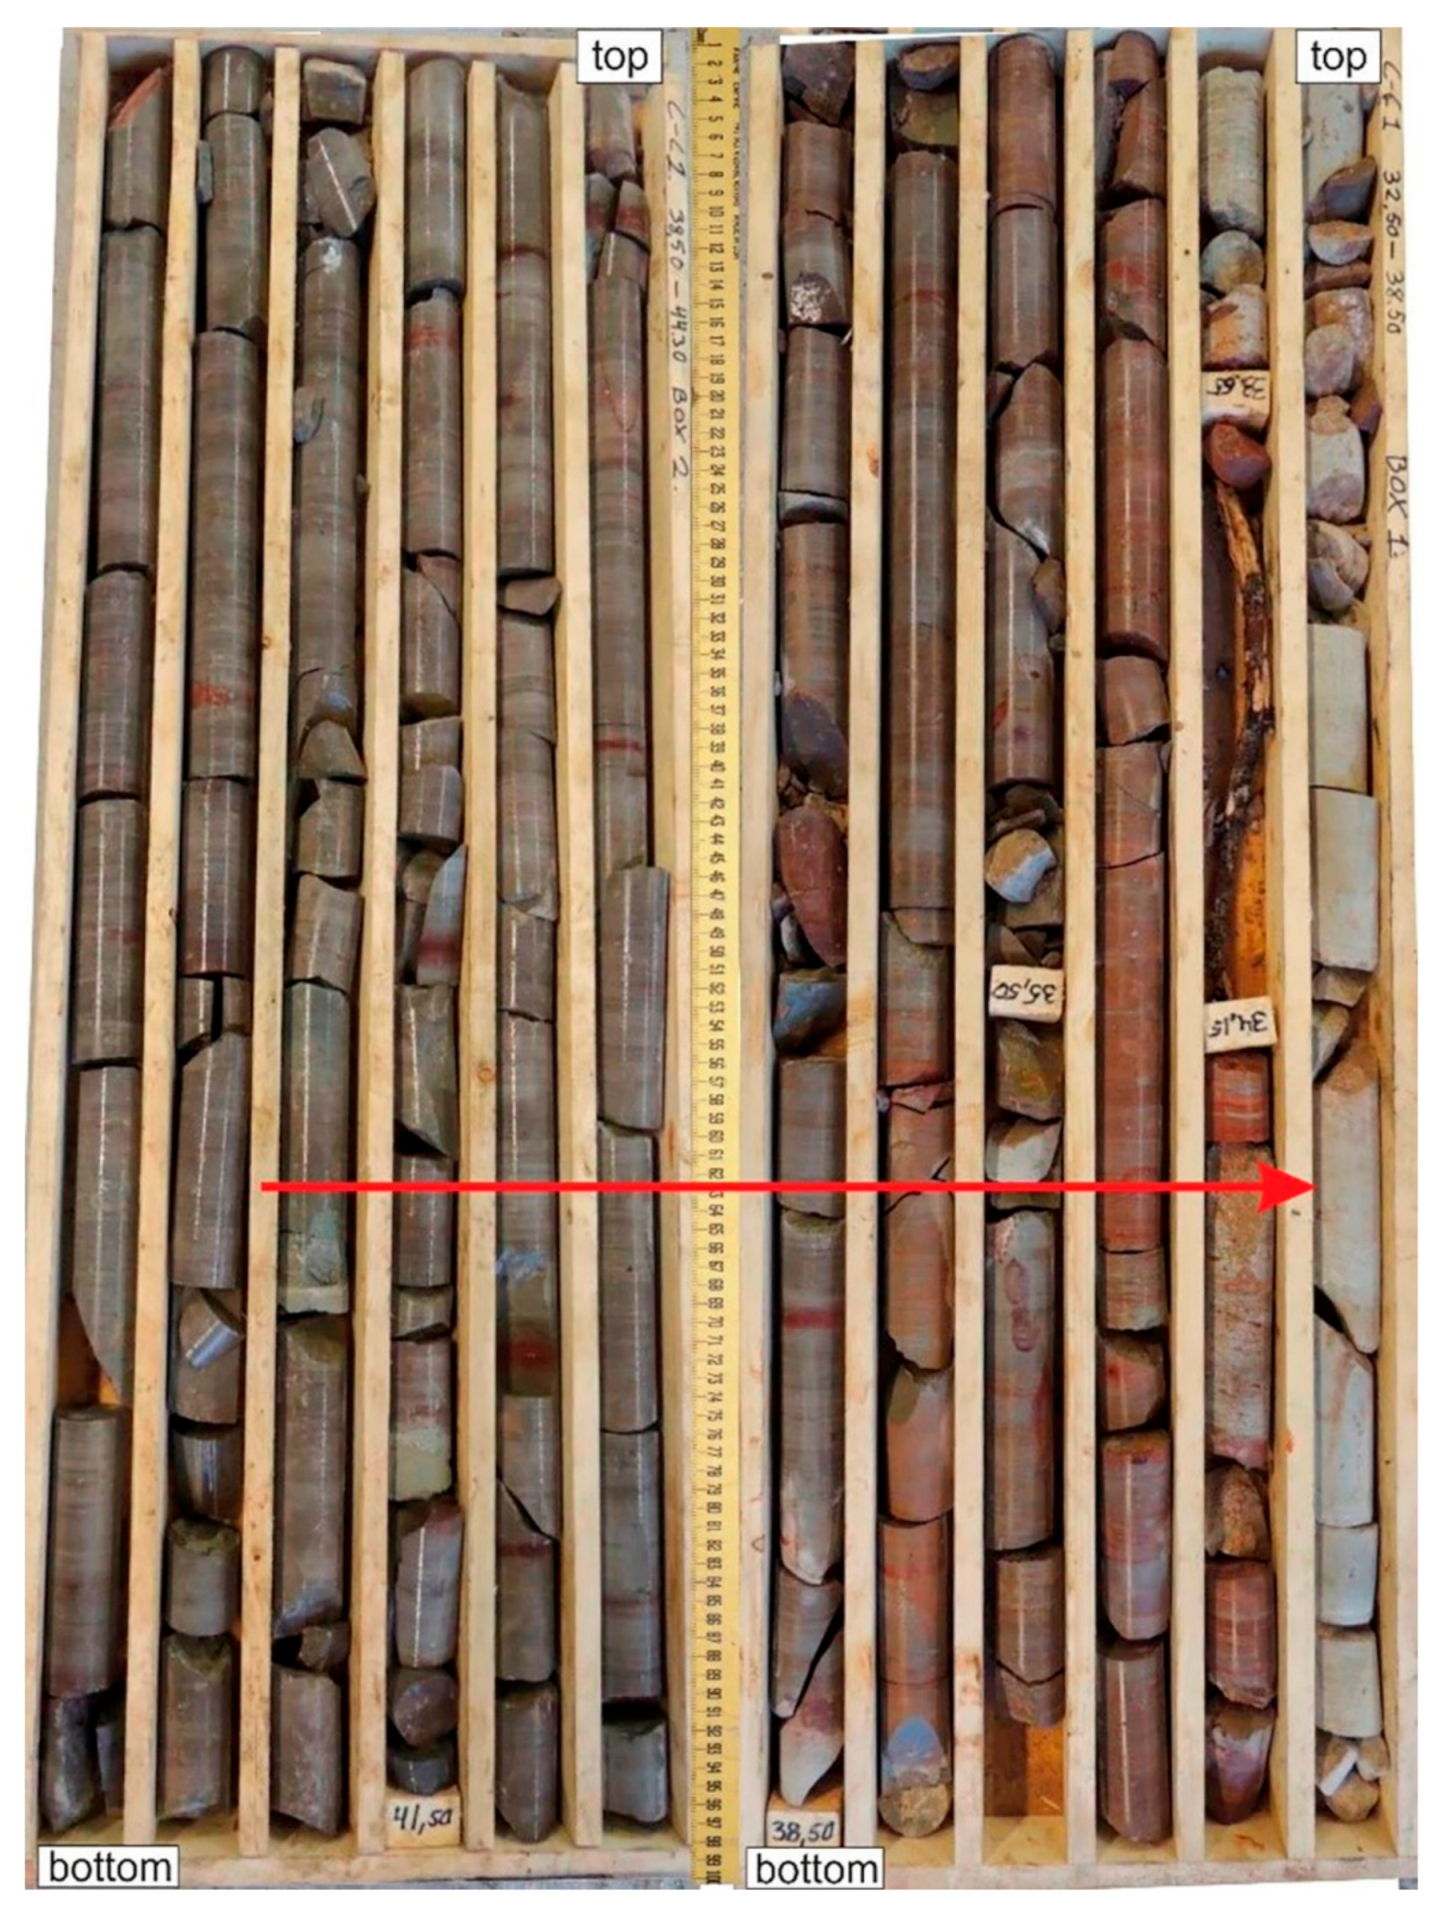
Taking into account features such as the sharp contact with underlying basement rocks and layers in between, slump structures, and evidence of bedding inclination (up to 45 degrees) —due to tectonic displacement—these layers are likely of allochthonous origin (
Figure 8).
The next two units, the sixth and seventh (at a depth of 360.80 to 380.50 m), are represented by layers of black shales and wackestones, respectively. The contact between black shales and wackestones is gradational. However, this interval of wackestones is noticeably different from the underlying rocks. The structures are predominantly nodular; layering is horizontal and the upper part of the wackestone unit has a reddish color (
Figure 9). It has been possible to interpret this as evidence of a transition from Fjäcka Shale to Jonstorp Formation (Upper Ordovician, Katian).
The eighth unit (at depth of 333.15 to 360.80 m) is represented by calcareous mudstones with nodules of clayey limestone. The contact between this unit and underlying rocks is gradational. This evidence, together with the structure-texture rock characteristics, enables us to consider this unit to be a layer of Lower Silurian sediments, the Motala Formation.
Next, the ninth unit (at a depth of 323.65 to 333.15 m) consists of black shales and it has been suggested that slices of Fjäcka Shale were moved due to tectonic activity. The findings of recrystallized limestone with extension fractures (
Figure 10) at the lower boundary and clay-carbonate breccia (
Figure 11) at the upper boundary of the unit may be taken as evidence of this movement.
The breccia clasts are predominantly mudstones and shales with characteristics similar to the overlying rocks. It is more likely that they were incorporated into the clay matrix due to the suggested tectonic movement.
The tenth unit (at depth of 180.50 to 323.65 m) is represented by intercalation of calcareous mudstones (
Figure 12) and shales with occasional layers of clayey limestone. Evidence of crushed zones with rock alteration (cataclase, recrystallization) probably reflects tectonic movements along the fault planes. However, due to the lithological homogeneity of the unit, it is difficult to recognize any stratigraphic differences. Thus, the whole interval has only been considered to be Lower Silurian deposits.
The eleventh unit (at a depth of 34.30 to 180.50 m) consists of predominantly clayey limestone. The structures are nodular and spotted. The upper part of the interval at a depth of 34.30 to 77.60 m is gray, greenish-gray, and reddish that probably correspond to the tricolor member of Lower Silurian deposits (
Figure 13).
A layer of fine to medium-grained light-gray sandstone completes the sedimentary section–the twelfth unit (at a depth of 32.60 to 34.30 m). Taking into account previous studies and regional stratigraphy schemes allows this layer to be considered as the beginning of a new Silurian sedimentary cycle.
4.3. Fracturing and Pore Space Characteristics
4.3.1. Fracturing
Disjunctive deformations have been traced throughout the whole section in sedimentary units, as well as in the basement rocks. In the basement interval, near-vertical and steeply inclined fractures (20–30 degrees) are prevalent (
Figure 14a). In the sedimentary section, thin fractures often form chaotic networks and attenuate on a cm scale (
Figure 14b).
Detailed petrologic studies allowed the identification of four fracture generations that probably correspond to four different tectonic activation stages. In the basement rocks, all stages have been completely defined by thin section investigations, and only two of them have been identified in sedimentary rocks.
The sequence of mineral filling is the basis for fracturing stage recognition (
Figure 15). The first stage is characterized by quartz mineralization along fracture sides. Quartz crystals are often prismatic and have a size of up to 1 mm that probably corresponds to a primary fracture aperture.
During the second stage, the fractures were filled with calcite. Calcite often corrodes quartz crystals and reaches a size of up to 4 mm. Fractures with calcite mineralization have been identified throughout the whole basement section, apart from the gabbro-dolerite intrusion.
The third generation was traced by cataclastic filling with crushed rock mass, calcite, and quartz grains.
In the sedimentary rocks, the third generation developed as cataclastic zones and individual fractures with a clay-carbonate filling (
Figure 16).
The fourth generation was traced in sedimentary rocks, as well as basement rocks, and is represented by tiny extensive fractures sometimes open to a width of 1 mm. These fractures cut across all those fractures from previous generations and have a displacement along their direction (
Figure 17).
4.3.2. Pore Space Characteristics
As a result of detailed investigations, valuable porosity was only found in the basement rocks. It is confined to fractures in albite-quartz metasandstones and sericite albite-quartz silty metasandstones.
In sedimentary rocks, the individual evidence of micro-pore space with the bituminous filling was established in cataclastic zones (
Figure 18a). In some cases, the bituminous filling is confined to individual vugs with calcite mineralization (
Figure 18b).
The total volume of open pore space in the basement rock includes slit-shaped vugs along the fractures, and microporosity developed in the cataclastic zones. The size of the micropores ranges from 0.3 to 12 µm. (
Figure 19).
The results of the image analysis calculation using ten rock samples are as follows (
Figure 20):
“Rock matrix”—52.85–89.14%
”Zone of calcite filling”—0.68–24.87%
“Microporosity zone”—7.16–28.98%.
“Open vugs”—0–3.85%.
Open void space has a square range of 0.83 to 11.07 mm2 (Medium = 2.73). The length rangealong the longest axis 1.94–6.27 mm (Medium = 5.24). The ratio of maximum and minimum sizes of 0.19 to 0.71, respectively, characterized the object shape is elongated.
The numerical characteristics obtained from the image analysis were added to the laboratory measurements of porosity and permeability (
Table 3 and
Table 4). The highest numbers of pore space volume and porosity percentage are confined to the samples with open vugs and microporosity zones (531.67; 542.60 m). However, the permeability values were lower for the second sample (542.60 m) due to the higher number of zones of calcite filling.
Table 3.
Results of porosity measurements.
Table 3.
Results of porosity measurements.
Sample Depth
(m) | Volume
(cm3) | Porosity
(%) |
|---|
| Pore Space | Sample |
|---|
| 531.67 | 2.336 | 58.382 | 4.00 |
| 534.00 | 1.200 | 99.662 | 1.20 |
| 542.60 | 4.000 | 135.009 | 2.96 |
| 592.00 | 1.560 | 126.811 | 1.23 |
Table 4.
Results of permeability measurements.
Table 4.
Results of permeability measurements.
Sample Depth
(m) | Permeability of Each of the Measurement Points
(Along the Long Axis of the Sample, mD) |
|---|
| 1 | 2 | 3 | 4 | 5 | 6 | 7 | 8 | 9 | 10 | 11 | 12 |
|---|
| 531.67 | 0.14 | 9.07 | 64.54 | 0.44 | 0.34 | 1.68 | 0.52 | 4.49 | 2.74 | 57.31 | 6.75 | 0.91 |
| 534.00 | 0.19 | 0.12 | 0.16 | 0.06 | 0.06 | 0.09 | 0.75 | 0.13 | 0.08 | 0.78 | 12.49 | 11.71 |
| 542.60 | 0.15 | 1.07 | 0.45 | 0.34 | 0.72 | 0.30 | 0.06 | 0.08 | 0.06 | 0.06 | 0.08 | 0.05 |
| 592.00 | 0.05 | 0.05 | 0.06 | 0.08 | 0.07 | 0.19 | 0.08 | 0.10 | 0.05 | 0.05 | 0.05 | 0.04 |
Table 5.
Results of Macro-component Modeling of Sericite-albite-quartz silty metasandstones.
5. Discussion
5.1. Geological Settings
In the basement interval, we can see two units with a prevalence of meta-sedimentary rocks—unit 1 and unit 3, which mainly consist of metasiltstones and metasandstones, respectively. This evidence more likely reveals two cycles of Paleoproterozoic clastic sedimentation separated by a phase of volcanic activity, i.e., unit 2, which consists of metatuffs. In comparison, unit 3 is more coarse-grained than unit 1 (sand and silt) and may therefore be the result of increasing sedimentary basin loading due to the start of regional tectonic movements, a new post-orogenic volcanic activity stage [
8,
17,
31,
32]. This stage corresponds to unit 4 comprising metatuffs. A gabbro-dolerite intrusion in the upper part of this unit reveals a phase of tectonic reactivation, which was completely different from the previous stages in terms of magma content and pressure-temperature (P-T) conditions [
20,
32].
The structures of the basement rocks are predominantly primary, e.g., horizontal, lenticular bedding, massive (homogeneous), and the lowest grades of metamorphism may only be revealed by mineralogical changes, such as fine-grained sericite and albite neoformation. It may be concluded from these findings that the area was not subjected to medium and high-grade metamorphism (T = 500–900 °C).
The prevalence of metasedimentary rocks in the basement interval with only lower grade metamorphism may reveal a new boundary between the post-orogenic volcanic and sedimentary rock distribution area.
The shortened and highly disturbed sedimentary cover interval is evidence of the high-level external influence of processes that were more likely impact-related. There is no evidence of normal sedimentary contact between the basement and sedimentary cover, such as the transition to Lower Ordovician glauconitic limestone in the Mora 1 drill core, or Obolus beds in the Solberga 1 drill core. Fractures with displacement, slump, and deformation structures were identified at this contact. This may be related to one of the tectonic reactivation stages that caused moving sedimentary layers along the fault planes.
The lower part of the sedimentary cover interval (5th unit) most likely comprises Upper Ordovician sediments intercalated with layers of Fjäcka Shale, which obviously allochthone, if compared with the stratigraphic diagram of this region [
1,
14,
15,
16]. Lithology comparison has shown no evidence of the carbonate mound facies described in the Kullsberg and Boda carbonate mud mounds, such as stromatactis-bearing carbonate mudstones intercalated with fossiliferous pelmatozoan wackestones, packstones, and grainstones. It was stated that these facies originally had a thickness of up to 40 m (Kullsberg Limestone) and 100 m (Boda Limestone) [
24,
25]. In the studied interval, we only identified the layers comprising calcareous mudstones with nodules of clayey limestone and predominantly nodular wackestones with a thickness of up to 7 m.
These differences may occur due to the lateral facies’ variations which were caused by basin deepening on the western side of the Siljan Ring.
However, the intercalation of the limestones and layers of Fjäcka Shale does not correspond to the regional stratigraphy scheme and lithological column of the adjacent areas [
1,
14,
15]. Moreover, in the fifth unit, there are clearly recognizable features of disturbance, such as the sharp contact between black shale and wackestone layers, and slump structures in the wackestones.
Thus, it may be stated that a significant part of the Lower and Middle Ordovician succession is missing as a result of tectonic displacements.
The presence of Fjäcka Shale in the upper part of the sedimentary cover interval (9th unit), between the suggested Lower Silurian sediments, may also be interpreted as a slice of sedimentary deposits that were moved during a phase of tectonic reactivation.
The discovery of crushed zones with rock alteration, such as cataclase and recrystallization (10th unit, Lower Silurian) is probably confined to fault planes. These fault planes may not be accompanied by thrusting or other significant changes in the stratigraphy position of the layers due to the impact event as it had been established for the Stumsnäs area [
15].
Although it is difficult to establish the exact nature and thickness of the missing intervals, a general conclusion about sedimentary environments may be drawn. The intercalation limestone and shale open-marine facies are recognizable and the conditions were favorable for organic matter accumulation in the shale intervals.
A cyclic character of sedimentary sequences has been revealed in a detailed lithological investigation. The black shale and shale layers more likely were formed at the time of sea deepening that has been accompanied by low hydrodynamic activity and anoxic conditions. The gradual transition from black shales to red-colored wackstones was recognized in some undisturbed sedimentary intervals. This is obviously evidence of the regression, which indicates a rising in the bottom-level oxygenation [
33].
The nodular structures, detrital textures, and lime composition of the sedimentary rocks suggest a shallow marine shelf environment, probably a sublittoral zone with unfavorable conditions for the high-relief organic buildup. The high clay content (up to 10%) in limestones and the diversity of neritic fauna (trilobite, hyolithid, bryozoans, charophyceae) is evidence of such types of environments [
14,
24].
There is only evidence of next regression in the upper part of the sedimentary cover interval, i.e., the Lower Silurian sediments. The sedimentary transition from greenish-gray and reddish clayey limestones to light-gray sandstones suggests the start of a new cycle of clastic deposition during the Silurian [
6,
14].
5.2. Tectonic Events
Establishing fracture generation enables the reconstruction of Neo- and Post-Proterozoic tectonic events [
8,
19,
21,
31,
34].
The described geological section was located in an area that had been geodynamically active throughout the whole Proterozoic and Paleozoic Era. The geological evolution of the Siljan structure included the intrusion of TIB granitoids, mafic dykes, several hydrothermal activations, and a powerful Late-Paleozoic compression event accompanied by destroying of the sedimentary succession [
19].
As the relative age of fractures can be identified by investigating the samples and thin sections, it was possible to group the documented data into several fracturing episodes. However, there has still been a high degree of uncertainty in establishing the absolute age of the tectonic events and mineralization phases due to the poor distinguishing of contact between different systems of mineralized fractures in a single well column. Based on the documented data, four generations of fractures were recognized in the C-C-1 drill core that corresponds to four stages of tectonic reactivation.
The first two generations are only established in the basement rocks and were accompanied by hydrothermal circulations. The first stage resulted in quartz mineralization while the second stage resulted in calcite mineralization. It may be suggested that mafic dyke intrusions correlate with the peak of the first fracturing event when the maximum extension might have had taken place. The absolute age of dolerite dykes in the region was estimated to be 0.9–1.1 Ga [
20]. Thus, there were obviously changes in the chemical composition of the fluids for the two tectonic events that affected the basement rocks before Paleozoic sedimentation. However, the inheritable sequence of mineralization, possibly shows that it happened at the same time as fracturing phases.
The third stage, accompanied by the formation of cataclastics, may be the result of an impact-generated tension. In the available core set, the presence of the cataclastic zones has been detected everywhere: in the sedimentary, metamorphic, and igneous basement rocks. This evidence supports the suggestion of a ubiquitous peculiar stress regime that affected the rocks at the third stage and had been accompanied by the displacement of the rock layers under great pressure.
The fourth fracture generation crosses previous generations and is therefore suggested to be the result of the latest tectonic movements associated with Caledonian orogeny [
8,
19,
21,
22,
31,
34]. The youngest fractures appear to be the result of the relaxation of accumulated stress during Mesozoic and Cenozoic geodynamic changes.
5.3. Reservoir Properties
Some of the open vugs have been developed along the second fracture generation. The open space has been formed as a result of incomplete calcite filling or subsequent calcite dissolution. Although the percentage of open vugs is not high, their geometric parameters correspond to high connectivity, resulting in good reservoir properties. This network of open fractures with vugs may be considered to be an effective storage space for hydrocarbons.
Potentially effective gas storage may be found in the microporosity space that is confined to cataclastic zones in the basement rocks [
35]. The evidence of the bituminous filling of such zones in sedimentary rocks is indirect proof of the presence of microporosity.
Thus, two out of four recognizable tectonic events caused inheritable reservoir rock formation: the second event—which resulted in open fractures, and the third event—which caused a cataclase. As a result, the intervals of fractured basement rocks with open vugs are possible reservoir intervals, and the effective pore space may be calculated as a sum of open vugs and microporosity zones.
Considering the evidence of the bituminous filling of vugs and microporosity zones in limestones, it is possible to suggest a reservoir presence in sedimentary layers regarding opened fracture network development, or also that they possess primary pore space.
In a global context, commercial oil and gas deposits in the Precambrian crystalline basement have been developed in more than 20 countries throughout the world [
13]. Moreover, any rocks may be considered to be a reservoir, if they have effective porosity connected with fractured zones.
As fracture networks developed along the fault zones are important economic targets for the exploration of natural gas in the Siljan area, recognition of the particular fractured intervals is an important stage in hydrocarbon prospecting [
9,
15,
36].
6. Conclusions
The results of the C-C-1 drill core investigation allow the following conclusions to be drawn:
1. The structure of the basement interval reveals some features of the geological evolution of the Proterozoic basin in the Siljan Ring area. Two layers of tuff and gabbro-dolerite intrusion represent the time of tectonic and volcanic activation stages. Taking into consideration the petrologic characteristics of the units between them, two clastic sedimentary cycles have been identified as being from the Proterozoic Era: the first cycle with less sedimentary loading (metasiltstones) and the second cycle with loading increase (metasandstones).
Although the basement rock structures show weak dislocations, mineralogical changes, such as fine-grained sericite and albite neoformation, reveal very low-grade metamorphism.
2. Based on the results of the petrologic investigation, it has been concluded that the sedimentary cover interval is not complete as a result of tectonic displacements, and a significant part of the Lower and Middle Ordovician succession is missing. The presence of Fjäcka Shale layers between the Upper Ordovician and Lower Silurian sediments is suggested to be the result of thrust formation and there is a possibility of determining fault planes.
Structures, textures, and the composition of the limestones suggest their deposition in the sublittoral zone in a shallow-marine basin with unfavorable conditions for high-relief organic buildup.
3. There are four fracture generations that correspond to Post-Proterozoic tectonic reactivation stages. These events are recognizable by mineralization sequences and fracture interrelations. The first and second generations are only present in the basement rocks and are characterized by quartz and calcite filling. A dissolution along the second-generation fractures is more likely to be associated with the thermal circulation of fluid due to tectonic activity. The third generation is accompanied by cataclastic zones and probably has an impact-related nature. The fourth-generation fractures cut through all previous fractures and probably reveal a new tectonic reactivation.
4. In the C-C-1 core, reservoir rocks are fractured basement rocks with good porosity values. Porosity zones developed along fractures; two types can be distinguished. The first, open vugs, formed in albite-quartz metasandstones, and sericite albite-quartz silty metasandstones along the second-generation fractures have been partially filled by calcite. The second type, microporosity zones, occurs in cataclastic rock along the third-generation fractures. This has been confirmed by an investigation using a scanning electron microscope (SEM).
5. The results of the image analysis provide a basis for the numerical modeling of structural-textural rock features. It includes the percentage of components such as “Rock matrix”, “Zone of calcite filling”, “Microporosity zone” and “Open vugs”.
The “Microporosity zone” and “Open vugs” are considered to be effective spaces for hydrocarbon storage. Their percentage may be included as an additional coefficient in the petrophysical data used in resource evaluation.
Author Contributions
Conceptualization, A.P., O.S., V.K., and A.B.; methodology, A.P., O.S. and A.B.; investigation, O.S., A.B., M.T., I.S., and E.I.; resources, V.K. and V.M.; writing—original draft preparation, O.S., M.T., I.S., and E.I.; writing—review and editing O.S. and M.T.; visualization, O.S. and A.B.; supervision, A.P., O.S. and V.K. All authors have read and agreed to the published version of the manuscript.
Funding
This research received no external funding.
Data Availability Statement
The data presented in this study are available on request from the corresponding author. The data are not publicly available due to commercial report restrictions.
Acknowledgments
The article benefited from the support of the Swedish company, Igrene AB. The authors would like to thank their colleagues from the Department of Lithology (Gubkin University of Oil and Gas) for their helpful comments and suggestions. Also, the authors gratefully appreciate the comments and constructive suggestions of all reviewers.
Conflicts of Interest
The authors declare no conflict of interest.
References
- Ebbestad, J.O.R.; Högström, A.E.S. Ordovician of the Siljan district, Sweden. In Sveriges Geologiska Undersökning Rapporter och meddelanden, Proceedings of the WOGOGOB 9th Meeting of the Working Group on Ordovician Geology of Baltoscandia: Field Guide and Abstracts, Rättvik, Sweden, 17–20 August 2007; Ebbestad, J.O.R., Wickström, L.M., Högström, A.E.S., Eds.; Geological Survey of Sweden: Uppsala, Sweden, 2007; Volume 128, pp. 7–26. [Google Scholar]
- Harbe, M.; Juhlin, C.; Lehnert, O.; Meinhold, G.; Andersson, M.; Juanateya, M.G.; Malehmir, A. Analysis of borehole geophysical data from the Mora area of the Siljan Ring impact structure, central Sweden. J. Appl. Geophys. 2015, 115, 183–196. [Google Scholar]
- Harbe, M.; Juhlin, C.; Sopher, D.; Lehnert, O.; Arslan, A.; Meinhold, G. High-resolution seismic images of Paleozoic rocks in the Mora area, Siljan Ring structure, central Sweden. J. Geol. Soc. Swed. 2017, 139, 260–275. [Google Scholar]
- Harbe, M.; Juhlin, C.; Malehmir, A.; Sopher, D. Integrated interpretation of geophysical data of the Paleozoic structure in the northwestern part of the Siljan Ring impact crater, central Sweden. J. Appl. Geophys. 2017, 148, 201–215. [Google Scholar]
- Juhlin, C.; Pedersen, L.B. Reflection seismic investigations of the Siljan impact structure, Sweden. J. Geophys. Res. 1987, 92, 14113–14122. [Google Scholar] [CrossRef]
- Juhlin, C.; Sturkell, E.; Ebbestad, J.O.R.; Lehnert, O.; Högström, A.E.S.; Meinhold, G. A new interpretation of the sedimentary cover in the western Siljan Ring area, central Sweden, based on seismic data. Tectonophysics 2012, 860, 88–99. [Google Scholar] [CrossRef] [Green Version]
- Ahmed, M.; Lehnert, O.; Fuentes, D.; Meinhold, G. Origin of oil and bitumen in the Late Devonian Siljan impact structure, central Sweden. Org. Geochem. 2014, 68, 13–26. [Google Scholar] [CrossRef]
- Rutanen, H.; Andersson, U.B. Mafic plutonic rocks in a continental-arc setting: Geochemistry of 1.87–1.78 Ga rocks from south-central Sweden and models of their palaeotectonic setting. Geol. J. 2009, 44, 241–279. [Google Scholar] [CrossRef]
- Sandström, B.; Tullborg, E.-L.; De Torres, T.; Ortiz, J.E. The occurrence and potential origin of asphaltite in bedrock fractures, Forsmark, central Sweden. J. Geol. Soc. Swed. 2006, 128, 233–242. [Google Scholar] [CrossRef]
- Curtiss, D.K.; Wavrek, D.A. Hydrocarbons in meteorite impact structures: Oil reserves in the Ames feature. J. Miner. Met. Mater. Soc. 1998, 50, 35–37. [Google Scholar] [CrossRef]
- Donofrio, R.R. North American impact structures hold giant field potential. Oil Gas J. 1998, 96, 69–80. [Google Scholar]
- Kutcherov, V.G. Abiogenic Deep Origin of Hydrocarbons and Oil and Gas Deposits Formation, Hydrocarbon. In Hydrocarbons and Oil and Gas Deposits Formation; InTechOpen: London, UK, 2013. [Google Scholar] [CrossRef] [Green Version]
- Kresten, P. Geochemistry and tectonic setting of metavolcanics and granitoids from the Falun area, south central Sweden. Geol. Föreningens Stockh. Förhandlingar 1986, 107, 275–285. [Google Scholar] [CrossRef]
- Lehnert, O.; Meinhold, G.; Bergström, S.M.; Calner, M.; Ebbestad, J.O.R.; Egenhoff, S.; Frisk, Å.M.; Hannah, J.L.; Högström, A.E.S.; Huff, W.D.; et al. New Ordovician–Silurian drill cores from the Siljan impact structure in central Sweden: An integral part of the Swedish Deep Drilling Program. J. Geol. Soc. Swed. 2012, 134, 87–98. [Google Scholar] [CrossRef]
- Arslan, A.; Meinhold, G.; Lehnert, O. Ordovician sediments sandwiched between Proterozoic basement slivers: Tectonic structures in the Stumsnäs 1drill core from the Siljan Ring, central Sweden. J. Geol. Soc. Swed. 2013, 135, 213–227. [Google Scholar] [CrossRef]
- Lehnert, O.; Meinhold, G.; Arslan, A.; Ebbestad, J.O.R.; Calner, M. Ordovician stratigraphy of the Stumsnäs 1 core from the southern part of the Siljan Ring, central Sweden. J. Geol. Soc. Swed. 2013, 135, 204–212. [Google Scholar] [CrossRef]
- Henkel, H.; Aaro, S. Geophysical investigations of the Siljan impact structure—A short review. In Impact Tectonics; Koeberl, C., Henkel, H., Eds.; Springer: Berlin/Heidelberg, Germany, 2005; pp. 247–284. [Google Scholar]
- Jourdan, F.; Reimold, W.U.; Deutsch, A. Dating terrestrial impact structures. Elements 2012, 8, 49–53. [Google Scholar] [CrossRef]
- Andersson, U.B.; Gorbatschev, R.; Nyström, J.-O.; Wikström, A.; Sjöström, H.; Bergman, S.; Ahl, M.; Mansfeld, J.; Wahlgren, C.-H.; Stephens, M.B.; et al. The Transscandinavian Igneous Belt (TIB) in Sweden: A review of its character and evolution. In Geological Survey of Finland, Special Paper 37; Högdahl, K., Andersson, U.B., Eklund, O., Eds.; Vammalan Kirjapaino Oy: Espoo, Finland, 2004; p. 123. [Google Scholar]
- Pisarevsky, S.A.; Bylund, G. Palaeomagnetism of 935 Ma mafic dykes in southern Sweden and implications for the Sveconorwegian Loop. Geophys. J. Int. 2006, 166, 1095–1104. [Google Scholar] [CrossRef] [Green Version]
- Tullborg, E.L.; Larsson, S.A.; Bjoerklund, L.; Stigh, J.; Samuelsson, L. Thermal Evidence of Caledonide Foreland, Molasse Sedimentation in Fennoscandia; Technical Report: SKB-TR--95-18; Swedish Nuclear Fuel and Waste Management Co.: Stockholm, Sweden, 1995; p. 46. Available online: https://inis.iaea.org/search/search.aspx?orig_q=RN:27031097 (accessed on 28 December 2019).
- Holm, S.; Alwmark, C.; Alvarez, W.; Schmitz, B. Shock barometry of the Siljan impact structure, Sweden. Meteorit. Planet. Sci. 2011, 46, 1888–1909. [Google Scholar] [CrossRef]
- Högström, A.E.S.; Sturkell, E.; Ebbestad, J.O.R.; Lindström, M.; Ormö, J. Concentric impact structures in the Palaeozoic of Sweden—The Lockne and Siljan craters. J. Geol. Soc. Swed. 2010, 132, 65–70. [Google Scholar]
- Calner, M.; Lehnert, O.; Joachimski, M. Carbonate mud mounds, conglomerates, and sea-level history in the Katian (Upper Ordovician) of central Sweden. Facies 2010, 56, 157–172. [Google Scholar] [CrossRef]
- Clive, A. The presence of oil within the Ordovician limestone mounds of the Siljan district, central Sweden. In Bulletin of the Geological Institutions; University of Uppsala: Uppsala, Sweden, 1980; Volume 9, pp. 1–4. [Google Scholar]
- Frost, B.R.; Frost, C.D. Essentials of Igneous and Metamorphic Petrology; Cambridge University Press: New York, NY, USA, 2011; p. 314. [Google Scholar]
- Maleev, E.F. Volcanic Rocks. Handbook; Nedra: Moscow, Russia, 1980; p. 240. (In Russian) [Google Scholar]
- Polovinkina, Y.I. Texture and Structure Igneous and Metamorphic Rocks. Part 2. Metamorhic Rocks; Nedra: Moscow, Russia, 1966; Volume 2, p. 240. (In Russian) [Google Scholar]
- Robertson, S. BGS Rock Classification Scheme. Classification of Metamorphic Rocks; British Geological Survey Research Report, RR 99-02; NERC, British Geological Survey: Keyworth, Nottingham, UK, 1999; Volume 2. [Google Scholar]
- Bergström, S.M.; Calner, M.; Lehnert, O.; Noor, A. A new upper Middle Ordovician–Lower Silurian drillcore standard succession from Borenshult in Östergötland, southern Sweden: 1. Stratigraphical review with regional comparisons. J. Geol. Soc. Swed. 2011, 133, 149–171. [Google Scholar]
- AlDahan, A.A. Alteration and mass transfer in cataclasites and mylonites in 6.6 km of granitic crust at the Siljan impact structure, central Sweden. Contr. Miner. Pet. 1990, 105, 662–676. [Google Scholar] [CrossRef]
- Krayushkin, V.A. The true origin, structure, patterns, and distribution of the world petroleum potential. Georesources 2000, 3, 14–18. [Google Scholar]
- Kröger, B.; Ebbestad, J.O.R.; Lehnert, O. Accretionary Mechanisms and Temporal Sequence of Formation of the Boda Limestone Mud-Mounds (Upper Ordovician), Siljan District, Sweden. J. Sediment. Res. 2016, 86, 363–379. [Google Scholar] [CrossRef]
- Reimold, W.U.; Kelley, S.P.; Sherlock, S.; Henkel, H.; Koeberl, C. Laser argon dating of melt breccias from the Siljan impact structure, Sweden: Implications for a possible relationship to late Devonian extinction events. Meteorit. Planet. Sci. 2005, 40, 591–607. [Google Scholar] [CrossRef]
- Drake, H.; Roberts, N.M.; Heim, C.; Whitehouse, M.J.; Siljestrom, S.; Kooijman, E.; Broman, C.; Ivarsson, M.; Astrom, M.E. Timing and origin of natural gas accumulation in the Siljan impact structure, Sweden. Nat. Commun. 2019, 10, 4736. [Google Scholar] [CrossRef] [PubMed]
- Stein, H.; Hannah, J.; Gang, Y.; Galimberti, R.; Nali, M. Ordovician Source Rocks and Devonian Oil Expulsion on Bolide Impact at Siljan Sweden—The Re-Os Story. In Proceedings of the International Petroleum Technology Conference, Doha, Qatar, 19–22 January 2014. [Google Scholar] [CrossRef]
Figure 1.
Simplified geological map of the Siljan Ring structure, showing the locations of “IGRENE” drill sites.
Figure 1.
Simplified geological map of the Siljan Ring structure, showing the locations of “IGRENE” drill sites.
Figure 2.
Combined stratigraphic diagram of the Ordovician sedimentary succession in the Siljan District (modified from Ebbestad and Högström 2007 [
1]) and lithostratigraphic columns of the Mora 1 and Solberga 1 core sections (according to data from Lehnert et al., 2012 [
14]).
Figure 2.
Combined stratigraphic diagram of the Ordovician sedimentary succession in the Siljan District (modified from Ebbestad and Högström 2007 [
1]) and lithostratigraphic columns of the Mora 1 and Solberga 1 core sections (according to data from Lehnert et al., 2012 [
14]).
Figure 3.
Basement Interval.
Figure 3.
Basement Interval.
Figure 4.
Rock samples from the lower part of the basement interval: (a,d,g) sample photos; thin section photos (b,e,h) in plane-polarized light; (c,f,i) with crossed polars (magnification 10×).
Figure 4.
Rock samples from the lower part of the basement interval: (a,d,g) sample photos; thin section photos (b,e,h) in plane-polarized light; (c,f,i) with crossed polars (magnification 10×).
Figure 5.
The rock samples from the upper part of the basement interval: (a,d,g) sample photos; thin section photos (b,e,h) in plane-polarized light; (c,f,i) with crossed polars (magnification 10×, i—2.5×).
Figure 5.
The rock samples from the upper part of the basement interval: (a,d,g) sample photos; thin section photos (b,e,h) in plane-polarized light; (c,f,i) with crossed polars (magnification 10×, i—2.5×).
Figure 6.
Sedimentary Cover Interval with suggested lithostratigraphy.
Figure 6.
Sedimentary Cover Interval with suggested lithostratigraphy.
Figure 7.
Rock samples from the sedimentary cover interval: (a,c,e) sample photos; (b,d,f) thin section photos in plane-polarized light (magnification 2.5×).
Figure 7.
Rock samples from the sedimentary cover interval: (a,c,e) sample photos; (b,d,f) thin section photos in plane-polarized light (magnification 2.5×).
Figure 8.
Sharp contact between the basement and sedimentary rocks (1). Shift along the fracture in the wackestones (2). Depth interval 401.00–406.79 m. Core photo.
Figure 8.
Sharp contact between the basement and sedimentary rocks (1). Shift along the fracture in the wackestones (2). Depth interval 401.00–406.79 m. Core photo.
Figure 9.
Core photo. Depth interval 395.20–401.00 m (5th unit): (a) sharp contact between black shale and wackestone layers; slump structures in the wackestones. Depth interval 365.65–377.50 m (6–7th unit): (b) gradational contact between black shale and wackestone layers (red box); transition from greenish-gray to reddish wackestones (red arrow).
Figure 10.
Extension fracture in limestone. Sample photo—left. Three stage of fracture filling: with calcite (a,b) and anhydrite (c). Photo of the thin section in plane-polarized light—middle and crossed polars—right. Sample depth 333.23 m (8th unit).
Figure 10.
Extension fracture in limestone. Sample photo—left. Three stage of fracture filling: with calcite (a,b) and anhydrite (c). Photo of the thin section in plane-polarized light—middle and crossed polars—right. Sample depth 333.23 m (8th unit).
Figure 11.
Clay-carbonate tectonic breccia at the upper boundary of the black shale units. Core photo—left. Sample photo—right. Sample depth 323.89 m (8th unit).
Figure 11.
Clay-carbonate tectonic breccia at the upper boundary of the black shale units. Core photo—left. Sample photo—right. Sample depth 323.89 m (8th unit).
Figure 12.
(a) Calcareous mudstone. Sample photo. (b) Silt-pelitic texture. Thin section photo (plane-polarized light). Sample depth 203.85 m (10th unit).
Figure 12.
(a) Calcareous mudstone. Sample photo. (b) Silt-pelitic texture. Thin section photo (plane-polarized light). Sample depth 203.85 m (10th unit).
Figure 13.
Transition from greenish-gray and reddish clayey limestone to light-gray sandstones. Core photo. Depth interval 32.60–44.70 m.
Figure 13.
Transition from greenish-gray and reddish clayey limestone to light-gray sandstones. Core photo. Depth interval 32.60–44.70 m.
Figure 14.
Sample photos. (a) Albite-quartz metasiltstone. Near vertical and steeply inclined fractures filled with calcite. Sample depth 575.95 m (1st unit). (b) Clayey limestone. Network of fine fractures. Sample depth 381.14 m (5th unit).
Figure 14.
Sample photos. (a) Albite-quartz metasiltstone. Near vertical and steeply inclined fractures filled with calcite. Sample depth 575.95 m (1st unit). (b) Clayey limestone. Network of fine fractures. Sample depth 381.14 m (5th unit).
Figure 15.
Albite-quartz metasiltstone. Photo of the thin section in plane-polarized light (a) and crossed polars (b). Three generations of fractures with: 1—quartz filling, 2—calcite, 3—cataclasis material. Sample depth 634.76 m (1st unit).
Figure 15.
Albite-quartz metasiltstone. Photo of the thin section in plane-polarized light (a) and crossed polars (b). Three generations of fractures with: 1—quartz filling, 2—calcite, 3—cataclasis material. Sample depth 634.76 m (1st unit).
Figure 16.
Wackestones. Photo of the thin section in plane-polarized light. (a) Individual fracture with clay filling. Sample depth 383.93 m (5th unit). (b) Cataclastic zone with clay-carbonate filling. Sample depth 396.66 m (5th unit).
Figure 16.
Wackestones. Photo of the thin section in plane-polarized light. (a) Individual fracture with clay filling. Sample depth 383.93 m (5th unit). (b) Cataclastic zone with clay-carbonate filling. Sample depth 396.66 m (5th unit).
Figure 17.
Displacement along the direction of third generation fractures. Photo of the thin section in plane-polarized light. (a) Sericite-quartz metatuffstone. Sample depth 456.70 m (4th unit). (b) Wackestone. Sample depth 396.66 m (5th unit).
Figure 17.
Displacement along the direction of third generation fractures. Photo of the thin section in plane-polarized light. (a) Sericite-quartz metatuffstone. Sample depth 456.70 m (4th unit). (b) Wackestone. Sample depth 396.66 m (5th unit).
Figure 18.
Clayey limestone. Photo of the thin section in plane-polarized light. Bituminous filling: (a) in the cataclastic zones, (b) in the vug with calcite mineralization. Sample depth 381.14 m (5th unit).
Figure 18.
Clayey limestone. Photo of the thin section in plane-polarized light. Bituminous filling: (a) in the cataclastic zones, (b) in the vug with calcite mineralization. Sample depth 381.14 m (5th unit).
Figure 19.
Microporosity in the cataclase zone developed along the fracture. Photo of the thin section: (a) in plane-polarized light: (b) with crossed polars: (c–f) SEM images with different magnification. Sample depth 531.67 m (3rd unit).
Figure 19.
Microporosity in the cataclase zone developed along the fracture. Photo of the thin section: (a) in plane-polarized light: (b) with crossed polars: (c–f) SEM images with different magnification. Sample depth 531.67 m (3rd unit).
Figure 20.
Image analysis of the sericite-albite-quartz silty metasandstone: (
a) sample photo; (
b) macrocomponent areas (a color chart is shown in
Table 5). Sample depth 531.67 m (3rd unit).
Figure 20.
Image analysis of the sericite-albite-quartz silty metasandstone: (
a) sample photo; (
b) macrocomponent areas (a color chart is shown in
Table 5). Sample depth 531.67 m (3rd unit).
| Publisher’s Note: MDPI stays neutral with regard to jurisdictional claims in published maps and institutional affiliations. |
© 2021 by the authors. Licensee MDPI, Basel, Switzerland. This article is an open access article distributed under the terms and conditions of the Creative Commons Attribution (CC BY) license (https://creativecommons.org/licenses/by/4.0/).


 ,
, 


